# Table of Contents
- [Better Stack - 30x cheaper than Datadog, Exceptional support](#better-stack-30x-cheaper-than-datadog-exceptional-support)
- [Infrastructure monitoring by Better Stack](#infrastructure-monitoring-by-better-stack)
- [Website Monitoring | Better Stack](#website-monitoring-better-stack)
- [AI-native Incident Management with On-call and Slack | Better Stack](#ai-native-incident-management-with-on-call-and-slack-better-stack)
- [Free Status Page | Better Stack](#free-status-page-better-stack)
- [Free StatusPage.io alternative | Better Stack](#free-statuspage-io-alternative-better-stack)
- [Real user monitoring by Better Stack](#real-user-monitoring-by-better-stack)
- [Modern Pagerduty alternative | Better Stack](#modern-pagerduty-alternative-better-stack)
- [Modern StatusCake alternative | Better Stack](#modern-statuscake-alternative-better-stack)
- [Intuitive Opsgenie alternative | Better Stack](#intuitive-opsgenie-alternative-better-stack)
- [Intuitive VictorOps alternative | Better Stack](#intuitive-victorops-alternative-better-stack)
- [Engineering at Better Stack | Better Stack](#engineering-at-better-stack-better-stack)
- [AI SRE agent for on-call | Better Stack](#ai-sre-agent-for-on-call-better-stack)
- [OpenTelemetry-native log management by Better Stack](#opentelemetry-native-log-management-by-better-stack)
- [Help & Support | Better Stack](#help-support-better-stack)
- [Reliable Uptime Robot alternative | Better Stack](#reliable-uptime-robot-alternative-better-stack)
- [AWS ELB dashboard template | Better Stack](#aws-elb-dashboard-template-better-stack)
- [AWS CloudFront dashboard template | Better Stack](#aws-cloudfront-dashboard-template-better-stack)
- [AWS SNS & SQS dashboard template | Better Stack](#aws-sns-sqs-dashboard-template-better-stack)
- [Free Pingdom alternative | Better Stack](#free-pingdom-alternative-better-stack)
- [AWS ElastiCache Memcached dashboard template | Better Stack](#aws-elasticache-memcached-dashboard-template-better-stack)
- [AWS DynamoDB dashboard template | Better Stack](#aws-dynamodb-dashboard-template-better-stack)
- [Open positions | Better Stack](#open-positions-better-stack)
- [AWS S3 dashboard template | Better Stack](#aws-s3-dashboard-template-better-stack)
- [GCP Compute Engine dashboard template | Better Stack](#gcp-compute-engine-dashboard-template-better-stack)
- [AWS Lambda dashboard template | Better Stack](#aws-lambda-dashboard-template-better-stack)
- [AWS RDS MySQL dashboard template | Better Stack](#aws-rds-mysql-dashboard-template-better-stack)
- [Better Stack Collector dashboard template | Better Stack](#better-stack-collector-dashboard-template-better-stack)
- [Time series data warehouse as an API | Better Stack](#time-series-data-warehouse-as-an-api-better-stack)
- [Cloudflare Worker Trace Events dashboard template | Better Stack](#cloudflare-worker-trace-events-dashboard-template-better-stack)
- [GCP Cloud SQL dashboard template | Better Stack](#gcp-cloud-sql-dashboard-template-better-stack)
- [GCP Cloud Spanner dashboard template | Better Stack](#gcp-cloud-spanner-dashboard-template-better-stack)
- [GCP Cloud Functions dashboard template | Better Stack](#gcp-cloud-functions-dashboard-template-better-stack)
- [GCP Cloud Storage dashboard template | Better Stack](#gcp-cloud-storage-dashboard-template-better-stack)
- [GCP Pub/Sub dashboard template | Better Stack](#gcp-pub-sub-dashboard-template-better-stack)
- [GCP BigQuery dashboard template | Better Stack](#gcp-bigquery-dashboard-template-better-stack)
- [AWS RDS Aurora PostgreSQL dashboard template | Better Stack](#aws-rds-aurora-postgresql-dashboard-template-better-stack)
- [GCP Load Balancing dashboard template | Better Stack](#gcp-load-balancing-dashboard-template-better-stack)
- [AWS RDS Enhanced Monitoring dashboard template | Better Stack](#aws-rds-enhanced-monitoring-dashboard-template-better-stack)
- [AWS ECS dashboard template | Better Stack](#aws-ecs-dashboard-template-better-stack)
- [Cloudflare HTTP Requests dashboard template | Better Stack](#cloudflare-http-requests-dashboard-template-better-stack)
- [Redis dashboard template | Better Stack](#redis-dashboard-template-better-stack)
- [Vercel dashboard template | Better Stack](#vercel-dashboard-template-better-stack)
- [Cloudflare HTTP Requests dashboard template | Better Stack](#cloudflare-http-requests-dashboard-template-better-stack)
- [Host (Datadog) dashboard template | Better Stack](#host-datadog-dashboard-template-better-stack)
- [Careers | Better Stack](#careers-better-stack)
- [Tracing dashboard template | Better Stack](#tracing-dashboard-template-better-stack)
- [Docker dashboard template | Better Stack](#docker-dashboard-template-better-stack)
- [OpenTelemetry collector dashboard template | Better Stack](#opentelemetry-collector-dashboard-template-better-stack)
- [Kubernetes dashboard template | Better Stack](#kubernetes-dashboard-template-better-stack)
- [Heroku dashboard template | Better Stack](#heroku-dashboard-template-better-stack)
- [Host (Prometheus) dashboard template | Better Stack](#host-prometheus-dashboard-template-better-stack)
- [Ruby on Rails dashboard template | Better Stack](#ruby-on-rails-dashboard-template-better-stack)
- [PostgreSQL dashboard template | Better Stack](#postgresql-dashboard-template-better-stack)
- [Traefik dashboard template | Better Stack](#traefik-dashboard-template-better-stack)
- [MinIO dashboard template | Better Stack](#minio-dashboard-template-better-stack)
- [Vector dashboard template | Better Stack](#vector-dashboard-template-better-stack)
- [MySQL dashboard template | Better Stack](#mysql-dashboard-template-better-stack)
- [HAProxy dashboard template | Better Stack](#haproxy-dashboard-template-better-stack)
- [Host (Vector) dashboard template | Better Stack](#host-vector-dashboard-template-better-stack)
- [Kafka dashboard template | Better Stack](#kafka-dashboard-template-better-stack)
- [Host overview dashboard template | Better Stack](#host-overview-dashboard-template-better-stack)
- [Uptime Monitoring by Better Stack](#uptime-monitoring-by-better-stack)
- [Website analytics dashboard template | Better Stack](#website-analytics-dashboard-template-better-stack)
- [Web vitals dashboard template | Better Stack](#web-vitals-dashboard-template-better-stack)
- [AWS EC2 dashboard template | Better Stack](#aws-ec2-dashboard-template-better-stack)
- [AWS ElastiCache Redis dashboard template | Better Stack](#aws-elasticache-redis-dashboard-template-better-stack)
- [AWS RDS PostgreSQL dashboard template | Better Stack](#aws-rds-postgresql-dashboard-template-better-stack)
- [Hosts dashboard template | Better Stack](#hosts-dashboard-template-better-stack)
- [Apache dashboard template | Better Stack](#apache-dashboard-template-better-stack)
- [GCP Cloud Run dashboard template | Better Stack](#gcp-cloud-run-dashboard-template-better-stack)
- [Nginx dashboard template | Better Stack](#nginx-dashboard-template-better-stack)
- [Cloudflare Prometheus Exporter dashboard template | Better Stack](#cloudflare-prometheus-exporter-dashboard-template-better-stack)
- [Pricing | Better Stack](#pricing-better-stack)
- [Memcached dashboard template | Better Stack](#memcached-dashboard-template-better-stack)
- [Elasticsearch dashboard template | Better Stack](#elasticsearch-dashboard-template-better-stack)
- [RabbitMQ dashboard template | Better Stack](#rabbitmq-dashboard-template-better-stack)
- [Uptime API and Terraform | Demos](#uptime-api-and-terraform-demos)
- [Uptime reporting | Demos](#uptime-reporting-demos)
- [Bulk importing monitors | Better Stack Documentation](#bulk-importing-monitors-better-stack-documentation)
- [Services dashboard template | Better Stack](#services-dashboard-template-better-stack)
- [On-call and escalations | Demos](#on-call-and-escalations-demos)
- [Slack | Better Stack Documentation](#slack-better-stack-documentation)
- [Microsoft Teams | Better Stack Documentation](#microsoft-teams-better-stack-documentation)
- [Cache busting in monitoring | Better Stack Documentation](#cache-busting-in-monitoring-better-stack-documentation)
- [Shutting down Grafana | Better Stack Documentation](#shutting-down-grafana-better-stack-documentation)
- [Linear | Better Stack Documentation](#linear-better-stack-documentation)
- [Uploading source maps | Better Stack Documentation](#uploading-source-maps-better-stack-documentation)
- [Grouping and ordering monitors | Better Stack Documentation](#grouping-and-ordering-monitors-better-stack-documentation)
- [iOS & Android mobile apps | Better Stack Documentation](#ios-android-mobile-apps-better-stack-documentation)
- [Live tail | Better Stack Documentation](#live-tail-better-stack-documentation)
- [Update on-call schedule event | Better Stack Documentation](#update-on-call-schedule-event-better-stack-documentation)
- [Monitors | Demos](#monitors-demos)
- [Remove on-call schedule event | Better Stack Documentation](#remove-on-call-schedule-event-better-stack-documentation)
- [Uptime integrations | Demos](#uptime-integrations-demos)
- [Update status page resource | Better Stack Documentation](#update-status-page-resource-better-stack-documentation)
- [Response attributes | Better Stack Documentation](#response-attributes-better-stack-documentation)
- [Pausing monitors and maintenances | Better Stack Documentation](#pausing-monitors-and-maintenances-better-stack-documentation)
- [Remove a team member from team by ID | Better Stack Documentation](#remove-a-team-member-from-team-by-id-better-stack-documentation)
- [Alerts | Better Stack Documentation](#alerts-better-stack-documentation)
- [Heartbeats (Cron monitoring) | Demos](#heartbeats-cron-monitoring-demos)
- [Acknowledge an incident | Better Stack Documentation](#acknowledge-an-incident-better-stack-documentation)
- [Remove an application | Better Stack Documentation](#remove-an-application-better-stack-documentation)
- [Sentry SDK | Better Stack Documentation](#sentry-sdk-better-stack-documentation)
- [Ready-made dashboards | Better Stack](#ready-made-dashboards-better-stack)
- [Get status page resource | Better Stack Documentation](#get-status-page-resource-better-stack-documentation)
- [Confirmation and recovery period | Better Stack Documentation](#confirmation-and-recovery-period-better-stack-documentation)
- [Update an exploration alert | Better Stack Documentation](#update-an-exploration-alert-better-stack-documentation)
- [Remove a group | Better Stack Documentation](#remove-a-group-better-stack-documentation)
- [Getting started with Warehouse API | Better Stack Documentation](#getting-started-with-warehouse-api-better-stack-documentation)
- [Removing monitors | Better Stack Documentation](#removing-monitors-better-stack-documentation)
- [Vercel Better Stack integration | Better Stack Documentation](#vercel-better-stack-integration-better-stack-documentation)
- [Explore demos | Demos](#explore-demos-demos)
- [Get a single group | Better Stack Documentation](#get-a-single-group-better-stack-documentation)
- [AI SRE & MCP server | Demos](#ai-sre-mcp-server-demos)
- [Create comment | Better Stack Documentation](#create-comment-better-stack-documentation)
- [SSL certificate checks | Better Stack Documentation](#ssl-certificate-checks-better-stack-documentation)
- [Github badge | Better Stack Documentation](#github-badge-better-stack-documentation)
- [Create a group | Better Stack Documentation](#create-a-group-better-stack-documentation)
- [Hosting data in your own bucket | Better Stack Documentation](#hosting-data-in-your-own-bucket-better-stack-documentation)
- [Response attributes | Better Stack Documentation](#response-attributes-better-stack-documentation)
- [Remove a connection | Better Stack Documentation](#remove-a-connection-better-stack-documentation)
- [Locations and regions | Better Stack Documentation](#locations-and-regions-better-stack-documentation)
- [Create a backup on-call schedule | Better Stack Documentation](#create-a-backup-on-call-schedule-better-stack-documentation)
- [Create a warehouse source group | Better Stack Documentation](#create-a-warehouse-source-group-better-stack-documentation)
- [Pagination of API lists | Better Stack Documentation](#pagination-of-api-lists-better-stack-documentation)
- [Remove a time series | Better Stack Documentation](#remove-a-time-series-better-stack-documentation)
- [Reporting | Better Stack Documentation](#reporting-better-stack-documentation)
- [Getting started | Better Stack Documentation](#getting-started-better-stack-documentation)
- [List escalation policies | Better Stack Documentation](#list-escalation-policies-better-stack-documentation)
- [Resolving an incident | Better Stack Documentation](#resolving-an-incident-better-stack-documentation)
- [Acknowledging an incident | Better Stack Documentation](#acknowledging-an-incident-better-stack-documentation)
- [Get a single warehouse source | Better Stack Documentation](#get-a-single-warehouse-source-better-stack-documentation)
- [Create a time series | Better Stack Documentation](#create-a-time-series-better-stack-documentation)
- [Get comment | Better Stack Documentation](#get-comment-better-stack-documentation)
- [Update a metric | Better Stack Documentation](#update-a-metric-better-stack-documentation)
- [Remove an exploration | Better Stack Documentation](#remove-an-exploration-better-stack-documentation)
- [Incident details | Better Stack Documentation](#incident-details-better-stack-documentation)
- [DNS monitor | Better Stack Documentation](#dns-monitor-better-stack-documentation)
- [Domain expiration checks | Better Stack Documentation](#domain-expiration-checks-better-stack-documentation)
- [Request timeout | Better Stack Documentation](#request-timeout-better-stack-documentation)
- [Remove an exploration group | Better Stack Documentation](#remove-an-exploration-group-better-stack-documentation)
- [Embeddable status badge | Better Stack Documentation](#embeddable-status-badge-better-stack-documentation)
- [Get started with status pages | Better Stack Documentation](#get-started-with-status-pages-better-stack-documentation)
- [Ingesting metrics | Better Stack Documentation](#ingesting-metrics-better-stack-documentation)
- [Update a warehouse source group | Better Stack Documentation](#update-a-warehouse-source-group-better-stack-documentation)
- [Managing runbooks | Better Stack Documentation](#managing-runbooks-better-stack-documentation)
- [Get a heartbeat's availability summary | Better Stack Documentation](#get-a-heartbeat-s-availability-summary-better-stack-documentation)
- [List Prometheus integrations | Better Stack Documentation](#list-prometheus-integrations-better-stack-documentation)
- [Update Azure integration | Better Stack Documentation](#update-azure-integration-better-stack-documentation)
- [Simplified PromQL | Better Stack Documentation](#simplified-promql-better-stack-documentation)
- [Domain expiration monitor | Better Stack Documentation](#domain-expiration-monitor-better-stack-documentation)
- [SSL certificate monitor | Better Stack Documentation](#ssl-certificate-monitor-better-stack-documentation)
- [Check frequency | Better Stack Documentation](#check-frequency-better-stack-documentation)
- [Get started with Telemetry API | Better Stack Documentation](#get-started-with-telemetry-api-better-stack-documentation)
- [Get a single warehouse source group | Better Stack Documentation](#get-a-single-warehouse-source-group-better-stack-documentation)
- [Request parameters, headers and HTTP authentication | Better Stack Documentation](#request-parameters-headers-and-http-authentication-better-stack-documentation)
- [Create outgoing webhook | Better Stack Documentation](#create-outgoing-webhook-better-stack-documentation)
- [Playwright monitor | Better Stack Documentation](#playwright-monitor-better-stack-documentation)
- [Better Stack MinIO metrics | Better Stack Documentation](#better-stack-minio-metrics-better-stack-documentation)
- [Commenting on incidents | Better Stack Documentation](#commenting-on-incidents-better-stack-documentation)
- [Get a single heartbeat | Better Stack Documentation](#get-a-single-heartbeat-better-stack-documentation)
- [Better Stack Java logging | Better Stack Documentation](#better-stack-java-logging-better-stack-documentation)
- [Create incidents manually | Better Stack Documentation](#create-incidents-manually-better-stack-documentation)
- [Get monitor | Better Stack Documentation](#get-monitor-better-stack-documentation)
- [Remove Datadog integration | Better Stack Documentation](#remove-datadog-integration-better-stack-documentation)
- [Remove a source group | Better Stack Documentation](#remove-a-source-group-better-stack-documentation)
- [Widget types | Better Stack Documentation](#widget-types-better-stack-documentation)
- [Status announcement | Better Stack Documentation](#status-announcement-better-stack-documentation)
- [Update AWS CloudWatch integration | Better Stack Documentation](#update-aws-cloudwatch-integration-better-stack-documentation)
- [List all metrics | Better Stack Documentation](#list-all-metrics-better-stack-documentation)
- [Better Stack Traefik logging | Better Stack Documentation](#better-stack-traefik-logging-better-stack-documentation)
- [Remove status page resource | Better Stack Documentation](#remove-status-page-resource-better-stack-documentation)
- [List all alerts in a dashboard | Better Stack Documentation](#list-all-alerts-in-a-dashboard-better-stack-documentation)
- [Send logs to Better Stack with syslog-ng | Better Stack Documentation](#send-logs-to-better-stack-with-syslog-ng-better-stack-documentation)
- [Create Google Monitoring integration | Better Stack Documentation](#create-google-monitoring-integration-better-stack-documentation)
- [Response attributes | Better Stack Documentation](#response-attributes-better-stack-documentation)
- [Create severity group | Better Stack Documentation](#create-severity-group-better-stack-documentation)
- [Email subscriptions | Better Stack Documentation](#email-subscriptions-better-stack-documentation)
- [Better Stack Elasticsearch logging | Better Stack Documentation](#better-stack-elasticsearch-logging-better-stack-documentation)
- [Response attributes | Better Stack Documentation](#response-attributes-better-stack-documentation)
- [Better Stack RabbitMQ logging | Better Stack Documentation](#better-stack-rabbitmq-logging-better-stack-documentation)
- [Get a single exploration alert | Better Stack Documentation](#get-a-single-exploration-alert-better-stack-documentation)
- [Get status page report | Better Stack Documentation](#get-status-page-report-better-stack-documentation)
- [Update status page report | Better Stack Documentation](#update-status-page-report-better-stack-documentation)
- [Get AWS CloudWatch integration | Better Stack Documentation](#get-aws-cloudwatch-integration-better-stack-documentation)
- [Update Grafana integration | Better Stack Documentation](#update-grafana-integration-better-stack-documentation)
- [Response attributes | Better Stack Documentation](#response-attributes-better-stack-documentation)
- [Remove severity | Better Stack Documentation](#remove-severity-better-stack-documentation)
- [Get a single dashboard | Better Stack Documentation](#get-a-single-dashboard-better-stack-documentation)
- [Remove Grafana integration | Better Stack Documentation](#remove-grafana-integration-better-stack-documentation)
- [Remove Prometheus integration | Better Stack Documentation](#remove-prometheus-integration-better-stack-documentation)
- [Create an incident | Better Stack Documentation](#create-an-incident-better-stack-documentation)
- [Create status page report | Better Stack Documentation](#create-status-page-report-better-stack-documentation)
- [List status page reports | Better Stack Documentation](#list-status-page-reports-better-stack-documentation)
- [Batch create catalog records | Better Stack Documentation](#batch-create-catalog-records-better-stack-documentation)
- [Update a dashboard | Better Stack Documentation](#update-a-dashboard-better-stack-documentation)
- [Variables in SQL queries | Better Stack Documentation](#variables-in-sql-queries-better-stack-documentation)
- [Response attributes | Better Stack Documentation](#response-attributes-better-stack-documentation)
- [Create Datadog integration | Better Stack Documentation](#create-datadog-integration-better-stack-documentation)
- [Get outgoing webhook | Better Stack Documentation](#get-outgoing-webhook-better-stack-documentation)
- [Get Azure integration | Better Stack Documentation](#get-azure-integration-better-stack-documentation)
- [Update incoming webhook | Better Stack Documentation](#update-incoming-webhook-better-stack-documentation)
- [Create AWS CloudWatch integration | Better Stack Documentation](#create-aws-cloudwatch-integration-better-stack-documentation)
- [Create New Relic integration | Better Stack Documentation](#create-new-relic-integration-better-stack-documentation)
- [Get New Relic integration | Better Stack Documentation](#get-new-relic-integration-better-stack-documentation)
- [Get Datadog integration | Better Stack Documentation](#get-datadog-integration-better-stack-documentation)
- [Response attributes | Better Stack Documentation](#response-attributes-better-stack-documentation)
- [JavaScript quick start guide | Better Stack Documentation](#javascript-quick-start-guide-better-stack-documentation)
- [List PagerDuty integrations | Better Stack Documentation](#list-pagerduty-integrations-better-stack-documentation)
- [Get Prometheus integration | Better Stack Documentation](#get-prometheus-integration-better-stack-documentation)
- [Remove outgoing webhook | Better Stack Documentation](#remove-outgoing-webhook-better-stack-documentation)
- [Create Elastic integration | Better Stack Documentation](#create-elastic-integration-better-stack-documentation)
- [Better Stack Erlang logging | Better Stack Documentation](#better-stack-erlang-logging-better-stack-documentation)
- [Better Stack Cloudflare HTTP requests logging | Better Stack Documentation](#better-stack-cloudflare-http-requests-logging-better-stack-documentation)
- [List outgoing webhooks | Better Stack Documentation](#list-outgoing-webhooks-better-stack-documentation)
- [List Datadog integrations | Better Stack Documentation](#list-datadog-integrations-better-stack-documentation)
- [List catalog attributes | Better Stack Documentation](#list-catalog-attributes-better-stack-documentation)
- [Get catalog attribute | Better Stack Documentation](#get-catalog-attribute-better-stack-documentation)
- [List Elastic integrations | Better Stack Documentation](#list-elastic-integrations-better-stack-documentation)
- [List Grafana integrations | Better Stack Documentation](#list-grafana-integrations-better-stack-documentation)
- [JavaScript advanced usage | Better Stack Documentation](#javascript-advanced-usage-better-stack-documentation)
- [Update outgoing webhook | Better Stack Documentation](#update-outgoing-webhook-better-stack-documentation)
- [Logtail Bunyan stream | Better Stack Documentation](#logtail-bunyan-stream-better-stack-documentation)
- [List Azure integrations | Better Stack Documentation](#list-azure-integrations-better-stack-documentation)
- [Update Google Monitoring integration | Better Stack Documentation](#update-google-monitoring-integration-better-stack-documentation)
- [Get Google Monitoring integration | Better Stack Documentation](#get-google-monitoring-integration-better-stack-documentation)
- [Update Datadog integration | Better Stack Documentation](#update-datadog-integration-better-stack-documentation)
---
# Better Stack - 30x cheaper than Datadog, Exceptional support

The AI SRE
observability stack
================================
30x cheaper than Datadog. Predictable pricing.
Exceptional customer support.
Start for free
Datadog bill too high? Migrate today, the rest of your contract is on us.
Migration assistance and bespoke onboarding included. [Book a consultation](https://calendly.com/betterstack/consultation-migrating-from-datadog)
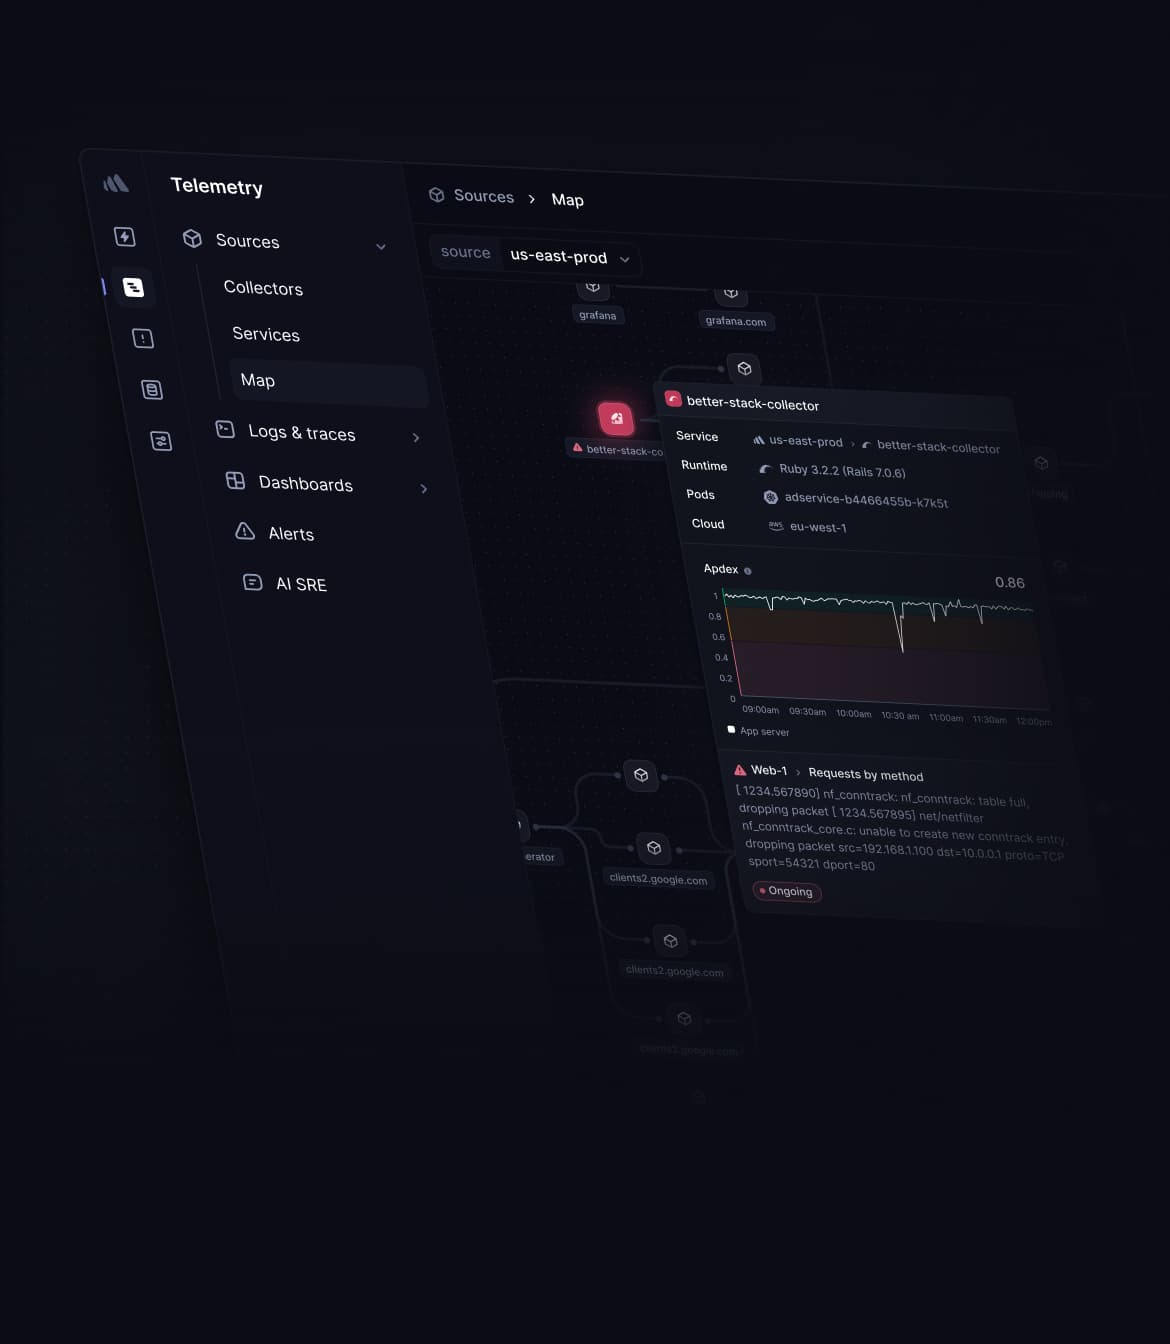 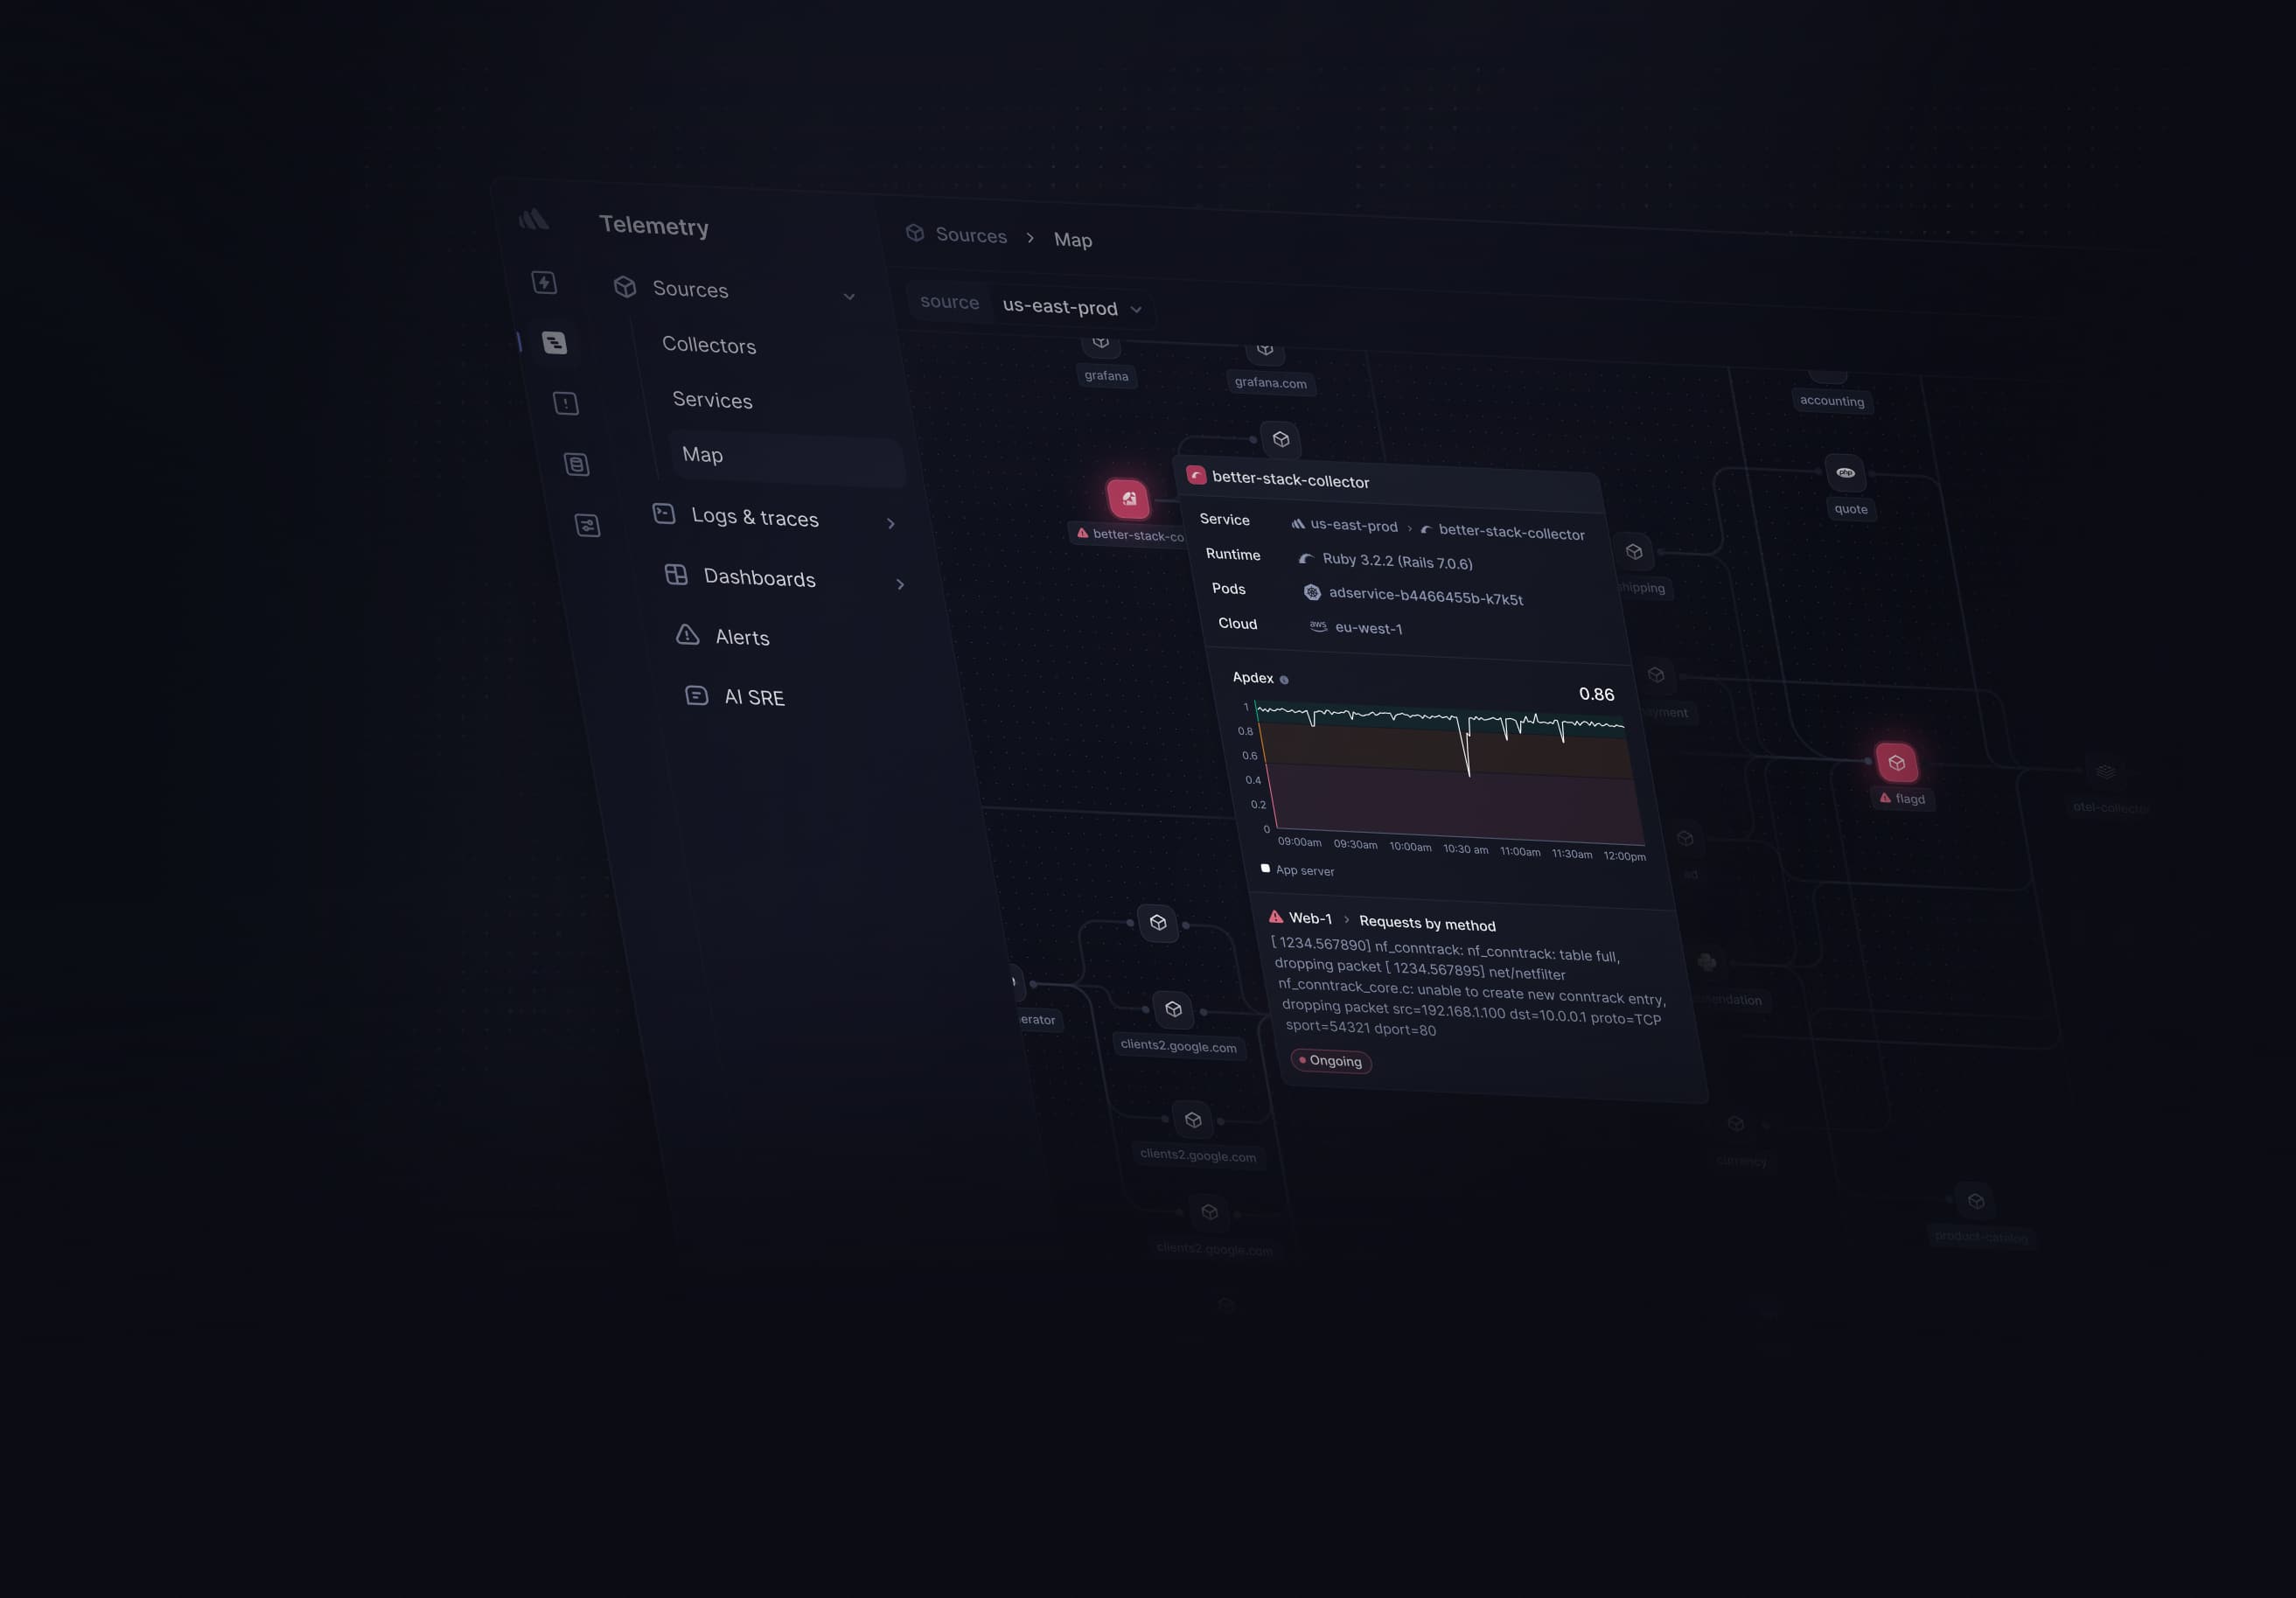                
[eBPF-based service map](https://betterstack.com/tracing)
[Log management](https://betterstack.com/log-management)
[OpenTelemetry-native tracing](https://betterstack.com/tracing#otel)
[Infrastructure monitoring](https://betterstack.com/infrastructure-monitoring)
[AI-native error tracking](https://betterstack.com/error-tracking)
[Incident management](https://betterstack.com/incident-management)
[Status page](https://betterstack.com/status-page)
[Agentic AI SRE](https://betterstack.com/tracing#sre)
[Resolve incidents in Slack or Teams](https://betterstack.com/incident-management#slack)
* * *
At a fraction of
your current costs
-------------------------------------
Get an unrivaled price-to-performance ratio. Forget sampling and ingest all your data or decrease your costs by 80x.
[Explore pricing](https://betterstack.com/pricing#logs)
Ingest up to
80x more data
with the same budget
or save up to
98%
of your costs
1 TB traces per month
1 TB logs per month
1 TB metrics per month
Datadog
approx. $55,574 per month
Better Stack
$687 per month
An estimate only. Assumes annual payments, European data location, 1 responder with a Tera bundle, the average event size of 1 kB, $5 per 100 Datadog's "custom metrics". Assumes 1,000 Datadog "custom metrics" equivalent to 1 GB metrics. Further assumes Datadog's $0.1 per ingested GB of spans & logs, and $2.5/million indexed spans & logs for 30 days. Adds up to $51,200 for metrics, $2,787 for logs, and $2,787 for spans per month.
* * *
AI SRE
------
[Explore AI SRE](https://betterstack.com/ai-sre)
[\
\
### Robust MCP server\
\
Integrate your logs, metrics, traces, and errors into your existing LLM \
workflows with a top tier MCP server.](https://betterstack.com/demos/uptime-api/#mcp-server)
[\
\
### Get an AI SRE\
\
Claude Code-like UI with the knowledge of your infrastructure.](https://betterstack.com/ai-sre#agent)
[\
\
### Smart incident merging\
\
10 incidents created at the same time? Acknowledge them with a single tap and keep your phone from ringing while fixing the issue.](https://betterstack.com/incident-management#ai-features)
[\
\
### Explain with AI\
\
Analyze MTR, trace route, SSL certificates or connection errors.](https://betterstack.com/incident-management#ai-features)
[\
\
### Linear tickets suggested by AI\
\
Downtime? Create Linear tickets to fix the root cause using AI-based \
suggestions with a single tap.](https://betterstack.com/incident-management#ai-features)
[\
\
### AI written post-mortems\
\
Get an automated post-mortem based on the incident timeline and Slack.](https://betterstack.com/incident-management#ai-features)
AI SRE
------
[Explore AI SRE](https://betterstack.com/ai-sre)
[\
\
### Robust MCP server\
\
Integrate your telemetry data into your existing LLM workflows with a top tier MCP server.](https://betterstack.com/demos/uptime-api/#mcp-server)
[\
\
### Get an AI SRE\
\
Claude Code-like UI with the knowledge of your infrastructure.](https://betterstack.com/ai-sre#agent)
[\
\
### Smart incident merging\
\
10 incidents created at the same time? Acknowledge them with a single tap and keep your phone from ringing while fixing the issue.](https://betterstack.com/incident-management#ai-features)
[\
\
### Explain with AI\
\
Analyze MTR, trace route, SSL certificates or connection errors.](https://betterstack.com/incident-management#ai-features)
[\
\
### Linear tickets suggested by AI\
\
Downtime? Create Linear tickets to fix the root cause using AI-based \
suggestions with a single tap.](https://betterstack.com/incident-management#ai-features)
[\
\
### AI written post-mortems\
\
Get an automated post-mortem based on the incident timeline and Slack.](https://betterstack.com/incident-management#ai-features)
Tracing
-------
[Explore tracing](https://betterstack.com/tracing)
[\
\
### eBPF-based service map\
\
See network flows, auto-instrument databases, and track SLOs.](https://betterstack.com/tracing#otel)
[\
\
### Instrument clusters with OpenTelemetry with no code change\
\
Gather traces, logs, and metrics using eBPF and OpenTelemetry. Remotely monitor collector’s throughput and adjust sampling, compression, and batching as needed.](https://betterstack.com/tracing#ebpf)
[\
\
### Explore with "bubble up"\
\
Investigate slow requests visually with drag & drop to find root cause.](https://betterstack.com/tracing)
[\
\
### Get an AI SRE: Claude Code with the knowledge of your telemetry\
\
Leverage automated root cause analysis based on the eBPF-based service map and log analysis. A human is always in charge.](https://betterstack.com/tracing#sre)
[\
\
### Apdex and RED metrics\
\
Understand the overall health of a service in a single dashboard.](https://betterstack.com/tracing)
Tracing
-------
[Explore tracing](https://betterstack.com/tracing)
[\
\
### eBPF-based service map\
\
See network flows, auto-instrument databases, and track SLOs.](https://betterstack.com/tracing#otel)
[\
\
### Instrument clusters with OpenTelemetry with no code change\
\
Gather traces, logs, and metrics using eBPF and OpenTelemetry. Remotely monitor collector’s throughput and adjust sampling, compression, and batching as needed.](https://betterstack.com/tracing#ebpf)
[\
\
### Explore with "bubble up"\
\
Investigate slow requests visually with drag & drop to find root cause.](https://betterstack.com/tracing)
[\
\
### Get an AI SRE: Claude Code with the knowledge of your telemetry\
\
Leverage automated root cause analysis based on the eBPF-based service map and log analysis. A human is always in charge.](https://betterstack.com/tracing#sre)
[\
\
### Apdex and RED metrics\
\
Understand the overall health of a service in a single dashboard.](https://betterstack.com/tracing)
Replaces
Incident management
-------------------
[Explore incident management](https://betterstack.com/incident-management)
[\
\
### Slack-based incident management\
\
Get the right team members involved with powerful templated workflows directly in Slack and decrease your MTTR.](https://betterstack.com/incident-management)
[\
\
### Smart incident merging\
\
10 incidents created at the same time? Acknowledge them with a single tap and keep your phone from ringing while fixing the issue.](https://betterstack.com/docs/uptime/incident-grouping/)
[\
\
### AI post-mortems\
\
Learn from every incident instead of manually rewriting what happened.](https://betterstack.com/incident-management#ai-post-mortems)
Incident management
-------------------
[Explore incident management](https://betterstack.com/incident-management)
[\
\
### Slack-based incident management\
\
Get the right team members involved with powerful templated workflows directly in Slack and decrease your MTTR.](https://betterstack.com/incident-management)
[\
\
### Smart incident merging\
\
10 incidents created at the same time? Acknowledge them with a single tap and keep your phone from ringing while fixing the issue.](https://betterstack.com/docs/uptime/incident-grouping/)
[\
\
### AI post-mortems\
\
Learn from every incident instead of manually rewriting what happened.](https://betterstack.com/incident-management#ai-post-mortems)
Replaces
Uptime monitoring
-----------------
[Explore uptime monitoring](https://betterstack.com/uptime)
[\
\
### Screenshots for errors\
\
We record the API errors and take a screenshot of your app being down.](https://betterstack.com/uptime#uptime-monitoring)
[\
\
### Traceroute & MTR for timeouts\
\
Understand connection timeouts and request timeouts with edge-based traceroute and MTR outputs.](https://betterstack.com/uptime#uptime-monitoring)
[\
\
### Playwright-based transaction checks\
\
Run tests with a real Chrome browser instance with a JavaScript runtime.](https://betterstack.com/website-monitoring#transaction-monitoring)
[\
\
### Phone call alerts & SMS included\
\
Unlimited global phone call alerts, sms, push notifications, and Slack notifications included with every Responder license.](https://betterstack.com/docs/uptime/monitoring-start/#step-2-choosing-the-alerting-options)
Uptime monitoring
-----------------
[Explore uptime monitoring](https://betterstack.com/uptime)
[\
\
### Screenshots for errors\
\
We record the API errors and take a screenshot of your app being down.](https://betterstack.com/uptime#uptime-monitoring)
[\
\
### Traceroute & MTR for timeouts\
\
Understand connection timeouts and request timeouts with edge-based traceroute and MTR outputs.](https://betterstack.com/uptime#uptime-monitoring)
[\
\
### Playwright-based transaction checks\
\
Run tests with a real Chrome browser instance with a JavaScript runtime.](https://betterstack.com/website-monitoring#transaction-monitoring)
[\
\
### Phone call alerts & SMS included\
\
Unlimited global phone call alerts, sms, push notifications, and Slack notifications included with every Responder license.](https://betterstack.com/docs/uptime/monitoring-start/#step-2-choosing-the-alerting-options)
Replaces
Log management
--------------
[Explore log management](https://betterstack.com/log-management)
[\
\
### Analyze raw logs at scale\
\
Run ad-hoc queries on raw logs at scale with our built-in query time sampling. \
Query with SQL, PromQL, Drag & drop or a simple log filtering.](https://betterstack.com/log-management)
[\
\
### Don’t get billed for useless logs\
\
Mark irrelevant logs as spam to exclude them and don’t get charged.](https://betterstack.com/log-management#query)
[\
\
### One-click pattern filtering\
\
Group similar logs, filter or exclude patterns with a single click. \
See surrounding logs from noisy neighbors.](https://betterstack.com/log-management#query)
[\
\
### SQL via HTTP API and MCP server\
\
Query your logs, spans or metrics with SQL over HTTP API or our MCP server.](https://betterstack.com/log-management#wide-events)
[\
\
### Store logs in your own S3 bucket\
\
No more ‘hot storage’ and ‘cold storage’. Access all your logs all the time. \
No need to rehydrate your logs from S3 ever again.](https://betterstack.com/log-management#wide-events)
[\
\
### Drag & drop dashboards\
\
Drag & drop the metrics you want to visualize. No SQL code necessary.](https://betterstack.com/log-management#query)
Log management
--------------
[Explore log management](https://betterstack.com/log-management)
[\
\
### Analyze raw logs at scale\
\
Run ad-hoc queries on raw logs at scale with our built-in sampling.](https://betterstack.com/log-management)
[\
\
### Don’t get billed for useless logs\
\
Mark irrelevant logs as spam to exclude them and don’t get charged.](https://betterstack.com/log-management#query)
[\
\
### One-click pattern filtering\
\
Group similar logs, filter or exclude patterns with a single click.](https://betterstack.com/log-management#query)
[\
\
### SQL via HTTP API and MCP server\
\
Query your logs, spans or metrics with SQL over HTTP API or MCP.](https://betterstack.com/log-management#wide-events)
[\
\
### Store logs in your own S3 bucket\
\
No need to rehydrate your data ever again.](https://betterstack.com/log-management#wide-events)
[\
\
### Drag & drop dashboards\
\
Drag & drop the metrics you want to visualize. No SQL code necessary.](https://betterstack.com/log-management#query)
Replaces
Infrastructure monitoring
-------------------------
[Explore infrastructure monitoring](https://betterstack.com/infrastructure-monitoring)
[\
\
### Anomaly detection alerts\
\
Trigger alerts in real-time based on anomalies in logs and metrics. No need to configure exact alert thresholds. Get alerts via Slack, e-mail, phone, SMS, and more.](https://betterstack.com/telemetry#resolve)
[\
\
### Collaboration built-in\
\
Observe your teammates and comment on note-worthy data spikes.](https://betterstack.com/telemetry)
[\
\
### Query with Drag & drop, SQL or PromQL\
\
Get answers fast with a powerful SQL query builder. No need to learn a new querying language or ask your data analyst.](https://betterstack.com/telemetry#troubleshoot)
[\
\
### OpenTelemetry & Prometheus-native\
\
Connect metrics in minutes using existing open-source collectors.](https://betterstack.com/infrastructure-monitoring)
Infrastructure monitoring
-------------------------
[Explore infrastructure monitoring](https://betterstack.com/infrastructure-monitoring)
[\
\
### Anomaly detection alerts\
\
Trigger alerts in real-time based on anomalies in logs and metrics. No need to configure exact alert thresholds. Get alerts via Slack, e-mail, phone, SMS, and more.](https://betterstack.com/telemetry#resolve)
[\
\
### Collaboration built-in\
\
Observe your teammates and comment on note-worthy data spikes.](https://betterstack.com/telemetry)
[\
\
### Query with Drag & drop, SQL or PromQL\
\
Get answers fast with a powerful SQL query builder. No need to learn a new querying language or ask your data analyst.](https://betterstack.com/telemetry#troubleshoot)
[\
\
### OpenTelemetry & Prometheus-native\
\
Connect metrics in minutes using existing open-source collectors.](https://betterstack.com/infrastructure-monitoring)
Replaces
Error tracking
--------------
[Explore error tracking](https://betterstack.com/error-tracking)
[\
\
### Made for Slack, Linear, Microsoft Teams, and Jira\
\
Integrate with tools you already use to get alerted with rich contextual notifications. Need an urgent fix? Leverage the built-in incident management.](https://betterstack.com/error-tracking#features)
[\
\
### Compatible with Sentry SDKs\
\
Track errors from 100+ platforms with the industry-standard Sentry SDKs.](https://betterstack.com/error-tracking#sentry-compatible)
[\
\
### Integrate with Claude Code or Cursor\
\
Integrate Better Stack in seconds with a single prompt. Copy, run, and start tracking errors with Better Stack.](https://betterstack.com/error-tracking#ai-first)
[\
\
### Terraform, API, and MCP server\
\
Integrate new apps with Terraform and investigate errors with MCP.](https://betterstack.com/error-tracking#features)
[\
\
### Configurable exception grouping\
\
Have a non-standard stack and want to group exceptions in an atypical way? We got you covered.](https://betterstack.com/error-tracking#features)
Error tracking
--------------
[Explore error tracking](https://betterstack.com/error-tracking)
[\
\
### Slack, Linear, MS Teams, Jira\
\
Get alerted with rich notifications. Need an urgent fix? Leverage the built-in incident management.](https://betterstack.com/error-tracking#features)
[\
\
### Compatible with Sentry SDKs\
\
Track errors from 100+ platforms with the industry-standard Sentry SDKs.](https://betterstack.com/error-tracking#sentry-compatible)
[\
\
### Integrate with Claude Code or Cursor\
\
Integrate Better Stack in seconds with a single prompt. Copy, run, and start tracking errors with Better Stack.](https://betterstack.com/error-tracking#ai-first)
[\
\
### Terraform, API, and MCP server\
\
Integrate new apps with Terraform and investigate errors with MCP.](https://betterstack.com/error-tracking#features)
[\
\
### Configurable exception grouping\
\
Have a non-standard stack and want to group exceptions in an atypical way? We got you covered.](https://betterstack.com/error-tracking#features)
Replaces
Real user monitoring
--------------------
[Explore real user monitoring](https://betterstack.com/real-user-monitoring)
[\
\
### Session replay\
\
See how users interact with your product. Watch at 2x speed, skip pauses, filter for rage indicators.](https://betterstack.com/real-user-monitoring#session-replay)
[\
\
### Auto-capture user events\
\
Collect clicks, form fills, and rage clicks with a single code snippet.](https://betterstack.com/real-user-monitoring#session-replay)
[\
\
### Product analytics with event funnels\
\
See what parts of the critical path of your onboarding need improving by evaluating user actions step-by-step.](https://betterstack.com/real-user-monitoring#product-analytics)
[\
\
### Correlate frontend with backend\
\
See web events alongside backend traces and other log events.](https://betterstack.com/real-user-monitoring#product-analytics)
[\
\
### Track web vitals\
\
See Largest Contentful Paint, Cumulative Layout Shift, and Interaction to Next Paint segmented per URL.](https://betterstack.com/real-user-monitoring#features)
[\
\
### Real-time website data at scale\
\
Are you getting more visitors from ChatGPT or Gemini?](https://betterstack.com/real-user-monitoring#website-analytics)
Real user monitoring
--------------------
[Explore real user monitoring](https://betterstack.com/real-user-monitoring)
[\
\
### Session replay\
\
See how users interact with your product. Watch at 2x speed, skip pauses, filter for rage indicators.](https://betterstack.com/real-user-monitoring#session-replay)
[\
\
### Auto-capture user events\
\
Collect clicks, form fills, and rage clicks with a single code snippet.](https://betterstack.com/real-user-monitoring#session-replay)
[\
\
### Product analytics with event funnels\
\
See what parts of the critical path of your onboarding need improving by evaluating user actions step-by-step.](https://betterstack.com/real-user-monitoring#product-analytics)
[\
\
### Correlate frontend with backend\
\
See web events alongside backend traces and other log events.](https://betterstack.com/real-user-monitoring#product-analytics)
[\
\
### Track web vitals\
\
See Largest Contentful Paint, Cumulative Layout Shift, and Interaction to Next Paint segmented per URL.](https://betterstack.com/real-user-monitoring#features)
[\
\
### Real-time website data at scale\
\
Are you getting more visitors from ChatGPT or Gemini?](https://betterstack.com/real-user-monitoring#website-analytics)
Replaces
Status page
-----------
[Explore status pages](https://betterstack.com/status-page)
[\
\
### Branded page on your own sub-domain\
\
Beautifully designed status page. Fully customizable with CSS and Javascript.](https://betterstack.com/status-page)
[\
\
### Subscribe to status page updates\
\
Send automated updates to your customers when incident occurs. Let your customers subscribe to the entire status page or just selected components.](https://betterstack.com/status-page#branded)
[\
\
### Translated into any language\
\
Be perceived as a local by your foreign customers. Customize every translation.](https://betterstack.com/status-page)
[\
\
### Embed custom charts\
\
Show pre-built charts with response times or add custom metrics with advanced visualizations directly to your status page.](https://betterstack.com/status-page)
Status page
-----------
[Explore status pages](https://betterstack.com/status-page)
[\
\
### Branded page on your own sub-domain\
\
Beautifully designed status page. Fully customizable with CSS and Javascript.](https://betterstack.com/status-page)
[\
\
### Subscribe to status page updates\
\
Send automated updates to your customers when incident occurs. Let your customers subscribe to the entire status page or just selected components.](https://betterstack.com/status-page#branded)
[\
\
### Translated into any language\
\
Be perceived as a local by your foreign customers. Customize every translation.](https://betterstack.com/status-page)
[\
\
### Embed custom charts\
\
Show pre-built charts with response times or add custom metrics with advanced visualizations directly to your status page.](https://betterstack.com/status-page)
Replaces
Warehouse
---------
[Explore warehouse](https://betterstack.com/warehouse)
[\
\
### So affordable you’ll ask what’s wrong with it\
\
Benefit from our economies of scale. We pass the savings on to you. \
Cheaper than self-hosting on AWS.](https://betterstack.com/warehouse#cost-comparison)
[\
\
### Get time series data warehouse as an API\
\
Save query as a high-performance API you can securely call from frontend.](https://betterstack.com/warehouse#ch-api)
[\
\
### Built-in vector embeddings and approximate KNN\
\
Generate vector embeddings without having to call an external API with our \
built-in embedding model and query embeddings fast with vector indexes.](https://betterstack.com/warehouse#features)
[\
\
### Open formats in your own S3 bucket\
\
Store everything in your own cloud. \
No vendor lock-in.](https://betterstack.com/warehouse#s3-bucket)
[\
\
### Analyze trends with analytical queries\
\
Run arbitrary SQL queries at petabyte scale leveraging query time sampling.](https://betterstack.com/warehouse#features)
Warehouse
---------
[Explore warehouse](https://betterstack.com/warehouse)
[\
\
### So affordable you’ll ask what’s wrong with it\
\
Benefit from our economies of scale. We pass the savings on to you. \
Cheaper than self-hosting on AWS.](https://betterstack.com/warehouse#cost-comparison)
[\
\
### Get time series data warehouse as an API\
\
Save query as a high-performance API you can securely call from frontend.](https://betterstack.com/warehouse#ch-api)
[\
\
### Built-in vector embeddings and approximate KNN\
\
Generate vector embeddings without having to call an external API with our \
built-in embedding model and query embeddings fast with vector indexes.](https://betterstack.com/warehouse#features)
[\
\
### Open formats in your own S3 bucket\
\
Store everything in your own cloud. \
No vendor lock-in.](https://betterstack.com/warehouse#s3-bucket)
[\
\
### Analyze trends with analytical queries\
\
Run arbitrary SQL queries at petabyte scale leveraging query time sampling.](https://betterstack.com/warehouse#features)
Replaces
Happy customers, growing market presence
----------------------------------------
Ship higher-quality software faster. Be the hero of your engineering teams.
Start for free
Start monitoring for free or [book a demo](https://betterstack.com/book-a-demo)
#### Don’t just take our word for it
We're proud to be working with publicly traded companies as well as individual indie hackers and are thankful for their feedback, suggestions, and support.
[@BetterStackHQ](https://twitter.com/betterstackhq)
is one of the best products I've ever used. Went from 0-100 on logging in 15 minutes. Incredible
[\
\
Conor\
\
@cnrstvns\
\
](https://twitter.com/@cnrstvns)
I tested [@BetterStackHQ](https://twitter.com/betterstackhq)
for @gamubsapp! So much easier to configure and the interface is better than @FreshworksInc!
[\
\
Quentin\
\
@glaffont\
\
](https://twitter.com/qlaffont/status/1442463552007147527)
[@BetterStackHQ](https://twitter.com/betterstackhq)
status page looks SO neat! A fantastic tool for SaaS products like @Snapodcast
[\
\
TonyHe\
\
@ttttonyhe\
\
](https://twitter.com/ttttonyhe/status/1433488160294678529)
By far [@BetterStackHQ](https://twitter.com/betterstackhq)
has given me more pleasant surprises other tool in this space. We had an outage due to a domain name expiring, and it turns out we can even be alered about that. Great user experience and UI on top of all the features. How is it not more popular?
[\
\
John\
\
@johncjago\
\
](https://twitter.com/johncjago/status/1462624489284513793)
One year one tool. @linear won my heart last year. This year so far, [@BetterStackHQ](https://twitter.com/betterstackhq)
is the frontrunner, well designed 👏
[\
\
Tianzhou\
\
@tianzhouchen\
\
](https://twitter.com/tianzhouchen/status/1441046890502520835)
I just checked this out, and have never been so happy that I saw an ad 👏
[\
\
Chris\
\
@chrishow\
\
](https://twitter.com/chrislhow/status/1417794338130698240)
Looking for a status page? I recommend [@BetterStackHQ](https://twitter.com/betterstackhq)
. Perfect support, answered my dms in a couple of minutes, and it's the first actual cool looking status page which allows custom domains (on the free plan 😱) haven't actually tried it, but it looks good so far.
#NotSponsor
[\
\
NeverLand\
\
@neverlandoff\
\
](https://twitter.com/neverlandoff/status/1444299269872267266)
Switched from @Statuspage to [@BetterStackHQ](https://twitter.com/betterstackhq)
over the week end, looking pretty good status.speakbox.ca
[\
\
Valentin Prugnaud 🦊\
\
@valentinprgnd\
\
](https://twitter.com/valentinprgnd/status/1435163698201464832)
What are you using for logging and incident management?
For me the go to is currently [@BetterStackHQ](https://twitter.com/betterstackhq)
- love their simplicity and powerful features. Would like to learn more about what's out there.
[\
\
Markus Leimer\
\
@markuslei22\
\
](https://x.com/markuslei22/status/1781299692254765185)
I'm utterly blown away by [@BetterStackHQ](https://twitter.com/betterstackhq)
! They do everything. I'm now monitoring one of our US servers for every kind of log Ubuntu creates, custom alerts for errors, website downtime, incident logging, Slack notifications, S3 log storage, and loads more. 😍
[\
\
Darren Pinder\
\
@dmpinder\
\
](https://twitter.com/dmpinder/status/1446246301407105033)
I absolutely love services like [@BetterStackHQ](https://twitter.com/betterstackhq)
simple, does a great job, and has a generous free plan for companies just starting out
I don't remember finding anything even close to it ~4 years ago when i was looking for a monitoring tool for one of my projects
[\
\
kostya\
\
@nstkostyal\
\
](https://x.com/nstkostya/status/1844361763304702401)
Show more
### Please accept cookies
We use cookies to authenticate users, improve the product user experience, and for [personalized ads](https://business.safety.google/privacy/)
. [Learn more.](https://betterstack.com/privacy)
Deny Accept required Accept all
---
# Infrastructure monitoring by Better Stack
Infrastructure monitoring costs more than the infra?
====================================================
30x cheaper than Datadog. Predictable pricing.
Exceptional customer support.
Start for free
Datadog bill too high? Migrate today, the rest of your contract is on us.
Migration assistance and bespoke onboarding included. [Book a consultation](https://calendly.com/betterstack/consultation-migrating-from-datadog)
Relied on by the world’s best engineering teams
* * *
At a fraction of
your current costs
-------------------------------------
Get an unrivaled price-to-performance ratio. Forget sampling and ingest all your data or decrease your costs by 80x.
[Explore pricing](https://betterstack.com/pricing#logs)
Ingest up to
80x more data
with the same budget
or save up to
98%
of your costs
1 TB traces per month
1 TB logs per month
1 TB metrics per month
Datadog
approx. $55,574 per month
Better Stack
$687 per month
An estimate only. Assumes annual payments, European data location, 1 responder with a Tera bundle, the average event size of 1 kB, $5 per 100 Datadog's "custom metrics". Assumes 1,000 Datadog "custom metrics" equivalent to 1 GB metrics. Further assumes Datadog's $0.1 per ingested GB of spans & logs, and $2.5/million indexed spans & logs for 30 days. Adds up to $51,200 for metrics, $2,787 for logs, and $2,787 for spans per month.
* * *
Get an AI SRE
-------------
Claude Code with the knowledge of your infrastructure.
Give LLMs the power of your telemetry data.
[Watch a demo](https://betterstack.com/demos/ai-sre/)
 
### Get an AI SRE to resolve
incidents with you at 3 am
Leverage automated root cause analysis based on the eBPF-based service map & log analysis. You’re always in charge.
Did the HTTP latency increase in eu-west too or just in us-east and us-west?


#### Robust MCP server
Integrate your telemetry data into your existing LLM workflows with a top tier MCP server.

#### You’re always in control
The AI SRE suggests hypotheses but never takes any automated actions without your approval. Get help when investigating an incident while remaining in charge.
Infinite scale, at self-hosted price
------------------------------------
Better Stack delivers extremely fast, high-throughput log search and low-latency dashboards at the price of self-hosted Prometheus.
### Radical usage transparency
Never worry about getting a surprise bill again. Set billing alerts and spending limits and stay fully in control.
### Unlimited data retention
With 13 months default retention for all metrics, long-term storage was never easier.

Up to
200x cheaper
than Datadog
Enabled by a proprietary state-of-the-art data processing pipeline.
* * *
Secure
Control costs and usage while managing data storage and access. Stay secure and compliant under SOC 2, GDPR, and more.
SOC 2 Type 2
GDPR
* * *
OpenTelemetry & Prometheus-native
---------------------------------
Start in minutes using your existing metrics collectors, or create custom metrics directly from your logs.
[Browse integrations](https://betterstack.com/integrations)
* * *
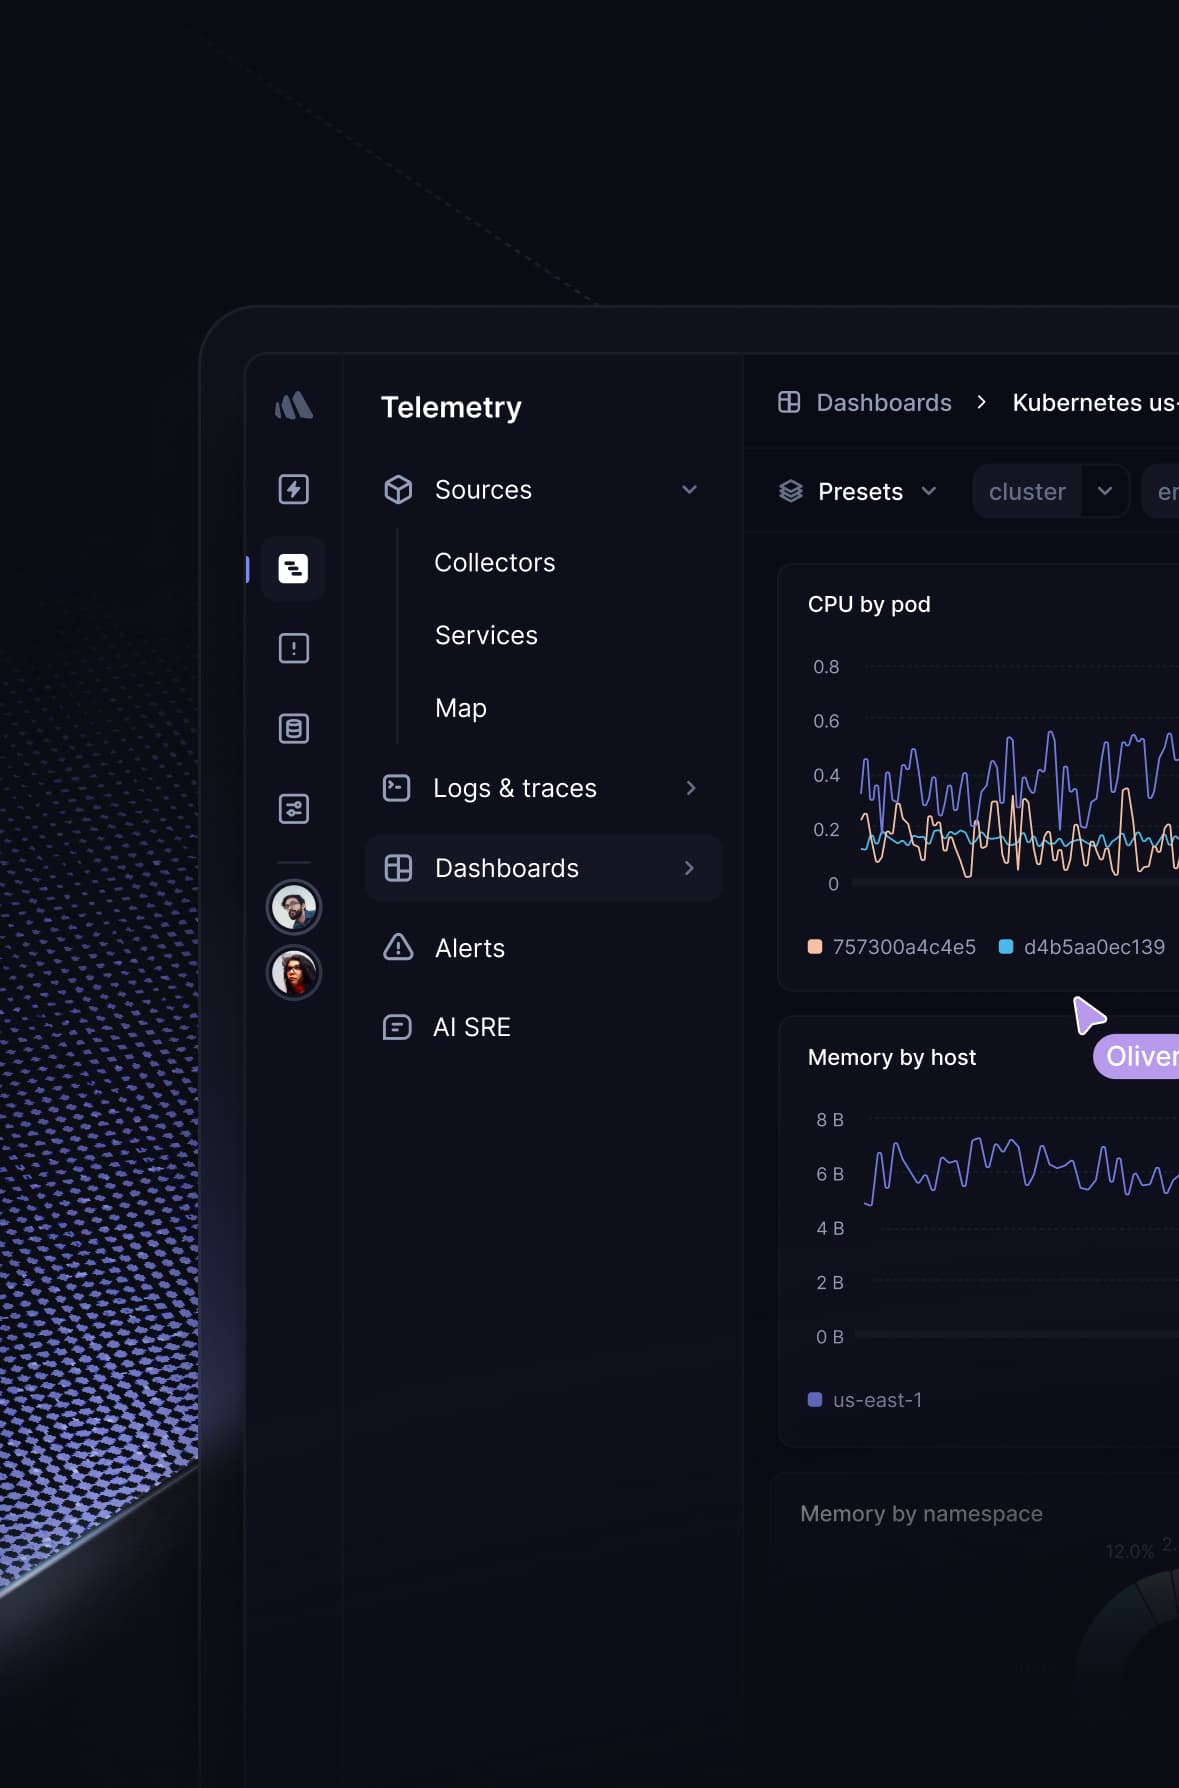
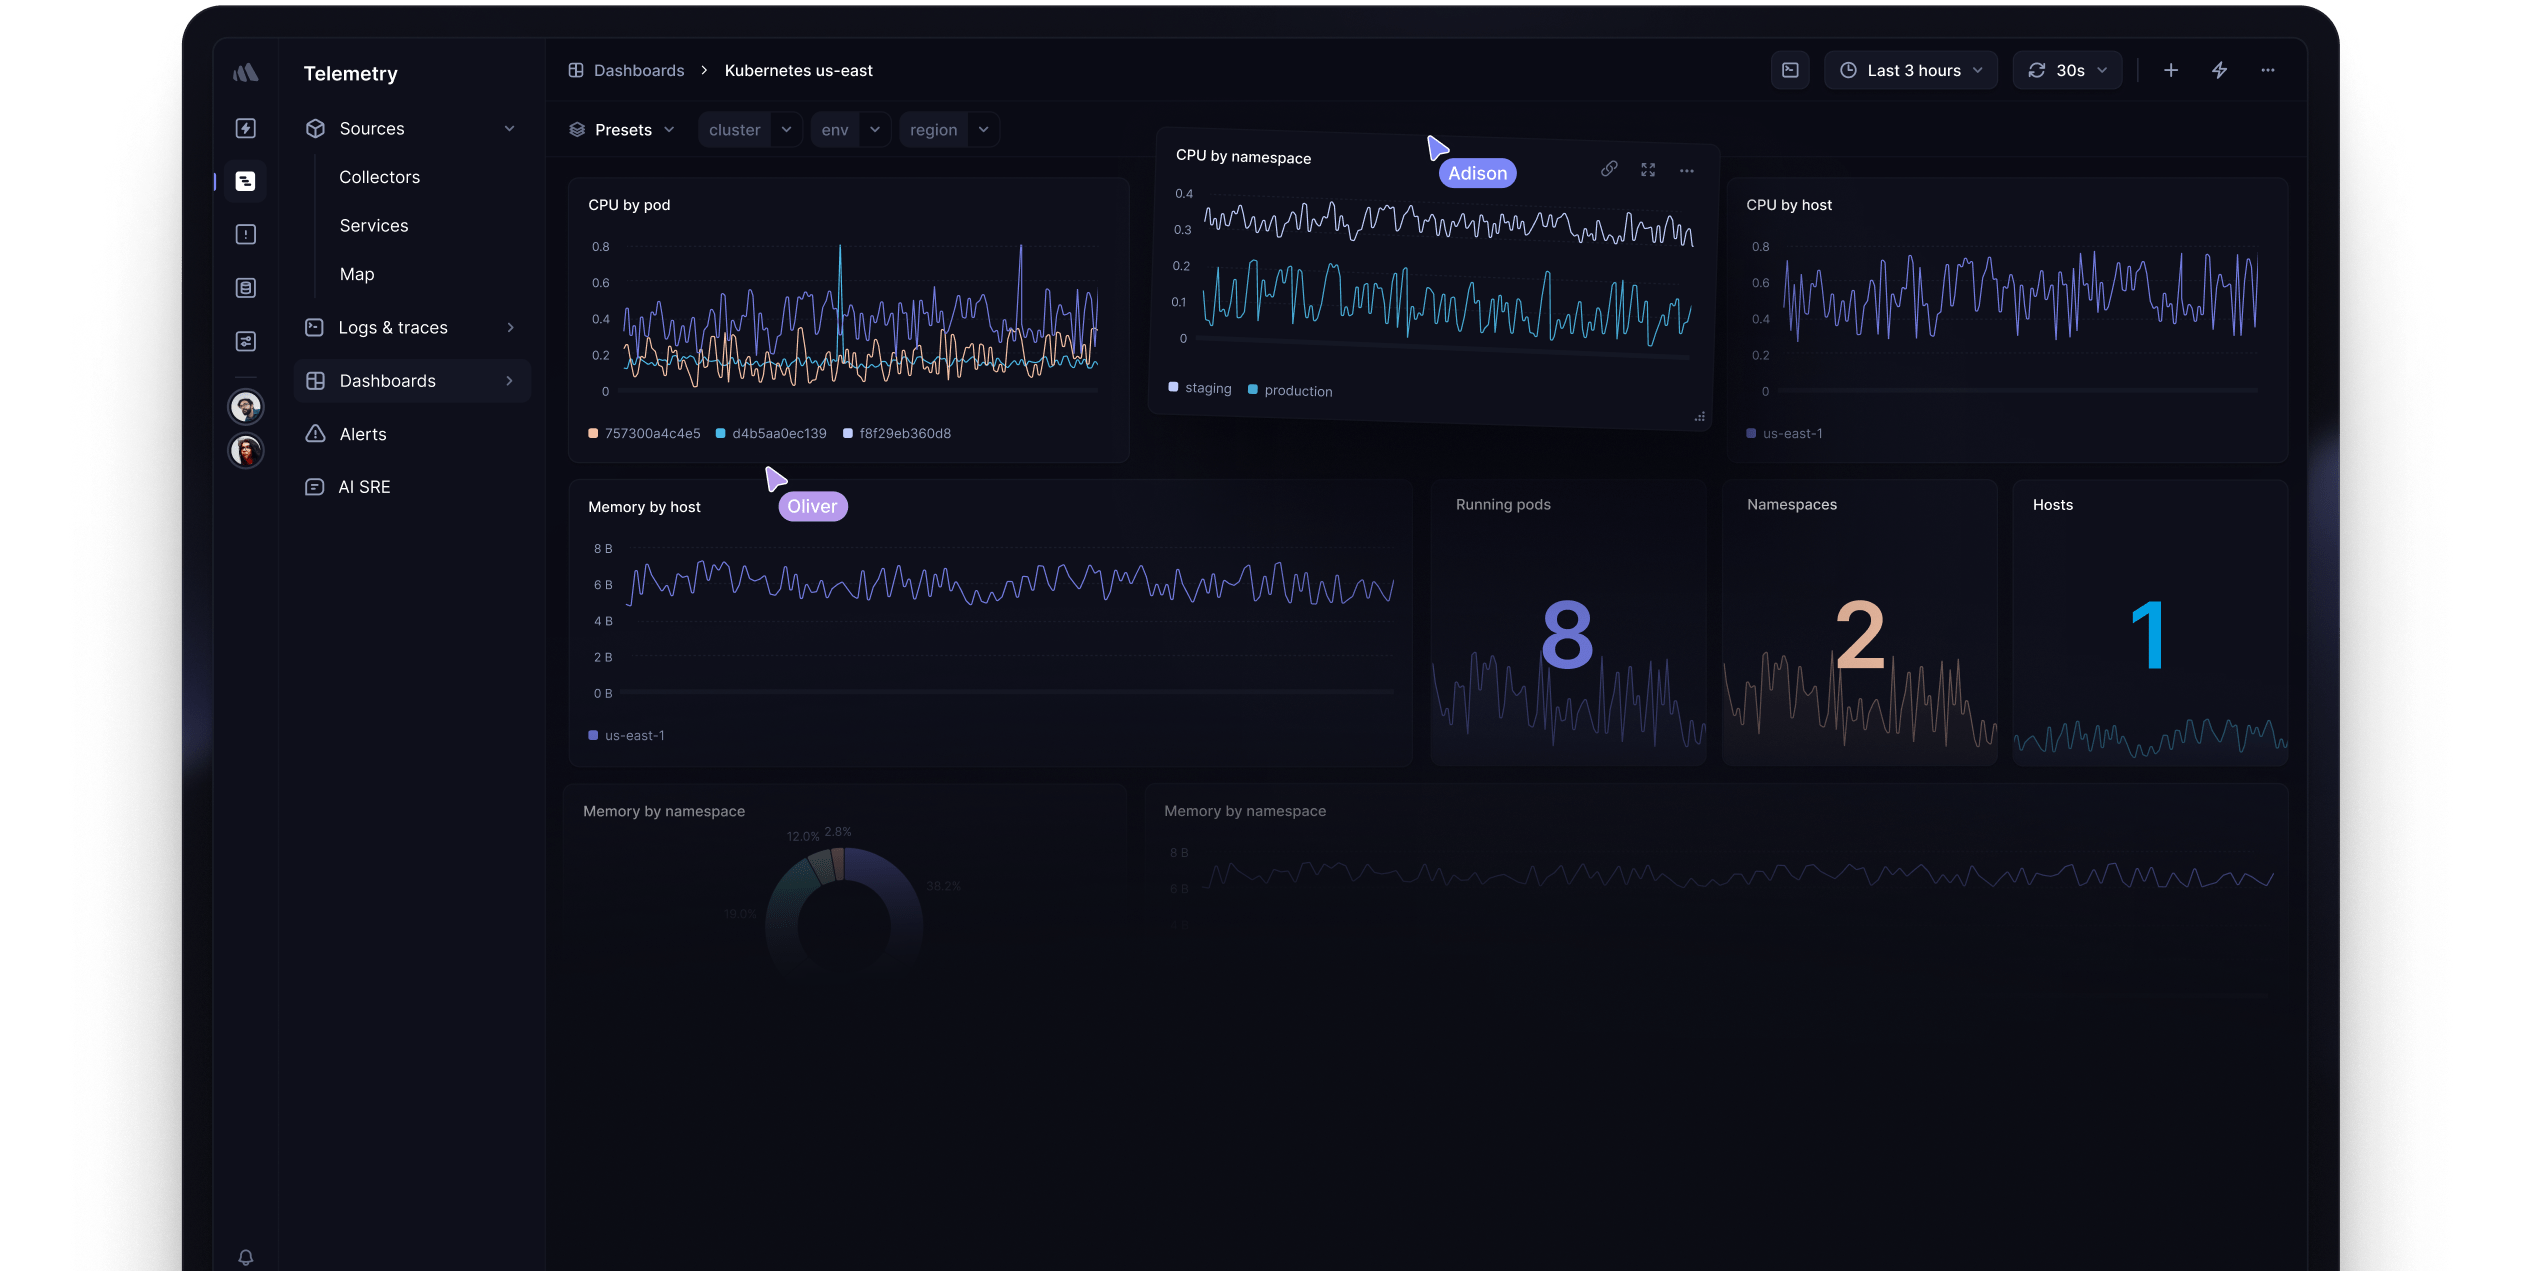
Dashboards you're used to
-------------------------
Use one of the many ready-made dashboards or create your own in just a few clicks.

### Single pane of glass
Query metrics across months of data from hundreds of clusters in seconds. Slice and dice your data to find issues at scale.

#### Query with Drag & drop, PromQL or SQL
Get answers fast with a powerful SQL query builder. No need to learn a new querying language or ask your data analyst.
#### Beautiful pre-built dashboards
Start in minutes with dashboard templates for the most popular services. Get actionable insights minutes after sending your first data.

#### Plays well with your self-hosted Grafana
No need to replace your existing Grafana on day one! Connect Better Stack as a Grafana source and enjoy an unmatched speed at a massive scale directly from your existing Grafana.
* * *
* * *
Everything you need to ship higher-quality software faster
----------------------------------------------------------

#### The most reliable uptime monitoring
Get a screenshot of the error and a second-by-second timeline with our fastest 30-second checks.

#### Log management
Collect logs across services with Vector, Syslog or OpenTelemetry with our reimagined log management.

#### Metrics
Integrate in minutes with Prometheus or OpenTelemetry, or create custom metrics directly from your logs.

#### Playwright checks
Run tests with a real Chrome browser instance with a JavaScript runtime.

#### Tracing
OpenTelemetry-native tracing with eBPF instrumentation.

#### Error tracking
Catch bugs, get root cause of every error, and create tickets on autopilot.
Happy customers, growing market presence
----------------------------------------
Instrument your clusters today. Try Better Stack risk-free with our 60-day money-back guarantee.
Ship higher-quality software faster. Be the hero of your engineering teams.
Start for free
Looking for an enterprise solution? [Book a demo](https://betterstack.com/book-a-demo)
### Please accept cookies
We use cookies to authenticate users, improve the product user experience, and for [personalized ads](https://business.safety.google/privacy/)
. [Learn more.](https://betterstack.com/privacy)
Deny Accept required Accept all
---
# Website Monitoring | Better Stack
Monitor any web. Check every user flow.
=======================================
Monitor everything from SSL certificates to the sign-up flow and get alerted about critical issues.
Start for free
Start monitoring for free or [book a demo](https://betterstack.com/book-a-demo)
 
Relied on by the world’s best engineering teams
Uptime monitoring
Reliable downtime alerts. No false positives.
---------------------------------------------
Monitor everything. Whether it’s your web page, API, ping, SSL, domain expiration, POP3, IMAP, SMTP, DNS, or generic network monitoring. We've got you covered.

#### 30s multi-location checks
Each HTTP and ping-based incident is verified from at least 3 locations before we alert you. No more false incidents!

#### Unlimited voice call alerts
As well as SMS, e-mail, Slack, Teams, and push notifications with our all-you-can-alert pricing.

#### Screenshots & error logs
We record your API's error message and take a screenshot of your website being down so that you know exactly what happened.
Transaction monitoring
Ensure flawless sign-up, login, and checkout every time
-------------------------------------------------------
We test all vital interactions by running a real Chrome browser instance, with a full-fledged JavaScript runtime.

### Playwright framework
Re-use your existing Playwright code to run all browser checks. No need to reinvent the wheel.
### Step-by-step incident audit
See exactly where the issue occurred and troubleshoot with detailed log and image records.
### No coding necessary
Create the testing script by clicking through the user flow in your browser with Playwright Codegen.
Heartbeat monitoring
Know that your scheduled jobs run correctly
-------------------------------------------
Never lose a database backup again. Track your CRON jobs and serverless workers and get alerted if they don't run correctly.

### Send a request not to create an incident
Your script needs to periodically make requests to a heartbeats's unique URL in order for the heartbeat not to create a new incident.
### Monitor anything
Heartbeat monitoring can be used to check any process that can send a request after running. The possible use cases are endless.
#### Don’t just take our word for it
We're proud to be working with these incredible companies, and thankful for their feedback, suggestions, and support.
Looking for a status page? I recommend [@BetterUptime](https://twitter.com/betteruptime)
. Perfect support, answered my dms in a couple of minutes, and it's the first actual cool looking status page which allows custom domains (on the free plan 😱) haven't actually tried it, but it looks good so far.
#NotSponsor
[\
\
NeverLand\
\
@neverlandoff\
\
](https://twitter.com/neverlandoff/status/1444299269872267266)
I tested [@BetterUptime](https://twitter.com/betteruptime)
for @gamubsapp! So much easier to configure and the interface is better than @FreshworksInc!
[\
\
Quentin\
\
@glaffont\
\
](https://twitter.com/qlaffont/status/1442463552007147527)
By far [@BetterUptime](https://twitter.com/betteruptime)
has given me more pleasant surprises other tool in this space. We had an outage due to a domain name expiring, and it turns out we can even be alerted about that. Great user experience and UI on top of all the features. How is it not more popular?
[\
\
John\
\
@johncjago\
\
](https://twitter.com/johncjago/status/1462624489284513793)
One year one tool. @linear won my heart last year. This year so far, [@BetterStackHQ](https://twitter.com/betterstackhq)
is the frontrunner, well designed 👏
[\
\
Tianzhou\
\
@tianzhouchen\
\
](https://twitter.com/tianzhouchen/status/1441046890502520835)
I just checked this out, and have never been so happy that I saw an ad 👏
[\
\
Chris\
\
@chrishow\
\
](https://twitter.com/chrislhow/status/1417794338130698240)
@BetterStackHQ is one of the best products I've ever used. Went from 0-100 on logging in 15 minutes. Incredible
[\
\
Conor\
\
@cnrstvns\
\
](https://twitter.com/@cnrstvns)
Switched from @Statuspage to [@BetterUptime](https://twitter.com/betteruptime)
over the week end, looking pretty good status.speakbox.ca
[\
\
Valentin Prugnaud 🦊\
\
@valentinprgnd\
\
](https://twitter.com/valentinprgnd/status/1435163698201464832)
[@BetterUptime](https://twitter.com/betteruptime)
status page looks SO neat! A fantastic tool for SaaS products like @Snapodcast
[\
\
TonyHe\
\
@ttttonyhe\
\
](https://twitter.com/ttttonyhe/status/1433488160294678529)
I'm utterly blown away by [@LogTailHQ](https://twitter.com/logtailhq)
and [@BetterUptime](https://twitter.com/betteruptime)
! They do everything. I'm now monitoring one of our US servers for every kind of log Ubuntu creates, custom alerts for errors, website downtime, incident logging, Slack notifications, S3 log storage, and loads more. 😍
[\
\
Darren Pinder\
\
@dmpinder\
\
](https://twitter.com/dmpinder/status/1446246301407105033)
We have set up a shiny system status page. Check it out status.ghostfol.io
[\
\
Ghostfolio\
\
@ghostfolio\_\
\
](https://twitter.com/ghostfolio_/status/1429071692886913030)
Show more
Relied on by the world’s best engineering teams
Get up & running in 30 seconds
------------------------------
Get notified with a radically better infrastructure monitoring platform.
Start in 30 seconds
Start monitoring for free or [book a demo](https://betterstack.com/book-a-demo)
### Please accept cookies
We use cookies to authenticate users, improve the product user experience, and for [personalized ads](https://business.safety.google/privacy/)
. [Learn more.](https://betterstack.com/privacy)
Deny Accept required Accept all
---
# AI-native Incident Management with On-call and Slack | Better Stack
Incident management designed for 2026
=====================================
AI-native incident management with built-in on-call and status pages in one beautifully made product.
Start for free
Looking for an enterprise solution? [Book a demo](https://betterstack.com/book-a-demo)

Relied on by the world’s best engineering teams
* * *
Get an AI SRE
-------------
Claude Code with the knowledge of your infrastructure.
Give LLMs the power of your telemetry data.
[Watch a demo](https://betterstack.com/demos/ai-sre/)
 
### Get an AI SRE to resolve
incidents with you at 3 am
Leverage automated root cause analysis based on the eBPF-based service map & log analysis. You’re always in charge.
Did the HTTP latency increase in eu-west too or just in us-east and us-west?


#### Robust MCP server
Integrate your telemetry data into your existing LLM workflows with a top tier MCP server.

#### You’re always in control
The AI SRE suggests hypotheses but never takes any automated actions without your approval. Get help when investigating an incident while remaining in charge.
* * *
No need to leave Slack
----------------------
Focus on resolving the incident instead of replying to “what’s the latest?” in #engineering.

### Create, acknowledge and resolve incidents directly from Slack
We automatically sync all events between Slack and the Better Stack dashboard.

#### Runbooks & workflows
Post a todo list when a new incident is triggered. Route the incident to the right responder.

#### Instant birds-eye view with rich integrations
No need to open 3rd party monitoring tools. Understand what’s happening right away.
* * *
On-call scheduling built‑in
---------------------------
Alert the right people at the right time. Easy to setup, easier to maintain.
 
### Ask a colleague to cover for you
Are you on-call but will be unavailable on a last minute? Ask a colleague to cover for you with a single click on the “Request cover” button.
* * *
### Create overrides with a single click
Adjust on-call shifts on the go anywhere, anytime.

#### Pre-fill on-call rotations
Leverage one of our standard rotation schedules to instantly pre-fill your on-call calendar.

#### Integrate with Google & Outlook calendar
Manage on-call schedules from our built-in web interface or keep them in a shared Google calendar.
* * *
Status page built‑in
--------------------
Build trust with every incident and reduce the number of customer service tickets.

### Embed interactive charts
Leverage pre-built response time charts or add custom metrics with advanced visualizations directly to your status page.

#### Custom status.yourdomain.com
Host a branded status page on your own custom subdomain and build confidence in your brand. We automatically sync all events between Slack and the Better Stack dashboard.

#### Have customers subscribe to updates
Let your customers subscribe to e-mail updates removing the need to reach out to you individually.
* * *
Escalation policies, workflows, and runbooks
--------------------------------------------
Alert the right person on the team, every time.
No more unnecessary cross-team escalations.

### Tie services to the right teams with catalog
Attach business knowledge to all incidents for more granular reporting and escalation rules with catalog and metadata.


#### Escalation policies & workflows
Bring in the right people. Assign incident roles and ensure clarity and accountability.

#### Track segmented MTTR, MTTA and everything else
Robust one-click reporting on your team's performance with a flexible data export.
* * *
AI as a first-class citizen
---------------------------
Remove noise to focus on what actually makes a difference.

### Smart incident merging
10 incidents created at the same time? Acknowledge them all with a single click and stop your phone from ringing.

#### Explain with AI
Analyze MTR, trace route, SSL certificates, and connection errors with LLMs with a single click.

#### AI-written post-mortems
Don't enjoy writing post-mortems? We leverage the channel history and incident timeline to draft it for you.
* * *
Everything you need to ship higher-quality software faster
----------------------------------------------------------

#### The most reliable uptime monitoring
Get a screenshot of the error and a second-by-second timeline with our fastest 30-second checks.

#### Log management
Collect logs across services with Vector, Syslog or OpenTelemetry with our reimagined log management.

#### Metrics
Integrate in minutes with Prometheus or OpenTelemetry, or create custom metrics directly from your logs.

#### Playwright checks
Run tests with a real Chrome browser instance with a JavaScript runtime.

#### Tracing
OpenTelemetry-native tracing with eBPF instrumentation.

#### Error tracking
Catch bugs, get root cause of every error, and create tickets on autopilot.
Happy customers, growing market presence
----------------------------------------
Ship higher-quality software faster. Be the hero of your engineering teams.

* * *
#### Don’t just take our word for it
We're proud to be working with publicly traded companies as well as individual indie hackers and are thankful for their feedback, suggestions, and support.
[@BetterStackHQ](https://twitter.com/betterstackhq)
is one of the best products I've ever used. Went from 0-100 on logging in 15 minutes. Incredible
[\
\
Conor\
\
@cnrstvns\
\
](https://twitter.com/@cnrstvns)
I tested [@BetterStackHQ](https://twitter.com/betterstackhq)
for @gamubsapp! So much easier to configure and the interface is better than @FreshworksInc!
[\
\
Quentin\
\
@glaffont\
\
](https://twitter.com/qlaffont/status/1442463552007147527)
[@BetterStackHQ](https://twitter.com/betterstackhq)
status page looks SO neat! A fantastic tool for SaaS products like @Snapodcast
[\
\
TonyHe\
\
@ttttonyhe\
\
](https://twitter.com/ttttonyhe/status/1433488160294678529)
By far [@BetterStackHQ](https://twitter.com/betterstackhq)
has given me more pleasant surprises other tool in this space. We had an outage due to a domain name expiring, and it turns out we can even be alered about that. Great user experience and UI on top of all the features. How is it not more popular?
[\
\
John\
\
@johncjago\
\
](https://twitter.com/johncjago/status/1462624489284513793)
One year one tool. @linear won my heart last year. This year so far, [@BetterStackHQ](https://twitter.com/betterstackhq)
is the frontrunner, well designed 👏
[\
\
Tianzhou\
\
@tianzhouchen\
\
](https://twitter.com/tianzhouchen/status/1441046890502520835)
I just checked this out, and have never been so happy that I saw an ad 👏
[\
\
Chris\
\
@chrishow\
\
](https://twitter.com/chrislhow/status/1417794338130698240)
Looking for a status page? I recommend [@BetterStackHQ](https://twitter.com/betterstackhq)
. Perfect support, answered my dms in a couple of minutes, and it's the first actual cool looking status page which allows custom domains (on the free plan 😱) haven't actually tried it, but it looks good so far.
#NotSponsor
[\
\
NeverLand\
\
@neverlandoff\
\
](https://twitter.com/neverlandoff/status/1444299269872267266)
Switched from @Statuspage to [@BetterStackHQ](https://twitter.com/betterstackhq)
over the week end, looking pretty good status.speakbox.ca
[\
\
Valentin Prugnaud 🦊\
\
@valentinprgnd\
\
](https://twitter.com/valentinprgnd/status/1435163698201464832)
What are you using for logging and incident management?
For me the go to is currently [@BetterStackHQ](https://twitter.com/betterstackhq)
- love their simplicity and powerful features. Would like to learn more about what's out there.
[\
\
Markus Leimer\
\
@markuslei22\
\
](https://x.com/markuslei22/status/1781299692254765185)
I'm utterly blown away by [@BetterStackHQ](https://twitter.com/betterstackhq)
! They do everything. I'm now monitoring one of our US servers for every kind of log Ubuntu creates, custom alerts for errors, website downtime, incident logging, Slack notifications, S3 log storage, and loads more. 😍
[\
\
Darren Pinder\
\
@dmpinder\
\
](https://twitter.com/dmpinder/status/1446246301407105033)
I absolutely love services like [@BetterStackHQ](https://twitter.com/betterstackhq)
simple, does a great job, and has a generous free plan for companies just starting out
I don't remember finding anything even close to it ~4 years ago when i was looking for a monitoring tool for one of my projects
[\
\
kostya\
\
@nstkostyal\
\
](https://x.com/nstkostya/status/1844361763304702401)
Show more
* * *
Try it risk free in minutes
---------------------------
AI-native incident management with built-in on-call and status pages in one beautifully made product.
Start for free
Start monitoring for free or [book a demo](https://betterstack.com/book-a-demo)
### Please accept cookies
We use cookies to authenticate users, improve the product user experience, and for [personalized ads](https://business.safety.google/privacy/)
. [Learn more.](https://betterstack.com/privacy)
Deny Accept required Accept all
---
# Free Status Page | Better Stack
Free status page
on your subdomain
====================================
Your logo and sub-domain, interactive charts, and dark mode. Completely free.
Start for free
Looking for an enterprise solution? [Book a demo](https://betterstack.com/book-a-demo)

Relied on by the world’s best engineering teams
Stylish & Branded.
On your domain.
------------------------------------
Build trust with every incident and reduce the number of customer service tickets.
 

#### Configure everything in 5 mins
Get a beautiful branded status page on your own sub-domain in just a few clicks. Configure a single CNAME record and you’re all set!

#### Subscribe to status page updates
Let your customers subscribe to e-mail updates removing the need to reach out to you individually. Let your customers subscribe to the entire status page or just selected components.

#### status.yourdomain.com
Host a branded status page on your own custom subdomain and build confidence in your brand.

#### Customizable design
You can customize the design to match your product with a custom CSS. You don’t have to, however, since the page looks amazing already.
Vertical layout Horizontal layout
* * *
Communicate incidents the right way
-----------------------------------
Critical incidents, scheduled maintenance, and service announcements. Fully automate your workflow or control everything manually.
 
### Embed interactive charts
Leverage pre-built response time charts or add custom metrics with advanced visualizations directly to your status page.

#### Translated into any language
Be perceived as a local by your foreign customers. Customize every translation.

#### SSO, password, and IP protection
Create a private status page for internal teams or enterprise customers. Have full control over who sees what.

### Connect your existing stack in 5 minutes
Plug in the services you already use including Datadog, New Relic, Grafana, Prometheus, Zabbix, Azure, AWS & Google Cloud.
[Browse integrations](https://betterstack.com/integrations)
* * *
Best-in-class uptime monitoring built-in. No false positives.
-------------------------------------------------------------
Get a screenshot of the error and a second-by-second timeline with our fastest 30-second checks.
[Explore uptime monitoring](https://betterstack.com/website-monitoring)

##### From SSL to domain expiration
Monitor everything. Whether it's your web page, API, ping, SSL, domain expiration, POP3, IMAP, SMTP, DNS, or generic network monitoring. We've got you covered.

##### 30s checks from around the world
Get a screenshot of the error and a second-by-second timeline with our fastest 30-second checks.

##### Cron monitoring
Never lose a database backup again. Track your CRON jobs and serverless workers and get alerted if they don't run correctly.
* * *
That's just the tip of the iceberg
----------------------------------

#### Incident management & On-call
Alert the right colleague at the right time with our on‑call schedules and flexible notification options.
[Explore](https://betterstack.com/incident-management)

#### Slack-based incident management
Automate your incident resolution process with powerful templated workflows directly in Slack.
[Explore](https://betterstack.com/incident-management)
* * *
#### Don’t just take our word for it
We're proud to be working with publicly traded companies as well as individual indie hackers and are thankful for their feedback, suggestions, and support.
[@BetterStackHQ](https://twitter.com/betterstackhq)
is one of the best products I've ever used. Went from 0-100 on logging in 15 minutes. Incredible
[\
\
Conor\
\
@cnrstvns\
\
](https://twitter.com/@cnrstvns)
I tested [@BetterStackHQ](https://twitter.com/betterstackhq)
for @gamubsapp! So much easier to configure and the interface is better than @FreshworksInc!
[\
\
Quentin\
\
@glaffont\
\
](https://twitter.com/qlaffont/status/1442463552007147527)
[@BetterStackHQ](https://twitter.com/betterstackhq)
status page looks SO neat! A fantastic tool for SaaS products like @Snapodcast
[\
\
TonyHe\
\
@ttttonyhe\
\
](https://twitter.com/ttttonyhe/status/1433488160294678529)
By far [@BetterStackHQ](https://twitter.com/betterstackhq)
has given me more pleasant surprises other tool in this space. We had an outage due to a domain name expiring, and it turns out we can even be alered about that. Great user experience and UI on top of all the features. How is it not more popular?
[\
\
John\
\
@johncjago\
\
](https://twitter.com/johncjago/status/1462624489284513793)
One year one tool. @linear won my heart last year. This year so far, [@BetterStackHQ](https://twitter.com/betterstackhq)
is the frontrunner, well designed 👏
[\
\
Tianzhou\
\
@tianzhouchen\
\
](https://twitter.com/tianzhouchen/status/1441046890502520835)
I just checked this out, and have never been so happy that I saw an ad 👏
[\
\
Chris\
\
@chrishow\
\
](https://twitter.com/chrislhow/status/1417794338130698240)
Looking for a status page? I recommend [@BetterStackHQ](https://twitter.com/betterstackhq)
. Perfect support, answered my dms in a couple of minutes, and it's the first actual cool looking status page which allows custom domains (on the free plan 😱) haven't actually tried it, but it looks good so far.
#NotSponsor
[\
\
NeverLand\
\
@neverlandoff\
\
](https://twitter.com/neverlandoff/status/1444299269872267266)
Switched from @Statuspage to [@BetterStackHQ](https://twitter.com/betterstackhq)
over the week end, looking pretty good status.speakbox.ca
[\
\
Valentin Prugnaud 🦊\
\
@valentinprgnd\
\
](https://twitter.com/valentinprgnd/status/1435163698201464832)
What are you using for logging and incident management?
For me the go to is currently [@BetterStackHQ](https://twitter.com/betterstackhq)
- love their simplicity and powerful features. Would like to learn more about what's out there.
[\
\
Markus Leimer\
\
@markuslei22\
\
](https://x.com/markuslei22/status/1781299692254765185)
I'm utterly blown away by [@BetterStackHQ](https://twitter.com/betterstackhq)
! They do everything. I'm now monitoring one of our US servers for every kind of log Ubuntu creates, custom alerts for errors, website downtime, incident logging, Slack notifications, S3 log storage, and loads more. 😍
[\
\
Darren Pinder\
\
@dmpinder\
\
](https://twitter.com/dmpinder/status/1446246301407105033)
I absolutely love services like [@BetterStackHQ](https://twitter.com/betterstackhq)
simple, does a great job, and has a generous free plan for companies just starting out
I don't remember finding anything even close to it ~4 years ago when i was looking for a monitoring tool for one of my projects
[\
\
kostya\
\
@nstkostyal\
\
](https://x.com/nstkostya/status/1844361763304702401)
Show more
* * *
Get started in 30 seconds
-------------------------
Keep your customers informed and build trust with a branded status page on your own subdomain.
Start for free
Looking for an enterprise solution? [Book a demo](https://betterstack.com/book-a-demo)
### Please accept cookies
We use cookies to authenticate users, improve the product user experience, and for [personalized ads](https://business.safety.google/privacy/)
. [Learn more.](https://betterstack.com/privacy)
Deny Accept required Accept all
---
# Free StatusPage.io alternative | Better Stack
Free StatusPage.io
alternative
================================
Keep your customers informed and build trust.
Start in 30 seconds
Start monitoring for free or
[book a demo](https://betterstack.com/book-a-demo)

Why choose Better Stack vs. StatusPage.io
------------------------------------------
Key features

StatusPage.io

Better Stack
Free custom subdomain (status.yourdomain.com)
—
Unlimited
Embed system status widget into your website
—

Beautiful status page design
—

Built-in website & ping monitoring
—

Phone call downtime alerts
—

Built-in incident management
—

On-call duty scheduling
—

Designed for teams and enterprises


##### Loved by teams around the world
Software engineers from high-growth startups to Fortune 500 companies choose Better Stack.


Stylish & Branded.
On your domain.
-------------------------------------
Build trust with every incident and reduce the number of customer service tickets.
Replaces


### status.yourdomain.com
Plug in the services you already use including DataDog, New Relic, Grafana, Prometheus, Zabbix, Microsoft Azure, AWS & Google Cloud.

### Configure everything in 5 mins
Get a beautiful branded status page on your own sub-domain in just a few clicks. Configure a single CNAME record and you’re all set!

### Customizable design
You can customize the design to match your product with a custom CSS. You don’t have to, however, since the page looks amazing already.
### That's just the tip
of the iceberg

#### Screenshots & error logs
We don't just tell you that your service went down. We also tell you why.

#### Incident audit timeline
Get second-by-second timeline for every incident with detailed information about what happened and who got alerted.

#### Ping, SSL & TLD expiration
The most commonly used monitors come built-in and can be configured in a few seconds.

#### Smart incident merging
30 incidents get created at the same time? Acknowledge them with a single tap and stop your phone from ringing while fixing the issue.

#### Integrate everything
Plug in the services across all levels of your stack and get up and running in minutes, not days.

#### Cron job monitoring
Never lose a DB backup! Track your CRON jobs and serverless workers. Get alerted if they don't run correctly.
### Save big with
Better Stack
Better Stack replaces a bunch of existing tools. See how our fixed price for a team of 6 compares with PagerDuty, Pingdom, and Statuspage.io.
[See pricing](https://betterstack.com/pricing)

PagerDuty
Incident management
+

Pingdom
Uptime monitoring
+

Statuspage.io
Branded status page
\=
$ 673 /mo
6 team members, 60 monitors,
and 2,000 subscribers

Incident management with on-call

Uptime monitoring built-in

Branded status page on your own sub-domain status.domain.com
$ 269 /mo
6 team members, 60 monitors,
and 2,000 subscribers
#### Don’t just take our word for it
We're proud to be working with these incredible companies, and thankful for their feedback, suggestions, and support.
Looking for a status page? I recommend [@BetterUptime.](https://twitter.com/betteruptime)
Perfect support, answered my dms in a couple of minutes, and it's the first actual cool looking status page which allows custom domains (on the free plan 😱) haven't actually tried it, but it looks good so far.
#NotSponsor
[\
\
NeverLand\
\
@neverlandoff\
\
](https://twitter.com/neverlandoff/status/1444299269872267266)
I tested [@BetterUptime](https://twitter.com/betteruptime)
for @gamubsapp! So much easier to configure and the interface is better than @FreshworksInc!
[\
\
Quentin\
\
@glaffont\
\
](https://twitter.com/qlaffont/status/1442463552007147527)
By far [@BetterUptime](https://twitter.com/betteruptime)
has given me more pleasant surprises other tool in this space. We had an outage due to a domain name expiring, and it turns out we can even be alerted about that. Great user experience and UI on top of all the features. How is it not more popular?
[\
\
John\
\
@johncjago\
\
](https://twitter.com/johncjago/status/1462624489284513793)
One year one tool. @linear won my heart last year. This year so far, [@BetterStackHQ](https://twitter.com/betterstackhq)
is the frontrunner, well designed 👏
[\
\
Tianzhou\
\
@tianzhouchen\
\
](https://twitter.com/tianzhouchen/status/1441046890502520835)
I just checked this out, and have never been so happy that I saw an ad 👏
[\
\
Chris\
\
@chrishow\
\
](https://twitter.com/chrislhow/status/1417794338130698240)
We have now completely switched our status page to [@BetterUptime](https://twitter.com/betteruptime)
— It's all automated, pages us on all incidents and looks fantastic. Sold. status.improvmx.com
[\
\
ImprovMX\
\
@ImprovMx\
\
](https://twitter.com/ImprovMx/status/1484160652583260178)
Switched from @Statuspage to [@BetterUptime](https://twitter.com/betteruptime)
over the week end, looking pretty good status.speakbox.ca
[\
\
Valentin Prugnaud 🦊\
\
@valentinprgnd\
\
](https://twitter.com/valentinprgnd/status/1435163698201464832)
[@BetterUptime](https://twitter.com/betteruptime)
status page looks SO neat! A fantastic tool for SaaS products like @Snapodcast
[\
\
TonyHe\
\
@ttttonyhe\
\
](https://twitter.com/ttttonyhe/status/1433488160294678529)
I'm utterly blown away by [@LogTailHQ](https://twitter.com/logtailhq)
and [@BetterUptime](https://twitter.com/betteruptime)
! They do everything. I'm now monitoring one of our US servers for every kind of log Ubuntu creates, custom alerts for errors, website downtime, incident logging, Slack notifications, S3 log storage, and loads more. 😍
[\
\
Darren Pinder\
\
@dmpinder\
\
](https://twitter.com/dmpinder/status/1446246301407105033)
We have set up a shiny system status page. Check it out status.ghostfol.io
[\
\
Ghostfolio\
\
@ghostfolio\_\
\
](https://twitter.com/ghostfolio_/status/1429071692886913030)
Show more
###### Loved by teams around the world


###### Sign up for free
#### Get up & running
in 30 seconds
Get notified with a radically better
infrastructure monitoring platform.
Start in 30 seconds
Start monitoring for free or
[book a demo](https://betterstack.com/book-a-demo)

---
# Real user monitoring by Better Stack
Real user monitoring
====================
10x cheaper than Datadog. Predictable pricing.
Exceptional customer support.
Start for free
Looking for an enterprise solution? [Book a consultation](https://betterstack.com/book-a-demo)

Relied on by the world’s best engineering teams
* * *
Analyze your users, not your invoice
------------------------------------
Get an unrivalled price-to-performance ratio. Decrease your budget by 90% or keep your current budget but actually gather events from all of your services, without sampling.
[Explore pricing](https://betterstack.com/pricing#logs)
Ingest up to
10x more data
with the same budget
or save up to
90%
of your costs
5M web events
per month
50,000 session replays
per month
Better Stack
approx.
$35
approx.
$35
Posthog
approx.
$137
approx.
$137
Amplitude
approx.
$311
approx.
$311
Datadog
approx.
$450
approx.
$450
Mixpanel
approx.
$613
approx.
$613
Assumes monthly on-demand pricing, European data location, 1 Responder license with Better Stack, the average event size of 1 kB and 1-month retention. Further assumes 50 events per session and Datadog RUM Investigate at $0.0045/session, Posthog pricing at $0.0000343/event, and 200 events per MTU in Amplitude.
Better Stack
approx.
$102
approx.
$102
Posthog
approx.
$175
approx.
$175
Sentry
approx.
$232
approx.
$232
Datadog
approx.
$405
approx.
$405
Assumes 1 Responder license and $0.00150/session replay with Better Stack, European data location,
monthly on-demand billing, Datadog’s RUM Investigate with the Session Replay add-on, Sentry Business plan, Posthog pricing at $0.0035/recording.
* * *
Session replay
--------------
See how users interact with your product. Watch at 2x speed, skip pauses, filter for rage indicators.
 
### Filter sessions that matter
Analyze useful sessions without the noise. Watch at 2x speed, skip pauses.

#### Related errors, traces, logs, and metrics
View related backend and frontend errors, distributed traces, backend and frontend logs.

#### Filter sensitive fields
Make sure sensitive fields are never recorded to keep confidential information safe.
* * *
Website analytics
-----------------
What sites are referring traffic? Are you getting more visitors from ChatGPT or Gemini? What marketing campaigns work? What pages are the most visited?
 
### Real-time website data at scale
See what's happening in your landing pages and web applications at scale. Ingest and process hundreds of thousands of requests within seconds.

#### Referrer, utm\_campaigns, user agents, and more
Track locales, entry and exit pages, screen resolutions. Everything you'd expect from robust website analytics.

#### Correlate frontend user events with logs and traces
Correlate website analytics alongside metrics, logs, and traces across services and environments.
* * *
Web vitals
----------
Improve the speed of your pages to rank higher in Google and ChatGPT and investigate what pages consume the most RAM.
 
### Track web vitals at scale
Largest Contentful Paint (LCP), Cumulative Layout Shift (CLS) and Interaction to Next Paint (INP) segmented per URL.

#### Track Chrome RAM consumption
Users complain your page freezes their computer? See what URLs and scripts need to be optimized.

#### Get alerted when your web vitals decline
Track your Core Web Vitals and browser performance over time and get alerted when something breaks.
* * *
Product analytics
-----------------
Research user actions with easy-to-use funnels.
 
### Analyze funnels at scale
See what parts of your product are broken by tracking user actions step-by-step.

#### Correlate backend and frontend events
See how user actions impact your system’s performance with related traces, logs, and metrics.

#### Auto-capture user events
Capture all user actions now, define user events later. No need to instrument frontend events manually.
* * *
Error tracking built-in
-----------------------
Leverage the integrated error tracking to correlate errors with session replays and backend traces.


### Scale your infrastructure, not your budget
AI-native error tracking built on Better Stack. Sentry-compatible at 1/6th the price.

#### Designed for Claude Code, Cursor and Codex
Modern LLMs can fix most bugs if you give them enough context. Fix errors with a 1-click prompt.

#### Robust AI SRE and MCP server
Get a Claude Code-like UI with the knowledge of your infrastructure. Get a copilot when resolving incidents.
* * *
Everything you need to ship higher-quality software faster
----------------------------------------------------------

#### Tracing
Get OpenTelemetry-native tracing without any code changes with 1-click eBPF instrumentation.

#### Log management
Collect logs across services with Vector, Syslog or OpenTelemetry with our reimagined log management.

#### Metrics
Integrate in minutes with Prometheus or OpenTelemetry, or create custom metrics directly from your logs.

#### The most reliable uptime monitoring
Get a screenshot of the error and a second-by-second timeline with our fastest 30-second checks.

#### Playwright checks
We test all vital interactions by running a real Chrome browser instance with a JavaScript runtime.

#### Incident management built-in
Schedule on-call duties, create escalation policies, and post incident updates on a status page.
* * *
Secure, scalable & compliant
----------------------------
### Everything your data privacy officer requires so that you can pass audits with a peace of mind.

SOC2 Type 2 & GDPR
Request our SOC 2 Type 2 attestation upon signing an NDA.

ISO 27001 data centers
Ensuring strict data security standards.

Exclude sensitive information
Don't record events, values or interactions from certain elements.
Relied on by the world’s best engineering teams
Happy customers, growing market presence
----------------------------------------
Get started today. Try Better Stack risk-free with our 60-day money-back guarantee.
Ship higher-quality software faster. Be the hero of your engineering teams.
Integrate in 5 minutes
Looking for an enterprise solution? [Book a consultation](https://betterstack.com/book-a-demo)
### Please accept cookies
We use cookies to authenticate users, improve the product user experience, and for [personalized ads](https://business.safety.google/privacy/)
. [Learn more.](https://betterstack.com/privacy)
Deny Accept required Accept all
---
# Modern Pagerduty alternative | Better Stack
Modern Pagerduty
alternative
==============================
Configure your team's on-call schedule directly in your favorite calendar app.
Start in 30 seconds
Start monitoring for free or
[book a demo](https://betterstack.com/book-a-demo)

Why choose Better Stack vs. Pagerduty
--------------------------------------
Key features

Pagerduty

Better Stack
Schedule on-call rotations from your calendar app
—

Embed system status notice into your app
—

Heartbeat (CRON) monitoring
—

Built-in website & ping monitoring
—

Built-in status page
—

Helpful alerts
—

Beautiful dashboard
—

Phone call alerts

Unlimited
Reliability


Designed for teams and enterprises


##### Loved by teams around the world
Software engineers from high-growth startups to Fortune 500 companies choose Better Stack.


Incident management reimagined
------------------------------
Get all the debug data you need and collaborate with your colleagues on fixing the root cause of the incident.
Replaces


### On-call schedule calendar
Alert the right people at the right time by configuring your team's on-call duty rotations.

### Flexible incident escalations
Customize who gets notified based on the incident origin, severity, and context.

### Incident audit timeline
See exactly how the incident developed and evolved and who got notified with our second-by-second incident timeline.
### That's just the tip
of the iceberg

#### Screenshots & error logs
We don't just tell you that your service went down. We also tell you why.

#### Incident audit timeline
Get second-by-second timeline for every incident with detailed information about what happened and who got alerted.

#### Ping, SSL & TLD expiration
The most commonly used monitors come built-in and can be configured in a few seconds.

#### Smart incident merging
30 incidents get created at the same time? Acknowledge them with a single tap and stop your phone from ringing while fixing the issue.

#### Integrate everything
Plug in the services across all levels of your stack and get up and running in minutes, not days.

#### Cron job monitoring
Never lose a DB backup! Track your CRON jobs and serverless workers. Get alerted if they don't run correctly.
### Save big with
Better Stack
Better Stack replaces a bunch of existing tools. See how our fixed price for a team of 6 compares with PagerDuty, Pingdom, and Statuspage.io.
[See pricing](https://betterstack.com/pricing)

PagerDuty
Incident management
+

Pingdom
Uptime monitoring
+

Statuspage.io
Branded status page
\=
$ 673 /mo
6 team members, 60 monitors,
and 2,000 subscribers

Incident management with on-call

Uptime monitoring built-in

Branded status page on your own sub-domain status.domain.com
$ 269 /mo
6 team members, 60 monitors,
and 2,000 subscribers
#### Don’t just take our word for it
We're proud to be working with these incredible companies, and thankful for their feedback, suggestions, and support.
Looking for a status page? I recommend [@BetterUptime.](https://twitter.com/betteruptime)
Perfect support, answered my dms in a couple of minutes, and it's the first actual cool looking status page which allows custom domains (on the free plan 😱) haven't actually tried it, but it looks good so far.
#NotSponsor
[\
\
NeverLand\
\
@neverlandoff\
\
](https://twitter.com/neverlandoff/status/1444299269872267266)
I tested [@BetterUptime](https://twitter.com/betteruptime)
for @gamubsapp! So much easier to configure and the interface is better than @FreshworksInc!
[\
\
Quentin\
\
@glaffont\
\
](https://twitter.com/qlaffont/status/1442463552007147527)
By far [@BetterUptime](https://twitter.com/betteruptime)
has given me more pleasant surprises other tool in this space. We had an outage due to a domain name expiring, and it turns out we can even be alerted about that. Great user experience and UI on top of all the features. How is it not more popular?
[\
\
John\
\
@johncjago\
\
](https://twitter.com/johncjago/status/1462624489284513793)
One year one tool. @linear won my heart last year. This year so far, [@BetterStackHQ](https://twitter.com/betterstackhq)
is the frontrunner, well designed 👏
[\
\
Tianzhou\
\
@tianzhouchen\
\
](https://twitter.com/tianzhouchen/status/1441046890502520835)
I just checked this out, and have never been so happy that I saw an ad 👏
[\
\
Chris\
\
@chrishow\
\
](https://twitter.com/chrislhow/status/1417794338130698240)
We have now completely switched our status page to [@BetterUptime](https://twitter.com/betteruptime)
— It's all automated, pages us on all incidents and looks fantastic. Sold. status.improvmx.com
[\
\
ImprovMX\
\
@ImprovMx\
\
](https://twitter.com/ImprovMx/status/1484160652583260178)
Switched from @Statuspage to [@BetterUptime](https://twitter.com/betteruptime)
over the week end, looking pretty good status.speakbox.ca
[\
\
Valentin Prugnaud 🦊\
\
@valentinprgnd\
\
](https://twitter.com/valentinprgnd/status/1435163698201464832)
[@BetterUptime](https://twitter.com/betteruptime)
status page looks SO neat! A fantastic tool for SaaS products like @Snapodcast
[\
\
TonyHe\
\
@ttttonyhe\
\
](https://twitter.com/ttttonyhe/status/1433488160294678529)
I'm utterly blown away by [@LogTailHQ](https://twitter.com/logtailhq)
and [@BetterUptime](https://twitter.com/betteruptime)
! They do everything. I'm now monitoring one of our US servers for every kind of log Ubuntu creates, custom alerts for errors, website downtime, incident logging, Slack notifications, S3 log storage, and loads more. 😍
[\
\
Darren Pinder\
\
@dmpinder\
\
](https://twitter.com/dmpinder/status/1446246301407105033)
We have set up a shiny system status page. Check it out status.ghostfol.io
[\
\
Ghostfolio\
\
@ghostfolio\_\
\
](https://twitter.com/ghostfolio_/status/1429071692886913030)
Show more
###### Loved by teams around the world


###### Sign up for free
#### Get up & running
in 30 seconds
Get notified with a radically better
infrastructure monitoring platform.
Start in 30 seconds
Start monitoring for free or
[book a demo](https://betterstack.com/book-a-demo)

---
# Modern StatusCake alternative | Better Stack
Modern StatusCake
alternative
===============================
See why the best CTOs choose Better Stack over StatusCake.
Start in 30 seconds
Start monitoring for free or
[book a demo](https://betterstack.com/book-a-demo)

Why choose Better Stack vs. StatusCake
---------------------------------------
Key features

StatusCake

Better Stack
Phone call alerts
—
Unlimited
Unlimited monitors available
—

Helpful alerts
—

Built-in incident management
—

On-call duty scheduling
—

Manually triggered incidents
—

Beautiful dashboard
—

Designed for teams and enterprises
—

Free tier included


##### Loved by teams around the world
Software engineers from high-growth startups to Fortune 500 companies choose Better Stack.


Uptime monitoring reimagined
----------------------------
Get a screenshot of the error, and a second-by-second timeline with our fastest 30-second checks.
Replaces


### Unlimited phone call alerts
As well as SMS, e-mail, Slack, Microsoft Teams, and push notifications with our all-you-can-alert pricing. Be the first one to know your site is down.

### 30s multi-location checks
Each HTTP and ping-based incident is verified from at least 3 locations before we alert you. No more false incidents!

### Incident management built-in
Alert the right person on your team at the right time with our on-callscheduling plug in the services you already use including DataDog, and New Relic.
### That's just the tip
of the iceberg

#### Screenshots & error logs
We don't just tell you that your service went down. We also tell you why.

#### Incident audit timeline
Get second-by-second timeline for every incident with detailed information about what happened and who got alerted.

#### Ping, SSL & TLD expiration
The most commonly used monitors come built-in and can be configured in a few seconds.

#### Smart incident merging
30 incidents get created at the same time? Acknowledge them with a single tap and stop your phone from ringing while fixing the issue.

#### Integrate everything
Plug in the services across all levels of your stack and get up and running in minutes, not days.

#### Cron job monitoring
Never lose a DB backup! Track your CRON jobs and serverless workers. Get alerted if they don't run correctly.
### Save big with
Better Stack
Better Stack replaces a bunch of existing tools. See how our fixed price for a team of 6 compares with PagerDuty, Pingdom, and Statuspage.io.
[See pricing](https://betterstack.com/pricing)

PagerDuty
Incident management
+

Pingdom
Uptime monitoring
+

Statuspage.io
Branded status page
\=
$ 673 /mo
6 team members, 60 monitors,
and 2,000 subscribers

Incident management with on-call

Uptime monitoring built-in

Branded status page on your own sub-domain status.domain.com
$ 269 /mo
6 team members, 60 monitors,
and 2,000 subscribers
#### Don’t just take our word for it
We're proud to be working with these incredible companies, and thankful for their feedback, suggestions, and support.
Looking for a status page? I recommend [@BetterUptime.](https://twitter.com/betteruptime)
Perfect support, answered my dms in a couple of minutes, and it's the first actual cool looking status page which allows custom domains (on the free plan 😱) haven't actually tried it, but it looks good so far.
#NotSponsor
[\
\
NeverLand\
\
@neverlandoff\
\
](https://twitter.com/neverlandoff/status/1444299269872267266)
I tested [@BetterUptime](https://twitter.com/betteruptime)
for @gamubsapp! So much easier to configure and the interface is better than @FreshworksInc!
[\
\
Quentin\
\
@glaffont\
\
](https://twitter.com/qlaffont/status/1442463552007147527)
By far [@BetterUptime](https://twitter.com/betteruptime)
has given me more pleasant surprises other tool in this space. We had an outage due to a domain name expiring, and it turns out we can even be alerted about that. Great user experience and UI on top of all the features. How is it not more popular?
[\
\
John\
\
@johncjago\
\
](https://twitter.com/johncjago/status/1462624489284513793)
One year one tool. @linear won my heart last year. This year so far, [@BetterStackHQ](https://twitter.com/betterstackhq)
is the frontrunner, well designed 👏
[\
\
Tianzhou\
\
@tianzhouchen\
\
](https://twitter.com/tianzhouchen/status/1441046890502520835)
I just checked this out, and have never been so happy that I saw an ad 👏
[\
\
Chris\
\
@chrishow\
\
](https://twitter.com/chrislhow/status/1417794338130698240)
We have now completely switched our status page to [@BetterUptime](https://twitter.com/betteruptime)
— It's all automated, pages us on all incidents and looks fantastic. Sold. status.improvmx.com
[\
\
ImprovMX\
\
@ImprovMx\
\
](https://twitter.com/ImprovMx/status/1484160652583260178)
Switched from @Statuspage to [@BetterUptime](https://twitter.com/betteruptime)
over the week end, looking pretty good status.speakbox.ca
[\
\
Valentin Prugnaud 🦊\
\
@valentinprgnd\
\
](https://twitter.com/valentinprgnd/status/1435163698201464832)
[@BetterUptime](https://twitter.com/betteruptime)
status page looks SO neat! A fantastic tool for SaaS products like @Snapodcast
[\
\
TonyHe\
\
@ttttonyhe\
\
](https://twitter.com/ttttonyhe/status/1433488160294678529)
I'm utterly blown away by [@LogTailHQ](https://twitter.com/logtailhq)
and [@BetterUptime](https://twitter.com/betteruptime)
! They do everything. I'm now monitoring one of our US servers for every kind of log Ubuntu creates, custom alerts for errors, website downtime, incident logging, Slack notifications, S3 log storage, and loads more. 😍
[\
\
Darren Pinder\
\
@dmpinder\
\
](https://twitter.com/dmpinder/status/1446246301407105033)
We have set up a shiny system status page. Check it out status.ghostfol.io
[\
\
Ghostfolio\
\
@ghostfolio\_\
\
](https://twitter.com/ghostfolio_/status/1429071692886913030)
Show more
###### Loved by teams around the world


###### Sign up for free
#### Get up & running
in 30 seconds
Get notified with a radically better
infrastructure monitoring platform.
Start in 30 seconds
Start monitoring for free or
[book a demo](https://betterstack.com/book-a-demo)

---
# Intuitive Opsgenie alternative | Better Stack
Intuitive Opsgenie
alternative
================================
See why the best CTOs choose Better Stack over Opsgenie.
Start in 30 seconds
Start monitoring for free or
[book a demo](https://betterstack.com/book-a-demo)

Why choose Better Stack vs. Opsgenie
-------------------------------------
Key features

Opsgenie

Better Stack
Schedule on-call rotations from your calendar app
—

Embed system status announcement on your site
—

Heartbeat (CRON) monitoring
—

Built-in website & ping monitoring
—

Built-in status page
—

Helpful alerts
—

Beautiful dashboard
—

Phone call alerts

Unlimited
Reliability


Designed for teams and enterprises


##### Loved by teams around the world
Software engineers from high-growth startups to Fortune 500 companies choose Better Stack.


Incident management reimagined
------------------------------
Get all the debug data you need and collaborate with your colleagues on fixing the root cause of the incident.
Replaces


### On-call schedule calendar
Alert the right people at the right time by configuring your team's on-call duty rotations.

### Flexible incident escalations
Customize who gets notified based on the incident origin, severity, and context.

### Incident audit timeline
See exactly how the incident developed and evolved and who got notified with our second-by-second incident timeline.
### That's just the tip
of the iceberg

#### Screenshots & error logs
We don't just tell you that your service went down. We also tell you why.

#### Incident audit timeline
Get second-by-second timeline for every incident with detailed information about what happened and who got alerted.

#### Ping, SSL & TLD expiration
The most commonly used monitors come built-in and can be configured in a few seconds.

#### Smart incident merging
30 incidents get created at the same time? Acknowledge them with a single tap and stop your phone from ringing while fixing the issue.

#### Integrate everything
Plug in the services across all levels of your stack and get up and running in minutes, not days.

#### Cron job monitoring
Never lose a DB backup! Track your CRON jobs and serverless workers. Get alerted if they don't run correctly.
### Save big with
Better Stack
Better Stack replaces a bunch of existing tools. See how our fixed price for a team of 6 compares with PagerDuty, Pingdom, and Statuspage.io.
[See pricing](https://betterstack.com/pricing)

PagerDuty
Incident management
+

Pingdom
Uptime monitoring
+

Statuspage.io
Branded status page
\=
$ 673 /mo
6 team members, 60 monitors,
and 2,000 subscribers

Incident management with on-call

Uptime monitoring built-in

Branded status page on your own sub-domain status.domain.com
$ 269 /mo
6 team members, 60 monitors,
and 2,000 subscribers
#### Don’t just take our word for it
We're proud to be working with these incredible companies, and thankful for their feedback, suggestions, and support.
Looking for a status page? I recommend [@BetterUptime.](https://twitter.com/betteruptime)
Perfect support, answered my dms in a couple of minutes, and it's the first actual cool looking status page which allows custom domains (on the free plan 😱) haven't actually tried it, but it looks good so far.
#NotSponsor
[\
\
NeverLand\
\
@neverlandoff\
\
](https://twitter.com/neverlandoff/status/1444299269872267266)
I tested [@BetterUptime](https://twitter.com/betteruptime)
for @gamubsapp! So much easier to configure and the interface is better than @FreshworksInc!
[\
\
Quentin\
\
@glaffont\
\
](https://twitter.com/qlaffont/status/1442463552007147527)
By far [@BetterUptime](https://twitter.com/betteruptime)
has given me more pleasant surprises other tool in this space. We had an outage due to a domain name expiring, and it turns out we can even be alerted about that. Great user experience and UI on top of all the features. How is it not more popular?
[\
\
John\
\
@johncjago\
\
](https://twitter.com/johncjago/status/1462624489284513793)
One year one tool. @linear won my heart last year. This year so far, [@BetterStackHQ](https://twitter.com/betterstackhq)
is the frontrunner, well designed 👏
[\
\
Tianzhou\
\
@tianzhouchen\
\
](https://twitter.com/tianzhouchen/status/1441046890502520835)
I just checked this out, and have never been so happy that I saw an ad 👏
[\
\
Chris\
\
@chrishow\
\
](https://twitter.com/chrislhow/status/1417794338130698240)
We have now completely switched our status page to [@BetterUptime](https://twitter.com/betteruptime)
— It's all automated, pages us on all incidents and looks fantastic. Sold. status.improvmx.com
[\
\
ImprovMX\
\
@ImprovMx\
\
](https://twitter.com/ImprovMx/status/1484160652583260178)
Switched from @Statuspage to [@BetterUptime](https://twitter.com/betteruptime)
over the week end, looking pretty good status.speakbox.ca
[\
\
Valentin Prugnaud 🦊\
\
@valentinprgnd\
\
](https://twitter.com/valentinprgnd/status/1435163698201464832)
[@BetterUptime](https://twitter.com/betteruptime)
status page looks SO neat! A fantastic tool for SaaS products like @Snapodcast
[\
\
TonyHe\
\
@ttttonyhe\
\
](https://twitter.com/ttttonyhe/status/1433488160294678529)
I'm utterly blown away by [@LogTailHQ](https://twitter.com/logtailhq)
and [@BetterUptime](https://twitter.com/betteruptime)
! They do everything. I'm now monitoring one of our US servers for every kind of log Ubuntu creates, custom alerts for errors, website downtime, incident logging, Slack notifications, S3 log storage, and loads more. 😍
[\
\
Darren Pinder\
\
@dmpinder\
\
](https://twitter.com/dmpinder/status/1446246301407105033)
We have set up a shiny system status page. Check it out status.ghostfol.io
[\
\
Ghostfolio\
\
@ghostfolio\_\
\
](https://twitter.com/ghostfolio_/status/1429071692886913030)
Show more
###### Loved by teams around the world


###### Sign up for free
#### Get up & running
in 30 seconds
Get notified with a radically better
infrastructure monitoring platform.
Start in 30 seconds
Start monitoring for free or
[book a demo](https://betterstack.com/book-a-demo)

---
# Intuitive VictorOps alternative | Better Stack
Intuitive VictorOps
alternative
=================================
See why the best CTOs choose Better Stack over VictorOps.
Start in 30 seconds
Start monitoring for free or
[book a demo](https://betterstack.com/book-a-demo)

Why choose Better Stack vs. VictorOps
--------------------------------------
Key features

VictorOps

Better Stack
Schedule on-call rotations from your calendar app
—

Embed system status announcement on your site
—

Heartbeat (CRON) monitoring
—

Built-in website & ping monitoring
—

Built-in status page
—

Helpful alerts
—

Beautiful dashboard
—

Phone call alerts

Unlimited
Reliability


Designed for teams and enterprises


##### Loved by teams around the world
Software engineers from high-growth startups to Fortune 500 companies choose Better Stack.


Incident management reimagined
------------------------------
Get all the debug data you need and collaborate with your colleagues on fixing the root cause of the incident.
Replaces


### On-call schedule calendar
Alert the right people at the right time by configuring your team's on-call duty rotations.

### Flexible incident escalations
Customize who gets notified based on the incident origin, severity, and context.

### Incident audit timeline
See exactly how the incident developed and evolved and who got notified with our second-by-second incident timeline.
### That's just the tip
of the iceberg

#### Screenshots & error logs
We don't just tell you that your service went down. We also tell you why.

#### Incident audit timeline
Get second-by-second timeline for every incident with detailed information about what happened and who got alerted.

#### Ping, SSL & TLD expiration
The most commonly used monitors come built-in and can be configured in a few seconds.

#### Smart incident merging
30 incidents get created at the same time? Acknowledge them with a single tap and stop your phone from ringing while fixing the issue.

#### Integrate everything
Plug in the services across all levels of your stack and get up and running in minutes, not days.

#### Cron job monitoring
Never lose a DB backup! Track your CRON jobs and serverless workers. Get alerted if they don't run correctly.
### Save big with
Better Stack
Better Stack replaces a bunch of existing tools. See how our fixed price for a team of 6 compares with PagerDuty, Pingdom, and Statuspage.io.
[See pricing](https://betterstack.com/pricing)

PagerDuty
Incident management
+

Pingdom
Uptime monitoring
+

Statuspage.io
Branded status page
\=
$ 673 /mo
6 team members, 60 monitors,
and 2,000 subscribers

Incident management with on-call

Uptime monitoring built-in

Branded status page on your own sub-domain status.domain.com
$ 269 /mo
6 team members, 60 monitors,
and 2,000 subscribers
#### Don’t just take our word for it
We're proud to be working with these incredible companies, and thankful for their feedback, suggestions, and support.
Looking for a status page? I recommend [@BetterUptime.](https://twitter.com/betteruptime)
Perfect support, answered my dms in a couple of minutes, and it's the first actual cool looking status page which allows custom domains (on the free plan 😱) haven't actually tried it, but it looks good so far.
#NotSponsor
[\
\
NeverLand\
\
@neverlandoff\
\
](https://twitter.com/neverlandoff/status/1444299269872267266)
I tested [@BetterUptime](https://twitter.com/betteruptime)
for @gamubsapp! So much easier to configure and the interface is better than @FreshworksInc!
[\
\
Quentin\
\
@glaffont\
\
](https://twitter.com/qlaffont/status/1442463552007147527)
By far [@BetterUptime](https://twitter.com/betteruptime)
has given me more pleasant surprises other tool in this space. We had an outage due to a domain name expiring, and it turns out we can even be alerted about that. Great user experience and UI on top of all the features. How is it not more popular?
[\
\
John\
\
@johncjago\
\
](https://twitter.com/johncjago/status/1462624489284513793)
One year one tool. @linear won my heart last year. This year so far, [@BetterStackHQ](https://twitter.com/betterstackhq)
is the frontrunner, well designed 👏
[\
\
Tianzhou\
\
@tianzhouchen\
\
](https://twitter.com/tianzhouchen/status/1441046890502520835)
I just checked this out, and have never been so happy that I saw an ad 👏
[\
\
Chris\
\
@chrishow\
\
](https://twitter.com/chrislhow/status/1417794338130698240)
We have now completely switched our status page to [@BetterUptime](https://twitter.com/betteruptime)
— It's all automated, pages us on all incidents and looks fantastic. Sold. status.improvmx.com
[\
\
ImprovMX\
\
@ImprovMx\
\
](https://twitter.com/ImprovMx/status/1484160652583260178)
Switched from @Statuspage to [@BetterUptime](https://twitter.com/betteruptime)
over the week end, looking pretty good status.speakbox.ca
[\
\
Valentin Prugnaud 🦊\
\
@valentinprgnd\
\
](https://twitter.com/valentinprgnd/status/1435163698201464832)
[@BetterUptime](https://twitter.com/betteruptime)
status page looks SO neat! A fantastic tool for SaaS products like @Snapodcast
[\
\
TonyHe\
\
@ttttonyhe\
\
](https://twitter.com/ttttonyhe/status/1433488160294678529)
I'm utterly blown away by [@LogTailHQ](https://twitter.com/logtailhq)
and [@BetterUptime](https://twitter.com/betteruptime)
! They do everything. I'm now monitoring one of our US servers for every kind of log Ubuntu creates, custom alerts for errors, website downtime, incident logging, Slack notifications, S3 log storage, and loads more. 😍
[\
\
Darren Pinder\
\
@dmpinder\
\
](https://twitter.com/dmpinder/status/1446246301407105033)
We have set up a shiny system status page. Check it out status.ghostfol.io
[\
\
Ghostfolio\
\
@ghostfolio\_\
\
](https://twitter.com/ghostfolio_/status/1429071692886913030)
Show more
###### Loved by teams around the world


###### Sign up for free
#### Get up & running
in 30 seconds
Get notified with a radically better
infrastructure monitoring platform.
Start in 30 seconds
Start monitoring for free or
[book a demo](https://betterstack.com/book-a-demo)

---
# Engineering at Better Stack | Better Stack
Engineering
at Better Stack
================================
We are software builders at Better Stack.
CEO is a software engineer, COO is a software engineer and you guessed it; CTO is an engineer, too.
[We’re helping developers ship higher quality software faster.](https://betterstack.com/careers)
If you love building amazing software, you’re at the right address.
[](https://www.destroyallsoftware.com/talks/wat)
Video by the amazing Gary Bernhardt from [destroyallsoftware.com](https://destroyallsoftware.com/)
A few tweets we live by
-----------------------
[\
\
Move faster. Slowness anywhere justifies slowness everywhere.This week instead of next week. Today instead of tomorrow. Moving fast compounds so much more than people realize.\
\
Sam Altman @sama](https://twitter.com/sama/status/1345140364995227648)
[\
\
As a startup, always bias toward simple. Customers will tell you when your product doesn't do enough, but will never ask for fewer features when they stop using your product because it's too complex.\
\
Aaron Levie @levie](https://twitter.com/levie/status/1137902376549998592)
[\
\
How to make teams productive:\
\
* keep them very small\
* have as few priorities as you can\
* do as few hours of meetings as possible\
\
Jack Altman @jaltma](https://twitter.com/jaltma/status/1282731995106209792)
[\
\
The secret to scaling: designers who code, engineers who design, marketers who write SQL, PMs who write copy, customer support folks who open PRs, leaders who do support.\
\
The more skills overlap, the less people need to meet, the more gets shipped.\
\
Sahil @shl](https://twitter.com/shl/status/1349848397516193792)
Speed & developer productivity matters
--------------------------------------
Speed & developer productivity matters.
No. 1 thing that kills startups is that they don’t manage to make something people want.
Ugly code doesn’t kill startups. Competition doesn't kill startups.
Companies die when they run out of money before they manage to create a delightful product.
But you never really know if your product is going to work… until it does.
The no. 1 priority of a great startup is to move fast(er).
That's why we optimize for a pragmatic style of software development that allows us to move at an unrivaled speed & quality and ship products faster than our better-funded competitors.
Who we are looking for
----------------------
* Writing software is your hobby.
* You tend to start side projects to try out new technologies.
* You're the kind of person who’d consider writing a web scraper to compare rents & house prices in order to find the best place to live.
* In other words, you can take a rough idea and make it into a live app.

Photo from Twitter by [Rich Harris](https://twitter.com/Rich_Harris/status/1338314019736875008)
How our interviews work
-----------------------
Our interviewers actually ask you about the things you'd do on the job.
Sure, we do ask a few Google-like algorithm questions, but we mainly want you to solve a number of real-world problems you can come across the next day on the job.
No need to revise algorithms and data structures before interviewing with us.
Afterwards, we always ask for your feedback so that we can improve with the next interview round.
What you’ll do
--------------
You’ll have a massive impact on the business. Seriously, your work needs to be visible like a crater here. We’re a small startup, there's no space for free riders here. Every single team member brings a unique skill to the table.
Our tech stack
--------------
We don’t care if you worked with a completely different tech stack until now. Amazing software engineers like you can pick up new frameworks quickly.
Our stack is not set in stone either. Come with solid reasons for doing things differently and we’ll change our best practices!
* Ruby on Rails
* PostgreSQL, Redis, and ClickHouse
* Vue.js, [Vanilla.js](http://vanilla-js.com/)
, [Turbo](https://turbo.hotwired.dev/)
, Turbo.js, ES6, and Tailwind
* Docker, Prometheus, Grafana
The right time to apply was yesterday
-------------------------------------
No, seriously. Something magical happens in fast-growing startups before they cross 30-40 people.
Google or any other bigTechCo is going to be the same as today in a few years. You can always join them later.
Startups are different, however. Things change rapidly from one week to another.
You will learn more than you ever thought was possible.
If you ever wanted to experience your own Silicon Valley way of building a global software startup, [reach out today](https://betterstack.com/careers/open-positions)
.
### Open roles
Remote
Remote (North America & Europe)
Hardcore mode
Work 1.5x the hours, earn 2x the compensation
/^Full-?stack Engineer$/i
$60K - $300K/year + equity $120K - $600K/year + equity · Remote Prague
Founding Product Engineer
$150K - $400K/year + equity $300K - $800K/year + equity · Remote Prague
Recruiter
$50K - $100K/year + equity $100K - $200K/year + equity · Remote Prague
Customer Engineer
$60K - $120K/year + equity $120K - $240K/year + equity · Remote Prague
Customer Advocate
$30K - $120K/year + equity $60K - $240K/year + equity · Remote Prague
/^Full-?stack Engineer$/i
$60K - $300K/year + equity $120K - $600K/year + equity · Remote Prague
Founding Product Engineer
$150K - $400K/year + equity $300K - $800K/year + equity · Remote Prague
Recruiter
$50K - $100K/year + equity $100K - $200K/year + equity · Remote Prague
Customer Engineer
$60K - $120K/year + equity $120K - $240K/year + equity · Remote Prague
Customer Advocate
$30K - $120K/year + equity $60K - $240K/year + equity · Remote Prague
### /^Full-?stack Engineer$/i
Hardcore
Remote (North America & Europe)
Prague
$60K - $300K/year + equity
$120K - $600K/year + equity
[Apply](https://betterstack.typeform.com/apply-engineer)
The challenge
Read about [how we think about software](https://betterstack.com/careers/engineering)
and [what it’s like to work here](https://betterstack.com/careers)
.
We’re designing a product by engineers, for engineers. Our CTO, CEO, and COO are all software builders who understand what it takes to craft elegant, efficient, and delightful products. And we’re continuously looking for more amazing engineers to help us create high-quality software with exceptional UX—end to end.
You’ll do more than write code. You’ll shape the [product user experience](https://juraj.blog/p/consistency)
, polish user interface, optimize backend performance, benchmark database queries, and ship secure, scalable software. **We’re looking for software engineers who, if given enough time, could build Better Stack on their own.** This role is not about filling a narrow niche but taking ownership and shipping impactful software that users love.
We believe the best software engineers are at [least 100x more productive](https://juraj.blog/p/100x-software-engineering)
than the average ones, as they can pragmatically switch between [different styles of engineering](https://juraj.blog/p/two-sides)
. We don’t think of [software engineers as a commodity](https://juraj.blog/p/we-are-hiring-42-engineers-this-year)
.
What you’ll do
* **Use AI to aggressively ship high-quality code.** We expect you to [be on top of the latest tools](https://x.com/jurajmasar/status/1962465031720731118)
, models and trends in AI-assisted software engineering. We think that using AI is no longer optional. We expect you to be amazing at prompting, to know when to leverage different models, and to have first-hand experience with Claude Code, Cursor, and opencode among others. At the same time, we expect you know when _not_ to use LLMs and instead debug or design an algorithm by hand. We’re not looking for vibe coders.
* You’ll implement, test, and deploy secure, fast, and scalable code in production—**independently** or with lightweight collaboration.
* Work directly with our CTO, CEO, and our designer to deliver end-to-end features, from backend to frontend, within a single day.
* Use our modern yet opinionated tech stack—Ruby on Rails, PostgreSQL, Redis, ClickHouse, Redpanda, JavaScript, Vue.js, Tailwind, Docker, and more.
* Keep our frontend fast and consider SEO & AEO.
* Ship software while maintaining security and performance across the stack—**understanding basic web security principles** without over-relying on frameworks.
* Collaborate asynchronously while avoiding unnecessary meetings.
We trust you to manage your time and ship.
This might be for you if
* **Software is your hobby.** You’ve written web scrapers for fun, built apps for personal use, or explored side projects to learn new tech.
* **You love shipping things end-to-end.** Styling buttons in the morning, adjusting the database schema at noon, and deploying to production in the afternoon? You’ll like it here.
* **You value speed and pragmatism.** You know how to prioritize and [cut the right 5% of a feature to simplify its implementation by 100x.](https://juraj.blog/p/100x-software-engineering)
* **You take security very seriously,** without blindly relying on modern frameworks.
* **You write fast software.** From optimizing SQL queries to reducing frontend reflows and choosing the right number of threads, you’re always looking for ways to keep applications fast.
* **You’re a generalist.** You don’t need to be an expert in every area of software engineering, but you’re comfortable wearing multiple hats and learning quickly.
* **You care about UI and UX.** Pixel-perfect designs and seamless user flows aren’t “just for designers.” [Refactoring UI](https://www.refactoringui.com/)
is/would be your go-to guide.
* **You prefer fewer meetings and more doing instead.** Team stand-ups? No thanks. Async tools and clear communication? Yes, please.
* It’s great if you’ve worked with our stack **but it’s definitely not a requirement.** We need you to be flexible about the tools you use. Great software engineers can pick up new stack fast. As far as you worked with some web technologies and at least some SQL databases, you’re just fine!
* **You agree that software engineers are the artists of our age.**
Read [Paul Graham](https://www.paulgraham.com/)
’s [Hackers and Painters](https://www.amazon.com/Hackers-Painters-Big-Ideas-Computer/dp/1449389554)
, one of our favorite books.
Who you’ll work with
* We consider our team to be a professional sports team. Everyone aims to be the best in the world in what they do. From YC alumni to ex-Google and ex-Shopify colleagues, you’ll be in great company.
* Our founders Juraj (CEO) and Veronika (COO), and Tomas (CTO) who remain hands-on and ship code.
* Our 1-man design team Juraj jr., and Simon, engineer turned technical product manager, who ensure that every feature you build looks and feels incredible and consistent with the rest of the product.
[Apply](https://betterstack.typeform.com/apply-engineer)
### Founding Product Engineer
Hardcore
Remote (North America & Europe)
Prague
$150K - $400K/year + equity
$300K - $800K/year + equity
[Apply](https://betterstack.typeform.com/apply-engineer)
The challenge
Please start by reading the description of the /^Full-?stack Engineer$/i role.
You need to be an **amazing full-stack engineer** before moving to the Founding Product Engineering role.
You can also read about [how we think about software](https://betterstack.com/careers/engineering)
and [what it’s like to work here](https://betterstack.com/careers)
.
What you’ll do
* You’ll essentially run a startup within a startup.
* You’re ready to work extremely hard. This is a senior role with high expectations.
* Given enough time, you’d be able to build Better Stack from scratch and take others with you along the way.
* You’re an extremely strong /^Full-?stack Engineer$/i.
* You can analyze business models and you’re the kind of person who constantly comes up with new product ideas.
* You’re able to validate your product idea with pre-product design interviews.
* You’re [great at user experience](https://sensible.com/dont-make-me-think/)
and copywriting.
* You can design and build a [simple, lovable, and complete product](https://longform.asmartbear.com/slc/)
.
* You understand the [difference between prototyping and production engineering](https://juraj.blog/p/two-sides)
.
* You’re not just a product manager or an engineering manager. During the first year of the product, you’ll be the most active code committer in the product’s Github repository. You’ll be leading your team by example from the front lines.
* You know that a product without distribution is useless, you read the [Coldstart problem](https://a16z.com/books/the-cold-start-problem/)
, and admire products with built-in virality.
* You’re a skilled engineering manager, both [a people manager](https://juraj.blog/p/giving-feedback)
, and [a strong technical leader](https://juraj.blog/p/100x-software-engineering)
.
* You love data and you watched [Alex Schultz’s lectures on growth](https://www.youtube.com/watch?v=n_yHZ_vKjno)
. You’re ready to watch the first 10,000 Fullstory session recordings of people using your product.
* You’re a decent sales person. You can hop on a podcast, give a lecture, and fly across the country for a product demo.
Why you should work with us
* Reading the above, you should be thinking: "if I can do all of those things, should I just start a startup myself?". Maybe you should! If that’s you, in fact you might be the perfect person for this job. Hear me out.
* Working with us, as opposed to starting your own startup, has multiple advantages:
* **You know you’ll get paid.** Most startups go to 0. With Better Stack you get no downside, yet an unlimited upside.
* **You’ll have way less stress.** You don’t have the balance sheet to worry about. You don’t need to calculate the runway till going bankrupt.
* Although you should be great at leading technical teams, **we’ll help you with the ugly side of managing people**. We’ll have your back.
* **You don’t have to deal with legal, operations, compliance or VCs.** You can fully focus on building great products. That’s a luxury most startup CEOs don’t have.
* **You’ll learn _a lot_.** You’ll work with the team who built Better Stack from the ground up. We’ve seen the story of building both successful and failed products many times. You’ll go faster with us.
* You can fully leverage Better Stack’s existing resources to make your product successful: our data processing infrastructure, consistent UI/UX language, the strong developer brand, and [our strong existing distribution](https://www.youtube.com/@betterstack)
.
* There’s close to 0 bureaucracy & politics at Better Stack. Your success will be fully in your hands.
* ...and you can always start your company afterwards!
[Apply](https://betterstack.typeform.com/apply-engineer)
### Recruiter
Hardcore
Remote (North America & Europe)
Prague
$50K - $100K/year + equity
$100K - $200K/year + equity
[Apply](https://betterstack.typeform.com/apply-non-tech)
The challenge
* Better Stack has an unusually high concentration of makers.
* Every manager is an individual contributor and there’s close to 0 bureaucracy and politics.
* If you like meetings and 'strategy sessions', probably look elsewhere.
* But if you like winning and feel great about getting stuff done, you might love it here!
* Help us find like-minded makers that want to build the future of software.
* The way we work is quite different to most places. In fact, [most people would probably not want to work with us](https://old.reddit.com/r/ruby/comments/1gq860d/new_level_of_interview_hell/)
, and we think that’s ok! Most people should not build early stage startups, in fact.
* When done right, however, [even candidates we reject enjoy the interview experience](https://share.cleanshot.com/t6HMFwjF)
and learn a lot.
* If you’re smart, open minded, driven and can think for yourself, read on!
What you’ll do
* **Scout for new talented colleagues,** coordinate the hiring process, extend offers, and be the candidate’s voice throughout the company.
* **Talk to many new people every week** (20+ intro chats per week) and create genuine connections.
* **Balance inbound vs outbound hiring,** learning to spot candidates even if they never applied or may not have direct prior experience.
* **Work directly with both of our co-founders, our CTO,** and more teammates on bringing the very best people on board on-site in Prague as well as remotely in Europe and the US.
* Be in charge of creating an **[11-star candidate experience](https://www.youtube.com/watch?v=ntvueIsgQwc)
.**
* **[Craft extraordinary employer branding](https://www.youtube.com/watch?v=12D8zEdOPYo)** and make the company an obvious interview choice for talented candidates.
* **A great startup culture needs to be founder-driven.** You’ll be the fail-safe to make sure nothing falls through the cracks.
This might be for you if
* You **enjoy pitching a candidate the mission,** culture, product, and our work style.
* Learn fast and can [discuss engineering topics with engineers](https://betterstack.com/careers/engineering#our-tech-stack)
.
* You consider yourself **full-stack,** managing all aspects of recruiting, from sourcing to conducting intro calls with candidates, coordinating all stages of the interview process, and helping to extend the offer or providing the candidate with valuable feedback.
* You don’t hesitate to do a lot of outbound and you’re not waiting for candidates to apply on their own.
* You enjoy delighting candidates throughout the process by being fast, transparent, energetic, and kind.
* You have a builder’s mindset. There’s plenty of things we’re doing already, but a lot more we could be doing in the future!
* You are curious. You enjoy checking the latest trends and never miss an opportunity to read a good book, listen to a podcast episode, or watch a talk on talent or startup-related topics and share that knowledge.
Who you’ll work with
* A team of smart and talented colleagues who are extraordinary at what they do and collaborate together to build an amazing product. Namely:
* [Juraj](https://www.linkedin.com/in/jurajmasar/)
& [Veronika](https://www.linkedin.com/in/veronikakolejak/)
, both our co-founders, are hands-on and close to hiring every new colleague who joins the team. They’re the kind of founders who not only say the company is only as good as the people within the company; they act on it and are always ready to help bring more talented teammates on board. Both of them still interview all the candidates too, of course.
* [Tomas](https://www.linkedin.com/in/tom%C3%A1%C5%A1-hromada-8568344a/)
, our CTO, engaged in sourcing, interviewing, extending offers, and onboarding.
* [Magdalena](https://www.linkedin.com/in/magdalenahavlickova/)
has lived and traveled all over the world, which helps her connect with candidates and shape how Better Stack is seen from the outside. She takes care of growth, marketing, and technical recruiting, always juggling multiple hats with a focus on operational excellence. She is also a supporter of the [Ruby community.](https://www.linkedin.com/posts/magdalenahavlickova_grateful-for-the-chance-to-share-lessons-activity-7344846153022074880-4Dbm?utm_source=share)
* [Anna](https://www.linkedin.com/in/anna-rojkova/)
, our head of operations, who previously ran a space company developing software for satellites and probes.
Where to go next?
* Read about [what it’s like to work here](https://betterstack.com/careers)
– feel the atmosphere, understand the culture.
* Read more about how we [think about software engineering](https://betterstack.com/careers/engineering)
. It’s quite different from other companies! (Most of the principles we describe there apply to other parts of the company as well.)
[Apply](https://betterstack.typeform.com/apply-non-tech)
### Customer Engineer
Hardcore
Remote (North America & Europe)
Prague
$60K - $120K/year + equity
$120K - $240K/year + equity
[Apply](https://betterstack.typeform.com/apply-engineer)
The challenge
* Customers at the core of everything we do here and we strive to deliver an [11-star experience](https://coda.io/@reidhoffman/rituals-of-great-boards/11-star-experience-6)
to each and every one of them.
What you’ll do
* **Be the engineering guide for CTOs implementing Better Stack.** Work with engineers from companies around the world to implement the best in class observability.
* **Solve customer’s engineering challenges.** Identify issues, design and analyze the best solutions, or hop on a call to discuss your recommendations with your customers.
* **Dive into our code, monitoring dashboards, Vector configs** and get creative with solutions for any kind of stack our customers use.
* **Empower our customers** and help them implement the best practices for logging and incident management.
* **Shape the user experience** of our products. By talking with our customers daily, you’ll know what matters to them the most. Help make our tools the vehicle through which the engineering magic happens.
* **Bring your unique perspective** on how to solve any challenges that our customers may come across.
This might be for you if
* **You have an engineering background** and like our approach to [engineering](https://betterstack.com/careers/engineering)
culture.
* You are passionate about **driving change from the start to the finish line.** It will be up to you to talk with our customers, draft out the solutions, and solve their technical challenges.
* You are an **excellent and effective communicator with native-level English skills.** Both written and spoken form.
* **You are independent, resourceful, and not afraid to roll up your sleeves.**
* **You want to help us [build love brand](https://www.youtube.com/@betterstack)
.**
Who you’ll work with
* A team of smart and talented colleagues who are extraordinary at what they do and collaborate together to build an amazing product. Namely:
* [Veronika](https://linkedin.com/in/veronikakolejak/)
, our co-founder & COO, who was previously at Google and Shopify.
* [Simon](https://www.linkedin.com/in/simon-let/)
, our amazing engineer turned technical product manager.
* [Tomas](https://www.linkedin.com/in/tomas-hromada/)
, our CTO, hands on engineering wizard who still ships code daily.
Where to go next?
* [What it’s like to work here](https://betterstack.com/careers)
– feel the atmosphere, understand the culture.
* [How we think about software engineering](https://betterstack.com/careers/engineering)
(most of the principles we describe there apply to other parts of the company as well 😉).
[Apply](https://betterstack.typeform.com/apply-engineer)
### Customer Advocate
Hardcore
Remote (North America & Europe)
Prague
$30K - $120K/year + equity
$60K - $240K/year + equity
[Apply](https://betterstack.typeform.com/apply-non-tech)
The challenge
* Customers at the core of everything we do here and we strive to deliver an [11-star experience](https://coda.io/@reidhoffman/rituals-of-great-boards/11-star-experience-6)
to each and every one of them.
What you’ll do
* **Own your portfolio of client companies.** Educating their teams on new best practices, upselling them on new features, and helping them jump through the hoops of procurement departments. Think of it as being a consultant but [owning your work in the long-term](https://www.youtube.com/watch?v=-c4CNB80SRc&ab_channel=Malonus)
.
* **Build business relationships.** Be it a CTO, engineering team lead, or an indie hacker. We give everyone the [11-star experience](https://coda.io/@reidhoffman/rituals-of-great-boards/11-star-experience-6)
approach in everything we do.
* **Solve customer’s problems.** Identify issues, design and analyze the best solutions, or even hop on a call to discuss your recommendations with your customers.
* **Bring your unique perspective** on how to solve any challenges that our customers may come across.
This might be for you if
* You want to be a part of **a high-growth environment** and **engage in a client-facing consultant & advocacy role.**
* **You are passionate about learning and dive head straight into any challenge.** It will be up to you to discuss the technical challenges, organizational goals of our customers and be **responsible for driving the solutions from the start to the finish line.**
* You are an **excellent and effective communicator with native-level English skills.** Both written and spoken form.
* **You are independent, resourceful, and not afraid to roll up your sleeves.**
* **You want to help us [build love brand](https://www.youtube.com/@betterstack)
.**
Who you’ll work with
* A team of smart and talented colleagues who are extraordinary at what they do and collaborate together to build an amazing product. Namely:
* [Veronika](https://linkedin.com/in/veronikakolejak/)
, our co-founder & COO, who was previously at Google and Shopify.
* [Filip](https://www.linkedin.com/in/filipminhhoang/)
, our technical magician, who can help setup anything from config for an indie hacker to the migration of a 300-strong team.
* Our amazing engineers, whose wizard-level skills can solve any technical problem and are always willing to help, as well as our customer success and sales teams.
Where to go next?
* [What it’s like to work here](https://betterstack.com/careers)
– feel the atmosphere, understand the culture.
* Read about [How we think about software engineering](https://betterstack.com/careers/engineering)
.
[Apply](https://betterstack.typeform.com/apply-non-tech)
### Please accept cookies
We use cookies to authenticate users, improve the product user experience, and for [personalized ads](https://business.safety.google/privacy/)
. [Learn more.](https://betterstack.com/privacy)
Deny Accept required Accept all
---
# AI SRE agent for on-call | Better Stack
Hire an AI SRE
==============
Slack-native AI SRE agent that investigates incidents using your logs, metrics, traces, errors, and web events.
Sign up for free
Enterprise deployment? [Book a consultation](https://betterstack.com/book-a-demo)

Relied on by the world’s best engineering teams
* * *
Get an agent to resolve incidents with you at 3 am
--------------------------------------------------
In-depth root cause analysis based on the eBPF-based service map, OpenTelemetry traces, logs, metrics, errors, and web events.

#### Agentic root cause analysis
Correlate recent deployments, errors, trace slowdowns, changes in trends within metrics, and recent logs to suggest hypotheses for what went wrong.

#### Plug in Datadog, Grafana, Sentry, Linear, and Notion
As well as all your logs, metrics, traces, errors, and web events ingested directly into Better Stack.

#### Get a service map with eBPF & OpenTelemetry
Instrument your code without any code changes thanks to eBPF and get host metrics, and RED metrics for services across your stack.
* * *
Chat online, inside Slack and in Claude Code using the MCP
----------------------------------------------------------
Focus on resolving the incident instead of context-switching between tools. Call the AI SRE from Slack, MS Teams, or your existing LLM workflows.
 
#### Human-in-the-loop approval
You're always in control. The AI SRE suggests hypotheses but never takes any automated actions without your approval. Get help when investigating an incident while remaining in charge.

#### Designed for Slack and MS Teams
Discussing an incident in Slack? Call the AI SRE simply by tagging @betterstack.

#### Robust MCP server
Integrate your logs, metrics, traces, web events, and errors into your existing LLM workflows with a top tier MCP server. Render charts directly in Claude Desktop.
* * *
Resolve incidents faster, get more stuff done
---------------------------------------------
Get pull requests for new errors, query your data in natural language, and leverage built-in incident management with on-call.
 
#### Get pull requests for new errors
Got an exception? Get a pull request with a suggested fix waiting for you in GitHub.
Did the HTTP latency increase in eu-west too or just in us-east and us-west?


#### Ask a question, get a chart
It's like Claude with all your data built-in. Get recent logs or chart visualizations by simply asking in natural language.

#### Incident management & on-call built-in
Get a second-by-second timeline of what happened and leverage the built-in on-call schedule to escalate the incident to the right person.
* * *
AI‑native workflows built‑in
----------------------------

#### Linear tickets suggested by AI
Downtime? Create Linear tickets using AI‑based suggestions.

#### AI written post-mortems
Get an automated post-mortem based on the incident timeline and Slack.

#### Explain with AI
Analyze logs, errors, MTR, trace route, SSL certificates or connection errors.
* * *
Secure, scalable & compliant
----------------------------
Everything your data privacy officer requires so that you can pass audits with a peace of mind.

#### SOC 2 Type 2
Request our SOC 2 Type 2 attestation upon signing an NDA.

#### GDPR-compliant
Comply with European Union’s general data privacy regulation.

#### ISO 27001 data centers
Ensuring strict data security standards.
Relied on by the world’s best engineering teams
Happy customers, growing market presence
----------------------------------------
Get started today. Try Better Stack risk-free with our 60-day money-back guarantee.
Ship higher-quality software faster. Be the hero of your engineering teams.
Integrate in 5 minutes
Enterprise deployment? [Book a consultation](https://betterstack.com/book-a-demo)
### Please accept cookies
We use cookies to authenticate users, improve the product user experience, and for [personalized ads](https://business.safety.google/privacy/)
. [Learn more.](https://betterstack.com/privacy)
Deny Accept required Accept all
---
# OpenTelemetry-native log management by Better Stack
OpenTelemetry-native log management
===================================
30x cheaper than Datadog. Predictable pricing.
Exceptional customer support.
Start for free
Datadog bill too high? Migrate today, the rest of your contract is on us.
Migration assistance and bespoke onboarding included. [Book a consultation](https://calendly.com/betterstack/consultation-migrating-from-datadog)
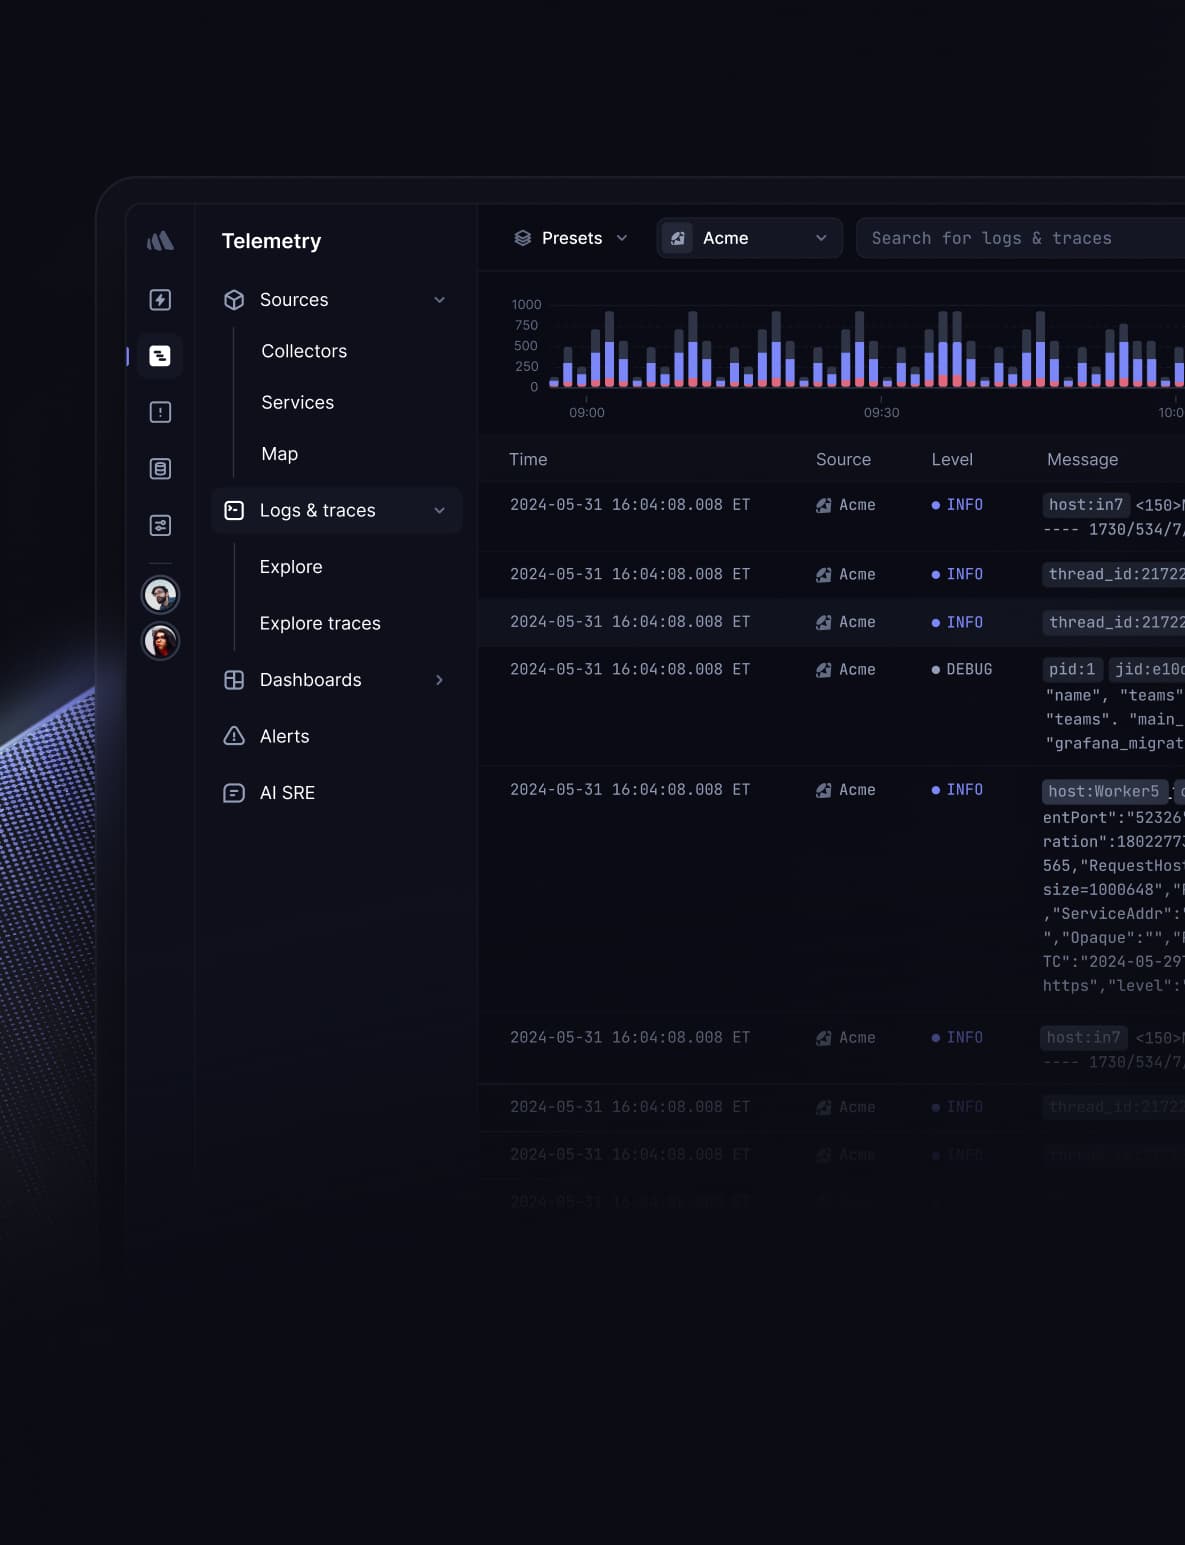 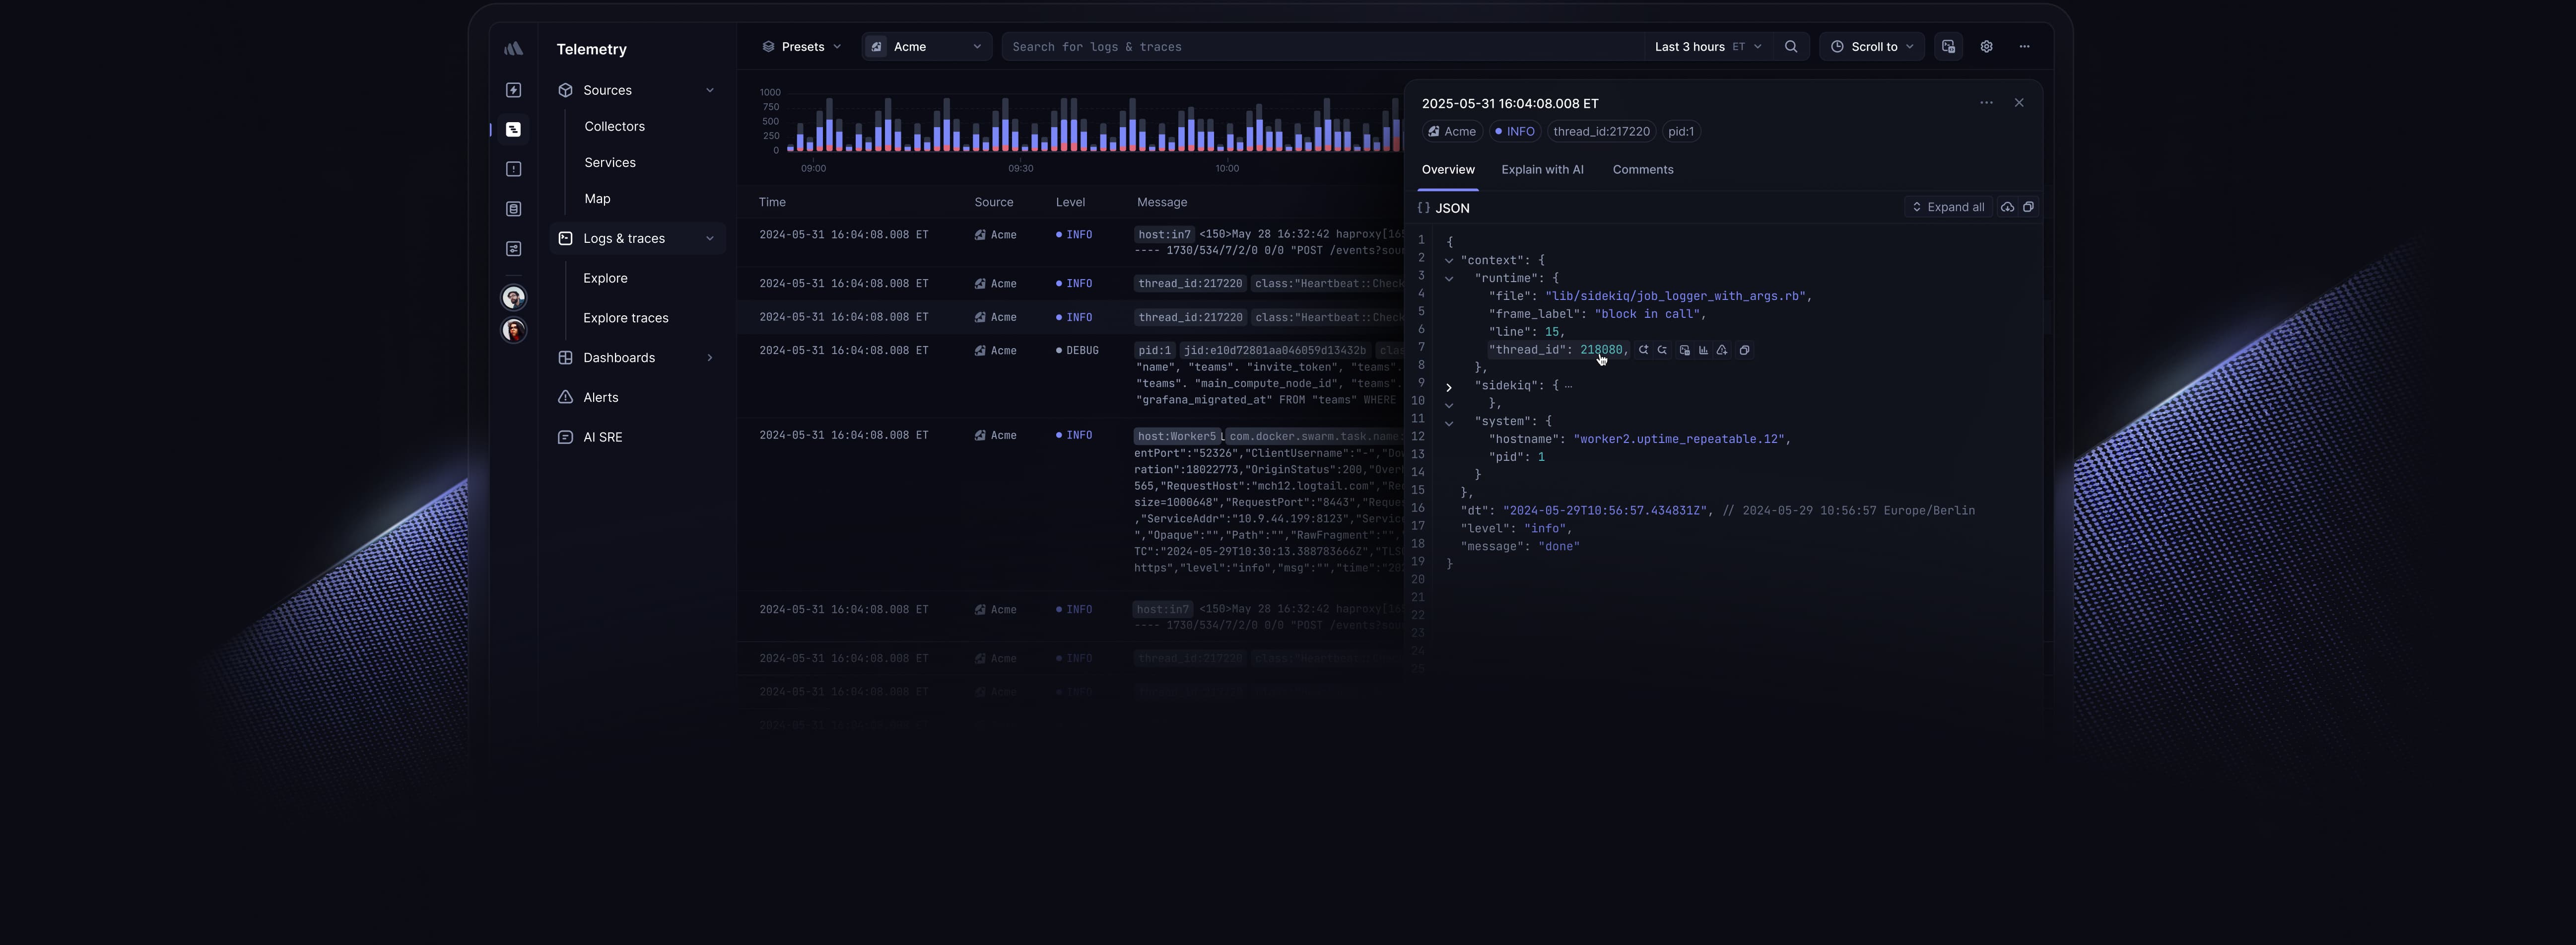
Relied on by the world’s best engineering teams
* * *
At a fraction of
your current costs
-------------------------------------
Get an unrivaled price-to-performance ratio. Forget sampling and ingest all your data or decrease your costs by 80x.
[Explore pricing](https://betterstack.com/pricing#logs)
Ingest up to
80x more data
with the same budget
or save up to
98%
of your costs
1 TB traces per month
1 TB logs per month
1 TB metrics per month
Datadog
approx. $55,574 per month
Better Stack
$687 per month
An estimate only. Assumes annual payments, European data location, 1 responder with a Tera bundle, the average event size of 1 kB, $5 per 100 Datadog's "custom metrics". Assumes 1,000 Datadog "custom metrics" equivalent to 1 GB metrics. Further assumes Datadog's $0.1 per ingested GB of spans & logs, and $2.5/million indexed spans & logs for 30 days. Adds up to $51,200 for metrics, $2,787 for logs, and $2,787 for spans per month.
* * *
Get an AI SRE
-------------
Claude Code with the knowledge of your infrastructure.
Give LLMs the power of your telemetry data.
[Watch a demo](https://betterstack.com/demos/ai-sre/)
 
### Get an AI SRE to resolve
incidents with you at 3 am
Leverage automated root cause analysis based on the eBPF-based service map & log analysis. You’re always in charge.
Did the HTTP latency increase in eu-west too or just in us-east and us-west?


#### Robust MCP server
Integrate your telemetry data into your existing LLM workflows with a top tier MCP server.

#### You’re always in control
The AI SRE suggests hypotheses but never takes any automated actions without your approval. Get help when investigating an incident while remaining in charge.
* * *
Instrument clusters without code changes thanks to eBPF
-------------------------------------------------------
Connect your Kubernetes or Docker clusters to gather logs, metrics, and network traces with eBPF. No code changes required.

### Ship logs with our remotely controlled eBPF collectors
Leverage our remotely controlled collector to gather logs, metrics, and traces using eBPF and OpenTelemetry. Remotely monitor collector’s throughput and adjust sampling, compression, and batching as needed.

#### Turning plaintext logs into structured JSON
All your data is stored in a structured format, which makes searching beautifully simple. Click on the
user e-mail or thread ID and filter the right context
with a single click.


#### Mark useless logs “as spam” and don’t get billed
Transform logs, spans or other wide events with VRL to redact personally identifiable information or simply discard useless events so that you don’t get billed.
* * *
Built for OpenTelemetry
-----------------------
Future-proof your applications with OpenTelemetry-native observability. Retain the option to change vendors, and optimize costs as needed. You’re in charge.


### Explore with “bubble up”
Investigate slow requests visually with drag & drop. Simply select the right services and timeframe to instantly see the root cause of slow requests.

#### eBPF-based service map
Monitor network flows, auto-instrument databases, and track SLOs of individual services. Everything out-of-box with the Better Stack collector.

#### Sophisticated anomaly detection
Leverage our recommended alerts or the automated anomaly detection and get alerted via Slack, e-mail, phone, SMS, and more. Incident management & on-call is built-in.


### Request breakdown, Apdex, and RED metrics
Everything you need to understand the overall health of a service in a single dashboard.
* * *
Powerful log analysis at scale
------------------------------
Aggregate all your logs as structured data and query them using Live tail filtering, an intuitive drag & drop builder, SQL or PromQL.


### Custom dashboards with a
Drag & drop query builder
Drag & drop the metrics you want to display and visualize them instantly. No SQL code necessary.

#### Analyze with SQL or PromQL
Get answers fast with a powerful SQL and PromQL query builders. No need to learn a new querying language or ask your data analyst.

#### One-click pattern filtering
Spot trends instantly with automatic pattern detection. Group similar logs, filter or exclude patterns in a single click, cut through the noise, and debug faster.


### Sample raw logs during query time
Analyze trends with ad-hoc queries on large data sets with our built-in sampling.
* * *
Ingest JSON wide events at scale, get sub-second analytical queries
-------------------------------------------------------------------
Powered by a purpose-built data processing pipeline able to process petabytes to exabytes of JSON wide events without cardinality limitations. Get sub-second dashboards, versatile querying APIs at an unbeatable unit cost.

### Wide events & time series
Get the best of both worlds: scalability and cost-efficiency of JSON wide events stored in object storage, and fast analytical queries with highly compressed time series stored on local NVMe SSD drives.
[Learn more](https://betterstack.com/docs/logs/wide-events-time-series/)

#### Available in 4 regions, custom deployments on request
Use self-serve clusters in Virginia, Oregon, Germany or Singapore or [request a custom cluster](mailto:hello@betterstack.com?subject=I%27m%20interested%20in%20custom%20deployment&body=Monthly%20volume%3A%202%20PB%0ALocation%3A%20us-east%0ACompliance%3A%20SOC2%0ACustom%20bucket%3A%20yes%0A%0AAnything%20else%3A)
with a dedicated S3 bucket in your own VPC.

#### Run any SQL queries via an HTTP API
Think of Better Stack as a data warehouse. Your data is yours. Host them in your own S3 bucket and run arbitrary SQL queries via our HTTP API.


### No more rehydration or cold storage
Customize retention per source to retain and query everything you want. No need to archive your logs to S3 anymore. Search all your logs anytime.
### No more rehydration or cold storage
Customize retention per source to retain and query everything you want. No need to archive your logs to S3 anymore. Search all your logs anytime.
* * *
Everything you need to ship higher-quality software faster
----------------------------------------------------------

#### The most reliable uptime monitoring
Get a screenshot of the error and a second-by-second timeline with our fastest 30-second checks.

#### Log management
Collect logs across services with Vector, Syslog or OpenTelemetry with our reimagined log management.

#### Metrics
Integrate in minutes with Prometheus or OpenTelemetry, or create custom metrics directly from your logs.

#### Playwright checks
Run tests with a real Chrome browser instance with a JavaScript runtime.

#### Tracing
OpenTelemetry-native tracing with eBPF instrumentation.

#### Error tracking
Catch bugs, get root cause of every error, and create tickets on autopilot.
Relied on by the world’s best engineering teams
Happy customers, growing market presence
----------------------------------------
Instrument your clusters today. Try Better Stack risk-free with our 60-day money-back guarantee.
Ship higher-quality software faster. Be the hero of your engineering teams.
Start for free
Looking for an enterprise solution? [Book a demo](https://betterstack.com/book-a-demo)
### Please accept cookies
We use cookies to authenticate users, improve the product user experience, and for [personalized ads](https://business.safety.google/privacy/)
. [Learn more.](https://betterstack.com/privacy)
Deny Accept required Accept all
---
# Help & Support | Better Stack
Got questions?
==============
You can reach us at [hello@betterstack.com](mailto:hello@betterstack.com)
. We'll get back to you as soon as we can, typically within a few hours.
[\
\
Documentation\
-------------\
\
Learn how to integrate Better Stack with your existing services using our APIs and integrations.](https://betterstack.com/docs/)
[\
\
Book a demo call\
----------------\
\
Book a demo with one of our experts to see how Better Stack fits into your existing workflow.](https://betterstack.com/book-a-demo)
### Please accept cookies
We use cookies to authenticate users, improve the product user experience, and for [personalized ads](https://business.safety.google/privacy/)
. [Learn more.](https://betterstack.com/privacy)
Deny Accept required Accept all
---
# Reliable Uptime Robot alternative | Better Stack
Reliable Uptime Robot
alternative
===================================
See why the best CTOs choose Better Stack over Uptime Robot.
Start in 30 seconds
Start monitoring for free or
[book a demo](https://betterstack.com/book-a-demo)

Why choose Better Stack vs. Uptime Robot
-----------------------------------------
Key features

Uptime Robot

Better Stack
Phone call alerts
Not included in price.
Pay-as-you-go
Unlimited
Check frequency
5 minutes
30 seconds
Free status page on your own subdomain
—

Incident verification & false alert protection
—

Helpful alerts
—

On-call duty scheduling
—

Built-in incident management
—

Manually triggered incidents
—

Beautiful dashboard
—

Designed for teams and enterprises
—

Free tier included


##### Loved by teams around the world
Software engineers from high-growth startups to Fortune 500 companies choose Better Stack.


Uptime monitoring reimagined
----------------------------
Get a screenshot of the error, and a second-by-second timeline with our fastest 30-second checks.
Replaces


### Unlimited phone call alerts
As well as SMS, e-mail, Slack, Microsoft Teams, and push notifications with our all-you-can-alert pricing. Be the first one to know your site is down.

### 30s multi-location checks
Each HTTP and ping-based incident is verified from at least 3 locations before we alert you. No more false incidents!

### Incident management built-in
Alert the right person on your team at the right time with our on-callscheduling plug in the services you already use including DataDog, and New Relic.
### That's just the tip
of the iceberg

#### Screenshots & error logs
We don't just tell you that your service went down. We also tell you why.

#### Incident audit timeline
Get second-by-second timeline for every incident with detailed information about what happened and who got alerted.

#### Ping, SSL & TLD expiration
The most commonly used monitors come built-in and can be configured in a few seconds.

#### Smart incident merging
30 incidents get created at the same time? Acknowledge them with a single tap and stop your phone from ringing while fixing the issue.

#### Integrate everything
Plug in the services across all levels of your stack and get up and running in minutes, not days.

#### Cron job monitoring
Never lose a DB backup! Track your CRON jobs and serverless workers. Get alerted if they don't run correctly.
### Save big with
Better Stack
Better Stack replaces a bunch of existing tools. See how our fixed price for a team of 6 compares with PagerDuty, Pingdom, and Statuspage.io.
[See pricing](https://betterstack.com/pricing)

PagerDuty
Incident management
+

Pingdom
Uptime monitoring
+

Statuspage.io
Branded status page
\=
$ 673 /mo
6 team members, 60 monitors,
and 2,000 subscribers

Incident management with on-call

Uptime monitoring built-in

Branded status page on your own sub-domain status.domain.com
$ 269 /mo
6 team members, 60 monitors,
and 2,000 subscribers
#### Don’t just take our word for it
We're proud to be working with these incredible companies, and thankful for their feedback, suggestions, and support.
Looking for a status page? I recommend [@BetterUptime.](https://twitter.com/betteruptime)
Perfect support, answered my dms in a couple of minutes, and it's the first actual cool looking status page which allows custom domains (on the free plan 😱) haven't actually tried it, but it looks good so far.
#NotSponsor
[\
\
NeverLand\
\
@neverlandoff\
\
](https://twitter.com/neverlandoff/status/1444299269872267266)
I tested [@BetterUptime](https://twitter.com/betteruptime)
for @gamubsapp! So much easier to configure and the interface is better than @FreshworksInc!
[\
\
Quentin\
\
@glaffont\
\
](https://twitter.com/qlaffont/status/1442463552007147527)
By far [@BetterUptime](https://twitter.com/betteruptime)
has given me more pleasant surprises other tool in this space. We had an outage due to a domain name expiring, and it turns out we can even be alerted about that. Great user experience and UI on top of all the features. How is it not more popular?
[\
\
John\
\
@johncjago\
\
](https://twitter.com/johncjago/status/1462624489284513793)
One year one tool. @linear won my heart last year. This year so far, [@BetterStackHQ](https://twitter.com/betterstackhq)
is the frontrunner, well designed 👏
[\
\
Tianzhou\
\
@tianzhouchen\
\
](https://twitter.com/tianzhouchen/status/1441046890502520835)
I just checked this out, and have never been so happy that I saw an ad 👏
[\
\
Chris\
\
@chrishow\
\
](https://twitter.com/chrislhow/status/1417794338130698240)
We have now completely switched our status page to [@BetterUptime](https://twitter.com/betteruptime)
— It's all automated, pages us on all incidents and looks fantastic. Sold. status.improvmx.com
[\
\
ImprovMX\
\
@ImprovMx\
\
](https://twitter.com/ImprovMx/status/1484160652583260178)
Switched from @Statuspage to [@BetterUptime](https://twitter.com/betteruptime)
over the week end, looking pretty good status.speakbox.ca
[\
\
Valentin Prugnaud 🦊\
\
@valentinprgnd\
\
](https://twitter.com/valentinprgnd/status/1435163698201464832)
[@BetterUptime](https://twitter.com/betteruptime)
status page looks SO neat! A fantastic tool for SaaS products like @Snapodcast
[\
\
TonyHe\
\
@ttttonyhe\
\
](https://twitter.com/ttttonyhe/status/1433488160294678529)
I'm utterly blown away by [@LogTailHQ](https://twitter.com/logtailhq)
and [@BetterUptime](https://twitter.com/betteruptime)
! They do everything. I'm now monitoring one of our US servers for every kind of log Ubuntu creates, custom alerts for errors, website downtime, incident logging, Slack notifications, S3 log storage, and loads more. 😍
[\
\
Darren Pinder\
\
@dmpinder\
\
](https://twitter.com/dmpinder/status/1446246301407105033)
We have set up a shiny system status page. Check it out status.ghostfol.io
[\
\
Ghostfolio\
\
@ghostfolio\_\
\
](https://twitter.com/ghostfolio_/status/1429071692886913030)
Show more
###### Loved by teams around the world


###### Sign up for free
#### Get up & running
in 30 seconds
Get notified with a radically better
infrastructure monitoring platform.
Start in 30 seconds
Start monitoring for free or
[book a demo](https://betterstack.com/book-a-demo)

---
# AWS ELB dashboard template | Better Stack
[Back to dashboards](https://betterstack.com/dashboards)
AWS ELB
=======
Managed load balancer for distributing traffic across targets.
[Add dashboard](https://telemetry.betterstack.com/team/0/dashboards#template-95594)
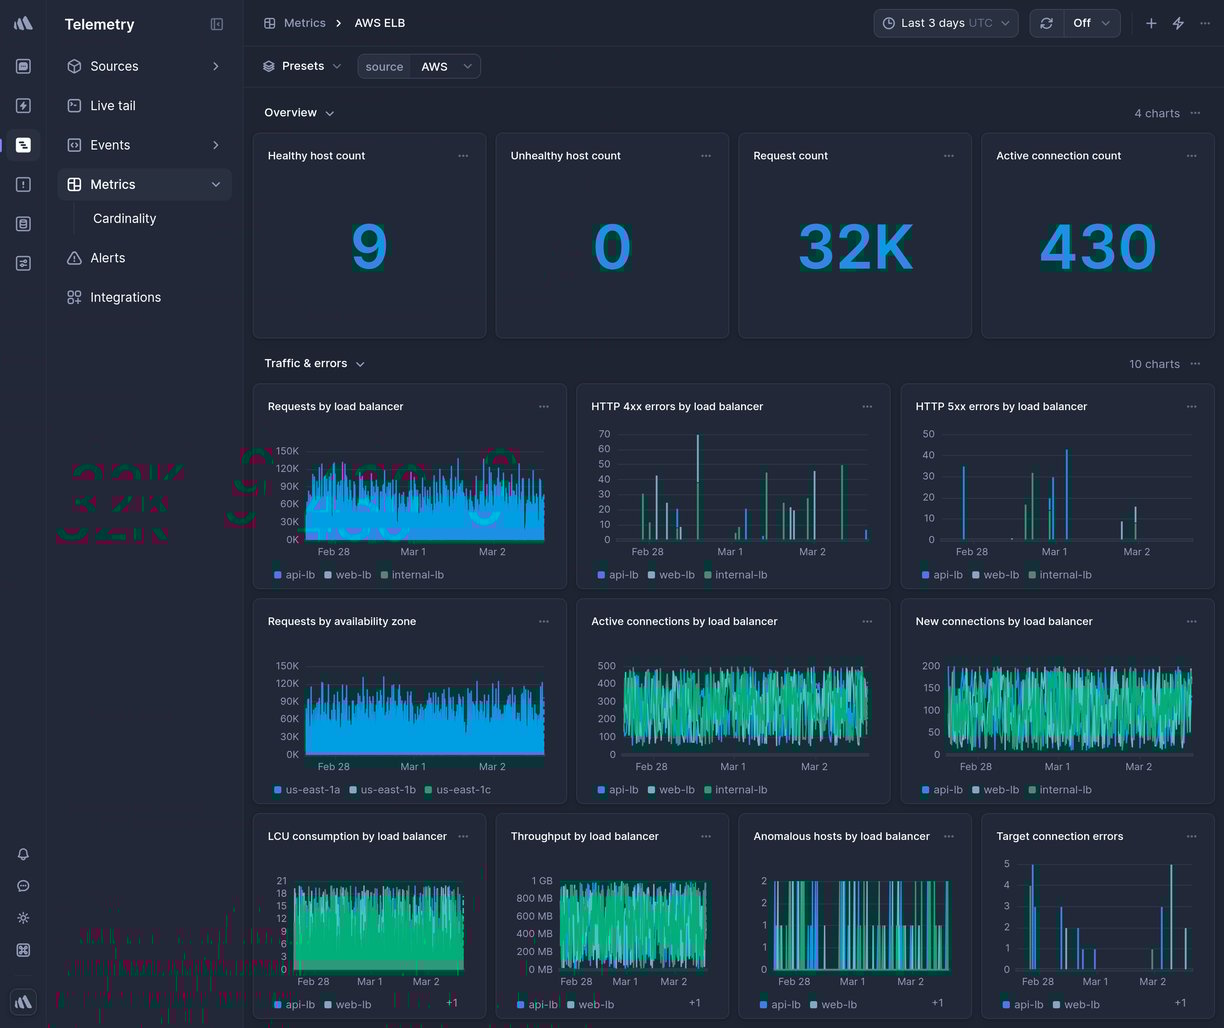
Data source
AWS CloudWatch
* * *

Overview
--------
This is a ready-made AWS ELB Telemetry dashboard in Better Stack.
To get it, [sign up](https://betterstack.com/users/sign-up)
for Better Stack, [connect your log or metrics source](https://betterstack.com/docs/logs/logging-start/)
, and select one of the beautiful [pre-built dashboards](https://betterstack.com/dashboards)
you want to get.
### What charts are included
* Request count
* Active connections
* Target response time
* HTTP error codes
* And much more, explore on your own to see all the chart options.

### How to create a custom chart
Need a custom chart? You can create one by writing a regular SQL query.
Here is how to do it:
1. **Pick a chart type:** the most popular options include a line chart, bar chart, pie chart, a single number, and a live tail (a stream of the newest logs).
2. **Pick a source and timeframe:** we use [variables](https://betterstack.com/docs/logs/dashboards/variables/)
in the SQL queries, which makes it easy to edit and work with any query. The main variables are `source` and `timeframe`. Once you set those, as in the example above, you can use the timeframe switcher easily, and the dashboard will update automatically.
3. **Write your SQL query:** there is no need to use any specific querying language. Just write SQL like you’re used to.
**Learn more:** [How to build SQL queries in Better Stack](https://betterstack.com/docs/logs/dashboards/sql-queries/)

### How to create an alert for a metric
You can get easily alerted on irregularities before they become incidents.
Everything is fully integrated into dashboards, there is no need to set up complex workflows.
Here are the most popular alert types:
* **Threshold Alerts:** Perfect for scenarios where you need to be notified when a metric crosses a certain predefined threshold. For instance, if your application's response time exceeds a set limit, you’ll get an alert.
* **Relative Alerts:** Want to monitor changes in metrics relative to their historical data? Whether it's an unexpected drop in sales, a surge in new user signups, or any other relative metric anomaly, we've got you covered.
* **Anomaly detection:** Use this alerting method if you're unsure about what threshold to set. It will notify you about any significant deviation from the predicted value of the series. Think of this method as covering what you didn’t even know can occur.
**Learn more:** [How to use alerts in Better Stack](https://betterstack.com/docs/logs/dashboards/alerts/)

### How to receive notification about issues
Once you set up what metric irregularities you want to get alerted to, you can select a broad spectrum of notification options.
The most popular include Slack, Microsoft Teams, Phone calls, SMS, emails, webhooks, and more.
The best part is that notifications within Better Stack are unlimited. This way, you don’t have to worry about being charged extra in case of significant incidents.
**Learn more:** [How to use escalation policies in Better Stack](https://betterstack.com/docs/uptime/escalation-policies/)
### How to set up your AWS ELB dashboard
Once you’ve signed up for [Better Stack](https://betterstack.com/logs)
, you can collect logs and metrics from AWS ELB in just 2 minutes. Here is the official [documentation](https://betterstack.com/docs/logs/aws-cloudformation/)
on how to do it.
Are you already using another log forwarder that you’re used to? See the documentation for [Fluent Bit](https://betterstack.com/docs/logs/fluent-bit/)
, [Logstash](https://betterstack.com/docs/logs/logstash/)
, [Fluentd](https://betterstack.com/docs/logs/fluentd/)
, [Filebeat](https://betterstack.com/docs/logs/filebeat/)
, [Syslog](https://betterstack.com/docs/logs/syslog-setup/)
, and [others](https://betterstack.com/docs/logs/start/)
.
### Have any questions?
Please feel free to message us at [hello@betterstack.com](mailto:hello@betterstack.com?subject=Question%20about%20Better%20Stack&body=)
.
We'll get back to you as soon as we can, typically within a few hours. 🙏 Thank you!
* * *
#### You might also like
[\
\
### GCP Cloud Storage\
\
Scalable object storage for data of any size.](https://betterstack.com/dashboards/gcp-cloud-storage)
[\
\
### AWS RDS PostgreSQL\
\
Managed PostgreSQL-compatible relational database on AWS.](https://betterstack.com/dashboards/aws-rds-postgresql)

### Please accept cookies
We use cookies to authenticate users, improve the product user experience, and for [personalized ads](https://business.safety.google/privacy/)
. [Learn more.](https://betterstack.com/privacy)
Deny Accept required Accept all
---
# AWS CloudFront dashboard template | Better Stack
[Back to dashboards](https://betterstack.com/dashboards)
AWS CloudFront
==============
Content delivery network for low-latency global distribution.
[Add dashboard](https://telemetry.betterstack.com/team/0/dashboards#template-95592)
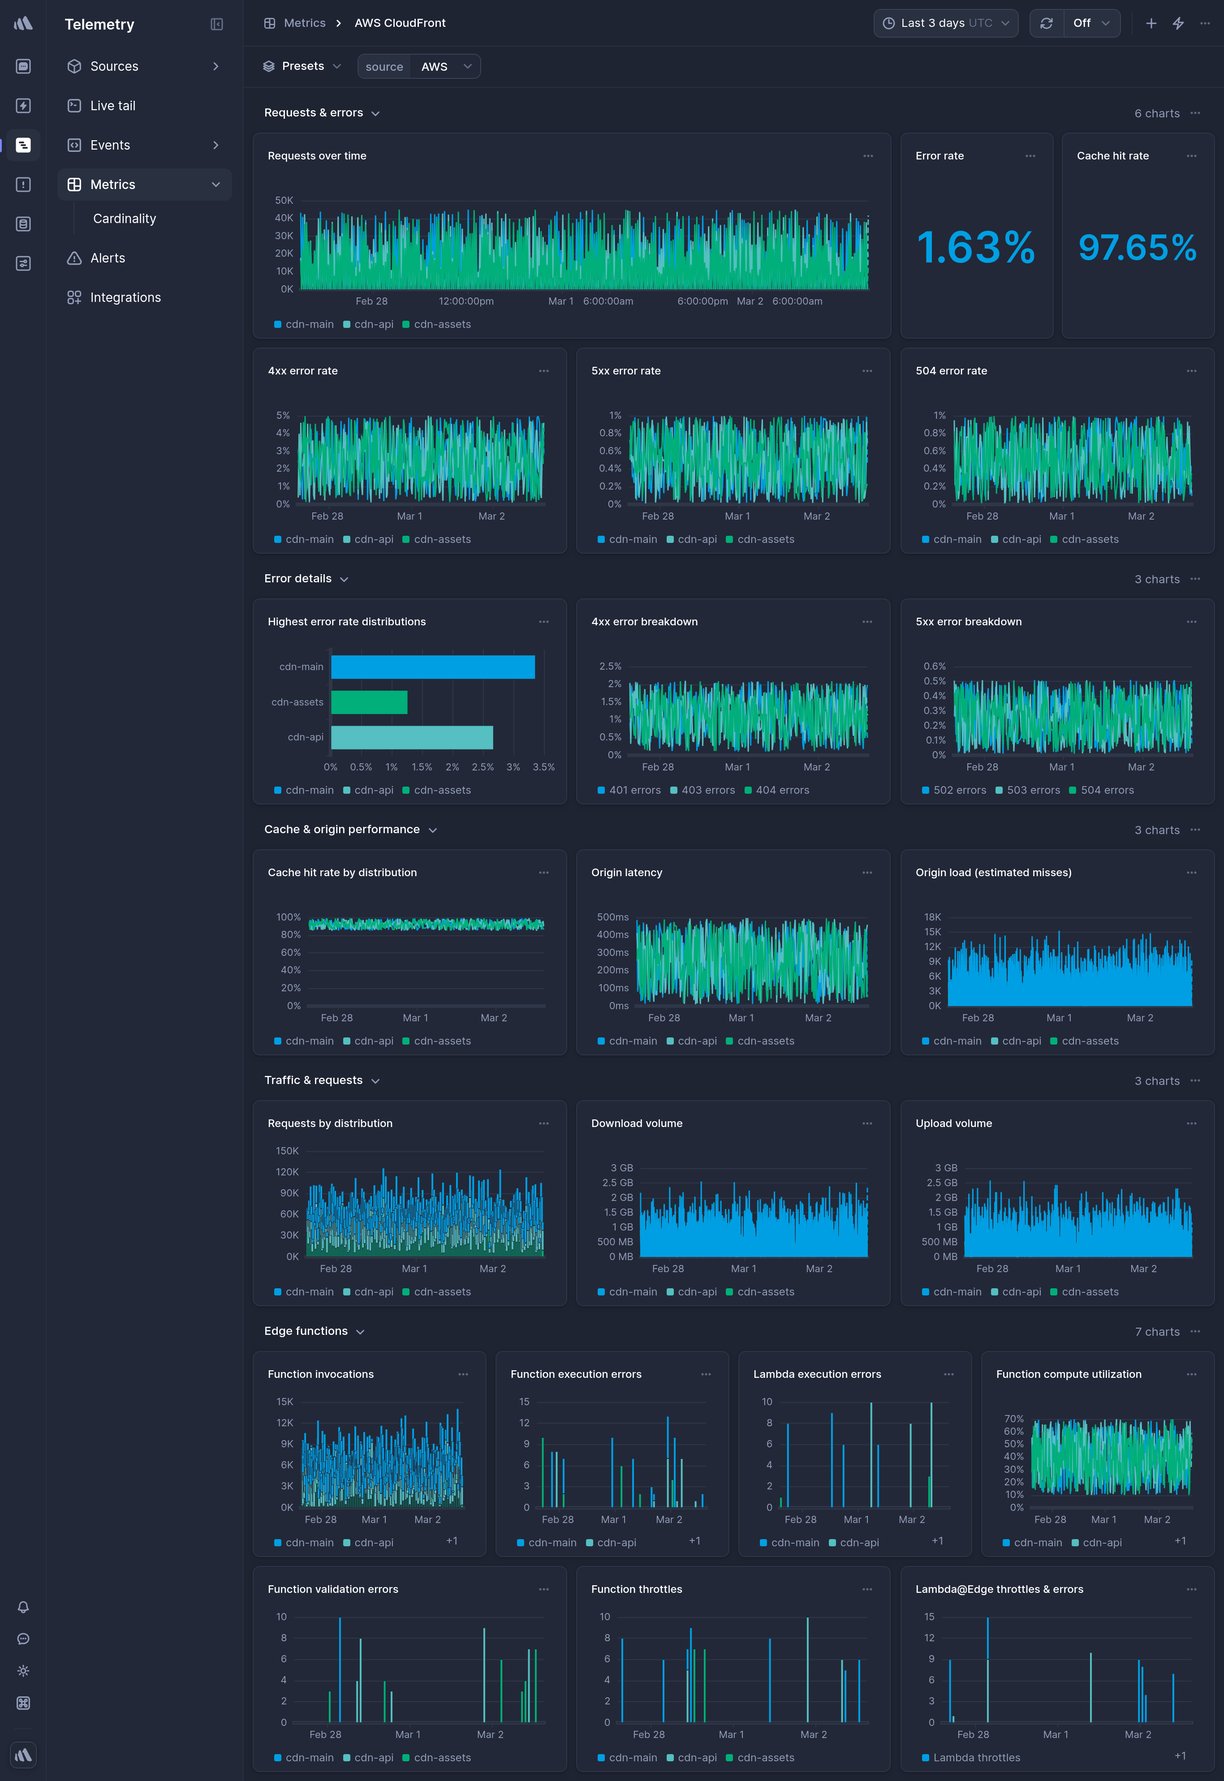
Data source
AWS CloudWatch
* * *

Overview
--------
This is a ready-made AWS CloudFront Telemetry dashboard in Better Stack.
To get it, [sign up](https://betterstack.com/users/sign-up)
for Better Stack, [connect your log or metrics source](https://betterstack.com/docs/logs/logging-start/)
, and select one of the beautiful [pre-built dashboards](https://betterstack.com/dashboards)
you want to get.
### What charts are included
* Requests
* Bytes downloaded
* Error rate
* Cache hit rate
* And much more, explore on your own to see all the chart options.

### How to create a custom chart
Need a custom chart? You can create one by writing a regular SQL query.
Here is how to do it:
1. **Pick a chart type:** the most popular options include a line chart, bar chart, pie chart, a single number, and a live tail (a stream of the newest logs).
2. **Pick a source and timeframe:** we use [variables](https://betterstack.com/docs/logs/dashboards/variables/)
in the SQL queries, which makes it easy to edit and work with any query. The main variables are `source` and `timeframe`. Once you set those, as in the example above, you can use the timeframe switcher easily, and the dashboard will update automatically.
3. **Write your SQL query:** there is no need to use any specific querying language. Just write SQL like you’re used to.
**Learn more:** [How to build SQL queries in Better Stack](https://betterstack.com/docs/logs/dashboards/sql-queries/)

### How to create an alert for a metric
You can get easily alerted on irregularities before they become incidents.
Everything is fully integrated into dashboards, there is no need to set up complex workflows.
Here are the most popular alert types:
* **Threshold Alerts:** Perfect for scenarios where you need to be notified when a metric crosses a certain predefined threshold. For instance, if your application's response time exceeds a set limit, you’ll get an alert.
* **Relative Alerts:** Want to monitor changes in metrics relative to their historical data? Whether it's an unexpected drop in sales, a surge in new user signups, or any other relative metric anomaly, we've got you covered.
* **Anomaly detection:** Use this alerting method if you're unsure about what threshold to set. It will notify you about any significant deviation from the predicted value of the series. Think of this method as covering what you didn’t even know can occur.
**Learn more:** [How to use alerts in Better Stack](https://betterstack.com/docs/logs/dashboards/alerts/)

### How to receive notification about issues
Once you set up what metric irregularities you want to get alerted to, you can select a broad spectrum of notification options.
The most popular include Slack, Microsoft Teams, Phone calls, SMS, emails, webhooks, and more.
The best part is that notifications within Better Stack are unlimited. This way, you don’t have to worry about being charged extra in case of significant incidents.
**Learn more:** [How to use escalation policies in Better Stack](https://betterstack.com/docs/uptime/escalation-policies/)
### How to set up your AWS CloudFront dashboard
Once you’ve signed up for [Better Stack](https://betterstack.com/logs)
, you can collect logs and metrics from AWS CloudFront in just 2 minutes. Here is the official [documentation](https://betterstack.com/docs/logs/aws-cloudformation/)
on how to do it.
Are you already using another log forwarder that you’re used to? See the documentation for [Fluent Bit](https://betterstack.com/docs/logs/fluent-bit/)
, [Logstash](https://betterstack.com/docs/logs/logstash/)
, [Fluentd](https://betterstack.com/docs/logs/fluentd/)
, [Filebeat](https://betterstack.com/docs/logs/filebeat/)
, [Syslog](https://betterstack.com/docs/logs/syslog-setup/)
, and [others](https://betterstack.com/docs/logs/start/)
.
### Have any questions?
Please feel free to message us at [hello@betterstack.com](mailto:hello@betterstack.com?subject=Question%20about%20Better%20Stack&body=)
.
We'll get back to you as soon as we can, typically within a few hours. 🙏 Thank you!
* * *
#### You might also like
[\
\
### GCP BigQuery\
\
Serverless data warehouse for analytics at any scale.](https://betterstack.com/dashboards/gcp-bigquery)
[\
\
### AWS RDS PostgreSQL\
\
Managed PostgreSQL-compatible relational database on AWS.](https://betterstack.com/dashboards/aws-rds-postgresql)

### Please accept cookies
We use cookies to authenticate users, improve the product user experience, and for [personalized ads](https://business.safety.google/privacy/)
. [Learn more.](https://betterstack.com/privacy)
Deny Accept required Accept all
---
# AWS SNS & SQS dashboard template | Better Stack
[Back to dashboards](https://betterstack.com/dashboards)
AWS SNS & SQS
=============
Managed messaging and queuing services for decoupled architectures.
[Add dashboard](https://telemetry.betterstack.com/team/0/dashboards#template-95591)
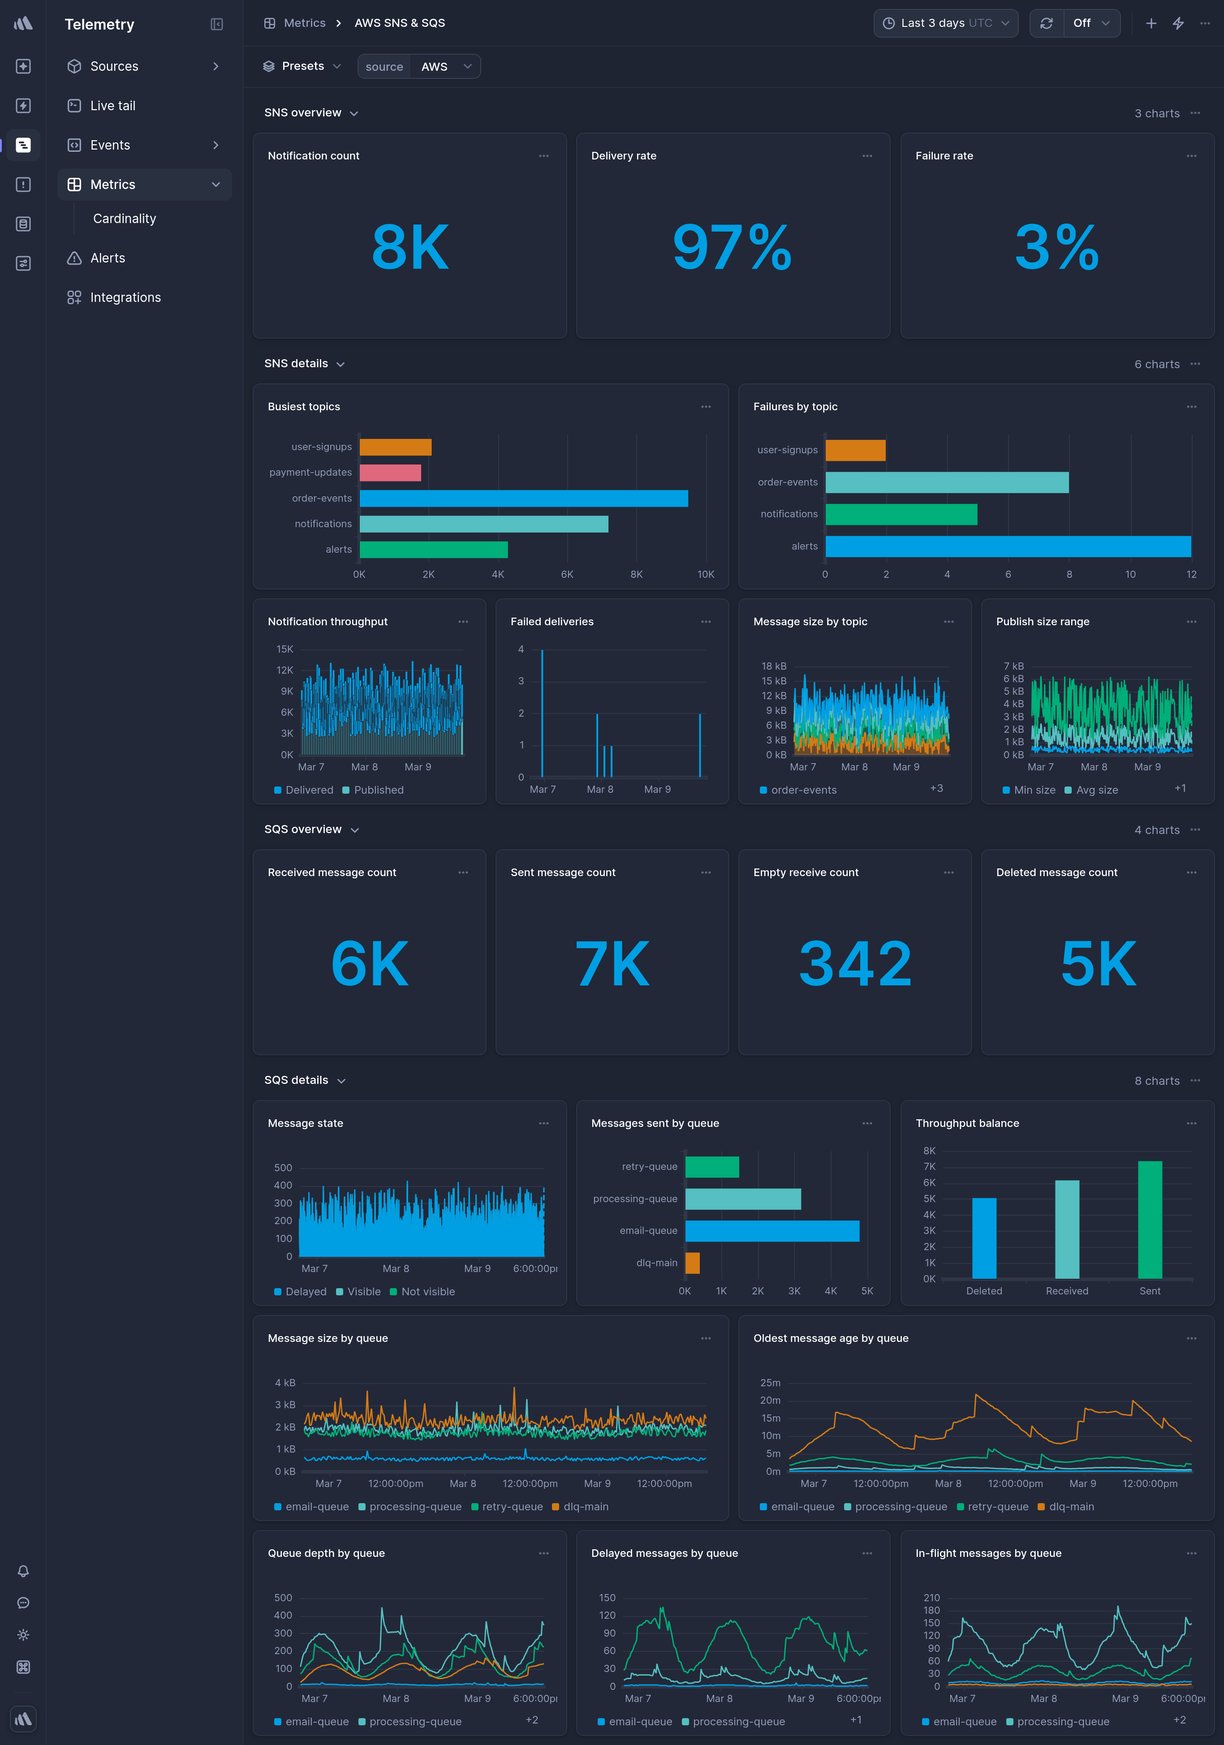
Data source
AWS CloudWatch
* * *

Overview
--------
This is a ready-made AWS SNS & SQS Telemetry dashboard in Better Stack.
To get it, [sign up](https://betterstack.com/users/sign-up)
for Better Stack, [connect your log or metrics source](https://betterstack.com/docs/logs/logging-start/)
, and select one of the beautiful [pre-built dashboards](https://betterstack.com/dashboards)
you want to get.
### What charts are included
* Messages published
* Messages delivered
* Queue depth
* Message age
* And much more, explore on your own to see all the chart options.

### How to create a custom chart
Need a custom chart? You can create one by writing a regular SQL query.
Here is how to do it:
1. **Pick a chart type:** the most popular options include a line chart, bar chart, pie chart, a single number, and a live tail (a stream of the newest logs).
2. **Pick a source and timeframe:** we use [variables](https://betterstack.com/docs/logs/dashboards/variables/)
in the SQL queries, which makes it easy to edit and work with any query. The main variables are `source` and `timeframe`. Once you set those, as in the example above, you can use the timeframe switcher easily, and the dashboard will update automatically.
3. **Write your SQL query:** there is no need to use any specific querying language. Just write SQL like you’re used to.
**Learn more:** [How to build SQL queries in Better Stack](https://betterstack.com/docs/logs/dashboards/sql-queries/)

### How to create an alert for a metric
You can get easily alerted on irregularities before they become incidents.
Everything is fully integrated into dashboards, there is no need to set up complex workflows.
Here are the most popular alert types:
* **Threshold Alerts:** Perfect for scenarios where you need to be notified when a metric crosses a certain predefined threshold. For instance, if your application's response time exceeds a set limit, you’ll get an alert.
* **Relative Alerts:** Want to monitor changes in metrics relative to their historical data? Whether it's an unexpected drop in sales, a surge in new user signups, or any other relative metric anomaly, we've got you covered.
* **Anomaly detection:** Use this alerting method if you're unsure about what threshold to set. It will notify you about any significant deviation from the predicted value of the series. Think of this method as covering what you didn’t even know can occur.
**Learn more:** [How to use alerts in Better Stack](https://betterstack.com/docs/logs/dashboards/alerts/)

### How to receive notification about issues
Once you set up what metric irregularities you want to get alerted to, you can select a broad spectrum of notification options.
The most popular include Slack, Microsoft Teams, Phone calls, SMS, emails, webhooks, and more.
The best part is that notifications within Better Stack are unlimited. This way, you don’t have to worry about being charged extra in case of significant incidents.
**Learn more:** [How to use escalation policies in Better Stack](https://betterstack.com/docs/uptime/escalation-policies/)
### How to set up your AWS SNS & SQS dashboard
Once you’ve signed up for [Better Stack](https://betterstack.com/logs)
, you can collect logs and metrics from AWS SNS & SQS in just 2 minutes. Here is the official [documentation](https://betterstack.com/docs/logs/aws-cloudformation/)
on how to do it.
Are you already using another log forwarder that you’re used to? See the documentation for [Fluent Bit](https://betterstack.com/docs/logs/fluent-bit/)
, [Logstash](https://betterstack.com/docs/logs/logstash/)
, [Fluentd](https://betterstack.com/docs/logs/fluentd/)
, [Filebeat](https://betterstack.com/docs/logs/filebeat/)
, [Syslog](https://betterstack.com/docs/logs/syslog-setup/)
, and [others](https://betterstack.com/docs/logs/start/)
.
### Have any questions?
Please feel free to message us at [hello@betterstack.com](mailto:hello@betterstack.com?subject=Question%20about%20Better%20Stack&body=)
.
We'll get back to you as soon as we can, typically within a few hours. 🙏 Thank you!
* * *
#### You might also like
[\
\
### Cloudflare Worker Trace Events\
\
Serverless execution at Cloudflare's edge. Uses worker\_trace\_events Logpush dataset](https://betterstack.com/dashboards/cloudflare)
[\
\
### GCP BigQuery\
\
Serverless data warehouse for analytics at any scale.](https://betterstack.com/dashboards/gcp-bigquery)

### Please accept cookies
We use cookies to authenticate users, improve the product user experience, and for [personalized ads](https://business.safety.google/privacy/)
. [Learn more.](https://betterstack.com/privacy)
Deny Accept required Accept all
---
# Free Pingdom alternative | Better Stack
Free Pingdom
alternative
==========================
Get a phone call and a Slack message when your site goes down. Always alert the right person on your team.
Start in 30 seconds
Start monitoring for free or
[book a demo](https://betterstack.com/book-a-demo)

Why choose Better Stack vs. Pingdom
------------------------------------
Key features

Pingdom

Better Stack
Phone call alerts
—
Unlimited
Check frequency
1 minute
30 seconds
Helpful alerts
—

Built-in incident management
—

On-call duty scheduling
—

Manually triggered incidents
—

Beautiful dashboard
—

Designed for teams and enterprises
—

Free tier included
Not anymore

##### Loved by teams around the world
Software engineers from high-growth startups to Fortune 500 companies choose Better Stack.


Uptime monitoring reimagined
----------------------------
Get a screenshot of the error, and a second-by-second timeline with our fastest 30-second checks.
Replaces


### Unlimited phone call alerts
As well as SMS, e-mail, Slack, Microsoft Teams, and push notifications with our all-you-can-alert pricing. Be the first one to know your site is down.

### 30s multi-location checks
Each HTTP and ping-based incident is verified from at least 3 locations before we alert you. No more false incidents!

### Incident management built-in
Alert the right person on your team at the right time with our on-callscheduling plug in the services you already use including DataDog, and New Relic.
### That's just the tip
of the iceberg

#### Screenshots & error logs
We don't just tell you that your service went down. We also tell you why.

#### Incident audit timeline
Get second-by-second timeline for every incident with detailed information about what happened and who got alerted.

#### Ping, SSL & TLD expiration
The most commonly used monitors come built-in and can be configured in a few seconds.

#### Smart incident merging
30 incidents get created at the same time? Acknowledge them with a single tap and stop your phone from ringing while fixing the issue.

#### Integrate everything
Plug in the services across all levels of your stack and get up and running in minutes, not days.

#### Cron job monitoring
Never lose a DB backup! Track your CRON jobs and serverless workers. Get alerted if they don't run correctly.
### Save big with
Better Stack
Better Stack replaces a bunch of existing tools. See how our fixed price for a team of 6 compares with PagerDuty, Pingdom, and Statuspage.io.
[See pricing](https://betterstack.com/pricing)

PagerDuty
Incident management
+

Pingdom
Uptime monitoring
+

Statuspage.io
Branded status page
\=
$ 673 /mo
6 team members, 60 monitors,
and 2,000 subscribers

Incident management with on-call

Uptime monitoring built-in

Branded status page on your own sub-domain status.domain.com
$ 269 /mo
6 team members, 60 monitors,
and 2,000 subscribers
#### Don’t just take our word for it
We're proud to be working with these incredible companies, and thankful for their feedback, suggestions, and support.
Looking for a status page? I recommend [@BetterUptime.](https://twitter.com/betteruptime)
Perfect support, answered my dms in a couple of minutes, and it's the first actual cool looking status page which allows custom domains (on the free plan 😱) haven't actually tried it, but it looks good so far.
#NotSponsor
[\
\
NeverLand\
\
@neverlandoff\
\
](https://twitter.com/neverlandoff/status/1444299269872267266)
I tested [@BetterUptime](https://twitter.com/betteruptime)
for @gamubsapp! So much easier to configure and the interface is better than @FreshworksInc!
[\
\
Quentin\
\
@glaffont\
\
](https://twitter.com/qlaffont/status/1442463552007147527)
By far [@BetterUptime](https://twitter.com/betteruptime)
has given me more pleasant surprises other tool in this space. We had an outage due to a domain name expiring, and it turns out we can even be alerted about that. Great user experience and UI on top of all the features. How is it not more popular?
[\
\
John\
\
@johncjago\
\
](https://twitter.com/johncjago/status/1462624489284513793)
One year one tool. @linear won my heart last year. This year so far, [@BetterStackHQ](https://twitter.com/betterstackhq)
is the frontrunner, well designed 👏
[\
\
Tianzhou\
\
@tianzhouchen\
\
](https://twitter.com/tianzhouchen/status/1441046890502520835)
I just checked this out, and have never been so happy that I saw an ad 👏
[\
\
Chris\
\
@chrishow\
\
](https://twitter.com/chrislhow/status/1417794338130698240)
We have now completely switched our status page to [@BetterUptime](https://twitter.com/betteruptime)
— It's all automated, pages us on all incidents and looks fantastic. Sold. status.improvmx.com
[\
\
ImprovMX\
\
@ImprovMx\
\
](https://twitter.com/ImprovMx/status/1484160652583260178)
Switched from @Statuspage to [@BetterUptime](https://twitter.com/betteruptime)
over the week end, looking pretty good status.speakbox.ca
[\
\
Valentin Prugnaud 🦊\
\
@valentinprgnd\
\
](https://twitter.com/valentinprgnd/status/1435163698201464832)
[@BetterUptime](https://twitter.com/betteruptime)
status page looks SO neat! A fantastic tool for SaaS products like @Snapodcast
[\
\
TonyHe\
\
@ttttonyhe\
\
](https://twitter.com/ttttonyhe/status/1433488160294678529)
I'm utterly blown away by [@LogTailHQ](https://twitter.com/logtailhq)
and [@BetterUptime](https://twitter.com/betteruptime)
! They do everything. I'm now monitoring one of our US servers for every kind of log Ubuntu creates, custom alerts for errors, website downtime, incident logging, Slack notifications, S3 log storage, and loads more. 😍
[\
\
Darren Pinder\
\
@dmpinder\
\
](https://twitter.com/dmpinder/status/1446246301407105033)
We have set up a shiny system status page. Check it out status.ghostfol.io
[\
\
Ghostfolio\
\
@ghostfolio\_\
\
](https://twitter.com/ghostfolio_/status/1429071692886913030)
Show more
###### Loved by teams around the world


###### Sign up for free
#### Get up & running
in 30 seconds
Get notified with a radically better
infrastructure monitoring platform.
Start in 30 seconds
Start monitoring for free or
[book a demo](https://betterstack.com/book-a-demo)

---
# AWS ElastiCache Memcached dashboard template | Better Stack
[Back to dashboards](https://betterstack.com/dashboards)
AWS ElastiCache Memcached
=========================
Managed in-memory Memcached-compatible caching service.
[Add dashboard](https://telemetry.betterstack.com/team/0/dashboards#template-95593)
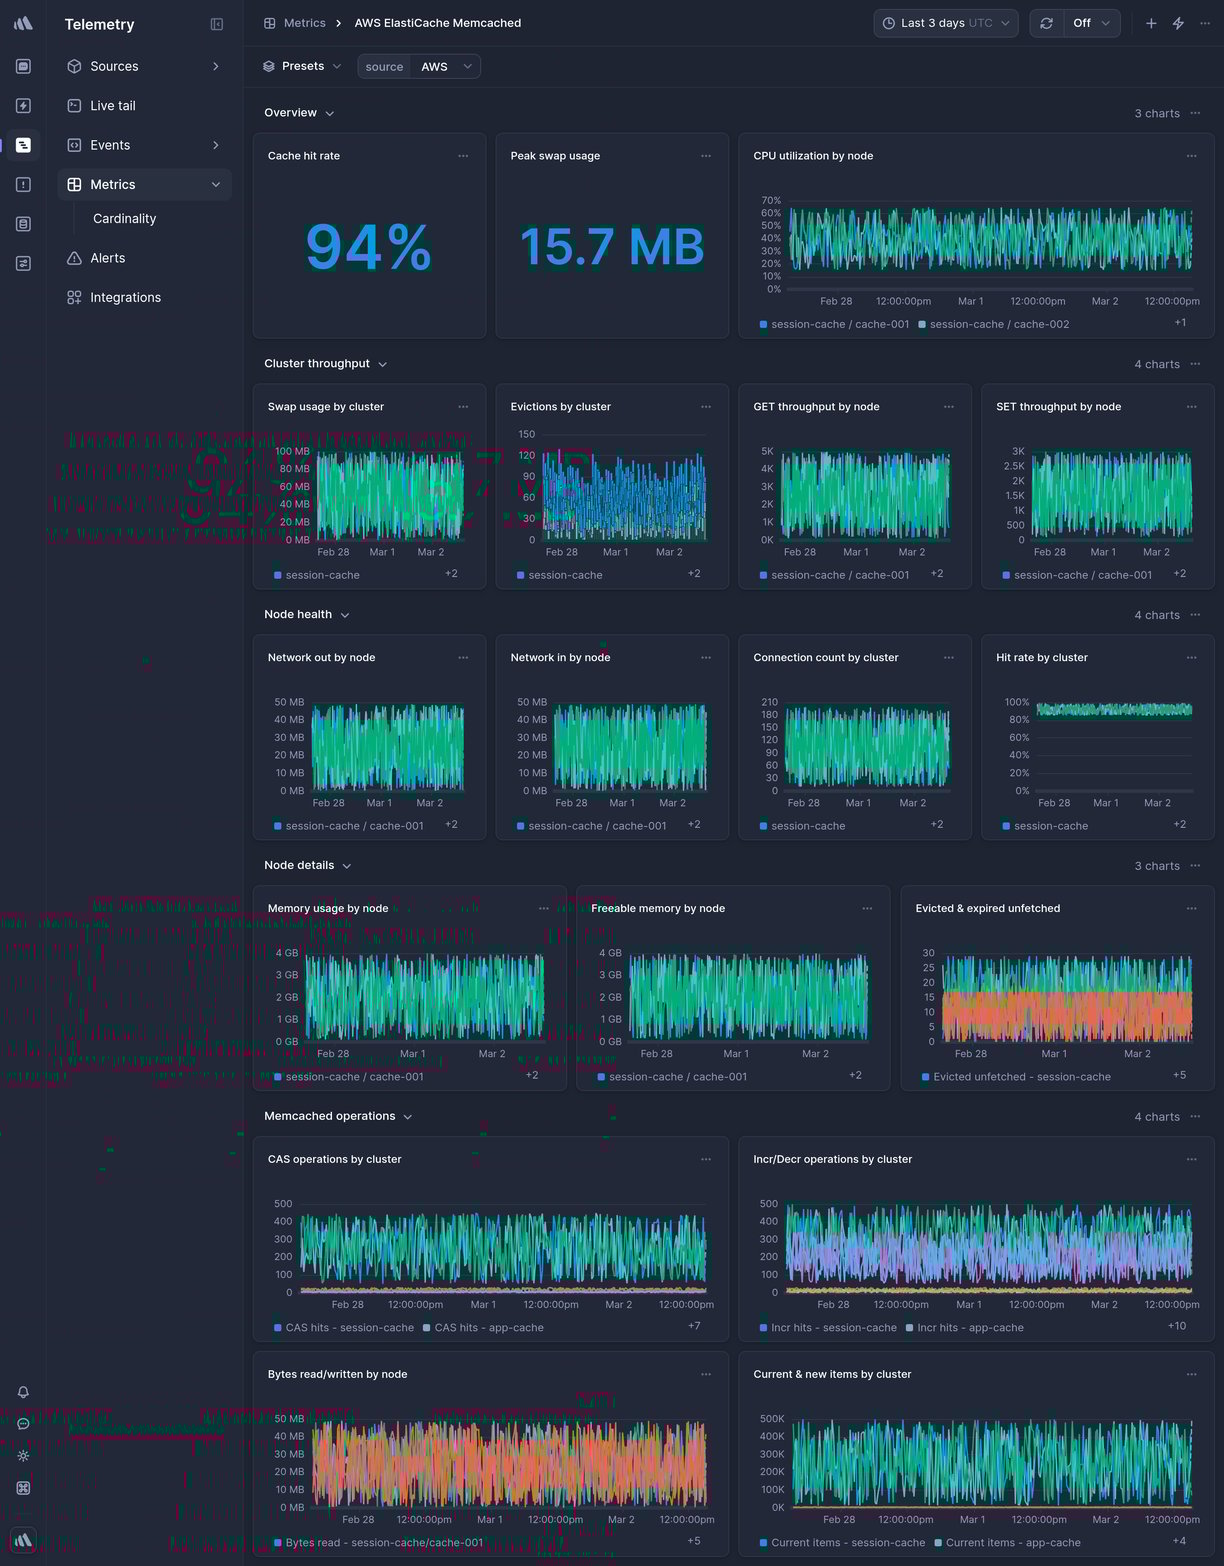
Data source
AWS CloudWatch
* * *

Overview
--------
This is a ready-made AWS ElastiCache Memcached Telemetry dashboard in Better Stack.
To get it, [sign up](https://betterstack.com/users/sign-up)
for Better Stack, [connect your log or metrics source](https://betterstack.com/docs/logs/logging-start/)
, and select one of the beautiful [pre-built dashboards](https://betterstack.com/dashboards)
you want to get.
### What charts are included
* Cache hits
* Cache misses
* Evictions
* Current connections
* And much more, explore on your own to see all the chart options.

### How to create a custom chart
Need a custom chart? You can create one by writing a regular SQL query.
Here is how to do it:
1. **Pick a chart type:** the most popular options include a line chart, bar chart, pie chart, a single number, and a live tail (a stream of the newest logs).
2. **Pick a source and timeframe:** we use [variables](https://betterstack.com/docs/logs/dashboards/variables/)
in the SQL queries, which makes it easy to edit and work with any query. The main variables are `source` and `timeframe`. Once you set those, as in the example above, you can use the timeframe switcher easily, and the dashboard will update automatically.
3. **Write your SQL query:** there is no need to use any specific querying language. Just write SQL like you’re used to.
**Learn more:** [How to build SQL queries in Better Stack](https://betterstack.com/docs/logs/dashboards/sql-queries/)

### How to create an alert for a metric
You can get easily alerted on irregularities before they become incidents.
Everything is fully integrated into dashboards, there is no need to set up complex workflows.
Here are the most popular alert types:
* **Threshold Alerts:** Perfect for scenarios where you need to be notified when a metric crosses a certain predefined threshold. For instance, if your application's response time exceeds a set limit, you’ll get an alert.
* **Relative Alerts:** Want to monitor changes in metrics relative to their historical data? Whether it's an unexpected drop in sales, a surge in new user signups, or any other relative metric anomaly, we've got you covered.
* **Anomaly detection:** Use this alerting method if you're unsure about what threshold to set. It will notify you about any significant deviation from the predicted value of the series. Think of this method as covering what you didn’t even know can occur.
**Learn more:** [How to use alerts in Better Stack](https://betterstack.com/docs/logs/dashboards/alerts/)

### How to receive notification about issues
Once you set up what metric irregularities you want to get alerted to, you can select a broad spectrum of notification options.
The most popular include Slack, Microsoft Teams, Phone calls, SMS, emails, webhooks, and more.
The best part is that notifications within Better Stack are unlimited. This way, you don’t have to worry about being charged extra in case of significant incidents.
**Learn more:** [How to use escalation policies in Better Stack](https://betterstack.com/docs/uptime/escalation-policies/)
### How to set up your AWS ElastiCache Memcached dashboard
Once you’ve signed up for [Better Stack](https://betterstack.com/logs)
, you can collect logs and metrics from AWS ElastiCache Memcached in just 2 minutes. Here is the official [documentation](https://betterstack.com/docs/logs/aws-cloudformation/)
on how to do it.
Are you already using another log forwarder that you’re used to? See the documentation for [Fluent Bit](https://betterstack.com/docs/logs/fluent-bit/)
, [Logstash](https://betterstack.com/docs/logs/logstash/)
, [Fluentd](https://betterstack.com/docs/logs/fluentd/)
, [Filebeat](https://betterstack.com/docs/logs/filebeat/)
, [Syslog](https://betterstack.com/docs/logs/syslog-setup/)
, and [others](https://betterstack.com/docs/logs/start/)
.
### Have any questions?
Please feel free to message us at [hello@betterstack.com](mailto:hello@betterstack.com?subject=Question%20about%20Better%20Stack&body=)
.
We'll get back to you as soon as we can, typically within a few hours. 🙏 Thank you!
* * *
#### You might also like
[\
\
### Kubernetes\
\
Container orchestration platform.](https://betterstack.com/dashboards/kubernetes)
[\
\
### AWS SNS & SQS\
\
Managed messaging and queuing services for decoupled architectures.](https://betterstack.com/dashboards/aws-sns-sqs)

### Please accept cookies
We use cookies to authenticate users, improve the product user experience, and for [personalized ads](https://business.safety.google/privacy/)
. [Learn more.](https://betterstack.com/privacy)
Deny Accept required Accept all
---
# AWS DynamoDB dashboard template | Better Stack
[Back to dashboards](https://betterstack.com/dashboards)
AWS DynamoDB
============
Fully managed NoSQL key-value and document database.
[Add dashboard](https://telemetry.betterstack.com/team/0/dashboards#template-95598)
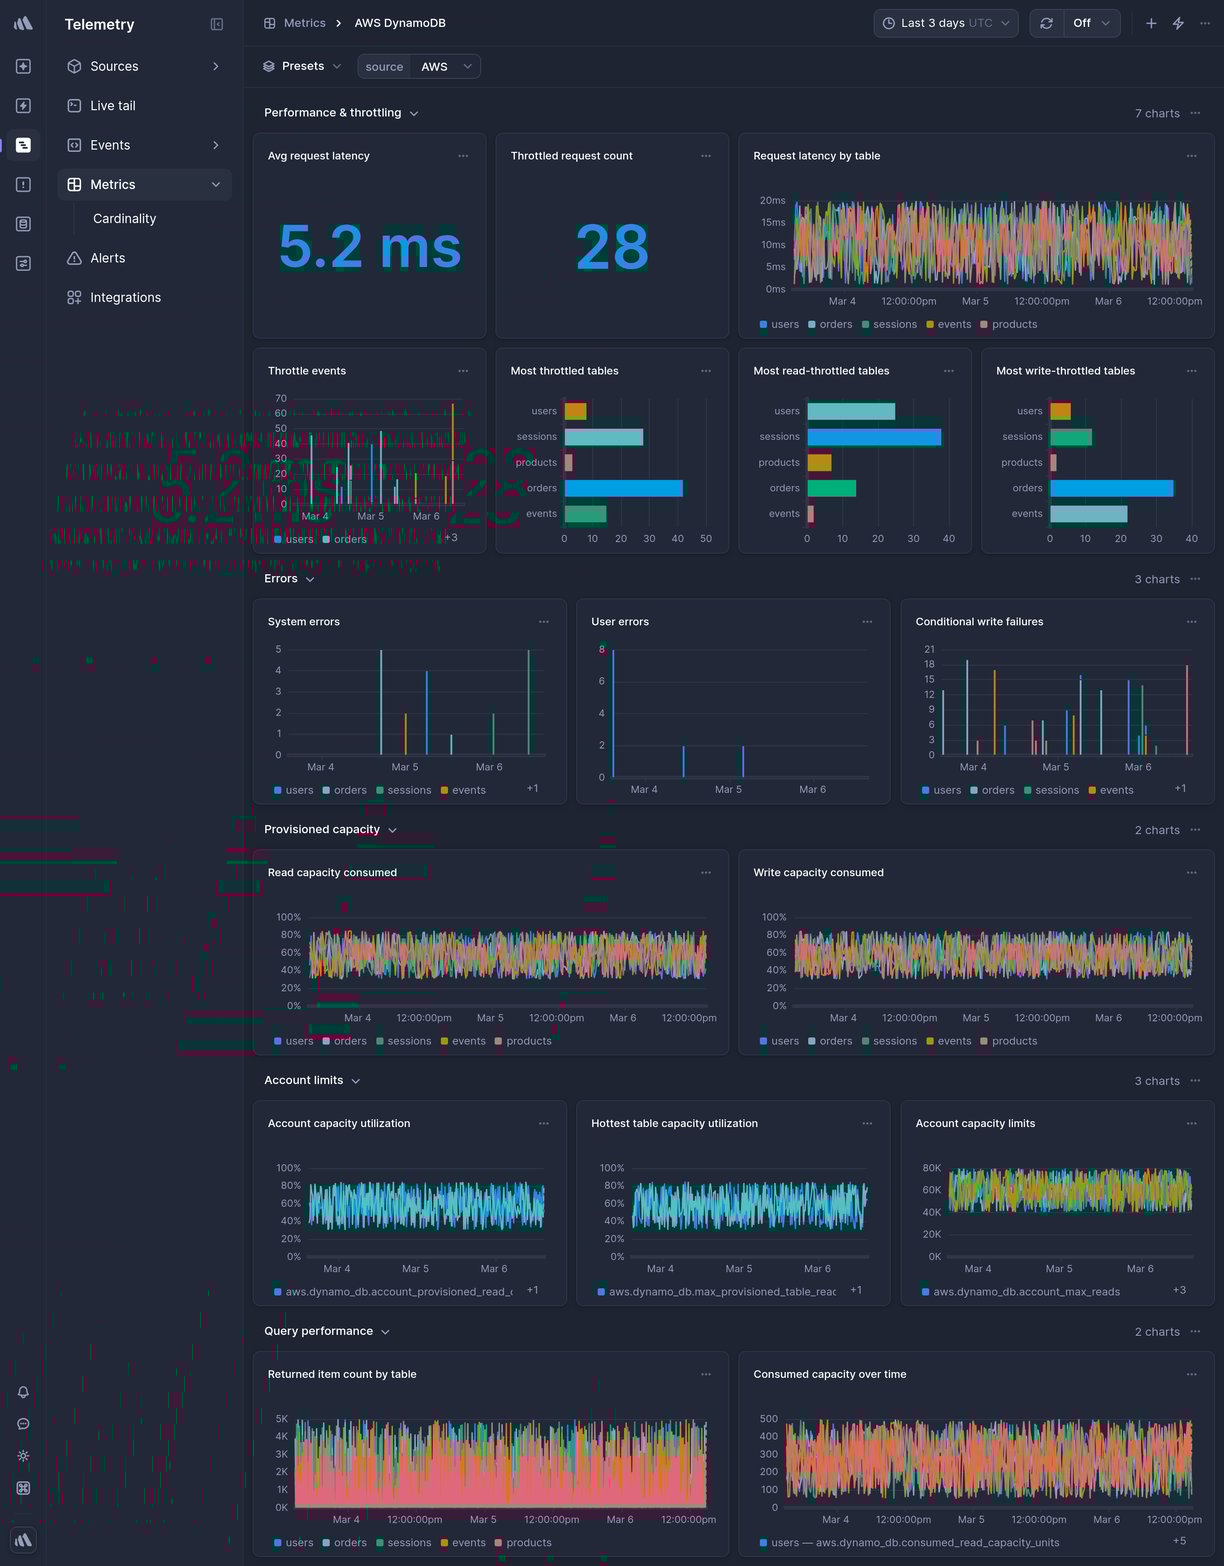
Data source
AWS CloudWatch
* * *

Overview
--------
This is a ready-made AWS DynamoDB Telemetry dashboard in Better Stack.
To get it, [sign up](https://betterstack.com/users/sign-up)
for Better Stack, [connect your log or metrics source](https://betterstack.com/docs/logs/logging-start/)
, and select one of the beautiful [pre-built dashboards](https://betterstack.com/dashboards)
you want to get.
### What charts are included
* Read capacity
* Write capacity
* Throttled requests
* Latency
* And much more, explore on your own to see all the chart options.

### How to create a custom chart
Need a custom chart? You can create one by writing a regular SQL query.
Here is how to do it:
1. **Pick a chart type:** the most popular options include a line chart, bar chart, pie chart, a single number, and a live tail (a stream of the newest logs).
2. **Pick a source and timeframe:** we use [variables](https://betterstack.com/docs/logs/dashboards/variables/)
in the SQL queries, which makes it easy to edit and work with any query. The main variables are `source` and `timeframe`. Once you set those, as in the example above, you can use the timeframe switcher easily, and the dashboard will update automatically.
3. **Write your SQL query:** there is no need to use any specific querying language. Just write SQL like you’re used to.
**Learn more:** [How to build SQL queries in Better Stack](https://betterstack.com/docs/logs/dashboards/sql-queries/)

### How to create an alert for a metric
You can get easily alerted on irregularities before they become incidents.
Everything is fully integrated into dashboards, there is no need to set up complex workflows.
Here are the most popular alert types:
* **Threshold Alerts:** Perfect for scenarios where you need to be notified when a metric crosses a certain predefined threshold. For instance, if your application's response time exceeds a set limit, you’ll get an alert.
* **Relative Alerts:** Want to monitor changes in metrics relative to their historical data? Whether it's an unexpected drop in sales, a surge in new user signups, or any other relative metric anomaly, we've got you covered.
* **Anomaly detection:** Use this alerting method if you're unsure about what threshold to set. It will notify you about any significant deviation from the predicted value of the series. Think of this method as covering what you didn’t even know can occur.
**Learn more:** [How to use alerts in Better Stack](https://betterstack.com/docs/logs/dashboards/alerts/)

### How to receive notification about issues
Once you set up what metric irregularities you want to get alerted to, you can select a broad spectrum of notification options.
The most popular include Slack, Microsoft Teams, Phone calls, SMS, emails, webhooks, and more.
The best part is that notifications within Better Stack are unlimited. This way, you don’t have to worry about being charged extra in case of significant incidents.
**Learn more:** [How to use escalation policies in Better Stack](https://betterstack.com/docs/uptime/escalation-policies/)
### How to set up your AWS DynamoDB dashboard
Once you’ve signed up for [Better Stack](https://betterstack.com/logs)
, you can collect logs and metrics from AWS DynamoDB in just 2 minutes. Here is the official [documentation](https://betterstack.com/docs/logs/aws-cloudformation/)
on how to do it.
Are you already using another log forwarder that you’re used to? See the documentation for [Fluent Bit](https://betterstack.com/docs/logs/fluent-bit/)
, [Logstash](https://betterstack.com/docs/logs/logstash/)
, [Fluentd](https://betterstack.com/docs/logs/fluentd/)
, [Filebeat](https://betterstack.com/docs/logs/filebeat/)
, [Syslog](https://betterstack.com/docs/logs/syslog-setup/)
, and [others](https://betterstack.com/docs/logs/start/)
.
### Have any questions?
Please feel free to message us at [hello@betterstack.com](mailto:hello@betterstack.com?subject=Question%20about%20Better%20Stack&body=)
.
We'll get back to you as soon as we can, typically within a few hours. 🙏 Thank you!
* * *
#### You might also like
[\
\
### GCP Cloud Spanner\
\
Globally distributed, horizontally scalable relational database.](https://betterstack.com/dashboards/gcp-cloud-spanner)
[\
\
### Docker\
\
Platform for containerized applications.](https://betterstack.com/dashboards/docker)

### Please accept cookies
We use cookies to authenticate users, improve the product user experience, and for [personalized ads](https://business.safety.google/privacy/)
. [Learn more.](https://betterstack.com/privacy)
Deny Accept required Accept all
---
# Open positions | Better Stack
### Open roles
Remote
Remote (North America & Europe)
Hardcore mode
Work 1.5x the hours, earn 2x the compensation
/^Full-?stack Engineer$/i
$60K - $300K/year + equity $120K - $600K/year + equity · Remote Prague
Founding Product Engineer
$150K - $400K/year + equity $300K - $800K/year + equity · Remote Prague
Recruiter
$50K - $100K/year + equity $100K - $200K/year + equity · Remote Prague
Customer Engineer
$60K - $120K/year + equity $120K - $240K/year + equity · Remote Prague
Customer Advocate
$30K - $120K/year + equity $60K - $240K/year + equity · Remote Prague
/^Full-?stack Engineer$/i
$60K - $300K/year + equity $120K - $600K/year + equity · Remote Prague
Founding Product Engineer
$150K - $400K/year + equity $300K - $800K/year + equity · Remote Prague
Recruiter
$50K - $100K/year + equity $100K - $200K/year + equity · Remote Prague
Customer Engineer
$60K - $120K/year + equity $120K - $240K/year + equity · Remote Prague
Customer Advocate
$30K - $120K/year + equity $60K - $240K/year + equity · Remote Prague
### /^Full-?stack Engineer$/i
Hardcore
Remote (North America & Europe)
Prague
$60K - $300K/year + equity
$120K - $600K/year + equity
[Apply](https://betterstack.typeform.com/apply-engineer)
The challenge
Read about [how we think about software](https://betterstack.com/careers/engineering)
and [what it’s like to work here](https://betterstack.com/careers)
.
We’re designing a product by engineers, for engineers. Our CTO, CEO, and COO are all software builders who understand what it takes to craft elegant, efficient, and delightful products. And we’re continuously looking for more amazing engineers to help us create high-quality software with exceptional UX—end to end.
You’ll do more than write code. You’ll shape the [product user experience](https://juraj.blog/p/consistency)
, polish user interface, optimize backend performance, benchmark database queries, and ship secure, scalable software. **We’re looking for software engineers who, if given enough time, could build Better Stack on their own.** This role is not about filling a narrow niche but taking ownership and shipping impactful software that users love.
We believe the best software engineers are at [least 100x more productive](https://juraj.blog/p/100x-software-engineering)
than the average ones, as they can pragmatically switch between [different styles of engineering](https://juraj.blog/p/two-sides)
. We don’t think of [software engineers as a commodity](https://juraj.blog/p/we-are-hiring-42-engineers-this-year)
.
What you’ll do
* **Use AI to aggressively ship high-quality code.** We expect you to [be on top of the latest tools](https://x.com/jurajmasar/status/1962465031720731118)
, models and trends in AI-assisted software engineering. We think that using AI is no longer optional. We expect you to be amazing at prompting, to know when to leverage different models, and to have first-hand experience with Claude Code, Cursor, and opencode among others. At the same time, we expect you know when _not_ to use LLMs and instead debug or design an algorithm by hand. We’re not looking for vibe coders.
* You’ll implement, test, and deploy secure, fast, and scalable code in production—**independently** or with lightweight collaboration.
* Work directly with our CTO, CEO, and our designer to deliver end-to-end features, from backend to frontend, within a single day.
* Use our modern yet opinionated tech stack—Ruby on Rails, PostgreSQL, Redis, ClickHouse, Redpanda, JavaScript, Vue.js, Tailwind, Docker, and more.
* Keep our frontend fast and consider SEO & AEO.
* Ship software while maintaining security and performance across the stack—**understanding basic web security principles** without over-relying on frameworks.
* Collaborate asynchronously while avoiding unnecessary meetings.
We trust you to manage your time and ship.
This might be for you if
* **Software is your hobby.** You’ve written web scrapers for fun, built apps for personal use, or explored side projects to learn new tech.
* **You love shipping things end-to-end.** Styling buttons in the morning, adjusting the database schema at noon, and deploying to production in the afternoon? You’ll like it here.
* **You value speed and pragmatism.** You know how to prioritize and [cut the right 5% of a feature to simplify its implementation by 100x.](https://juraj.blog/p/100x-software-engineering)
* **You take security very seriously,** without blindly relying on modern frameworks.
* **You write fast software.** From optimizing SQL queries to reducing frontend reflows and choosing the right number of threads, you’re always looking for ways to keep applications fast.
* **You’re a generalist.** You don’t need to be an expert in every area of software engineering, but you’re comfortable wearing multiple hats and learning quickly.
* **You care about UI and UX.** Pixel-perfect designs and seamless user flows aren’t “just for designers.” [Refactoring UI](https://www.refactoringui.com/)
is/would be your go-to guide.
* **You prefer fewer meetings and more doing instead.** Team stand-ups? No thanks. Async tools and clear communication? Yes, please.
* It’s great if you’ve worked with our stack **but it’s definitely not a requirement.** We need you to be flexible about the tools you use. Great software engineers can pick up new stack fast. As far as you worked with some web technologies and at least some SQL databases, you’re just fine!
* **You agree that software engineers are the artists of our age.**
Read [Paul Graham](https://www.paulgraham.com/)
’s [Hackers and Painters](https://www.amazon.com/Hackers-Painters-Big-Ideas-Computer/dp/1449389554)
, one of our favorite books.
Who you’ll work with
* We consider our team to be a professional sports team. Everyone aims to be the best in the world in what they do. From YC alumni to ex-Google and ex-Shopify colleagues, you’ll be in great company.
* Our founders Juraj (CEO) and Veronika (COO), and Tomas (CTO) who remain hands-on and ship code.
* Our 1-man design team Juraj jr., and Simon, engineer turned technical product manager, who ensure that every feature you build looks and feels incredible and consistent with the rest of the product.
[Apply](https://betterstack.typeform.com/apply-engineer)
### Founding Product Engineer
Hardcore
Remote (North America & Europe)
Prague
$150K - $400K/year + equity
$300K - $800K/year + equity
[Apply](https://betterstack.typeform.com/apply-engineer)
The challenge
Please start by reading the description of the /^Full-?stack Engineer$/i role.
You need to be an **amazing full-stack engineer** before moving to the Founding Product Engineering role.
You can also read about [how we think about software](https://betterstack.com/careers/engineering)
and [what it’s like to work here](https://betterstack.com/careers)
.
What you’ll do
* You’ll essentially run a startup within a startup.
* You’re ready to work extremely hard. This is a senior role with high expectations.
* Given enough time, you’d be able to build Better Stack from scratch and take others with you along the way.
* You’re an extremely strong /^Full-?stack Engineer$/i.
* You can analyze business models and you’re the kind of person who constantly comes up with new product ideas.
* You’re able to validate your product idea with pre-product design interviews.
* You’re [great at user experience](https://sensible.com/dont-make-me-think/)
and copywriting.
* You can design and build a [simple, lovable, and complete product](https://longform.asmartbear.com/slc/)
.
* You understand the [difference between prototyping and production engineering](https://juraj.blog/p/two-sides)
.
* You’re not just a product manager or an engineering manager. During the first year of the product, you’ll be the most active code committer in the product’s Github repository. You’ll be leading your team by example from the front lines.
* You know that a product without distribution is useless, you read the [Coldstart problem](https://a16z.com/books/the-cold-start-problem/)
, and admire products with built-in virality.
* You’re a skilled engineering manager, both [a people manager](https://juraj.blog/p/giving-feedback)
, and [a strong technical leader](https://juraj.blog/p/100x-software-engineering)
.
* You love data and you watched [Alex Schultz’s lectures on growth](https://www.youtube.com/watch?v=n_yHZ_vKjno)
. You’re ready to watch the first 10,000 Fullstory session recordings of people using your product.
* You’re a decent sales person. You can hop on a podcast, give a lecture, and fly across the country for a product demo.
Why you should work with us
* Reading the above, you should be thinking: "if I can do all of those things, should I just start a startup myself?". Maybe you should! If that’s you, in fact you might be the perfect person for this job. Hear me out.
* Working with us, as opposed to starting your own startup, has multiple advantages:
* **You know you’ll get paid.** Most startups go to 0. With Better Stack you get no downside, yet an unlimited upside.
* **You’ll have way less stress.** You don’t have the balance sheet to worry about. You don’t need to calculate the runway till going bankrupt.
* Although you should be great at leading technical teams, **we’ll help you with the ugly side of managing people**. We’ll have your back.
* **You don’t have to deal with legal, operations, compliance or VCs.** You can fully focus on building great products. That’s a luxury most startup CEOs don’t have.
* **You’ll learn _a lot_.** You’ll work with the team who built Better Stack from the ground up. We’ve seen the story of building both successful and failed products many times. You’ll go faster with us.
* You can fully leverage Better Stack’s existing resources to make your product successful: our data processing infrastructure, consistent UI/UX language, the strong developer brand, and [our strong existing distribution](https://www.youtube.com/@betterstack)
.
* There’s close to 0 bureaucracy & politics at Better Stack. Your success will be fully in your hands.
* ...and you can always start your company afterwards!
[Apply](https://betterstack.typeform.com/apply-engineer)
### Recruiter
Hardcore
Remote (North America & Europe)
Prague
$50K - $100K/year + equity
$100K - $200K/year + equity
[Apply](https://betterstack.typeform.com/apply-non-tech)
The challenge
* Better Stack has an unusually high concentration of makers.
* Every manager is an individual contributor and there’s close to 0 bureaucracy and politics.
* If you like meetings and 'strategy sessions', probably look elsewhere.
* But if you like winning and feel great about getting stuff done, you might love it here!
* Help us find like-minded makers that want to build the future of software.
* The way we work is quite different to most places. In fact, [most people would probably not want to work with us](https://old.reddit.com/r/ruby/comments/1gq860d/new_level_of_interview_hell/)
, and we think that’s ok! Most people should not build early stage startups, in fact.
* When done right, however, [even candidates we reject enjoy the interview experience](https://share.cleanshot.com/t6HMFwjF)
and learn a lot.
* If you’re smart, open minded, driven and can think for yourself, read on!
What you’ll do
* **Scout for new talented colleagues,** coordinate the hiring process, extend offers, and be the candidate’s voice throughout the company.
* **Talk to many new people every week** (20+ intro chats per week) and create genuine connections.
* **Balance inbound vs outbound hiring,** learning to spot candidates even if they never applied or may not have direct prior experience.
* **Work directly with both of our co-founders, our CTO,** and more teammates on bringing the very best people on board on-site in Prague as well as remotely in Europe and the US.
* Be in charge of creating an **[11-star candidate experience](https://www.youtube.com/watch?v=ntvueIsgQwc)
.**
* **[Craft extraordinary employer branding](https://www.youtube.com/watch?v=12D8zEdOPYo)** and make the company an obvious interview choice for talented candidates.
* **A great startup culture needs to be founder-driven.** You’ll be the fail-safe to make sure nothing falls through the cracks.
This might be for you if
* You **enjoy pitching a candidate the mission,** culture, product, and our work style.
* Learn fast and can [discuss engineering topics with engineers](https://betterstack.com/careers/engineering#our-tech-stack)
.
* You consider yourself **full-stack,** managing all aspects of recruiting, from sourcing to conducting intro calls with candidates, coordinating all stages of the interview process, and helping to extend the offer or providing the candidate with valuable feedback.
* You don’t hesitate to do a lot of outbound and you’re not waiting for candidates to apply on their own.
* You enjoy delighting candidates throughout the process by being fast, transparent, energetic, and kind.
* You have a builder’s mindset. There’s plenty of things we’re doing already, but a lot more we could be doing in the future!
* You are curious. You enjoy checking the latest trends and never miss an opportunity to read a good book, listen to a podcast episode, or watch a talk on talent or startup-related topics and share that knowledge.
Who you’ll work with
* A team of smart and talented colleagues who are extraordinary at what they do and collaborate together to build an amazing product. Namely:
* [Juraj](https://www.linkedin.com/in/jurajmasar/)
& [Veronika](https://www.linkedin.com/in/veronikakolejak/)
, both our co-founders, are hands-on and close to hiring every new colleague who joins the team. They’re the kind of founders who not only say the company is only as good as the people within the company; they act on it and are always ready to help bring more talented teammates on board. Both of them still interview all the candidates too, of course.
* [Tomas](https://www.linkedin.com/in/tom%C3%A1%C5%A1-hromada-8568344a/)
, our CTO, engaged in sourcing, interviewing, extending offers, and onboarding.
* [Magdalena](https://www.linkedin.com/in/magdalenahavlickova/)
has lived and traveled all over the world, which helps her connect with candidates and shape how Better Stack is seen from the outside. She takes care of growth, marketing, and technical recruiting, always juggling multiple hats with a focus on operational excellence. She is also a supporter of the [Ruby community.](https://www.linkedin.com/posts/magdalenahavlickova_grateful-for-the-chance-to-share-lessons-activity-7344846153022074880-4Dbm?utm_source=share)
* [Anna](https://www.linkedin.com/in/anna-rojkova/)
, our head of operations, who previously ran a space company developing software for satellites and probes.
Where to go next?
* Read about [what it’s like to work here](https://betterstack.com/careers)
– feel the atmosphere, understand the culture.
* Read more about how we [think about software engineering](https://betterstack.com/careers/engineering)
. It’s quite different from other companies! (Most of the principles we describe there apply to other parts of the company as well.)
[Apply](https://betterstack.typeform.com/apply-non-tech)
### Customer Engineer
Hardcore
Remote (North America & Europe)
Prague
$60K - $120K/year + equity
$120K - $240K/year + equity
[Apply](https://betterstack.typeform.com/apply-engineer)
The challenge
* Customers at the core of everything we do here and we strive to deliver an [11-star experience](https://coda.io/@reidhoffman/rituals-of-great-boards/11-star-experience-6)
to each and every one of them.
What you’ll do
* **Be the engineering guide for CTOs implementing Better Stack.** Work with engineers from companies around the world to implement the best in class observability.
* **Solve customer’s engineering challenges.** Identify issues, design and analyze the best solutions, or hop on a call to discuss your recommendations with your customers.
* **Dive into our code, monitoring dashboards, Vector configs** and get creative with solutions for any kind of stack our customers use.
* **Empower our customers** and help them implement the best practices for logging and incident management.
* **Shape the user experience** of our products. By talking with our customers daily, you’ll know what matters to them the most. Help make our tools the vehicle through which the engineering magic happens.
* **Bring your unique perspective** on how to solve any challenges that our customers may come across.
This might be for you if
* **You have an engineering background** and like our approach to [engineering](https://betterstack.com/careers/engineering)
culture.
* You are passionate about **driving change from the start to the finish line.** It will be up to you to talk with our customers, draft out the solutions, and solve their technical challenges.
* You are an **excellent and effective communicator with native-level English skills.** Both written and spoken form.
* **You are independent, resourceful, and not afraid to roll up your sleeves.**
* **You want to help us [build love brand](https://www.youtube.com/@betterstack)
.**
Who you’ll work with
* A team of smart and talented colleagues who are extraordinary at what they do and collaborate together to build an amazing product. Namely:
* [Veronika](https://linkedin.com/in/veronikakolejak/)
, our co-founder & COO, who was previously at Google and Shopify.
* [Simon](https://www.linkedin.com/in/simon-let/)
, our amazing engineer turned technical product manager.
* [Tomas](https://www.linkedin.com/in/tomas-hromada/)
, our CTO, hands on engineering wizard who still ships code daily.
Where to go next?
* [What it’s like to work here](https://betterstack.com/careers)
– feel the atmosphere, understand the culture.
* [How we think about software engineering](https://betterstack.com/careers/engineering)
(most of the principles we describe there apply to other parts of the company as well 😉).
[Apply](https://betterstack.typeform.com/apply-engineer)
### Customer Advocate
Hardcore
Remote (North America & Europe)
Prague
$30K - $120K/year + equity
$60K - $240K/year + equity
[Apply](https://betterstack.typeform.com/apply-non-tech)
The challenge
* Customers at the core of everything we do here and we strive to deliver an [11-star experience](https://coda.io/@reidhoffman/rituals-of-great-boards/11-star-experience-6)
to each and every one of them.
What you’ll do
* **Own your portfolio of client companies.** Educating their teams on new best practices, upselling them on new features, and helping them jump through the hoops of procurement departments. Think of it as being a consultant but [owning your work in the long-term](https://www.youtube.com/watch?v=-c4CNB80SRc&ab_channel=Malonus)
.
* **Build business relationships.** Be it a CTO, engineering team lead, or an indie hacker. We give everyone the [11-star experience](https://coda.io/@reidhoffman/rituals-of-great-boards/11-star-experience-6)
approach in everything we do.
* **Solve customer’s problems.** Identify issues, design and analyze the best solutions, or even hop on a call to discuss your recommendations with your customers.
* **Bring your unique perspective** on how to solve any challenges that our customers may come across.
This might be for you if
* You want to be a part of **a high-growth environment** and **engage in a client-facing consultant & advocacy role.**
* **You are passionate about learning and dive head straight into any challenge.** It will be up to you to discuss the technical challenges, organizational goals of our customers and be **responsible for driving the solutions from the start to the finish line.**
* You are an **excellent and effective communicator with native-level English skills.** Both written and spoken form.
* **You are independent, resourceful, and not afraid to roll up your sleeves.**
* **You want to help us [build love brand](https://www.youtube.com/@betterstack)
.**
Who you’ll work with
* A team of smart and talented colleagues who are extraordinary at what they do and collaborate together to build an amazing product. Namely:
* [Veronika](https://linkedin.com/in/veronikakolejak/)
, our co-founder & COO, who was previously at Google and Shopify.
* [Filip](https://www.linkedin.com/in/filipminhhoang/)
, our technical magician, who can help setup anything from config for an indie hacker to the migration of a 300-strong team.
* Our amazing engineers, whose wizard-level skills can solve any technical problem and are always willing to help, as well as our customer success and sales teams.
Where to go next?
* [What it’s like to work here](https://betterstack.com/careers)
– feel the atmosphere, understand the culture.
* Read about [How we think about software engineering](https://betterstack.com/careers/engineering)
.
[Apply](https://betterstack.typeform.com/apply-non-tech)
### Please accept cookies
We use cookies to authenticate users, improve the product user experience, and for [personalized ads](https://business.safety.google/privacy/)
. [Learn more.](https://betterstack.com/privacy)
Deny Accept required Accept all
---
# AWS S3 dashboard template | Better Stack
[Back to dashboards](https://betterstack.com/dashboards)
AWS S3
======
Scalable object storage for data of any size.
[Add dashboard](https://telemetry.betterstack.com/team/0/dashboards#template-95602)
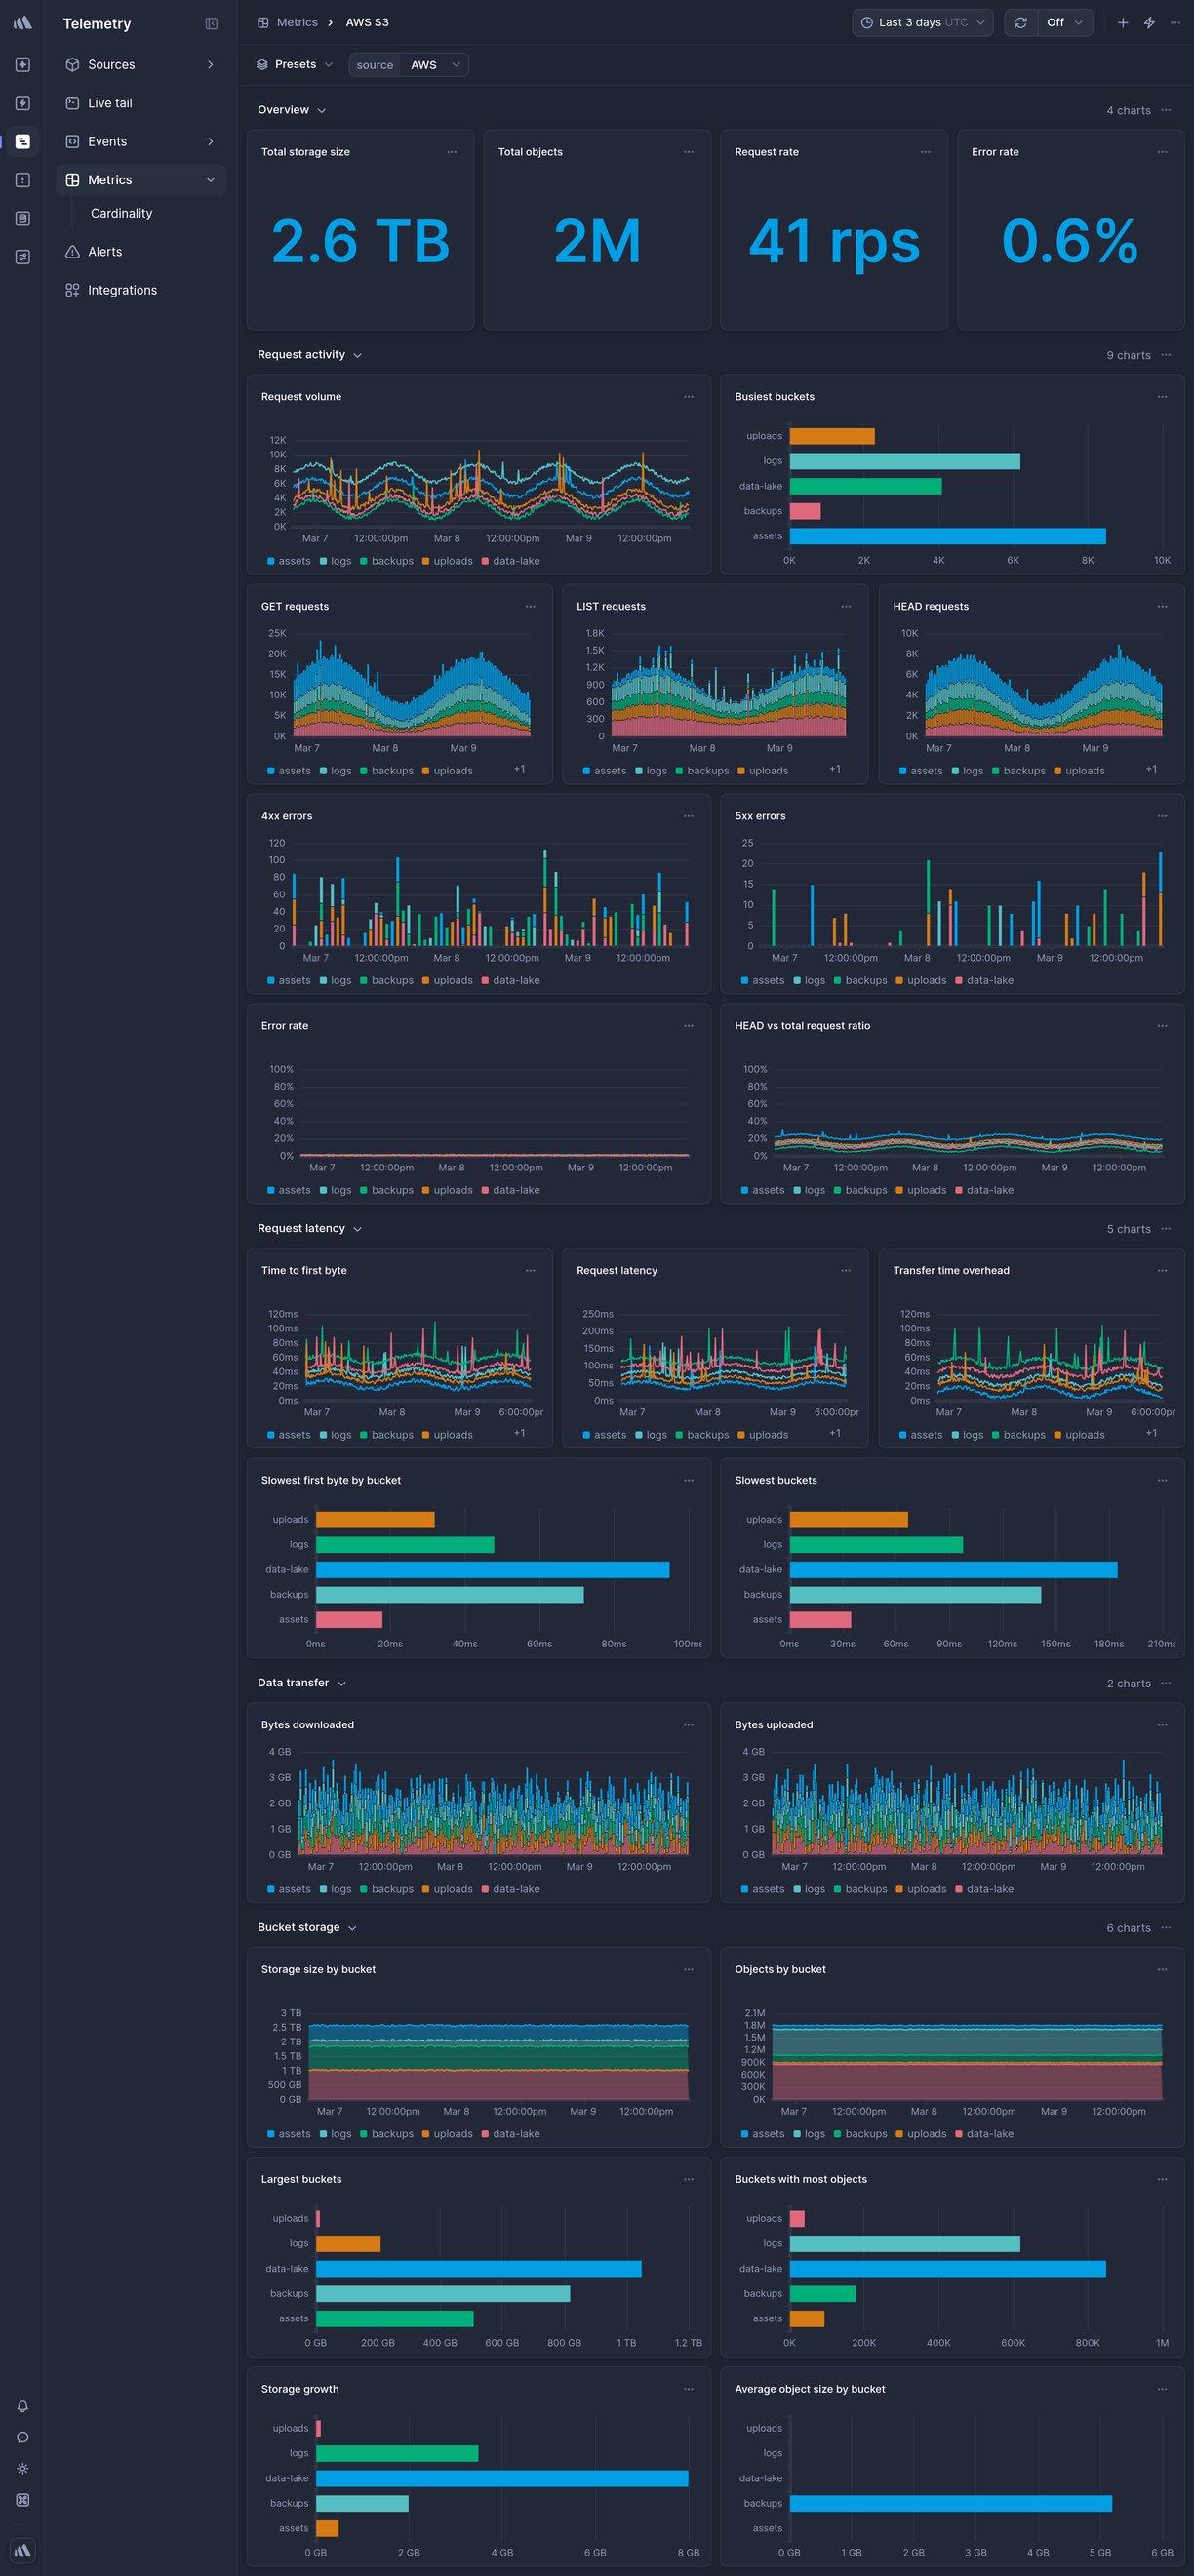
Data source
AWS CloudWatch
* * *

Overview
--------
This is a ready-made AWS S3 Telemetry dashboard in Better Stack.
To get it, [sign up](https://betterstack.com/users/sign-up)
for Better Stack, [connect your log or metrics source](https://betterstack.com/docs/logs/logging-start/)
, and select one of the beautiful [pre-built dashboards](https://betterstack.com/dashboards)
you want to get.
### What charts are included
* Request count
* Bucket size
* Errors
* Latency
* And much more, explore on your own to see all the chart options.

### How to create a custom chart
Need a custom chart? You can create one by writing a regular SQL query.
Here is how to do it:
1. **Pick a chart type:** the most popular options include a line chart, bar chart, pie chart, a single number, and a live tail (a stream of the newest logs).
2. **Pick a source and timeframe:** we use [variables](https://betterstack.com/docs/logs/dashboards/variables/)
in the SQL queries, which makes it easy to edit and work with any query. The main variables are `source` and `timeframe`. Once you set those, as in the example above, you can use the timeframe switcher easily, and the dashboard will update automatically.
3. **Write your SQL query:** there is no need to use any specific querying language. Just write SQL like you’re used to.
**Learn more:** [How to build SQL queries in Better Stack](https://betterstack.com/docs/logs/dashboards/sql-queries/)

### How to create an alert for a metric
You can get easily alerted on irregularities before they become incidents.
Everything is fully integrated into dashboards, there is no need to set up complex workflows.
Here are the most popular alert types:
* **Threshold Alerts:** Perfect for scenarios where you need to be notified when a metric crosses a certain predefined threshold. For instance, if your application's response time exceeds a set limit, you’ll get an alert.
* **Relative Alerts:** Want to monitor changes in metrics relative to their historical data? Whether it's an unexpected drop in sales, a surge in new user signups, or any other relative metric anomaly, we've got you covered.
* **Anomaly detection:** Use this alerting method if you're unsure about what threshold to set. It will notify you about any significant deviation from the predicted value of the series. Think of this method as covering what you didn’t even know can occur.
**Learn more:** [How to use alerts in Better Stack](https://betterstack.com/docs/logs/dashboards/alerts/)

### How to receive notification about issues
Once you set up what metric irregularities you want to get alerted to, you can select a broad spectrum of notification options.
The most popular include Slack, Microsoft Teams, Phone calls, SMS, emails, webhooks, and more.
The best part is that notifications within Better Stack are unlimited. This way, you don’t have to worry about being charged extra in case of significant incidents.
**Learn more:** [How to use escalation policies in Better Stack](https://betterstack.com/docs/uptime/escalation-policies/)
### How to set up your AWS S3 dashboard
Once you’ve signed up for [Better Stack](https://betterstack.com/logs)
, you can collect logs and metrics from AWS S3 in just 2 minutes. Here is the official [documentation](https://betterstack.com/docs/logs/aws-cloudformation/)
on how to do it.
Are you already using another log forwarder that you’re used to? See the documentation for [Fluent Bit](https://betterstack.com/docs/logs/fluent-bit/)
, [Logstash](https://betterstack.com/docs/logs/logstash/)
, [Fluentd](https://betterstack.com/docs/logs/fluentd/)
, [Filebeat](https://betterstack.com/docs/logs/filebeat/)
, [Syslog](https://betterstack.com/docs/logs/syslog-setup/)
, and [others](https://betterstack.com/docs/logs/start/)
.
### Have any questions?
Please feel free to message us at [hello@betterstack.com](mailto:hello@betterstack.com?subject=Question%20about%20Better%20Stack&body=)
.
We'll get back to you as soon as we can, typically within a few hours. 🙏 Thank you!
* * *
#### You might also like
[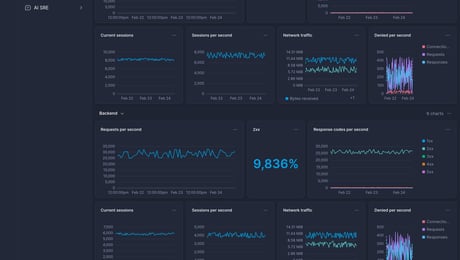\
\
### HAProxy\
\
Load balancer for TCP and HTTP.](https://betterstack.com/dashboards/haproxy)
[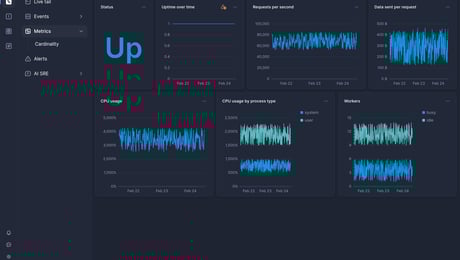\
\
### Apache\
\
Open-source HTTP server and load balancer.](https://betterstack.com/dashboards/apache)

### Please accept cookies
We use cookies to authenticate users, improve the product user experience, and for [personalized ads](https://business.safety.google/privacy/)
. [Learn more.](https://betterstack.com/privacy)
Deny Accept required Accept all
---
# GCP Compute Engine dashboard template | Better Stack
[Back to dashboards](https://betterstack.com/dashboards)
GCP Compute Engine
==================
Scalable virtual machine instances on Google Cloud.
[Add dashboard](https://telemetry.betterstack.com/team/0/dashboards#template-95611)
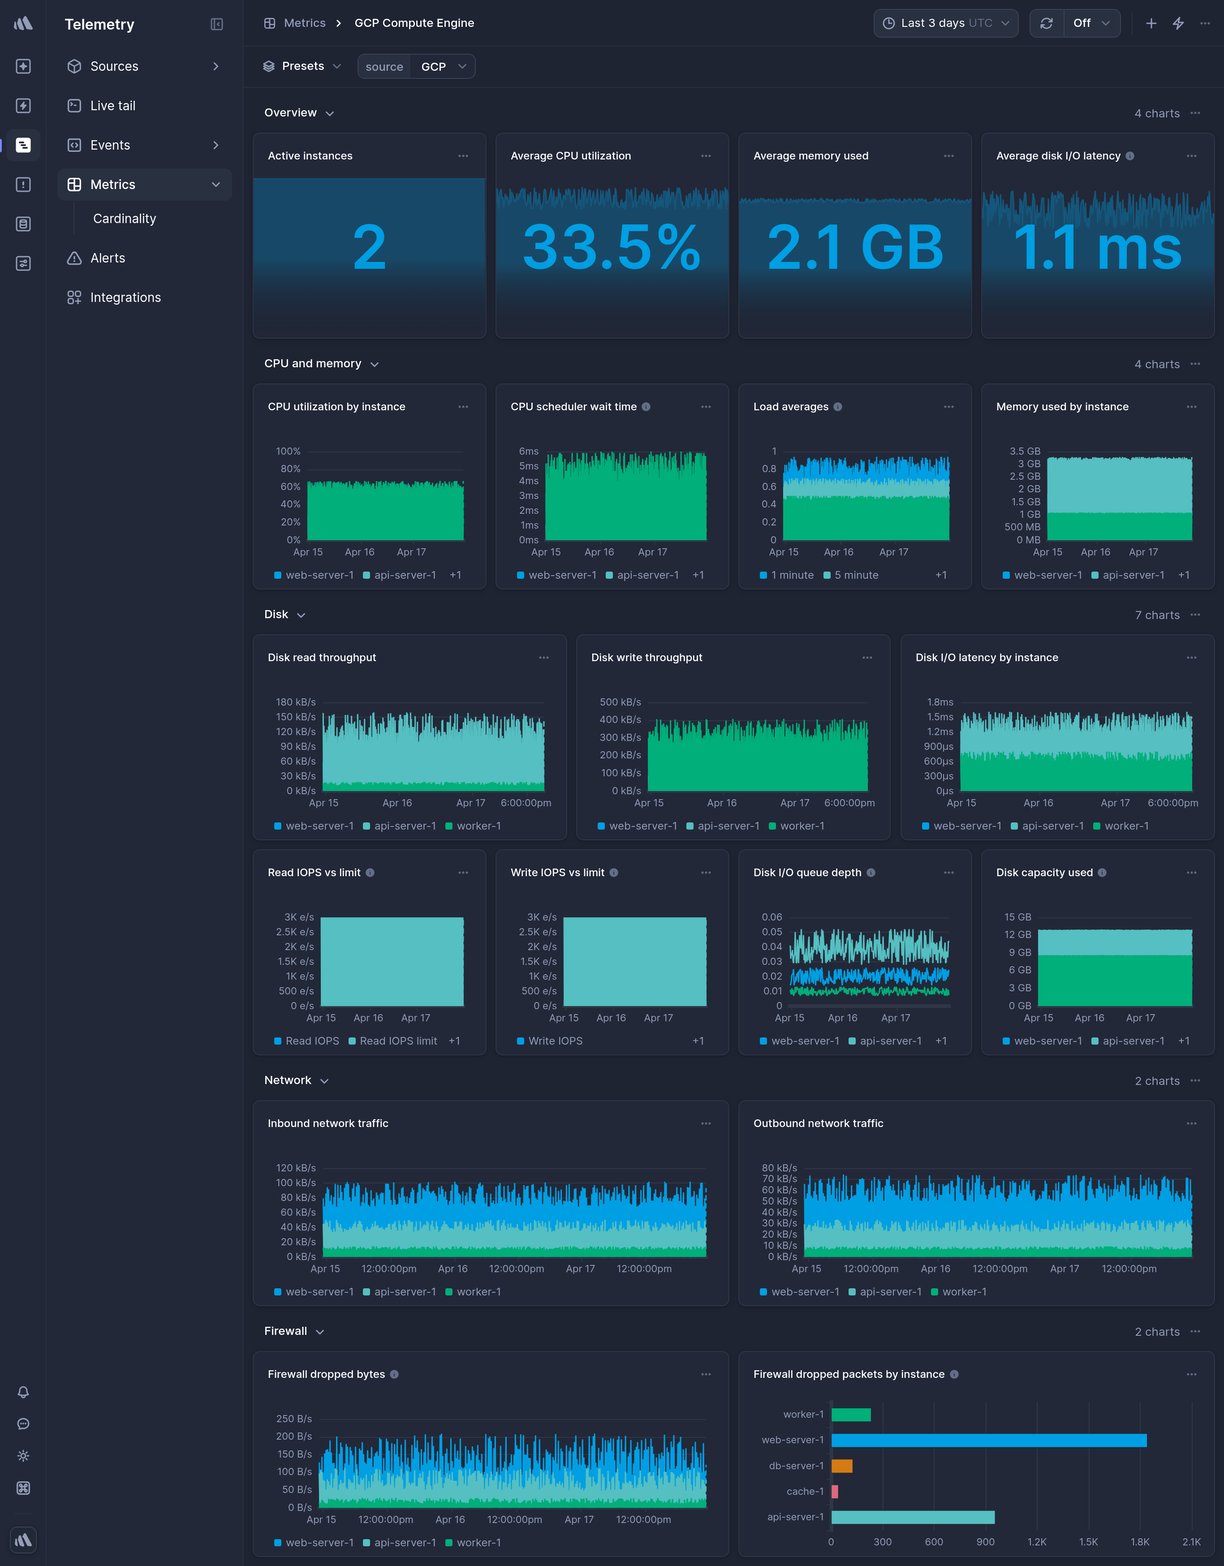
Data source
Google Cloud Monitoring
* * *

Overview
--------
This is a ready-made GCP Compute Engine Telemetry dashboard in Better Stack.
To get it, [sign up](https://betterstack.com/users/sign-up)
for Better Stack, [connect your log or metrics source](https://betterstack.com/docs/logs/logging-start/)
, and select one of the beautiful [pre-built dashboards](https://betterstack.com/dashboards)
you want to get.
### What charts are included
* CPU utilization
* Memory usage
* Network traffic
* Disk I/O
* Instance count
* And much more, explore on your own to see all the chart options.

### How to create a custom chart
Need a custom chart? You can create one by writing a regular SQL query.
Here is how to do it:
1. **Pick a chart type:** the most popular options include a line chart, bar chart, pie chart, a single number, and a live tail (a stream of the newest logs).
2. **Pick a source and timeframe:** we use [variables](https://betterstack.com/docs/logs/dashboards/variables/)
in the SQL queries, which makes it easy to edit and work with any query. The main variables are `source` and `timeframe`. Once you set those, as in the example above, you can use the timeframe switcher easily, and the dashboard will update automatically.
3. **Write your SQL query:** there is no need to use any specific querying language. Just write SQL like you’re used to.
**Learn more:** [How to build SQL queries in Better Stack](https://betterstack.com/docs/logs/dashboards/sql-queries/)

### How to create an alert for a metric
You can get easily alerted on irregularities before they become incidents.
Everything is fully integrated into dashboards, there is no need to set up complex workflows.
Here are the most popular alert types:
* **Threshold Alerts:** Perfect for scenarios where you need to be notified when a metric crosses a certain predefined threshold. For instance, if your application's response time exceeds a set limit, you’ll get an alert.
* **Relative Alerts:** Want to monitor changes in metrics relative to their historical data? Whether it's an unexpected drop in sales, a surge in new user signups, or any other relative metric anomaly, we've got you covered.
* **Anomaly detection:** Use this alerting method if you're unsure about what threshold to set. It will notify you about any significant deviation from the predicted value of the series. Think of this method as covering what you didn’t even know can occur.
**Learn more:** [How to use alerts in Better Stack](https://betterstack.com/docs/logs/dashboards/alerts/)

### How to receive notification about issues
Once you set up what metric irregularities you want to get alerted to, you can select a broad spectrum of notification options.
The most popular include Slack, Microsoft Teams, Phone calls, SMS, emails, webhooks, and more.
The best part is that notifications within Better Stack are unlimited. This way, you don’t have to worry about being charged extra in case of significant incidents.
**Learn more:** [How to use escalation policies in Better Stack](https://betterstack.com/docs/uptime/escalation-policies/)
### How to set up your GCP Compute Engine dashboard
Once you’ve signed up for [Better Stack](https://betterstack.com/logs)
, you can collect logs and metrics from GCP Compute Engine in just 2 minutes. Here is the official [documentation](https://betterstack.com/docs/logs/google-cloud/)
on how to do it.
Are you already using another log forwarder that you’re used to? See the documentation for [Fluent Bit](https://betterstack.com/docs/logs/fluent-bit/)
, [Logstash](https://betterstack.com/docs/logs/logstash/)
, [Fluentd](https://betterstack.com/docs/logs/fluentd/)
, [Filebeat](https://betterstack.com/docs/logs/filebeat/)
, [Syslog](https://betterstack.com/docs/logs/syslog-setup/)
, and [others](https://betterstack.com/docs/logs/start/)
.
### Have any questions?
Please feel free to message us at [hello@betterstack.com](mailto:hello@betterstack.com?subject=Question%20about%20Better%20Stack&body=)
.
We'll get back to you as soon as we can, typically within a few hours. 🙏 Thank you!
* * *
#### You might also like
[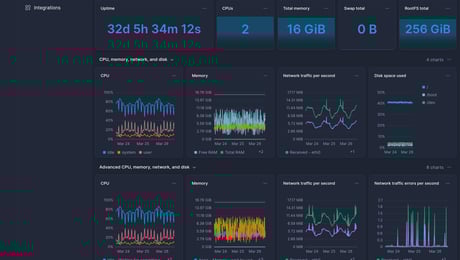\
\
### Host (Vector)\
\
Monitor your server with Vector metrics.](https://betterstack.com/dashboards/vector)
[\
\
### AWS SNS & SQS\
\
Managed messaging and queuing services for decoupled architectures.](https://betterstack.com/dashboards/aws-sns-sqs)

### Please accept cookies
We use cookies to authenticate users, improve the product user experience, and for [personalized ads](https://business.safety.google/privacy/)
. [Learn more.](https://betterstack.com/privacy)
Deny Accept required Accept all
---
# AWS Lambda dashboard template | Better Stack
[Back to dashboards](https://betterstack.com/dashboards)
AWS Lambda
==========
Serverless compute service that runs code in response to events.
[Add dashboard](https://telemetry.betterstack.com/team/0/dashboards#template-95596)
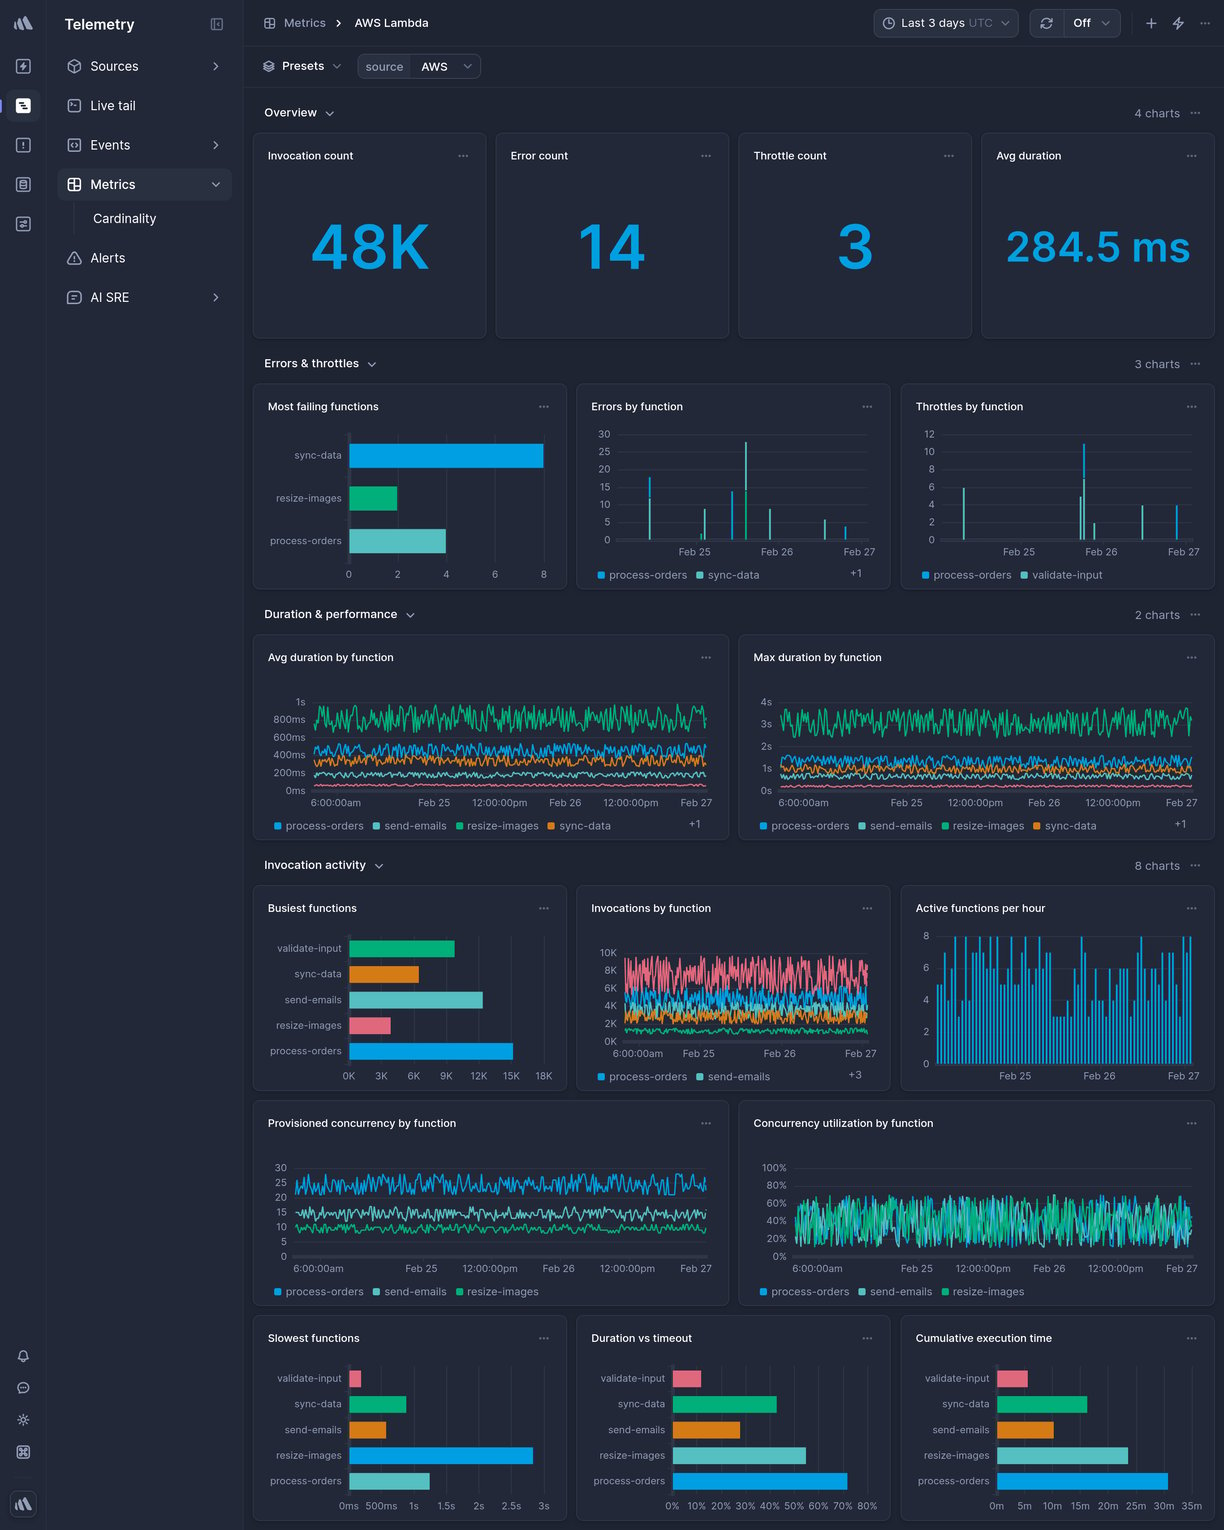
Data source
AWS CloudWatch
* * *

Overview
--------
This is a ready-made AWS Lambda Telemetry dashboard in Better Stack.
To get it, [sign up](https://betterstack.com/users/sign-up)
for Better Stack, [connect your log or metrics source](https://betterstack.com/docs/logs/logging-start/)
, and select one of the beautiful [pre-built dashboards](https://betterstack.com/dashboards)
you want to get.
### What charts are included
* Invocations
* Duration
* Errors
* Throttles
* And much more, explore on your own to see all the chart options.

### How to create a custom chart
Need a custom chart? You can create one by writing a regular SQL query.
Here is how to do it:
1. **Pick a chart type:** the most popular options include a line chart, bar chart, pie chart, a single number, and a live tail (a stream of the newest logs).
2. **Pick a source and timeframe:** we use [variables](https://betterstack.com/docs/logs/dashboards/variables/)
in the SQL queries, which makes it easy to edit and work with any query. The main variables are `source` and `timeframe`. Once you set those, as in the example above, you can use the timeframe switcher easily, and the dashboard will update automatically.
3. **Write your SQL query:** there is no need to use any specific querying language. Just write SQL like you’re used to.
**Learn more:** [How to build SQL queries in Better Stack](https://betterstack.com/docs/logs/dashboards/sql-queries/)

### How to create an alert for a metric
You can get easily alerted on irregularities before they become incidents.
Everything is fully integrated into dashboards, there is no need to set up complex workflows.
Here are the most popular alert types:
* **Threshold Alerts:** Perfect for scenarios where you need to be notified when a metric crosses a certain predefined threshold. For instance, if your application's response time exceeds a set limit, you’ll get an alert.
* **Relative Alerts:** Want to monitor changes in metrics relative to their historical data? Whether it's an unexpected drop in sales, a surge in new user signups, or any other relative metric anomaly, we've got you covered.
* **Anomaly detection:** Use this alerting method if you're unsure about what threshold to set. It will notify you about any significant deviation from the predicted value of the series. Think of this method as covering what you didn’t even know can occur.
**Learn more:** [How to use alerts in Better Stack](https://betterstack.com/docs/logs/dashboards/alerts/)

### How to receive notification about issues
Once you set up what metric irregularities you want to get alerted to, you can select a broad spectrum of notification options.
The most popular include Slack, Microsoft Teams, Phone calls, SMS, emails, webhooks, and more.
The best part is that notifications within Better Stack are unlimited. This way, you don’t have to worry about being charged extra in case of significant incidents.
**Learn more:** [How to use escalation policies in Better Stack](https://betterstack.com/docs/uptime/escalation-policies/)
### How to set up your AWS Lambda dashboard
Once you’ve signed up for [Better Stack](https://betterstack.com/logs)
, you can collect logs and metrics from AWS Lambda in just 2 minutes. Here is the official [documentation](https://betterstack.com/docs/logs/aws-cloudformation/)
on how to do it.
Are you already using another log forwarder that you’re used to? See the documentation for [Fluent Bit](https://betterstack.com/docs/logs/fluent-bit/)
, [Logstash](https://betterstack.com/docs/logs/logstash/)
, [Fluentd](https://betterstack.com/docs/logs/fluentd/)
, [Filebeat](https://betterstack.com/docs/logs/filebeat/)
, [Syslog](https://betterstack.com/docs/logs/syslog-setup/)
, and [others](https://betterstack.com/docs/logs/start/)
.
### Have any questions?
Please feel free to message us at [hello@betterstack.com](mailto:hello@betterstack.com?subject=Question%20about%20Better%20Stack&body=)
.
We'll get back to you as soon as we can, typically within a few hours. 🙏 Thank you!
* * *
#### You might also like
[\
\
### AWS ECS\
\
Container orchestration service on AWS.](https://betterstack.com/dashboards/aws-ecs)
[\
\
### Traefik\
\
Open-source reverse proxy and load balancer for HTTP and TCP-based applications.](https://betterstack.com/dashboards/traefik)

### Please accept cookies
We use cookies to authenticate users, improve the product user experience, and for [personalized ads](https://business.safety.google/privacy/)
. [Learn more.](https://betterstack.com/privacy)
Deny Accept required Accept all
---
# AWS RDS MySQL dashboard template | Better Stack
[Back to dashboards](https://betterstack.com/dashboards)
AWS RDS MySQL
=============
Managed MySQL-compatible relational database on AWS.
[Add dashboard](https://telemetry.betterstack.com/team/0/dashboards#template-95595)
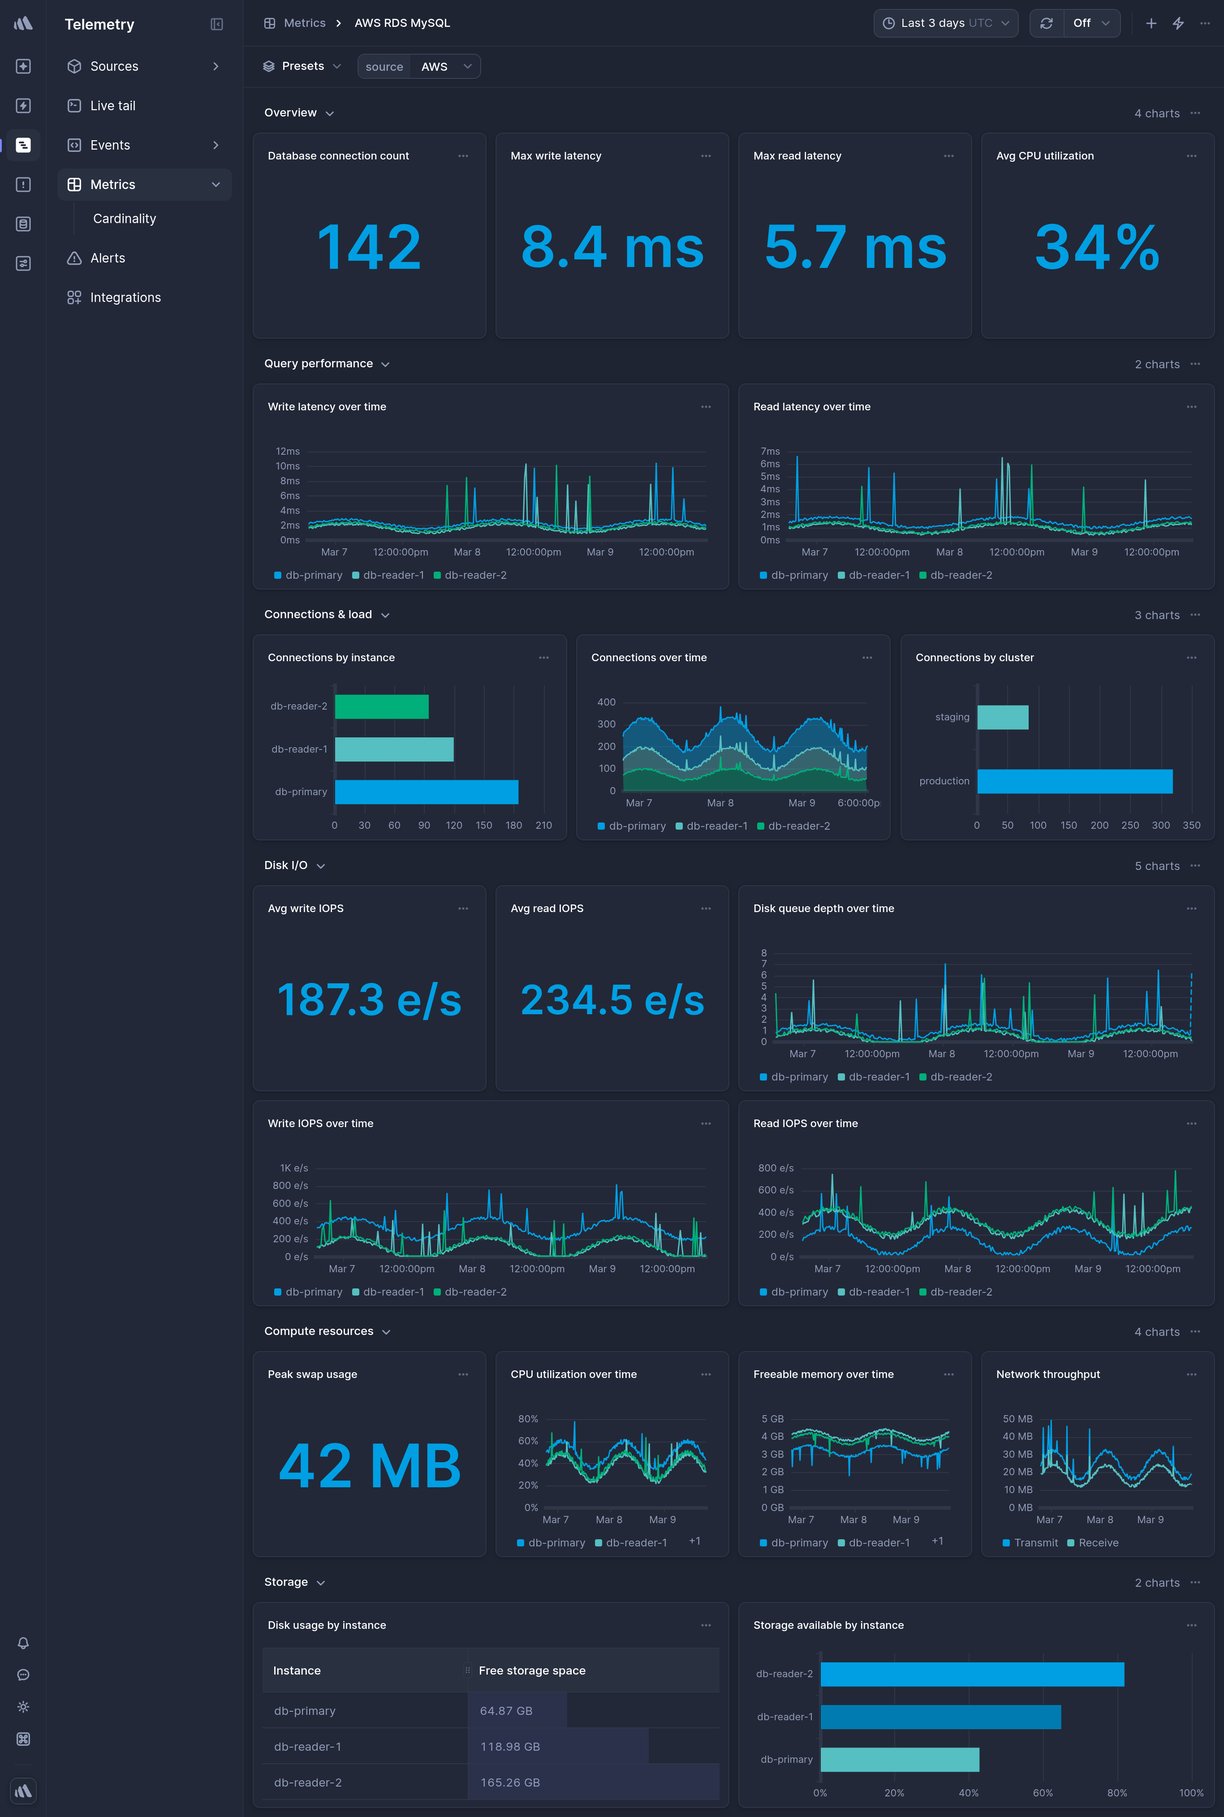
Data source
AWS CloudWatch
* * *

Overview
--------
This is a ready-made AWS RDS MySQL Telemetry dashboard in Better Stack.
To get it, [sign up](https://betterstack.com/users/sign-up)
for Better Stack, [connect your log or metrics source](https://betterstack.com/docs/logs/logging-start/)
, and select one of the beautiful [pre-built dashboards](https://betterstack.com/dashboards)
you want to get.
### What charts are included
* CPU utilization
* Database connections
* Read/Write IOPS
* Free storage space
* And much more, explore on your own to see all the chart options.

### How to create a custom chart
Need a custom chart? You can create one by writing a regular SQL query.
Here is how to do it:
1. **Pick a chart type:** the most popular options include a line chart, bar chart, pie chart, a single number, and a live tail (a stream of the newest logs).
2. **Pick a source and timeframe:** we use [variables](https://betterstack.com/docs/logs/dashboards/variables/)
in the SQL queries, which makes it easy to edit and work with any query. The main variables are `source` and `timeframe`. Once you set those, as in the example above, you can use the timeframe switcher easily, and the dashboard will update automatically.
3. **Write your SQL query:** there is no need to use any specific querying language. Just write SQL like you’re used to.
**Learn more:** [How to build SQL queries in Better Stack](https://betterstack.com/docs/logs/dashboards/sql-queries/)

### How to create an alert for a metric
You can get easily alerted on irregularities before they become incidents.
Everything is fully integrated into dashboards, there is no need to set up complex workflows.
Here are the most popular alert types:
* **Threshold Alerts:** Perfect for scenarios where you need to be notified when a metric crosses a certain predefined threshold. For instance, if your application's response time exceeds a set limit, you’ll get an alert.
* **Relative Alerts:** Want to monitor changes in metrics relative to their historical data? Whether it's an unexpected drop in sales, a surge in new user signups, or any other relative metric anomaly, we've got you covered.
* **Anomaly detection:** Use this alerting method if you're unsure about what threshold to set. It will notify you about any significant deviation from the predicted value of the series. Think of this method as covering what you didn’t even know can occur.
**Learn more:** [How to use alerts in Better Stack](https://betterstack.com/docs/logs/dashboards/alerts/)

### How to receive notification about issues
Once you set up what metric irregularities you want to get alerted to, you can select a broad spectrum of notification options.
The most popular include Slack, Microsoft Teams, Phone calls, SMS, emails, webhooks, and more.
The best part is that notifications within Better Stack are unlimited. This way, you don’t have to worry about being charged extra in case of significant incidents.
**Learn more:** [How to use escalation policies in Better Stack](https://betterstack.com/docs/uptime/escalation-policies/)
### How to set up your AWS RDS MySQL dashboard
Once you’ve signed up for [Better Stack](https://betterstack.com/logs)
, you can collect logs and metrics from AWS RDS MySQL in just 2 minutes. Here is the official [documentation](https://betterstack.com/docs/logs/aws-cloudformation/)
on how to do it.
Are you already using another log forwarder that you’re used to? See the documentation for [Fluent Bit](https://betterstack.com/docs/logs/fluent-bit/)
, [Logstash](https://betterstack.com/docs/logs/logstash/)
, [Fluentd](https://betterstack.com/docs/logs/fluentd/)
, [Filebeat](https://betterstack.com/docs/logs/filebeat/)
, [Syslog](https://betterstack.com/docs/logs/syslog-setup/)
, and [others](https://betterstack.com/docs/logs/start/)
.
### Have any questions?
Please feel free to message us at [hello@betterstack.com](mailto:hello@betterstack.com?subject=Question%20about%20Better%20Stack&body=)
.
We'll get back to you as soon as we can, typically within a few hours. 🙏 Thank you!
* * *
#### You might also like
[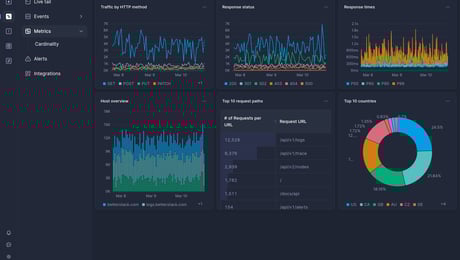\
\
### Cloudflare HTTP Requests\
\
HTTP requests processed by Cloudflare. Uses http\_requests Logpush dataset.](https://betterstack.com/dashboards/cloudflare-logpush-http-requests)
[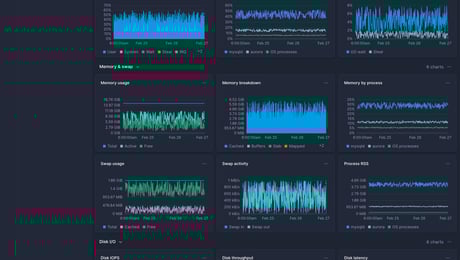\
\
### AWS RDS Enhanced Monitoring\
\
OS-level metrics for RDS instances at per-second granularity.](https://betterstack.com/dashboards/aws-rds-enhanced-monitoring)

### Please accept cookies
We use cookies to authenticate users, improve the product user experience, and for [personalized ads](https://business.safety.google/privacy/)
. [Learn more.](https://betterstack.com/privacy)
Deny Accept required Accept all
---
# Better Stack Collector dashboard template | Better Stack
[Back to dashboards](https://betterstack.com/dashboards)
Better Stack Collector
======================
Monitor operations of the Better Stack collector.
[Add dashboard](https://telemetry.betterstack.com/team/0/dashboards#template-95574)
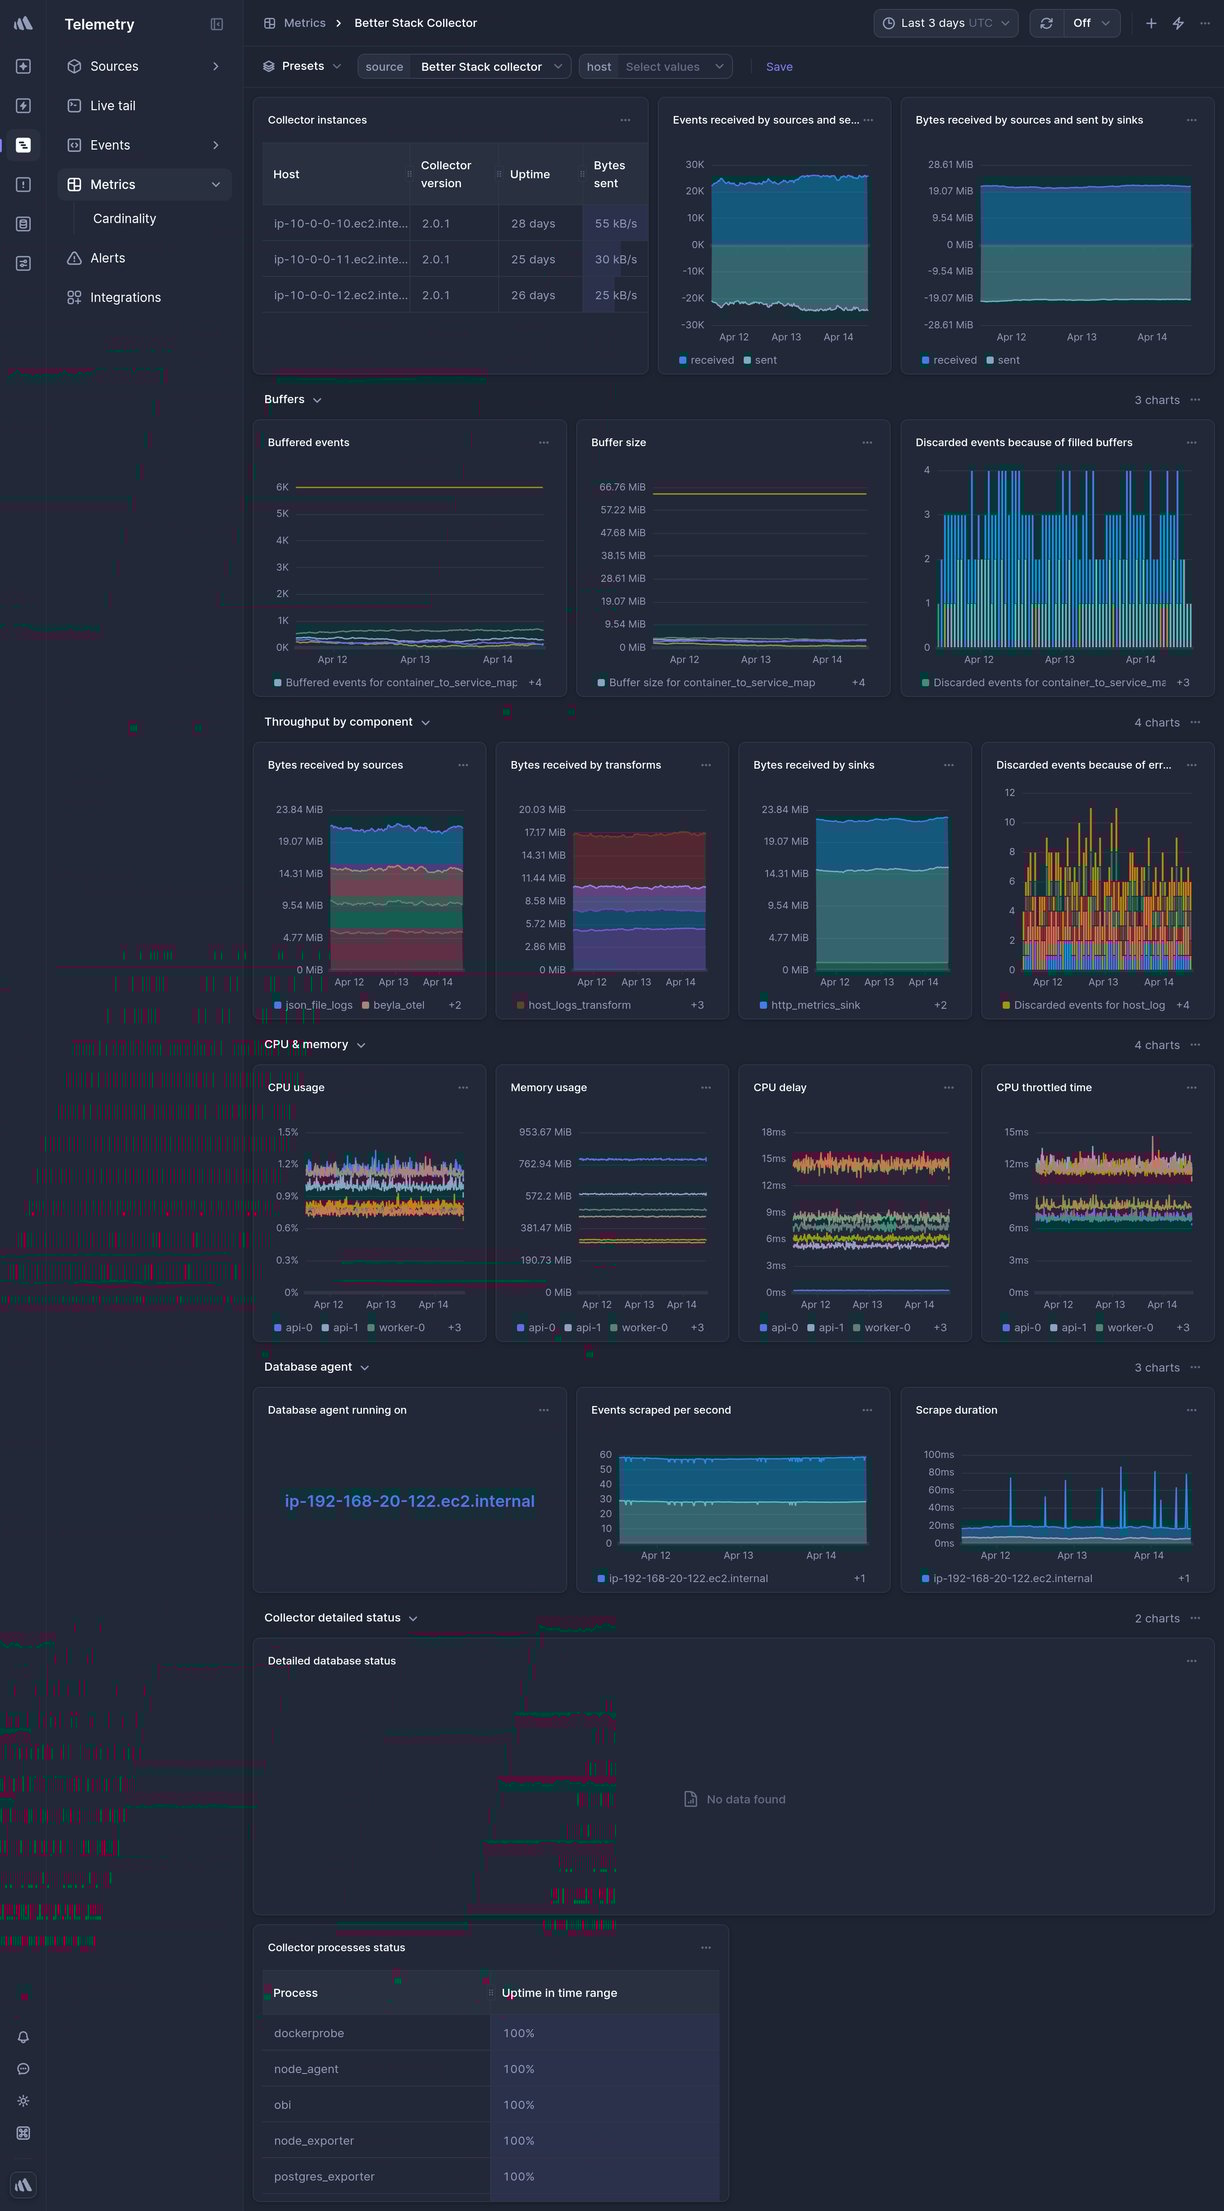
Data source
Better Stack collector
* * *

Overview
--------
This is a ready-made Better Stack Collector Telemetry dashboard in Better Stack.
To get it, [sign up](https://betterstack.com/users/sign-up)
for Better Stack, [connect your log or metrics source](https://betterstack.com/docs/logs/logging-start/)
, and select one of the beautiful [pre-built dashboards](https://betterstack.com/dashboards)
you want to get.
### What charts are included
* Collector uptime
* CPU usage
* Memory usage
* Disk usage
* Vector utilization
* And much more, explore on your own to see all the chart options.

### How to create a custom chart
Need a custom chart? You can create one by writing a regular SQL query.
Here is how to do it:
1. **Pick a chart type:** the most popular options include a line chart, bar chart, pie chart, a single number, and a live tail (a stream of the newest logs).
2. **Pick a source and timeframe:** we use [variables](https://betterstack.com/docs/logs/dashboards/variables/)
in the SQL queries, which makes it easy to edit and work with any query. The main variables are `source` and `timeframe`. Once you set those, as in the example above, you can use the timeframe switcher easily, and the dashboard will update automatically.
3. **Write your SQL query:** there is no need to use any specific querying language. Just write SQL like you’re used to.
**Learn more:** [How to build SQL queries in Better Stack](https://betterstack.com/docs/logs/dashboards/sql-queries/)

### How to create an alert for a metric
You can get easily alerted on irregularities before they become incidents.
Everything is fully integrated into dashboards, there is no need to set up complex workflows.
Here are the most popular alert types:
* **Threshold Alerts:** Perfect for scenarios where you need to be notified when a metric crosses a certain predefined threshold. For instance, if your application's response time exceeds a set limit, you’ll get an alert.
* **Relative Alerts:** Want to monitor changes in metrics relative to their historical data? Whether it's an unexpected drop in sales, a surge in new user signups, or any other relative metric anomaly, we've got you covered.
* **Anomaly detection:** Use this alerting method if you're unsure about what threshold to set. It will notify you about any significant deviation from the predicted value of the series. Think of this method as covering what you didn’t even know can occur.
**Learn more:** [How to use alerts in Better Stack](https://betterstack.com/docs/logs/dashboards/alerts/)

### How to receive notification about issues
Once you set up what metric irregularities you want to get alerted to, you can select a broad spectrum of notification options.
The most popular include Slack, Microsoft Teams, Phone calls, SMS, emails, webhooks, and more.
The best part is that notifications within Better Stack are unlimited. This way, you don’t have to worry about being charged extra in case of significant incidents.
**Learn more:** [How to use escalation policies in Better Stack](https://betterstack.com/docs/uptime/escalation-policies/)
### How to set up your Better Stack Collector dashboard
Once you’ve signed up for [Better Stack](https://betterstack.com/logs)
, you can collect logs and metrics from Better Stack Collector in just 2 minutes. Here is the official [documentation](https://betterstack.com/docs/logs/collector/)
on how to do it.
Are you already using another log forwarder that you’re used to? See the documentation for [Fluent Bit](https://betterstack.com/docs/logs/fluent-bit/)
, [Logstash](https://betterstack.com/docs/logs/logstash/)
, [Fluentd](https://betterstack.com/docs/logs/fluentd/)
, [Filebeat](https://betterstack.com/docs/logs/filebeat/)
, [Syslog](https://betterstack.com/docs/logs/syslog-setup/)
, and [others](https://betterstack.com/docs/logs/start/)
.
### Have any questions?
Please feel free to message us at [hello@betterstack.com](mailto:hello@betterstack.com?subject=Question%20about%20Better%20Stack&body=)
.
We'll get back to you as soon as we can, typically within a few hours. 🙏 Thank you!
* * *
#### You might also like
[\
\
### GCP Cloud Storage\
\
Scalable object storage for data of any size.](https://betterstack.com/dashboards/gcp-cloud-storage)
[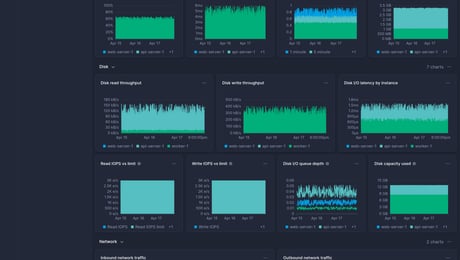\
\
### GCP Compute Engine\
\
Scalable virtual machine instances on Google Cloud.](https://betterstack.com/dashboards/gcp-compute-engine)

### Please accept cookies
We use cookies to authenticate users, improve the product user experience, and for [personalized ads](https://business.safety.google/privacy/)
. [Learn more.](https://betterstack.com/privacy)
Deny Accept required Accept all
---
# Time series data warehouse as an API | Better Stack
Time series data warehouse as an API
====================================
Ingest petabytes and run analytical SQL queries at scale.
So affordable you’ll ask what’s wrong with it.
Integrate in 5 minutes
Have a 100TB+ dataset? [Book a consultation](https://betterstack.com/book-a-demo)
Relied on by the world’s best engineering teams
* * *
Get a time series data warehouse as an API without the scaling headache
-----------------------------------------------------------------------
01
01
Ingest petabytes of JSON, NDJSON or MessagePack via HTTP
cURL
Response
Run
curl
\-X POST https://s1554406.eu-nbg-2.betterstackdata.com \\
\-H "Authorization: Bearer JiATyrxDfaAR9cP1erYDytMR" \\
\-H "Content-Type: application/json" \\
\-d Loading
02
02
Run SQL queries via cURL, Metabase or Grafana
cURL
Response
Run
curl \-u uBSo9t0g3eqiITS6hN8QLIuIOpkYLo0hN:jJzkwCCipA2LIwf6h1yo3IzpK36jjEQKp9swg86IxOgYbnXLmziJLmVtXSfnNwCC \\
\-H 'Content-Type: text/plain' \\
\-X POST 'https://eu-nbg-2-connect.betterstackdata.com?output\_format\_pretty\_row\_numbers=0' \\
\-d "SELECT
cpu\_cores,
countMerge(events\_count) AS visitors,
bar(visitors, 0, max(countMerge(events\_count)) OVER (), 50) AS histogram
FROM remote(t466713\_homepage\_timeseries)
WHERE cpu\_cores IS NOT NULL
GROUP BY cpu\_cores
ORDER BY visitors DESC
FORMAT Pretty"
03
03
Save queries as a client-facing APIs you can securely call from your frontend
cURL
Response
Run
curl "https://eu-nbg-2-connect.betterstackdata.com/query/wXZfp2nTzUY9OJUC6711jDqOwkP8XU4h.csv"
* * *
Scales beyond
-------------
MySQL
PostgreSQL
Supabase
MariaDB
MongoDB
Firebase
MySQL

Good fit
You have massive amounts of JSON events
Each event has a time attribute
You never need to update events once you ingest them
You need fast SQL queries at scale
Leverage ready-made APIs for saved queries
Not a good fit
You have just millions of events to store
You need to update individual records once ingested
Your events are not timestamped
You prefer overpaying for Snowflake to get invited into their invite-only events
* * *
So affordable you’ll ask what’s wrong with it
---------------------------------------------
Benefit from our economies of scale. We pass the savings on to you. Cheaper than self-hosting on AWS.
[Explore pricing](https://betterstack.com/pricing#warehouse)
Ingest up to
5x more data
with the same budget
or save up to
80%
of your costs
Ingest & store a 100 TB dataset, query it 100 times with compute similar to 320 vCPU and 320GB RAM and internet egress of 2x the original dataset
Better Stack Warehouse
approx.
$16,000
approx.
$16,000
Supabase
approx.
$43,000
approx.
$43,000
Snowflake
approx.
$56,000
approx.
$56,000
tinybird
approx.
$62,000
approx.
$62,000
BigQuery
approx.
$85,000
approx.
$85,000
Pinecone
approx.
$116,000
approx.
$116,000
* * *
Optimize AWS egress costs
-------------------------
Hosted on AWS? Leverage our ingestion endpoints hosted within AWS so that you don't need to pay AWS $0.09/GB for egress.
We've set up AWS Direct Connect so that you don't have to.
100 TB internet egress from Amazon Web Services
AWS Direct Connect with Better Stack
approx.
$4,096
approx.
$4,096
AWS internet egress
approx.
$9,216
approx.
$9,216
AWS internet egress priced at $0.09/GB. AWS Direct Connect with Better Stack priced at $0.04/GB. Hosted in eu-central-1, if you’re sending data from a different AWS region, you might also need to pay a #0.02/GB inter-region AWS fee.
* * *
Simple & predictable pricing
----------------------------

We charge for
$0.1/GB ingestion
$0.05/GB retention on object storage
$1/GB retention on fast NVMe SSD
Unlimited standard querying included
[Explore pricing](https://betterstack.com/pricing#warehouse)
Others charge for
Public internet data transfer
Inter region data transfer
vCPU hours
per-query GB/hours
Cached API requests
SOC 2 Type II compliance
Relied on by the world’s best engineering teams
* * *
No vendor lock-in:
Open formats in your own S3 bucket
-------------------------------------------------------
Host your data in your own S3-compatible bucket for full control.

### JSON events on object storage, time series on fast NVMe SSD
Get the best of both worlds: scalability and cost-efficiency of wide JSON events stored in object storage, and fast analytical queries with highly compressed time series stored on local NVMe SSD drives.

#### Available in 4 regions, custom deployments on request
Leverage our self-serve clusters in Virginia, Oregon, Germany or Singapore today or [request a deployment](mailto:hello@betterstack.com?subject=I%27m%20interested%20in%20custom%20deployment%20of%20Better%20Stack%20Warehouse&body=Monthly%20volume%3A%202%20PB%0ALocation%3A%20us-east%0ACompliance%3A%20SOC2%0ACustom%20bucket%3A%20yes%0A%0AAnything%20else%3A)
of a custom cluster with a dedicated S3 bucket in your own VPC.

#### Run SQL queries with an HTTP API
Your data is yours. Host it in your own S3 bucket and run arbitrary SQL queries via our HTTP API.
* * *
Everything you'd expect from a time series data warehouse
---------------------------------------------------------

### Built-in vector embeddings and approximate KNN
Generate vector embeddings without having to call an external API with our built-in embedding model embeddinggemma:300 and query embeddings fast with vector indexes. Run full-text search, multi-vector search and faceted search in a single query.

### Analyze petabyte-scale trends with query time sampling
Search raw JSON events with 100s of nodes from S3. Run arbitrary SQL queries and leverage query time sampling to get ad-hoc insights about trends at scale or store time series on NVMe SSD for fast analytical queries used in your APIs.
##### Transform JSON events at scale
Redact personally identifiable information or simply discard useless events so that you don't get billed.
##### Built-in geo IP at query time
Enrich every event with location data at query time. No preprocessing, no extra storage.
##### Ready-made client-facing APIs
Get Reddit-proof APIs for saved queries ready to serve millions of requests.
Free of charge.
##### MCP server
Connect new data sources, add new database credentials, and run queries from Claude or Cursor.
##### Terraform
Create new data sources, add temporary database credentials or remove data sources as needed.
##### Time-to-live
Drop your data automatically after a certain time frame by configuring an optional time-to-live.
##### Spending alerts
Get notified before costs exceed your budget with real-time notifications.
##### Detailed usage reporting
Understand every dollar you spend by data source, team, and feature.
##### Spending limit
Cap your costs automatically and never worry about surprise bills again.
* * *
Secure, scalable & compliant
----------------------------
### Everything your data privacy officer requires so that you can pass audits with a peace of mind.

#### SOC 2 Type 2
Request our SOC 2 Type 2 attestation upon signing an NDA.

#### GDPR-compliant
Comply with European Union’s general data privacy regulation.

#### ISO 27001 data centers
Ensuring strict data security standards.
Relied on by the world’s best engineering teams
Happy customers, growing market presence
----------------------------------------
Get started today. Try Better Stack risk-free with our 60-day money-back guarantee.
Ship higher-quality software faster. Be the hero of your engineering teams.
Integrate in 5 minutes
Have a 100TB+ dataset? [Book a consultation](https://betterstack.com/book-a-demo)
### Please accept cookies
We use cookies to authenticate users, improve the product user experience, and for [personalized ads](https://business.safety.google/privacy/)
. [Learn more.](https://betterstack.com/privacy)
Deny Accept required Accept all
---
# Cloudflare Worker Trace Events dashboard template | Better Stack
[Back to dashboards](https://betterstack.com/dashboards)
Cloudflare Worker Trace Events
==============================
Serverless execution at Cloudflare's edge. Uses worker\_trace\_events Logpush dataset
[Add dashboard](https://telemetry.betterstack.com/team/0/dashboards#template-94551)
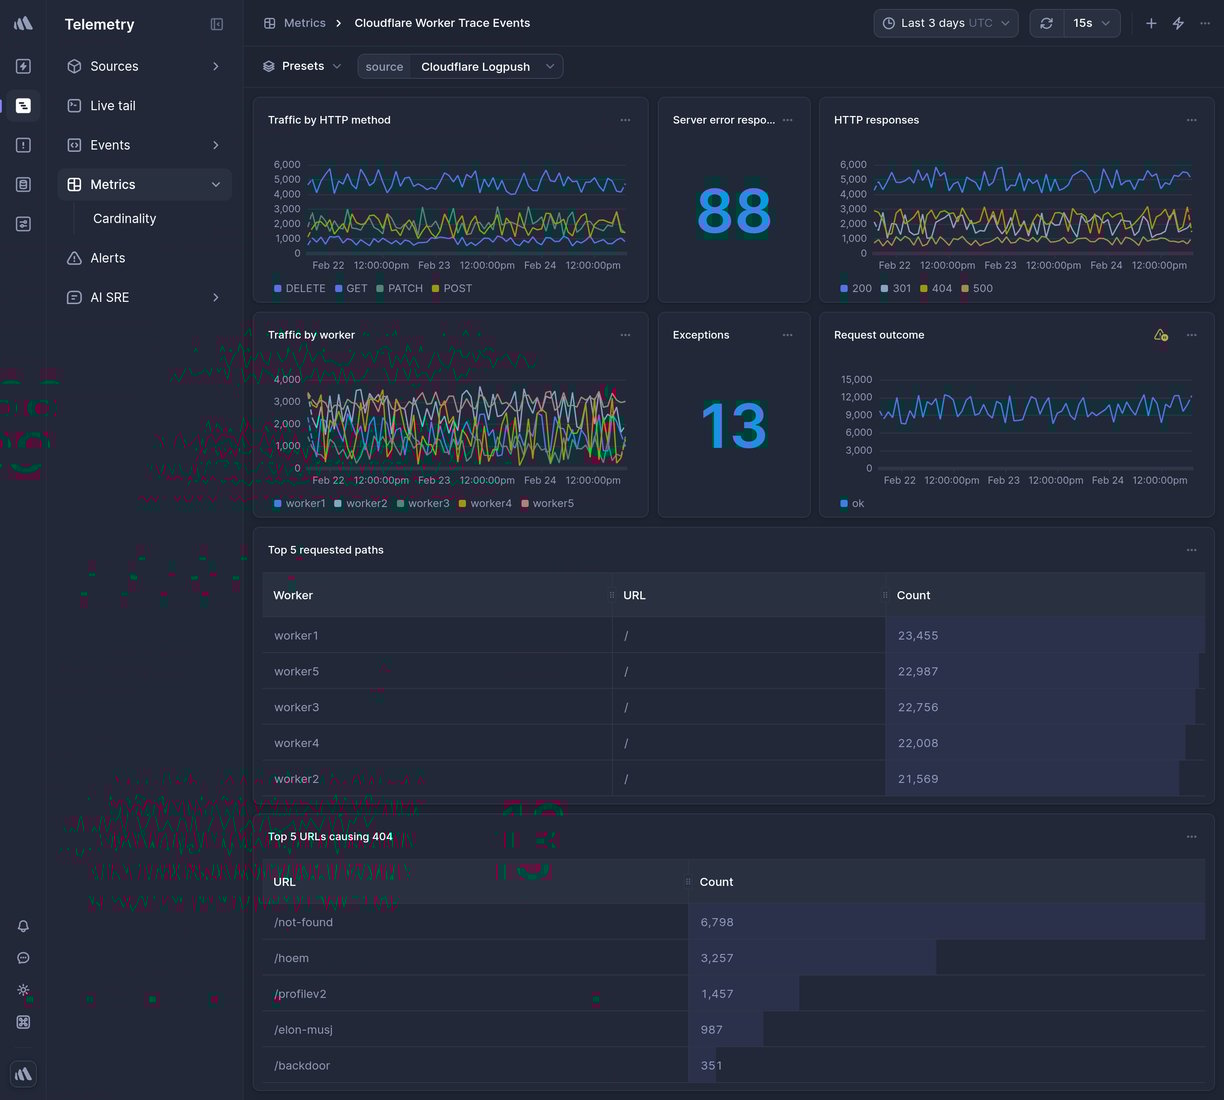
Data source
Cloudflare Logpush
* * *

Overview
--------
This is a ready-made Cloudflare Worker Trace Events Telemetry dashboard in Better Stack.
To get it, [sign up](https://betterstack.com/users/sign-up)
for Better Stack, [connect your log or metrics source](https://betterstack.com/docs/logs/logging-start/)
, and select one of the beautiful [pre-built dashboards](https://betterstack.com/dashboards)
you want to get.
### What charts are included
* Traffic by HTTP method
* Server error responses
* HTTP responses
* Traffic by worker
* Exceptions
* Requests outcomes
* Top 5 requested paths
* Top 5 URLs causing 404
* And much more, explore on your own to see all the chart options.

### How to create a custom chart
Need a custom chart? You can create one by writing a regular SQL query.
Here is how to do it:
1. **Pick a chart type:** the most popular options include a line chart, bar chart, pie chart, a single number, and a live tail (a stream of the newest logs).
2. **Pick a source and timeframe:** we use [variables](https://betterstack.com/docs/logs/dashboards/variables/)
in the SQL queries, which makes it easy to edit and work with any query. The main variables are `source` and `timeframe`. Once you set those, as in the example above, you can use the timeframe switcher easily, and the dashboard will update automatically.
3. **Write your SQL query:** there is no need to use any specific querying language. Just write SQL like you’re used to.
**Learn more:** [How to build SQL queries in Better Stack](https://betterstack.com/docs/logs/dashboards/sql-queries/)

### How to create an alert for a metric
You can get easily alerted on irregularities before they become incidents.
Everything is fully integrated into dashboards, there is no need to set up complex workflows.
Here are the most popular alert types:
* **Threshold Alerts:** Perfect for scenarios where you need to be notified when a metric crosses a certain predefined threshold. For instance, if your application's response time exceeds a set limit, you’ll get an alert.
* **Relative Alerts:** Want to monitor changes in metrics relative to their historical data? Whether it's an unexpected drop in sales, a surge in new user signups, or any other relative metric anomaly, we've got you covered.
* **Anomaly detection:** Use this alerting method if you're unsure about what threshold to set. It will notify you about any significant deviation from the predicted value of the series. Think of this method as covering what you didn’t even know can occur.
**Learn more:** [How to use alerts in Better Stack](https://betterstack.com/docs/logs/dashboards/alerts/)

### How to receive notification about issues
Once you set up what metric irregularities you want to get alerted to, you can select a broad spectrum of notification options.
The most popular include Slack, Microsoft Teams, Phone calls, SMS, emails, webhooks, and more.
The best part is that notifications within Better Stack are unlimited. This way, you don’t have to worry about being charged extra in case of significant incidents.
**Learn more:** [How to use escalation policies in Better Stack](https://betterstack.com/docs/uptime/escalation-policies/)
### How to set up your Cloudflare Worker Trace Events dashboard
Once you’ve signed up for [Better Stack](https://betterstack.com/logs)
, you can collect logs and metrics from Cloudflare Worker Trace Events in just 2 minutes. Here is the official [documentation](https://betterstack.com/docs/logs/cloudflare/logpush/)
on how to do it.
Are you already using another log forwarder that you’re used to? See the documentation for [Fluent Bit](https://betterstack.com/docs/logs/fluent-bit/)
, [Logstash](https://betterstack.com/docs/logs/logstash/)
, [Fluentd](https://betterstack.com/docs/logs/fluentd/)
, [Filebeat](https://betterstack.com/docs/logs/filebeat/)
, [Syslog](https://betterstack.com/docs/logs/syslog-setup/)
, and [others](https://betterstack.com/docs/logs/start/)
.
### Have any questions?
Please feel free to message us at [hello@betterstack.com](mailto:hello@betterstack.com?subject=Question%20about%20Better%20Stack&body=)
.
We'll get back to you as soon as we can, typically within a few hours. 🙏 Thank you!
* * *
#### You might also like
[\
\
### Heroku\
\
Cloud PaaS for easy app deployment.](https://betterstack.com/dashboards/heroku)
[\
\
### RabbitMQ\
\
Open-source message broker for complex message routing between systems.](https://betterstack.com/dashboards/rabbitmq)

### Please accept cookies
We use cookies to authenticate users, improve the product user experience, and for [personalized ads](https://business.safety.google/privacy/)
. [Learn more.](https://betterstack.com/privacy)
Deny Accept required Accept all
---
# GCP Cloud SQL dashboard template | Better Stack
[Back to dashboards](https://betterstack.com/dashboards)
GCP Cloud SQL
=============
Managed MySQL and PostgreSQL relational databases on Google Cloud.
[Add dashboard](https://telemetry.betterstack.com/team/0/dashboards#template-95614)
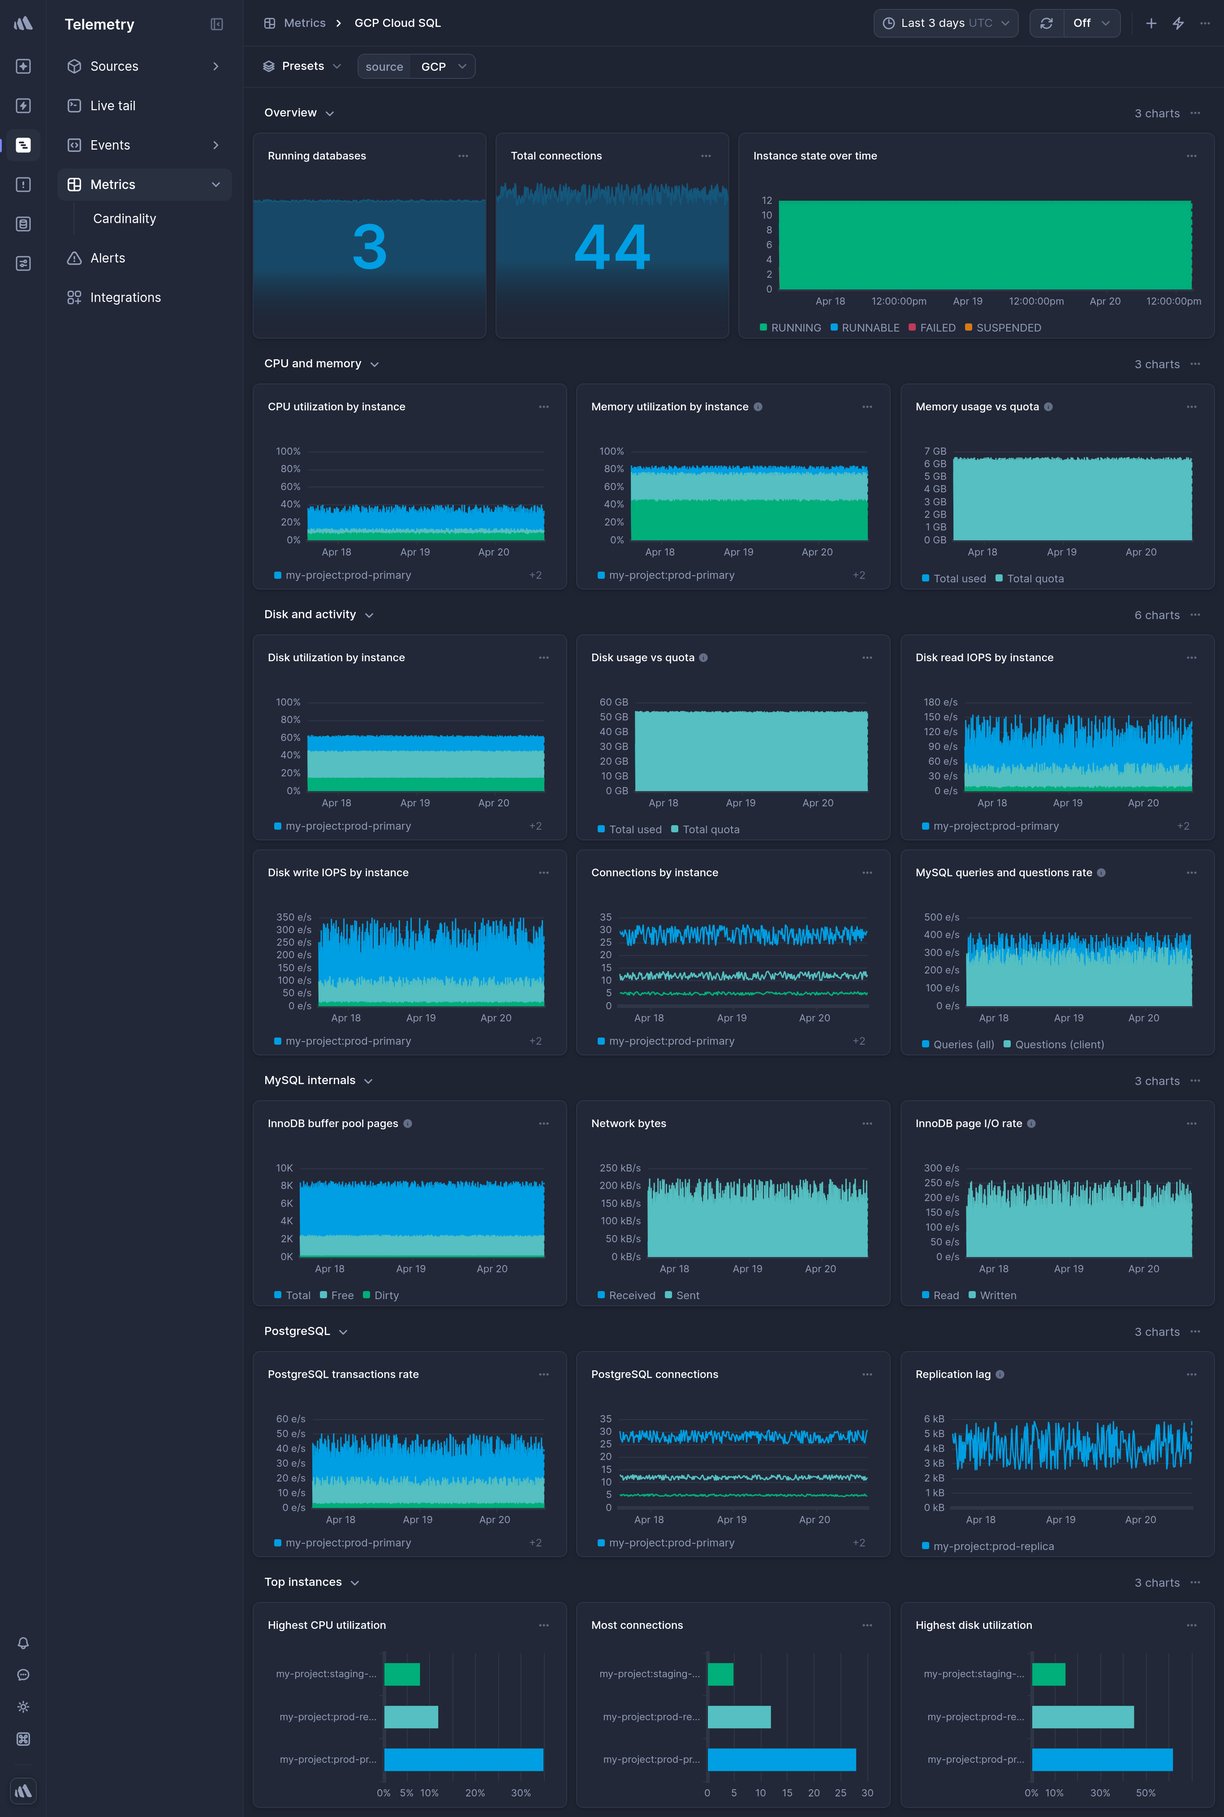
Data source
Google Cloud Monitoring
* * *

Overview
--------
This is a ready-made GCP Cloud SQL Telemetry dashboard in Better Stack.
To get it, [sign up](https://betterstack.com/users/sign-up)
for Better Stack, [connect your log or metrics source](https://betterstack.com/docs/logs/logging-start/)
, and select one of the beautiful [pre-built dashboards](https://betterstack.com/dashboards)
you want to get.
### What charts are included
* CPU utilization
* Database connections
* Disk I/O
* Query latency
* Replication lag
* And much more, explore on your own to see all the chart options.

### How to create a custom chart
Need a custom chart? You can create one by writing a regular SQL query.
Here is how to do it:
1. **Pick a chart type:** the most popular options include a line chart, bar chart, pie chart, a single number, and a live tail (a stream of the newest logs).
2. **Pick a source and timeframe:** we use [variables](https://betterstack.com/docs/logs/dashboards/variables/)
in the SQL queries, which makes it easy to edit and work with any query. The main variables are `source` and `timeframe`. Once you set those, as in the example above, you can use the timeframe switcher easily, and the dashboard will update automatically.
3. **Write your SQL query:** there is no need to use any specific querying language. Just write SQL like you’re used to.
**Learn more:** [How to build SQL queries in Better Stack](https://betterstack.com/docs/logs/dashboards/sql-queries/)

### How to create an alert for a metric
You can get easily alerted on irregularities before they become incidents.
Everything is fully integrated into dashboards, there is no need to set up complex workflows.
Here are the most popular alert types:
* **Threshold Alerts:** Perfect for scenarios where you need to be notified when a metric crosses a certain predefined threshold. For instance, if your application's response time exceeds a set limit, you’ll get an alert.
* **Relative Alerts:** Want to monitor changes in metrics relative to their historical data? Whether it's an unexpected drop in sales, a surge in new user signups, or any other relative metric anomaly, we've got you covered.
* **Anomaly detection:** Use this alerting method if you're unsure about what threshold to set. It will notify you about any significant deviation from the predicted value of the series. Think of this method as covering what you didn’t even know can occur.
**Learn more:** [How to use alerts in Better Stack](https://betterstack.com/docs/logs/dashboards/alerts/)

### How to receive notification about issues
Once you set up what metric irregularities you want to get alerted to, you can select a broad spectrum of notification options.
The most popular include Slack, Microsoft Teams, Phone calls, SMS, emails, webhooks, and more.
The best part is that notifications within Better Stack are unlimited. This way, you don’t have to worry about being charged extra in case of significant incidents.
**Learn more:** [How to use escalation policies in Better Stack](https://betterstack.com/docs/uptime/escalation-policies/)
### How to set up your GCP Cloud SQL dashboard
Once you’ve signed up for [Better Stack](https://betterstack.com/logs)
, you can collect logs and metrics from GCP Cloud SQL in just 2 minutes. Here is the official [documentation](https://betterstack.com/docs/logs/google-cloud/)
on how to do it.
Are you already using another log forwarder that you’re used to? See the documentation for [Fluent Bit](https://betterstack.com/docs/logs/fluent-bit/)
, [Logstash](https://betterstack.com/docs/logs/logstash/)
, [Fluentd](https://betterstack.com/docs/logs/fluentd/)
, [Filebeat](https://betterstack.com/docs/logs/filebeat/)
, [Syslog](https://betterstack.com/docs/logs/syslog-setup/)
, and [others](https://betterstack.com/docs/logs/start/)
.
### Have any questions?
Please feel free to message us at [hello@betterstack.com](mailto:hello@betterstack.com?subject=Question%20about%20Better%20Stack&body=)
.
We'll get back to you as soon as we can, typically within a few hours. 🙏 Thank you!
* * *
#### You might also like
[\
\
### Ruby on Rails\
\
Ruby web application framework.](https://betterstack.com/dashboards/ruby)
[\
\
### AWS RDS Enhanced Monitoring\
\
OS-level metrics for RDS instances at per-second granularity.](https://betterstack.com/dashboards/aws-rds-enhanced-monitoring)

### Please accept cookies
We use cookies to authenticate users, improve the product user experience, and for [personalized ads](https://business.safety.google/privacy/)
. [Learn more.](https://betterstack.com/privacy)
Deny Accept required Accept all
---
# GCP Cloud Spanner dashboard template | Better Stack
[Back to dashboards](https://betterstack.com/dashboards)
GCP Cloud Spanner
=================
Globally distributed, horizontally scalable relational database.
[Add dashboard](https://telemetry.betterstack.com/team/0/dashboards#template-95619)
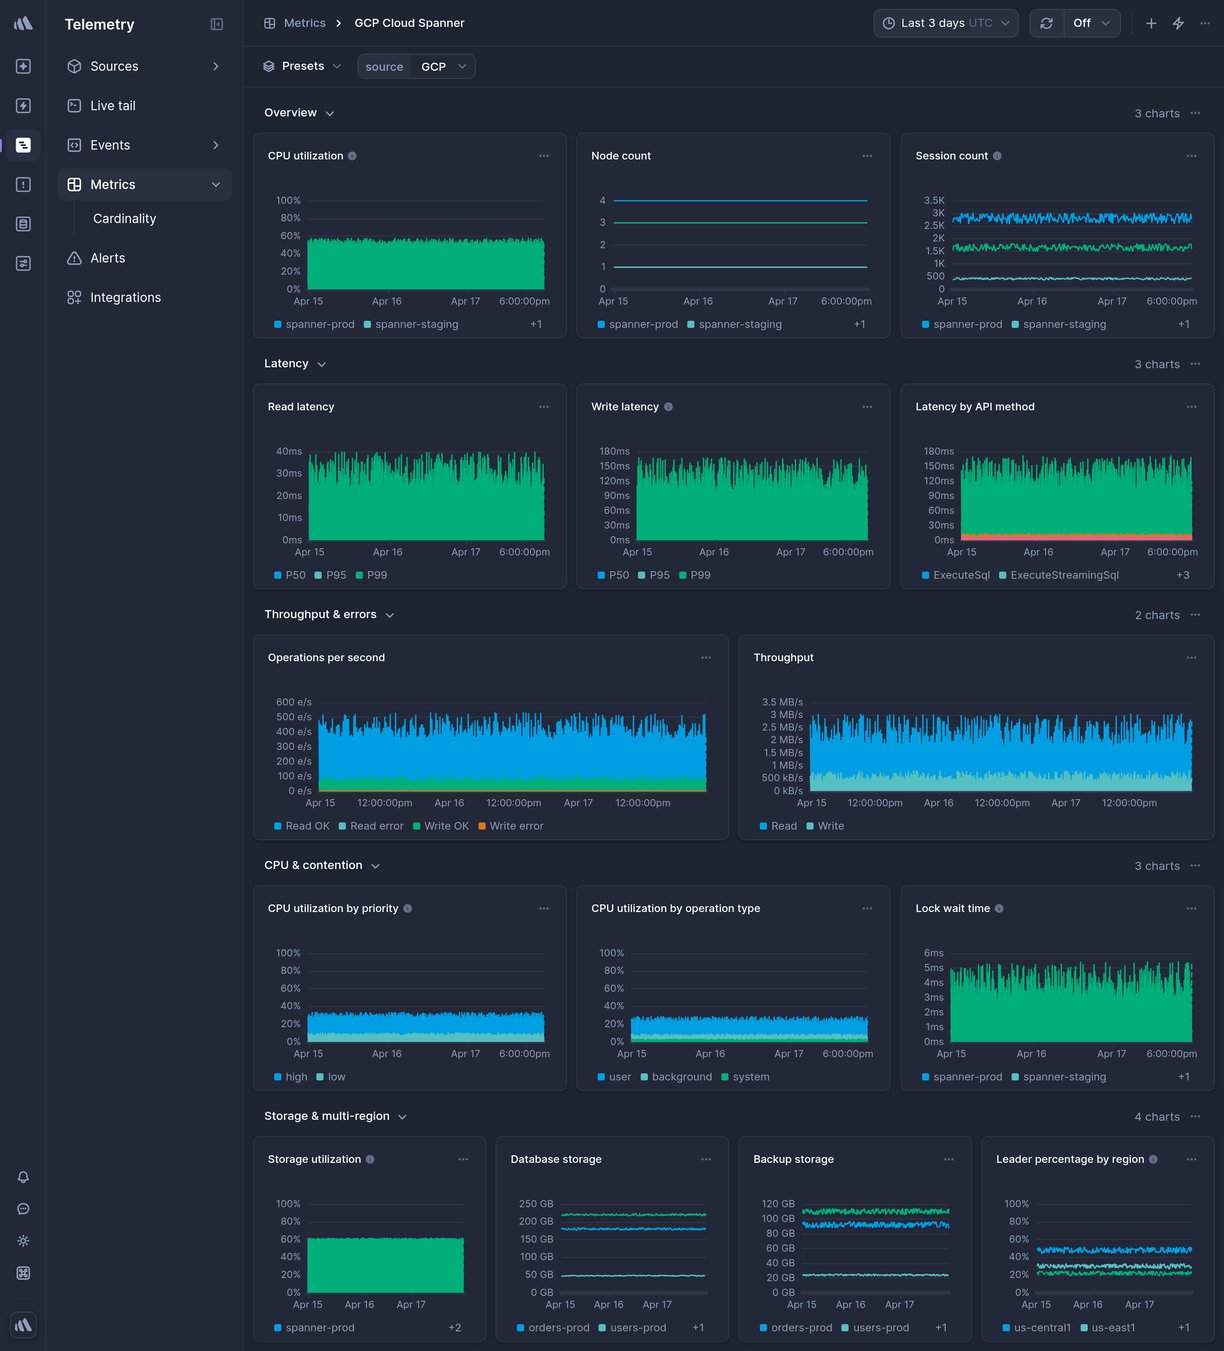
Data source
Google Cloud Monitoring
* * *

Overview
--------
This is a ready-made GCP Cloud Spanner Telemetry dashboard in Better Stack.
To get it, [sign up](https://betterstack.com/users/sign-up)
for Better Stack, [connect your log or metrics source](https://betterstack.com/docs/logs/logging-start/)
, and select one of the beautiful [pre-built dashboards](https://betterstack.com/dashboards)
you want to get.
### What charts are included
* CPU utilization
* Storage used
* Query count
* Transaction latency
* Session count
* And much more, explore on your own to see all the chart options.

### How to create a custom chart
Need a custom chart? You can create one by writing a regular SQL query.
Here is how to do it:
1. **Pick a chart type:** the most popular options include a line chart, bar chart, pie chart, a single number, and a live tail (a stream of the newest logs).
2. **Pick a source and timeframe:** we use [variables](https://betterstack.com/docs/logs/dashboards/variables/)
in the SQL queries, which makes it easy to edit and work with any query. The main variables are `source` and `timeframe`. Once you set those, as in the example above, you can use the timeframe switcher easily, and the dashboard will update automatically.
3. **Write your SQL query:** there is no need to use any specific querying language. Just write SQL like you’re used to.
**Learn more:** [How to build SQL queries in Better Stack](https://betterstack.com/docs/logs/dashboards/sql-queries/)

### How to create an alert for a metric
You can get easily alerted on irregularities before they become incidents.
Everything is fully integrated into dashboards, there is no need to set up complex workflows.
Here are the most popular alert types:
* **Threshold Alerts:** Perfect for scenarios where you need to be notified when a metric crosses a certain predefined threshold. For instance, if your application's response time exceeds a set limit, you’ll get an alert.
* **Relative Alerts:** Want to monitor changes in metrics relative to their historical data? Whether it's an unexpected drop in sales, a surge in new user signups, or any other relative metric anomaly, we've got you covered.
* **Anomaly detection:** Use this alerting method if you're unsure about what threshold to set. It will notify you about any significant deviation from the predicted value of the series. Think of this method as covering what you didn’t even know can occur.
**Learn more:** [How to use alerts in Better Stack](https://betterstack.com/docs/logs/dashboards/alerts/)

### How to receive notification about issues
Once you set up what metric irregularities you want to get alerted to, you can select a broad spectrum of notification options.
The most popular include Slack, Microsoft Teams, Phone calls, SMS, emails, webhooks, and more.
The best part is that notifications within Better Stack are unlimited. This way, you don’t have to worry about being charged extra in case of significant incidents.
**Learn more:** [How to use escalation policies in Better Stack](https://betterstack.com/docs/uptime/escalation-policies/)
### How to set up your GCP Cloud Spanner dashboard
Once you’ve signed up for [Better Stack](https://betterstack.com/logs)
, you can collect logs and metrics from GCP Cloud Spanner in just 2 minutes. Here is the official [documentation](https://betterstack.com/docs/logs/google-cloud/)
on how to do it.
Are you already using another log forwarder that you’re used to? See the documentation for [Fluent Bit](https://betterstack.com/docs/logs/fluent-bit/)
, [Logstash](https://betterstack.com/docs/logs/logstash/)
, [Fluentd](https://betterstack.com/docs/logs/fluentd/)
, [Filebeat](https://betterstack.com/docs/logs/filebeat/)
, [Syslog](https://betterstack.com/docs/logs/syslog-setup/)
, and [others](https://betterstack.com/docs/logs/start/)
.
### Have any questions?
Please feel free to message us at [hello@betterstack.com](mailto:hello@betterstack.com?subject=Question%20about%20Better%20Stack&body=)
.
We'll get back to you as soon as we can, typically within a few hours. 🙏 Thank you!
* * *
#### You might also like
[\
\
### GCP BigQuery\
\
Serverless data warehouse for analytics at any scale.](https://betterstack.com/dashboards/gcp-bigquery)
[\
\
### GCP Pub/Sub\
\
Managed messaging and event streaming for decoupled architectures.](https://betterstack.com/dashboards/gcp-pubsub)

### Please accept cookies
We use cookies to authenticate users, improve the product user experience, and for [personalized ads](https://business.safety.google/privacy/)
. [Learn more.](https://betterstack.com/privacy)
Deny Accept required Accept all
---
# GCP Cloud Functions dashboard template | Better Stack
[Back to dashboards](https://betterstack.com/dashboards)
GCP Cloud Functions
===================
Event-driven serverless functions for lightweight workloads.
[Add dashboard](https://telemetry.betterstack.com/team/0/dashboards#template-95613)
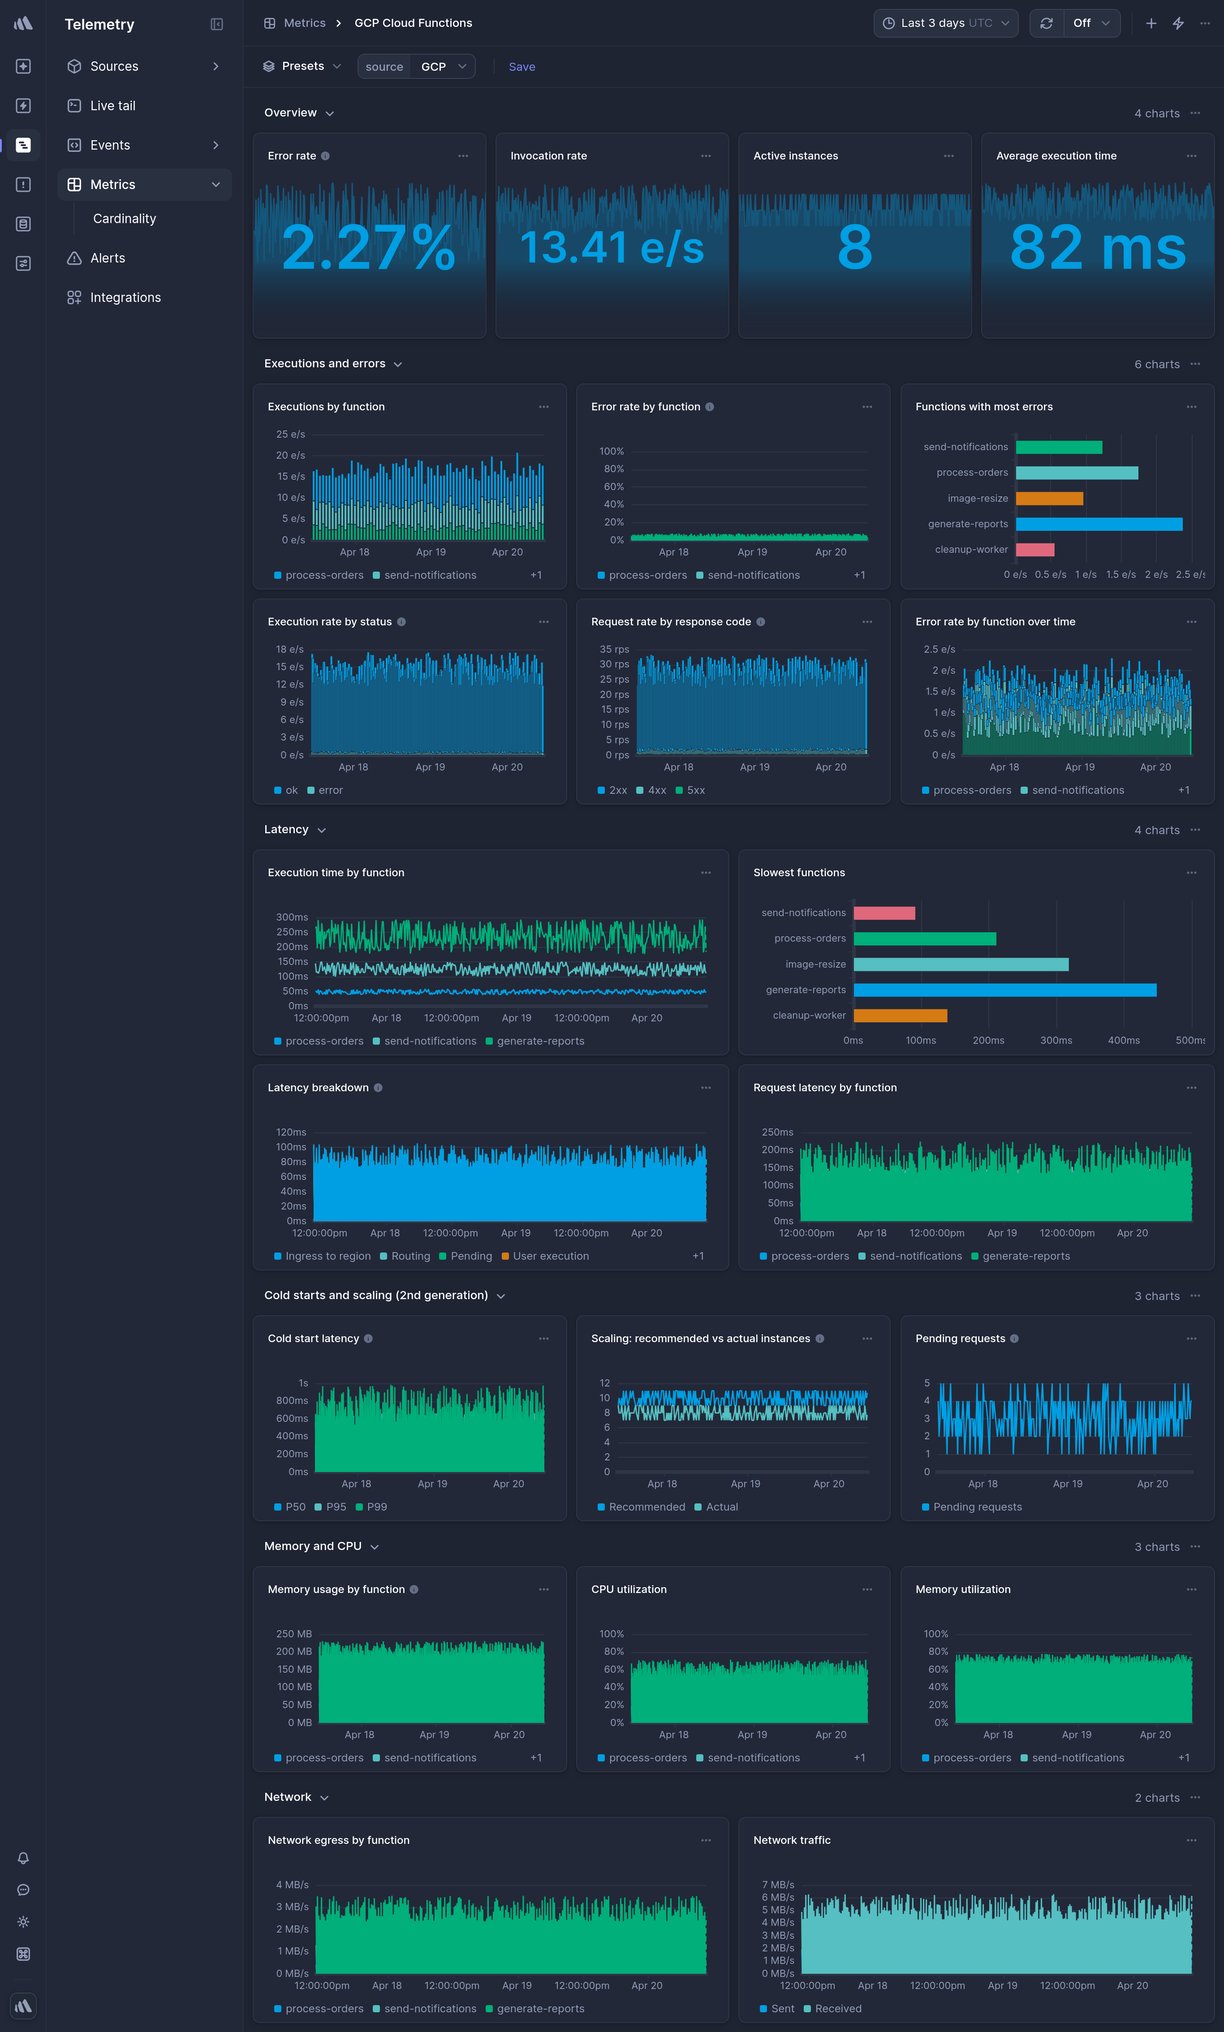
Data source
Google Cloud Monitoring
* * *

Overview
--------
This is a ready-made GCP Cloud Functions Telemetry dashboard in Better Stack.
To get it, [sign up](https://betterstack.com/users/sign-up)
for Better Stack, [connect your log or metrics source](https://betterstack.com/docs/logs/logging-start/)
, and select one of the beautiful [pre-built dashboards](https://betterstack.com/dashboards)
you want to get.
### What charts are included
* Invocations
* Execution time
* Active instances
* Memory usage
* Errors
* And much more, explore on your own to see all the chart options.

### How to create a custom chart
Need a custom chart? You can create one by writing a regular SQL query.
Here is how to do it:
1. **Pick a chart type:** the most popular options include a line chart, bar chart, pie chart, a single number, and a live tail (a stream of the newest logs).
2. **Pick a source and timeframe:** we use [variables](https://betterstack.com/docs/logs/dashboards/variables/)
in the SQL queries, which makes it easy to edit and work with any query. The main variables are `source` and `timeframe`. Once you set those, as in the example above, you can use the timeframe switcher easily, and the dashboard will update automatically.
3. **Write your SQL query:** there is no need to use any specific querying language. Just write SQL like you’re used to.
**Learn more:** [How to build SQL queries in Better Stack](https://betterstack.com/docs/logs/dashboards/sql-queries/)

### How to create an alert for a metric
You can get easily alerted on irregularities before they become incidents.
Everything is fully integrated into dashboards, there is no need to set up complex workflows.
Here are the most popular alert types:
* **Threshold Alerts:** Perfect for scenarios where you need to be notified when a metric crosses a certain predefined threshold. For instance, if your application's response time exceeds a set limit, you’ll get an alert.
* **Relative Alerts:** Want to monitor changes in metrics relative to their historical data? Whether it's an unexpected drop in sales, a surge in new user signups, or any other relative metric anomaly, we've got you covered.
* **Anomaly detection:** Use this alerting method if you're unsure about what threshold to set. It will notify you about any significant deviation from the predicted value of the series. Think of this method as covering what you didn’t even know can occur.
**Learn more:** [How to use alerts in Better Stack](https://betterstack.com/docs/logs/dashboards/alerts/)

### How to receive notification about issues
Once you set up what metric irregularities you want to get alerted to, you can select a broad spectrum of notification options.
The most popular include Slack, Microsoft Teams, Phone calls, SMS, emails, webhooks, and more.
The best part is that notifications within Better Stack are unlimited. This way, you don’t have to worry about being charged extra in case of significant incidents.
**Learn more:** [How to use escalation policies in Better Stack](https://betterstack.com/docs/uptime/escalation-policies/)
### How to set up your GCP Cloud Functions dashboard
Once you’ve signed up for [Better Stack](https://betterstack.com/logs)
, you can collect logs and metrics from GCP Cloud Functions in just 2 minutes. Here is the official [documentation](https://betterstack.com/docs/logs/google-cloud/)
on how to do it.
Are you already using another log forwarder that you’re used to? See the documentation for [Fluent Bit](https://betterstack.com/docs/logs/fluent-bit/)
, [Logstash](https://betterstack.com/docs/logs/logstash/)
, [Fluentd](https://betterstack.com/docs/logs/fluentd/)
, [Filebeat](https://betterstack.com/docs/logs/filebeat/)
, [Syslog](https://betterstack.com/docs/logs/syslog-setup/)
, and [others](https://betterstack.com/docs/logs/start/)
.
### Have any questions?
Please feel free to message us at [hello@betterstack.com](mailto:hello@betterstack.com?subject=Question%20about%20Better%20Stack&body=)
.
We'll get back to you as soon as we can, typically within a few hours. 🙏 Thank you!
* * *
#### You might also like
[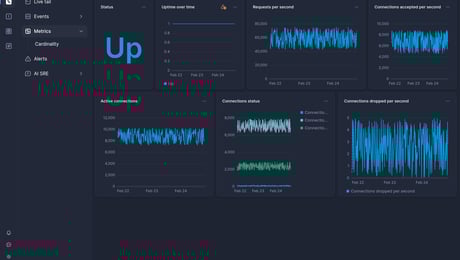\
\
### Nginx\
\
Web server, reverse proxy, and load balancer.](https://betterstack.com/dashboards/nginx)
[\
\
### AWS SNS & SQS\
\
Managed messaging and queuing services for decoupled architectures.](https://betterstack.com/dashboards/aws-sns-sqs)

### Please accept cookies
We use cookies to authenticate users, improve the product user experience, and for [personalized ads](https://business.safety.google/privacy/)
. [Learn more.](https://betterstack.com/privacy)
Deny Accept required Accept all
---
# GCP Cloud Storage dashboard template | Better Stack
[Back to dashboards](https://betterstack.com/dashboards)
GCP Cloud Storage
=================
Scalable object storage for data of any size.
[Add dashboard](https://telemetry.betterstack.com/team/0/dashboards#template-95615)
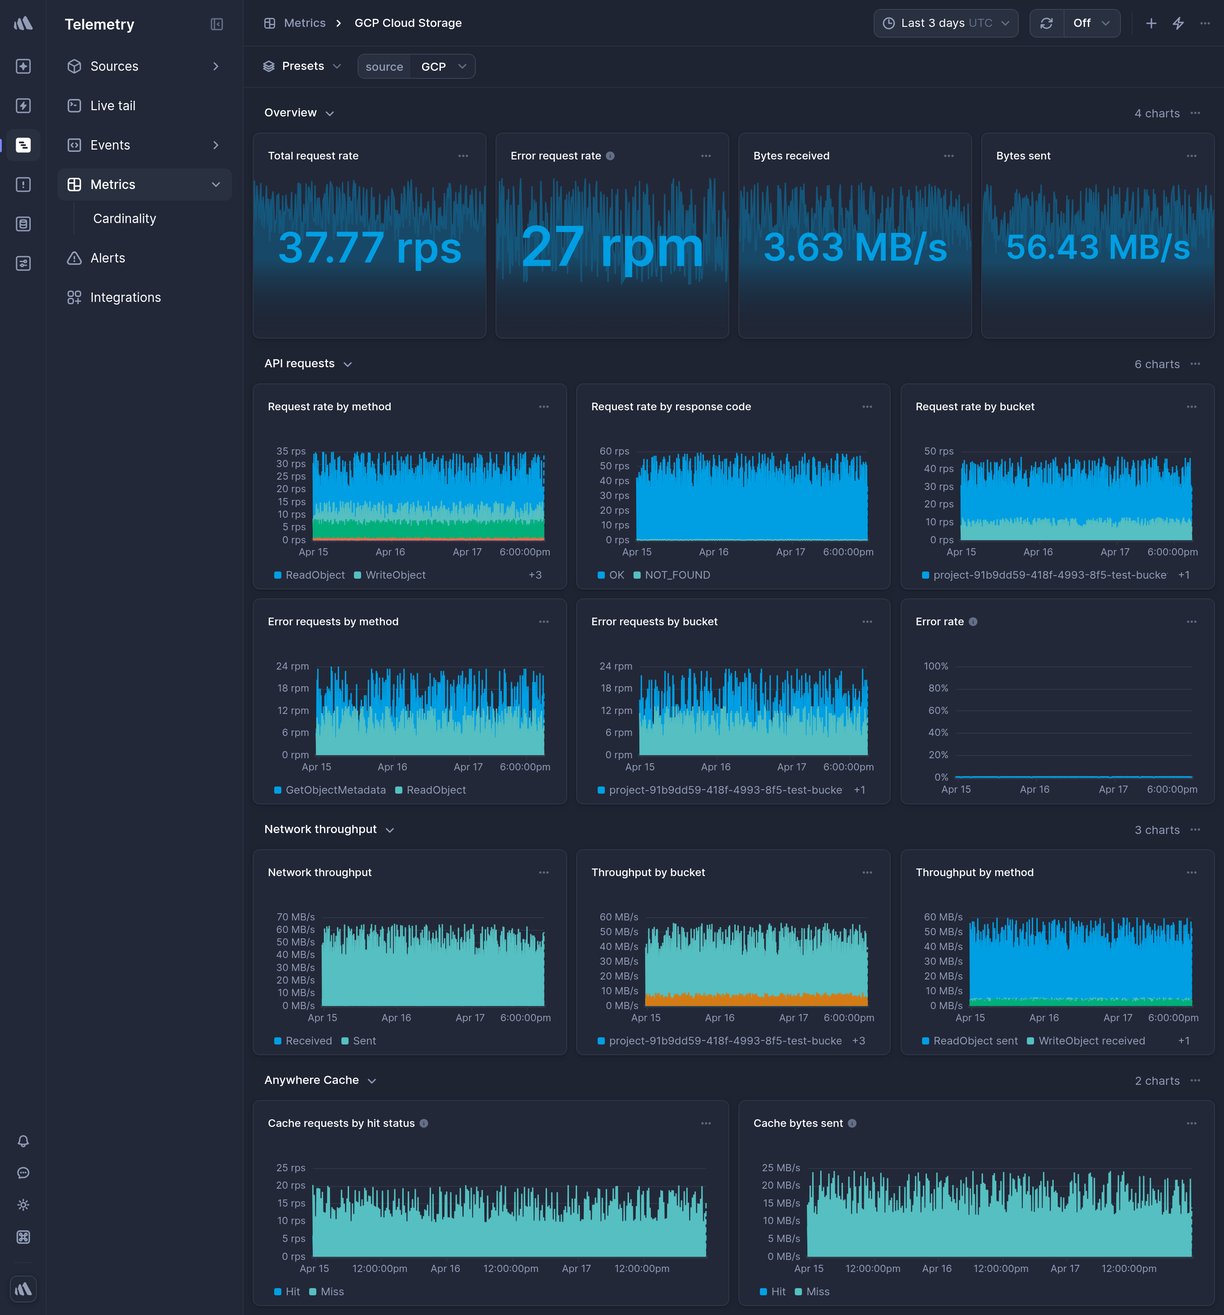
Data source
Google Cloud Monitoring
* * *

Overview
--------
This is a ready-made GCP Cloud Storage Telemetry dashboard in Better Stack.
To get it, [sign up](https://betterstack.com/users/sign-up)
for Better Stack, [connect your log or metrics source](https://betterstack.com/docs/logs/logging-start/)
, and select one of the beautiful [pre-built dashboards](https://betterstack.com/dashboards)
you want to get.
### What charts are included
* Request count
* Bytes sent and received
* Object count
* Storage used
* Error rate
* And much more, explore on your own to see all the chart options.

### How to create a custom chart
Need a custom chart? You can create one by writing a regular SQL query.
Here is how to do it:
1. **Pick a chart type:** the most popular options include a line chart, bar chart, pie chart, a single number, and a live tail (a stream of the newest logs).
2. **Pick a source and timeframe:** we use [variables](https://betterstack.com/docs/logs/dashboards/variables/)
in the SQL queries, which makes it easy to edit and work with any query. The main variables are `source` and `timeframe`. Once you set those, as in the example above, you can use the timeframe switcher easily, and the dashboard will update automatically.
3. **Write your SQL query:** there is no need to use any specific querying language. Just write SQL like you’re used to.
**Learn more:** [How to build SQL queries in Better Stack](https://betterstack.com/docs/logs/dashboards/sql-queries/)

### How to create an alert for a metric
You can get easily alerted on irregularities before they become incidents.
Everything is fully integrated into dashboards, there is no need to set up complex workflows.
Here are the most popular alert types:
* **Threshold Alerts:** Perfect for scenarios where you need to be notified when a metric crosses a certain predefined threshold. For instance, if your application's response time exceeds a set limit, you’ll get an alert.
* **Relative Alerts:** Want to monitor changes in metrics relative to their historical data? Whether it's an unexpected drop in sales, a surge in new user signups, or any other relative metric anomaly, we've got you covered.
* **Anomaly detection:** Use this alerting method if you're unsure about what threshold to set. It will notify you about any significant deviation from the predicted value of the series. Think of this method as covering what you didn’t even know can occur.
**Learn more:** [How to use alerts in Better Stack](https://betterstack.com/docs/logs/dashboards/alerts/)

### How to receive notification about issues
Once you set up what metric irregularities you want to get alerted to, you can select a broad spectrum of notification options.
The most popular include Slack, Microsoft Teams, Phone calls, SMS, emails, webhooks, and more.
The best part is that notifications within Better Stack are unlimited. This way, you don’t have to worry about being charged extra in case of significant incidents.
**Learn more:** [How to use escalation policies in Better Stack](https://betterstack.com/docs/uptime/escalation-policies/)
### How to set up your GCP Cloud Storage dashboard
Once you’ve signed up for [Better Stack](https://betterstack.com/logs)
, you can collect logs and metrics from GCP Cloud Storage in just 2 minutes. Here is the official [documentation](https://betterstack.com/docs/logs/google-cloud/)
on how to do it.
Are you already using another log forwarder that you’re used to? See the documentation for [Fluent Bit](https://betterstack.com/docs/logs/fluent-bit/)
, [Logstash](https://betterstack.com/docs/logs/logstash/)
, [Fluentd](https://betterstack.com/docs/logs/fluentd/)
, [Filebeat](https://betterstack.com/docs/logs/filebeat/)
, [Syslog](https://betterstack.com/docs/logs/syslog-setup/)
, and [others](https://betterstack.com/docs/logs/start/)
.
### Have any questions?
Please feel free to message us at [hello@betterstack.com](mailto:hello@betterstack.com?subject=Question%20about%20Better%20Stack&body=)
.
We'll get back to you as soon as we can, typically within a few hours. 🙏 Thank you!
* * *
#### You might also like
[\
\
### GCP Cloud Spanner\
\
Globally distributed, horizontally scalable relational database.](https://betterstack.com/dashboards/gcp-cloud-spanner)
[\
\
### Website analytics\
\
Page views, unique visitors, attribution and engagement metrics for your website.](https://betterstack.com/dashboards/website-analytics)

### Please accept cookies
We use cookies to authenticate users, improve the product user experience, and for [personalized ads](https://business.safety.google/privacy/)
. [Learn more.](https://betterstack.com/privacy)
Deny Accept required Accept all
---
# GCP Pub/Sub dashboard template | Better Stack
[Back to dashboards](https://betterstack.com/dashboards)
GCP Pub/Sub
===========
Managed messaging and event streaming for decoupled architectures.
[Add dashboard](https://telemetry.betterstack.com/team/0/dashboards#template-95617)
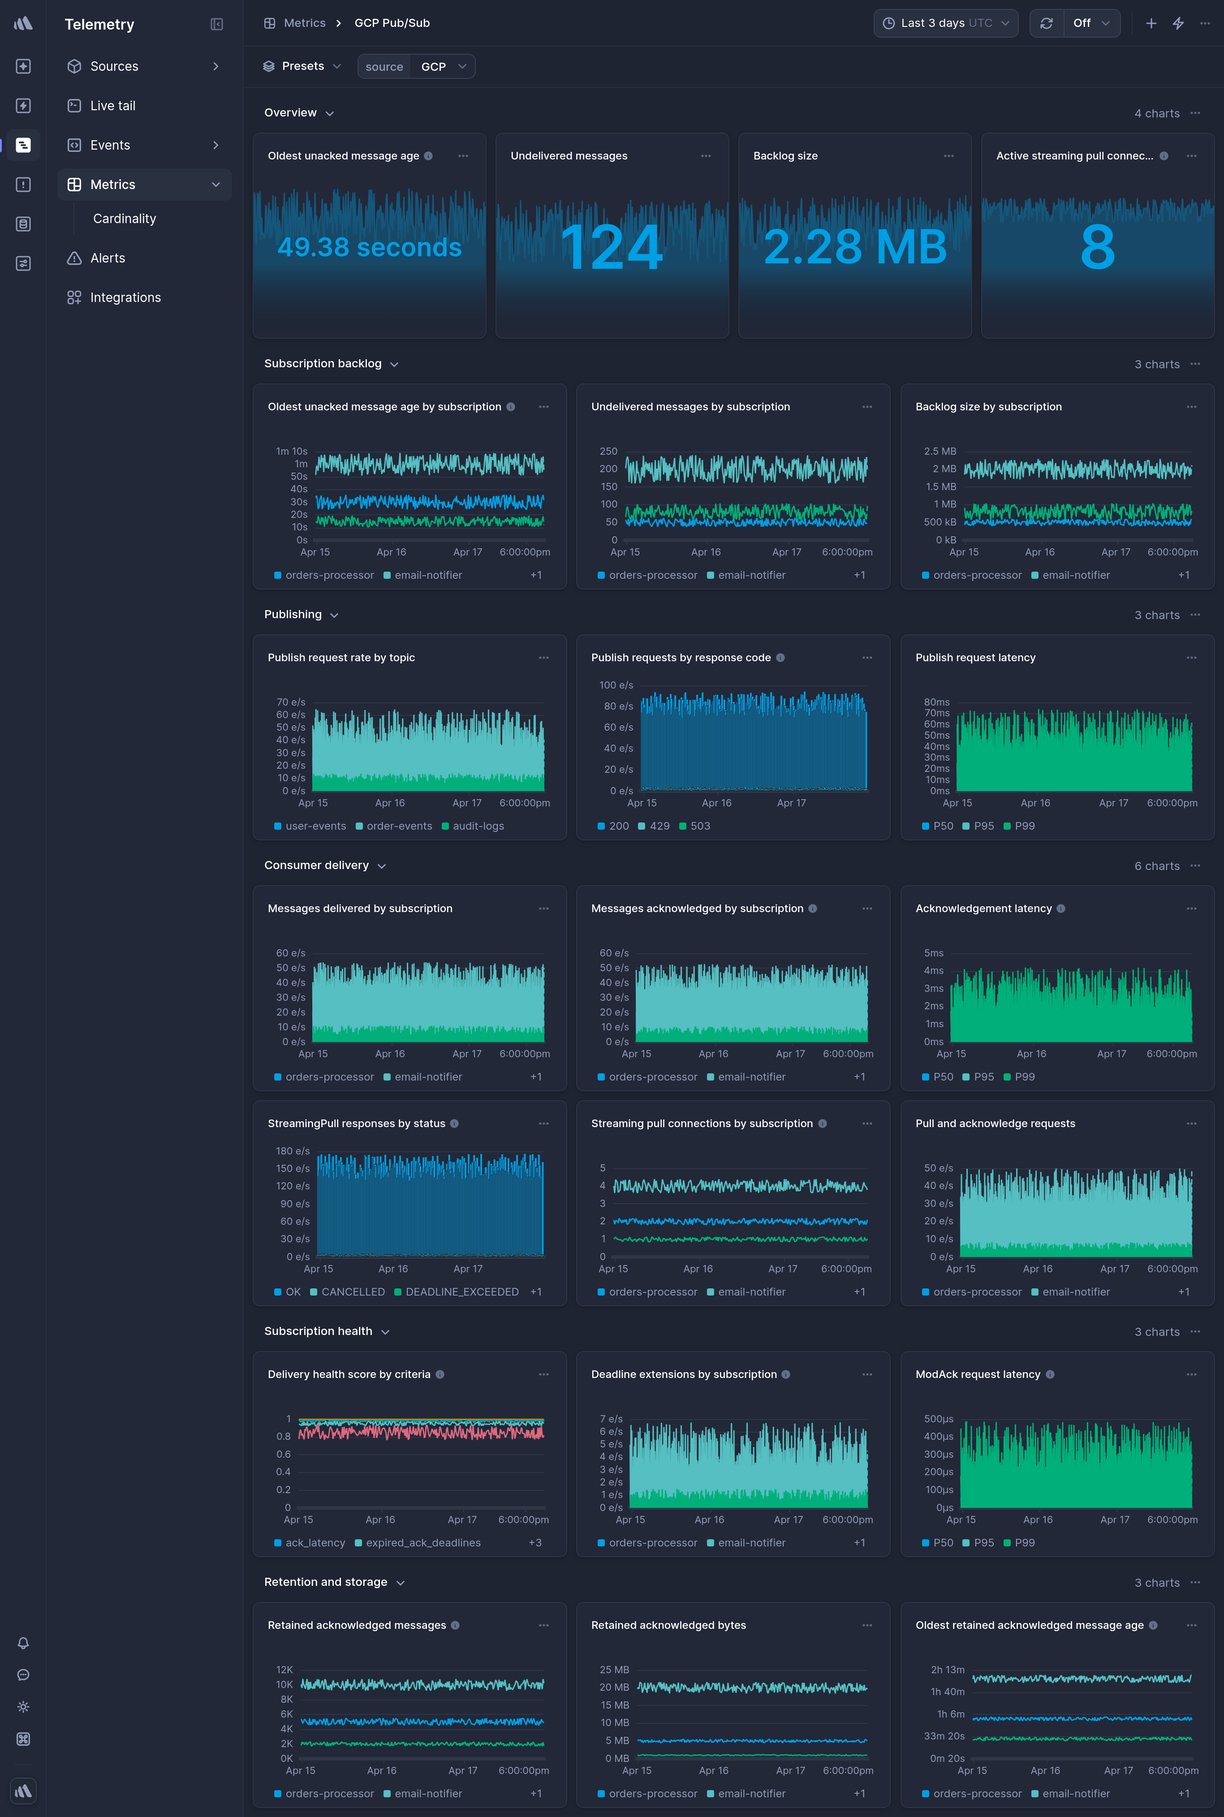
Data source
Google Cloud Monitoring
* * *

Overview
--------
This is a ready-made GCP Pub/Sub Telemetry dashboard in Better Stack.
To get it, [sign up](https://betterstack.com/users/sign-up)
for Better Stack, [connect your log or metrics source](https://betterstack.com/docs/logs/logging-start/)
, and select one of the beautiful [pre-built dashboards](https://betterstack.com/dashboards)
you want to get.
### What charts are included
* Messages published
* Messages delivered
* Subscription backlog
* Ack latency
* Throughput
* And much more, explore on your own to see all the chart options.

### How to create a custom chart
Need a custom chart? You can create one by writing a regular SQL query.
Here is how to do it:
1. **Pick a chart type:** the most popular options include a line chart, bar chart, pie chart, a single number, and a live tail (a stream of the newest logs).
2. **Pick a source and timeframe:** we use [variables](https://betterstack.com/docs/logs/dashboards/variables/)
in the SQL queries, which makes it easy to edit and work with any query. The main variables are `source` and `timeframe`. Once you set those, as in the example above, you can use the timeframe switcher easily, and the dashboard will update automatically.
3. **Write your SQL query:** there is no need to use any specific querying language. Just write SQL like you’re used to.
**Learn more:** [How to build SQL queries in Better Stack](https://betterstack.com/docs/logs/dashboards/sql-queries/)

### How to create an alert for a metric
You can get easily alerted on irregularities before they become incidents.
Everything is fully integrated into dashboards, there is no need to set up complex workflows.
Here are the most popular alert types:
* **Threshold Alerts:** Perfect for scenarios where you need to be notified when a metric crosses a certain predefined threshold. For instance, if your application's response time exceeds a set limit, you’ll get an alert.
* **Relative Alerts:** Want to monitor changes in metrics relative to their historical data? Whether it's an unexpected drop in sales, a surge in new user signups, or any other relative metric anomaly, we've got you covered.
* **Anomaly detection:** Use this alerting method if you're unsure about what threshold to set. It will notify you about any significant deviation from the predicted value of the series. Think of this method as covering what you didn’t even know can occur.
**Learn more:** [How to use alerts in Better Stack](https://betterstack.com/docs/logs/dashboards/alerts/)

### How to receive notification about issues
Once you set up what metric irregularities you want to get alerted to, you can select a broad spectrum of notification options.
The most popular include Slack, Microsoft Teams, Phone calls, SMS, emails, webhooks, and more.
The best part is that notifications within Better Stack are unlimited. This way, you don’t have to worry about being charged extra in case of significant incidents.
**Learn more:** [How to use escalation policies in Better Stack](https://betterstack.com/docs/uptime/escalation-policies/)
### How to set up your GCP Pub/Sub dashboard
Once you’ve signed up for [Better Stack](https://betterstack.com/logs)
, you can collect logs and metrics from GCP Pub/Sub in just 2 minutes. Here is the official [documentation](https://betterstack.com/docs/logs/google-cloud-pubsub/)
on how to do it.
Are you already using another log forwarder that you’re used to? See the documentation for [Fluent Bit](https://betterstack.com/docs/logs/fluent-bit/)
, [Logstash](https://betterstack.com/docs/logs/logstash/)
, [Fluentd](https://betterstack.com/docs/logs/fluentd/)
, [Filebeat](https://betterstack.com/docs/logs/filebeat/)
, [Syslog](https://betterstack.com/docs/logs/syslog-setup/)
, and [others](https://betterstack.com/docs/logs/start/)
.
### Have any questions?
Please feel free to message us at [hello@betterstack.com](mailto:hello@betterstack.com?subject=Question%20about%20Better%20Stack&body=)
.
We'll get back to you as soon as we can, typically within a few hours. 🙏 Thank you!
* * *
#### You might also like
[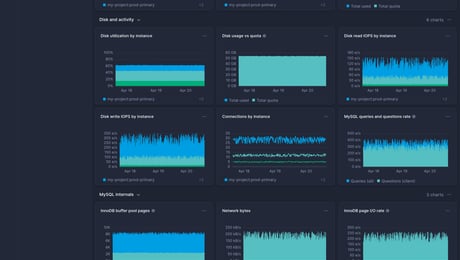\
\
### GCP Cloud SQL\
\
Managed MySQL and PostgreSQL relational databases on Google Cloud.](https://betterstack.com/dashboards/gcp-cloud-sql)
[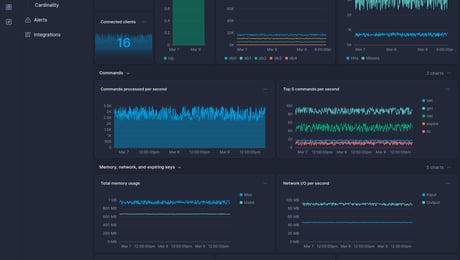\
\
### Redis\
\
Open-source in-memory key-value database and cache with durability.](https://betterstack.com/dashboards/redis)

### Please accept cookies
We use cookies to authenticate users, improve the product user experience, and for [personalized ads](https://business.safety.google/privacy/)
. [Learn more.](https://betterstack.com/privacy)
Deny Accept required Accept all
---
# GCP BigQuery dashboard template | Better Stack
[Back to dashboards](https://betterstack.com/dashboards)
GCP BigQuery
============
Serverless data warehouse for analytics at any scale.
[Add dashboard](https://telemetry.betterstack.com/team/0/dashboards#template-95616)
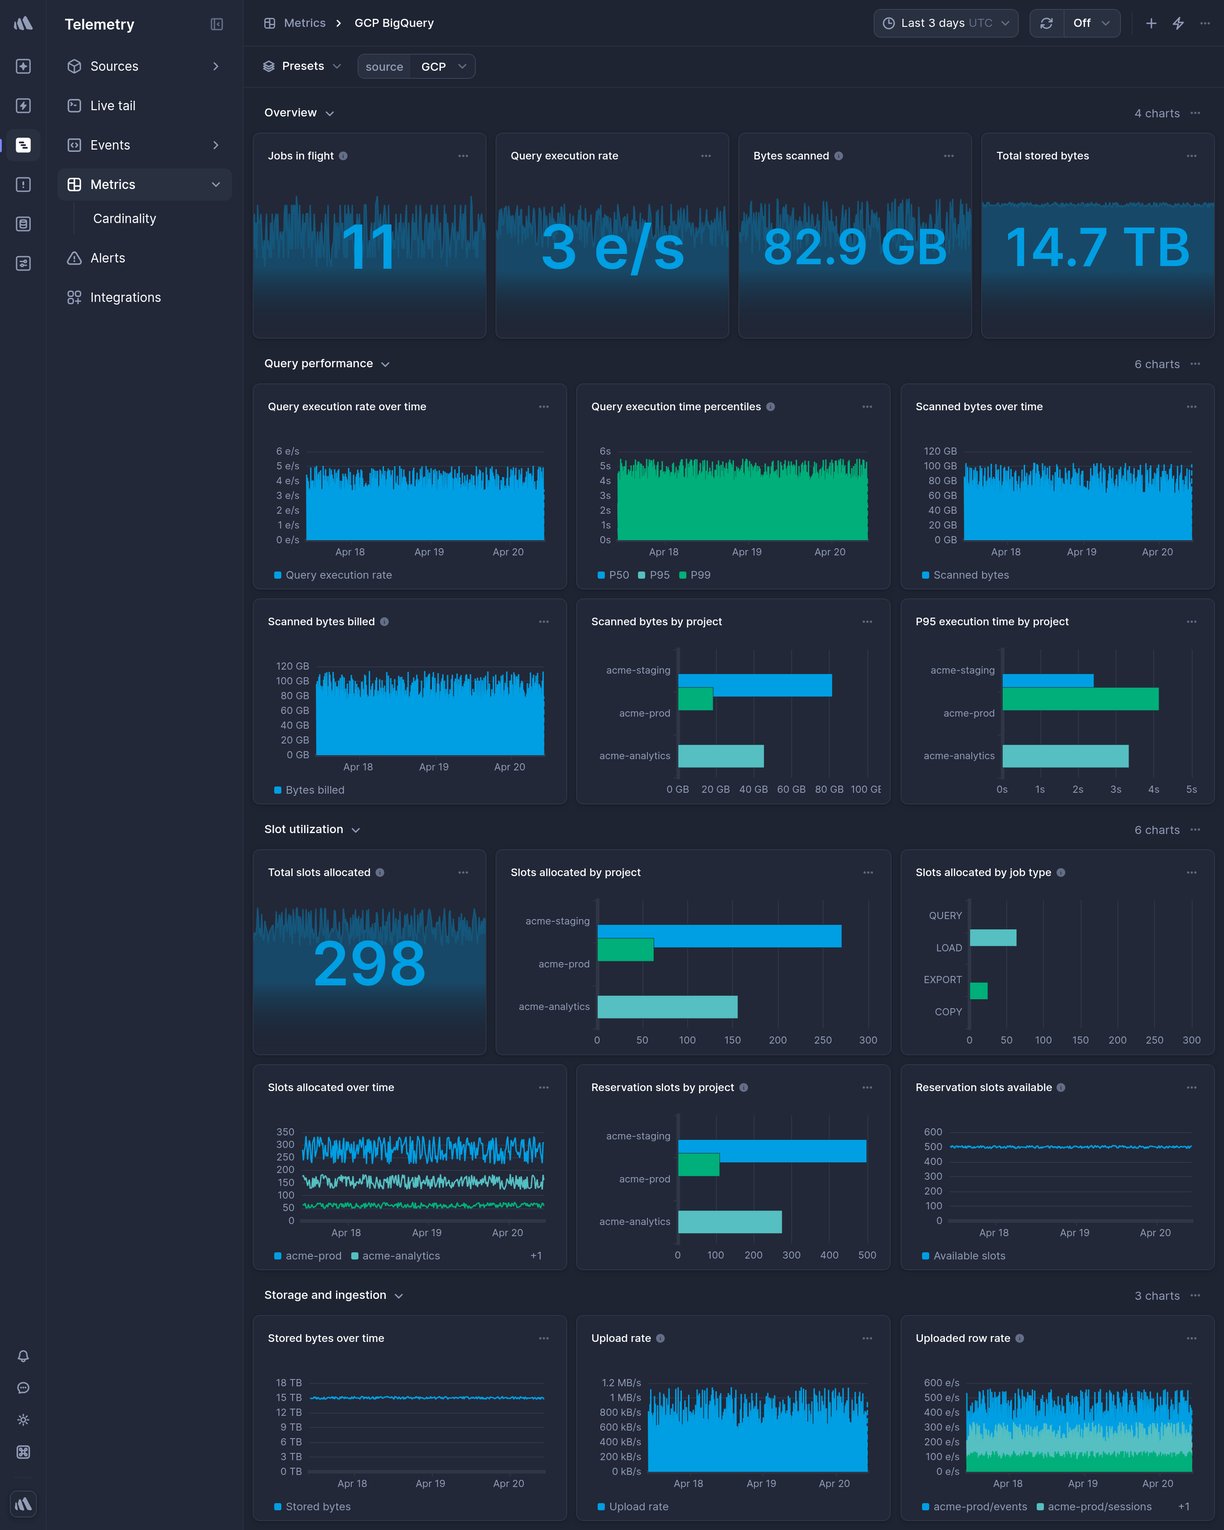
Data source
Google Cloud Monitoring
* * *

Overview
--------
This is a ready-made GCP BigQuery Telemetry dashboard in Better Stack.
To get it, [sign up](https://betterstack.com/users/sign-up)
for Better Stack, [connect your log or metrics source](https://betterstack.com/docs/logs/logging-start/)
, and select one of the beautiful [pre-built dashboards](https://betterstack.com/dashboards)
you want to get.
### What charts are included
* Queries per second
* Query execution time
* Bytes processed
* Slot utilization
* Job errors
* And much more, explore on your own to see all the chart options.

### How to create a custom chart
Need a custom chart? You can create one by writing a regular SQL query.
Here is how to do it:
1. **Pick a chart type:** the most popular options include a line chart, bar chart, pie chart, a single number, and a live tail (a stream of the newest logs).
2. **Pick a source and timeframe:** we use [variables](https://betterstack.com/docs/logs/dashboards/variables/)
in the SQL queries, which makes it easy to edit and work with any query. The main variables are `source` and `timeframe`. Once you set those, as in the example above, you can use the timeframe switcher easily, and the dashboard will update automatically.
3. **Write your SQL query:** there is no need to use any specific querying language. Just write SQL like you’re used to.
**Learn more:** [How to build SQL queries in Better Stack](https://betterstack.com/docs/logs/dashboards/sql-queries/)

### How to create an alert for a metric
You can get easily alerted on irregularities before they become incidents.
Everything is fully integrated into dashboards, there is no need to set up complex workflows.
Here are the most popular alert types:
* **Threshold Alerts:** Perfect for scenarios where you need to be notified when a metric crosses a certain predefined threshold. For instance, if your application's response time exceeds a set limit, you’ll get an alert.
* **Relative Alerts:** Want to monitor changes in metrics relative to their historical data? Whether it's an unexpected drop in sales, a surge in new user signups, or any other relative metric anomaly, we've got you covered.
* **Anomaly detection:** Use this alerting method if you're unsure about what threshold to set. It will notify you about any significant deviation from the predicted value of the series. Think of this method as covering what you didn’t even know can occur.
**Learn more:** [How to use alerts in Better Stack](https://betterstack.com/docs/logs/dashboards/alerts/)

### How to receive notification about issues
Once you set up what metric irregularities you want to get alerted to, you can select a broad spectrum of notification options.
The most popular include Slack, Microsoft Teams, Phone calls, SMS, emails, webhooks, and more.
The best part is that notifications within Better Stack are unlimited. This way, you don’t have to worry about being charged extra in case of significant incidents.
**Learn more:** [How to use escalation policies in Better Stack](https://betterstack.com/docs/uptime/escalation-policies/)
### How to set up your GCP BigQuery dashboard
Once you’ve signed up for [Better Stack](https://betterstack.com/logs)
, you can collect logs and metrics from GCP BigQuery in just 2 minutes. Here is the official [documentation](https://betterstack.com/docs/logs/google-cloud/)
on how to do it.
Are you already using another log forwarder that you’re used to? See the documentation for [Fluent Bit](https://betterstack.com/docs/logs/fluent-bit/)
, [Logstash](https://betterstack.com/docs/logs/logstash/)
, [Fluentd](https://betterstack.com/docs/logs/fluentd/)
, [Filebeat](https://betterstack.com/docs/logs/filebeat/)
, [Syslog](https://betterstack.com/docs/logs/syslog-setup/)
, and [others](https://betterstack.com/docs/logs/start/)
.
### Have any questions?
Please feel free to message us at [hello@betterstack.com](mailto:hello@betterstack.com?subject=Question%20about%20Better%20Stack&body=)
.
We'll get back to you as soon as we can, typically within a few hours. 🙏 Thank you!
* * *
#### You might also like
[\
\
### Kubernetes\
\
Container orchestration platform.](https://betterstack.com/dashboards/kubernetes)
[\
\
### Ruby on Rails\
\
Ruby web application framework.](https://betterstack.com/dashboards/ruby)

### Please accept cookies
We use cookies to authenticate users, improve the product user experience, and for [personalized ads](https://business.safety.google/privacy/)
. [Learn more.](https://betterstack.com/privacy)
Deny Accept required Accept all
---
# AWS RDS Aurora PostgreSQL dashboard template | Better Stack
[Back to dashboards](https://betterstack.com/dashboards)
AWS RDS Aurora PostgreSQL
=========================
High-performance PostgreSQL-compatible database with Aurora engine.
[Add dashboard](https://telemetry.betterstack.com/team/0/dashboards#template-95600)
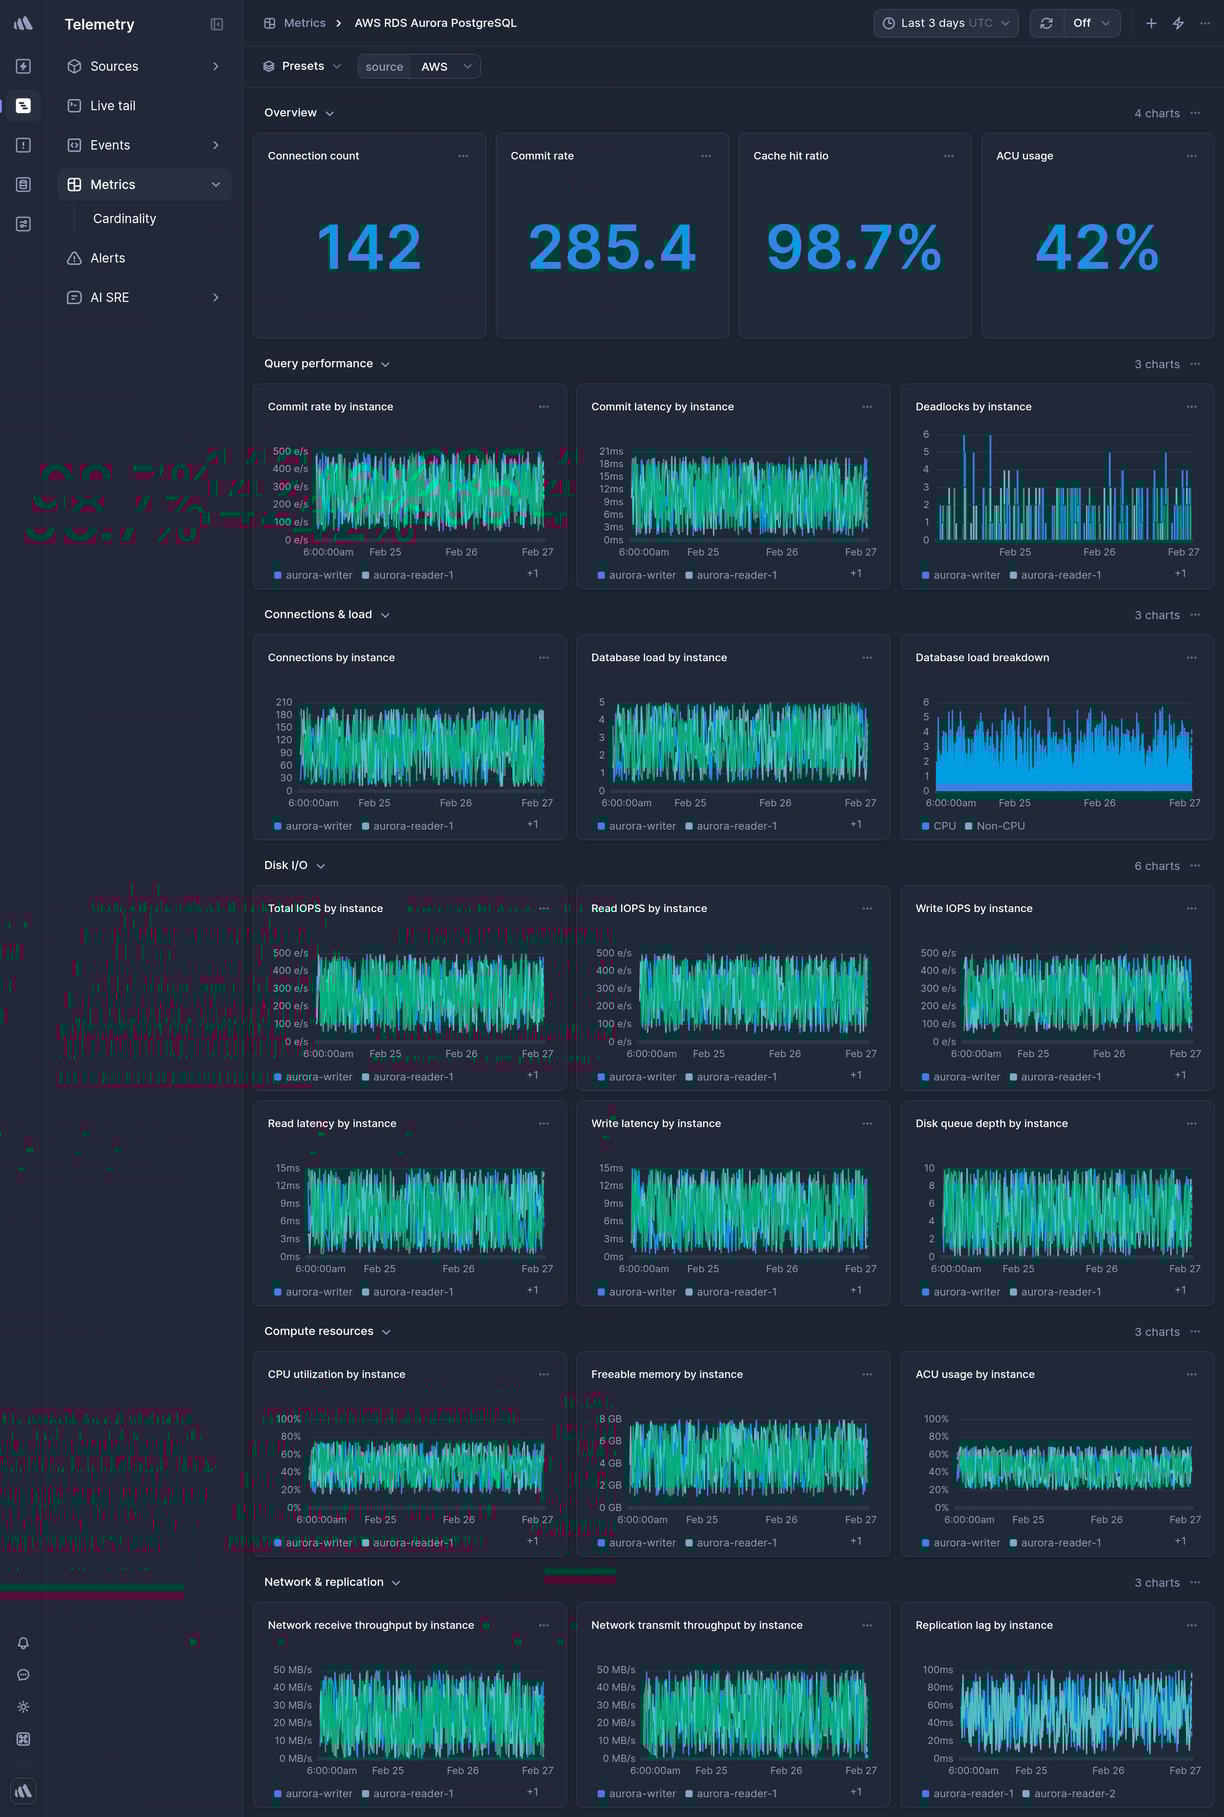
Data source
AWS CloudWatch
* * *

Overview
--------
This is a ready-made AWS RDS Aurora PostgreSQL Telemetry dashboard in Better Stack.
To get it, [sign up](https://betterstack.com/users/sign-up)
for Better Stack, [connect your log or metrics source](https://betterstack.com/docs/logs/logging-start/)
, and select one of the beautiful [pre-built dashboards](https://betterstack.com/dashboards)
you want to get.
### What charts are included
* CPU utilization
* Database connections
* Aurora replica lag
* Buffer cache hit ratio
* And much more, explore on your own to see all the chart options.

### How to create a custom chart
Need a custom chart? You can create one by writing a regular SQL query.
Here is how to do it:
1. **Pick a chart type:** the most popular options include a line chart, bar chart, pie chart, a single number, and a live tail (a stream of the newest logs).
2. **Pick a source and timeframe:** we use [variables](https://betterstack.com/docs/logs/dashboards/variables/)
in the SQL queries, which makes it easy to edit and work with any query. The main variables are `source` and `timeframe`. Once you set those, as in the example above, you can use the timeframe switcher easily, and the dashboard will update automatically.
3. **Write your SQL query:** there is no need to use any specific querying language. Just write SQL like you’re used to.
**Learn more:** [How to build SQL queries in Better Stack](https://betterstack.com/docs/logs/dashboards/sql-queries/)

### How to create an alert for a metric
You can get easily alerted on irregularities before they become incidents.
Everything is fully integrated into dashboards, there is no need to set up complex workflows.
Here are the most popular alert types:
* **Threshold Alerts:** Perfect for scenarios where you need to be notified when a metric crosses a certain predefined threshold. For instance, if your application's response time exceeds a set limit, you’ll get an alert.
* **Relative Alerts:** Want to monitor changes in metrics relative to their historical data? Whether it's an unexpected drop in sales, a surge in new user signups, or any other relative metric anomaly, we've got you covered.
* **Anomaly detection:** Use this alerting method if you're unsure about what threshold to set. It will notify you about any significant deviation from the predicted value of the series. Think of this method as covering what you didn’t even know can occur.
**Learn more:** [How to use alerts in Better Stack](https://betterstack.com/docs/logs/dashboards/alerts/)

### How to receive notification about issues
Once you set up what metric irregularities you want to get alerted to, you can select a broad spectrum of notification options.
The most popular include Slack, Microsoft Teams, Phone calls, SMS, emails, webhooks, and more.
The best part is that notifications within Better Stack are unlimited. This way, you don’t have to worry about being charged extra in case of significant incidents.
**Learn more:** [How to use escalation policies in Better Stack](https://betterstack.com/docs/uptime/escalation-policies/)
### How to set up your AWS RDS Aurora PostgreSQL dashboard
Once you’ve signed up for [Better Stack](https://betterstack.com/logs)
, you can collect logs and metrics from AWS RDS Aurora PostgreSQL in just 2 minutes. Here is the official [documentation](https://betterstack.com/docs/logs/aws-cloudformation/)
on how to do it.
Are you already using another log forwarder that you’re used to? See the documentation for [Fluent Bit](https://betterstack.com/docs/logs/fluent-bit/)
, [Logstash](https://betterstack.com/docs/logs/logstash/)
, [Fluentd](https://betterstack.com/docs/logs/fluentd/)
, [Filebeat](https://betterstack.com/docs/logs/filebeat/)
, [Syslog](https://betterstack.com/docs/logs/syslog-setup/)
, and [others](https://betterstack.com/docs/logs/start/)
.
### Have any questions?
Please feel free to message us at [hello@betterstack.com](mailto:hello@betterstack.com?subject=Question%20about%20Better%20Stack&body=)
.
We'll get back to you as soon as we can, typically within a few hours. 🙏 Thank you!
* * *
#### You might also like
[\
\
### GCP Compute Engine\
\
Scalable virtual machine instances on Google Cloud.](https://betterstack.com/dashboards/gcp-compute-engine)
[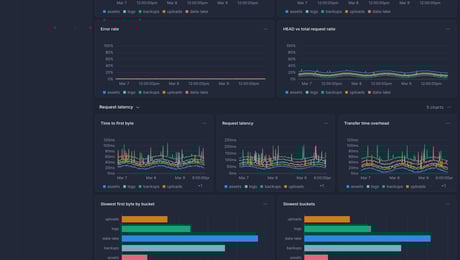\
\
### AWS S3\
\
Scalable object storage for data of any size.](https://betterstack.com/dashboards/aws-s3)

### Please accept cookies
We use cookies to authenticate users, improve the product user experience, and for [personalized ads](https://business.safety.google/privacy/)
. [Learn more.](https://betterstack.com/privacy)
Deny Accept required Accept all
---
# GCP Load Balancing dashboard template | Better Stack
[Back to dashboards](https://betterstack.com/dashboards)
GCP Load Balancing
==================
Global and regional load balancing for HTTP(S) and TCP/UDP traffic.
[Add dashboard](https://telemetry.betterstack.com/team/0/dashboards#template-95618)
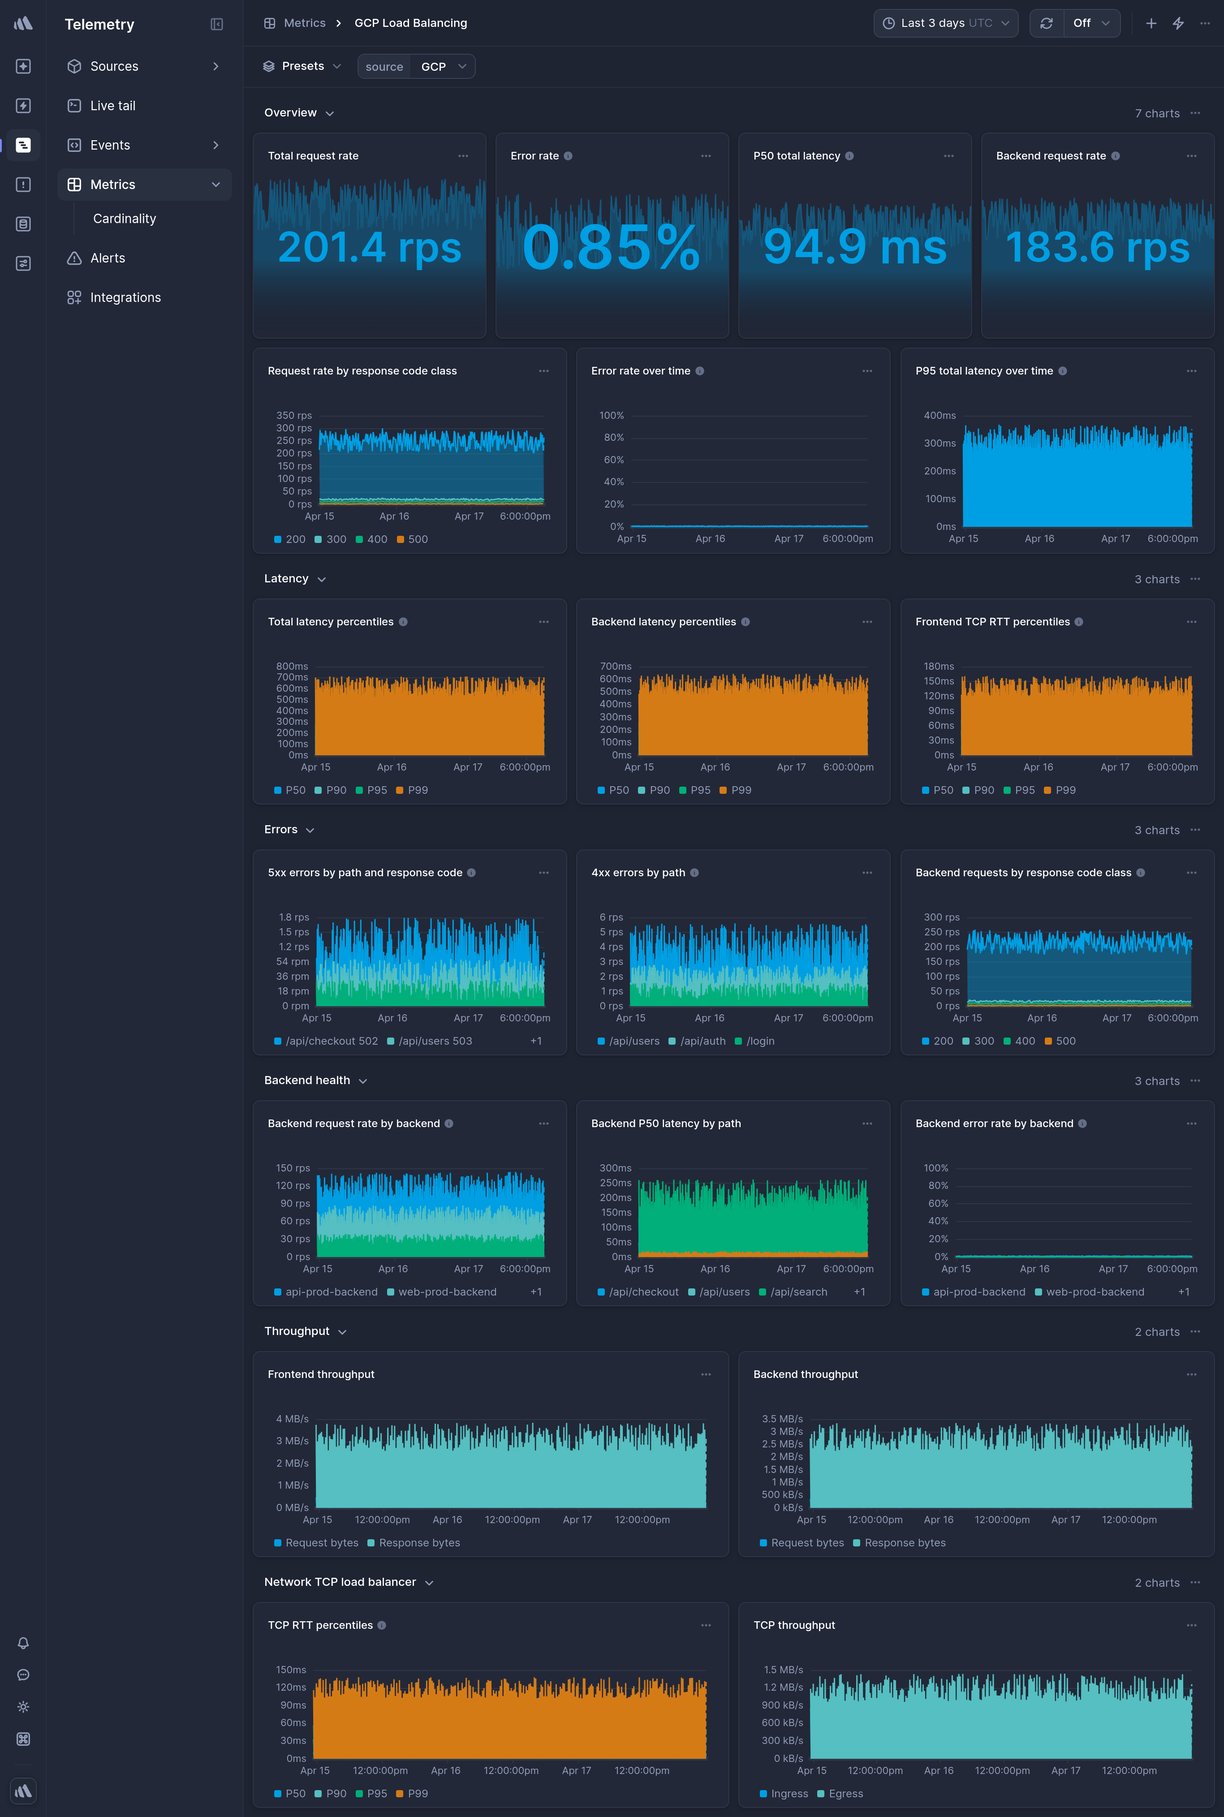
Data source
Google Cloud Monitoring
* * *

Overview
--------
This is a ready-made GCP Load Balancing Telemetry dashboard in Better Stack.
To get it, [sign up](https://betterstack.com/users/sign-up)
for Better Stack, [connect your log or metrics source](https://betterstack.com/docs/logs/logging-start/)
, and select one of the beautiful [pre-built dashboards](https://betterstack.com/dashboards)
you want to get.
### What charts are included
* Request count
* Response latency
* Backend errors
* Bytes transferred
* Active connections
* And much more, explore on your own to see all the chart options.

### How to create a custom chart
Need a custom chart? You can create one by writing a regular SQL query.
Here is how to do it:
1. **Pick a chart type:** the most popular options include a line chart, bar chart, pie chart, a single number, and a live tail (a stream of the newest logs).
2. **Pick a source and timeframe:** we use [variables](https://betterstack.com/docs/logs/dashboards/variables/)
in the SQL queries, which makes it easy to edit and work with any query. The main variables are `source` and `timeframe`. Once you set those, as in the example above, you can use the timeframe switcher easily, and the dashboard will update automatically.
3. **Write your SQL query:** there is no need to use any specific querying language. Just write SQL like you’re used to.
**Learn more:** [How to build SQL queries in Better Stack](https://betterstack.com/docs/logs/dashboards/sql-queries/)

### How to create an alert for a metric
You can get easily alerted on irregularities before they become incidents.
Everything is fully integrated into dashboards, there is no need to set up complex workflows.
Here are the most popular alert types:
* **Threshold Alerts:** Perfect for scenarios where you need to be notified when a metric crosses a certain predefined threshold. For instance, if your application's response time exceeds a set limit, you’ll get an alert.
* **Relative Alerts:** Want to monitor changes in metrics relative to their historical data? Whether it's an unexpected drop in sales, a surge in new user signups, or any other relative metric anomaly, we've got you covered.
* **Anomaly detection:** Use this alerting method if you're unsure about what threshold to set. It will notify you about any significant deviation from the predicted value of the series. Think of this method as covering what you didn’t even know can occur.
**Learn more:** [How to use alerts in Better Stack](https://betterstack.com/docs/logs/dashboards/alerts/)

### How to receive notification about issues
Once you set up what metric irregularities you want to get alerted to, you can select a broad spectrum of notification options.
The most popular include Slack, Microsoft Teams, Phone calls, SMS, emails, webhooks, and more.
The best part is that notifications within Better Stack are unlimited. This way, you don’t have to worry about being charged extra in case of significant incidents.
**Learn more:** [How to use escalation policies in Better Stack](https://betterstack.com/docs/uptime/escalation-policies/)
### How to set up your GCP Load Balancing dashboard
Once you’ve signed up for [Better Stack](https://betterstack.com/logs)
, you can collect logs and metrics from GCP Load Balancing in just 2 minutes. Here is the official [documentation](https://betterstack.com/docs/logs/google-cloud/)
on how to do it.
Are you already using another log forwarder that you’re used to? See the documentation for [Fluent Bit](https://betterstack.com/docs/logs/fluent-bit/)
, [Logstash](https://betterstack.com/docs/logs/logstash/)
, [Fluentd](https://betterstack.com/docs/logs/fluentd/)
, [Filebeat](https://betterstack.com/docs/logs/filebeat/)
, [Syslog](https://betterstack.com/docs/logs/syslog-setup/)
, and [others](https://betterstack.com/docs/logs/start/)
.
### Have any questions?
Please feel free to message us at [hello@betterstack.com](mailto:hello@betterstack.com?subject=Question%20about%20Better%20Stack&body=)
.
We'll get back to you as soon as we can, typically within a few hours. 🙏 Thank you!
* * *
#### You might also like
[\
\
### PostgreSQL\
\
Relational database management system emphasizing extensibility and SQL compliance.](https://betterstack.com/dashboards/postgresql)
[\
\
### Host (Datadog)\
\
Monitor your server with Datadog agent.](https://betterstack.com/dashboards/datadog)

### Please accept cookies
We use cookies to authenticate users, improve the product user experience, and for [personalized ads](https://business.safety.google/privacy/)
. [Learn more.](https://betterstack.com/privacy)
Deny Accept required Accept all
---
# AWS RDS Enhanced Monitoring dashboard template | Better Stack
[Back to dashboards](https://betterstack.com/dashboards)
AWS RDS Enhanced Monitoring
===========================
OS-level metrics for RDS instances at per-second granularity.
[Add dashboard](https://telemetry.betterstack.com/team/0/dashboards#template-95603)
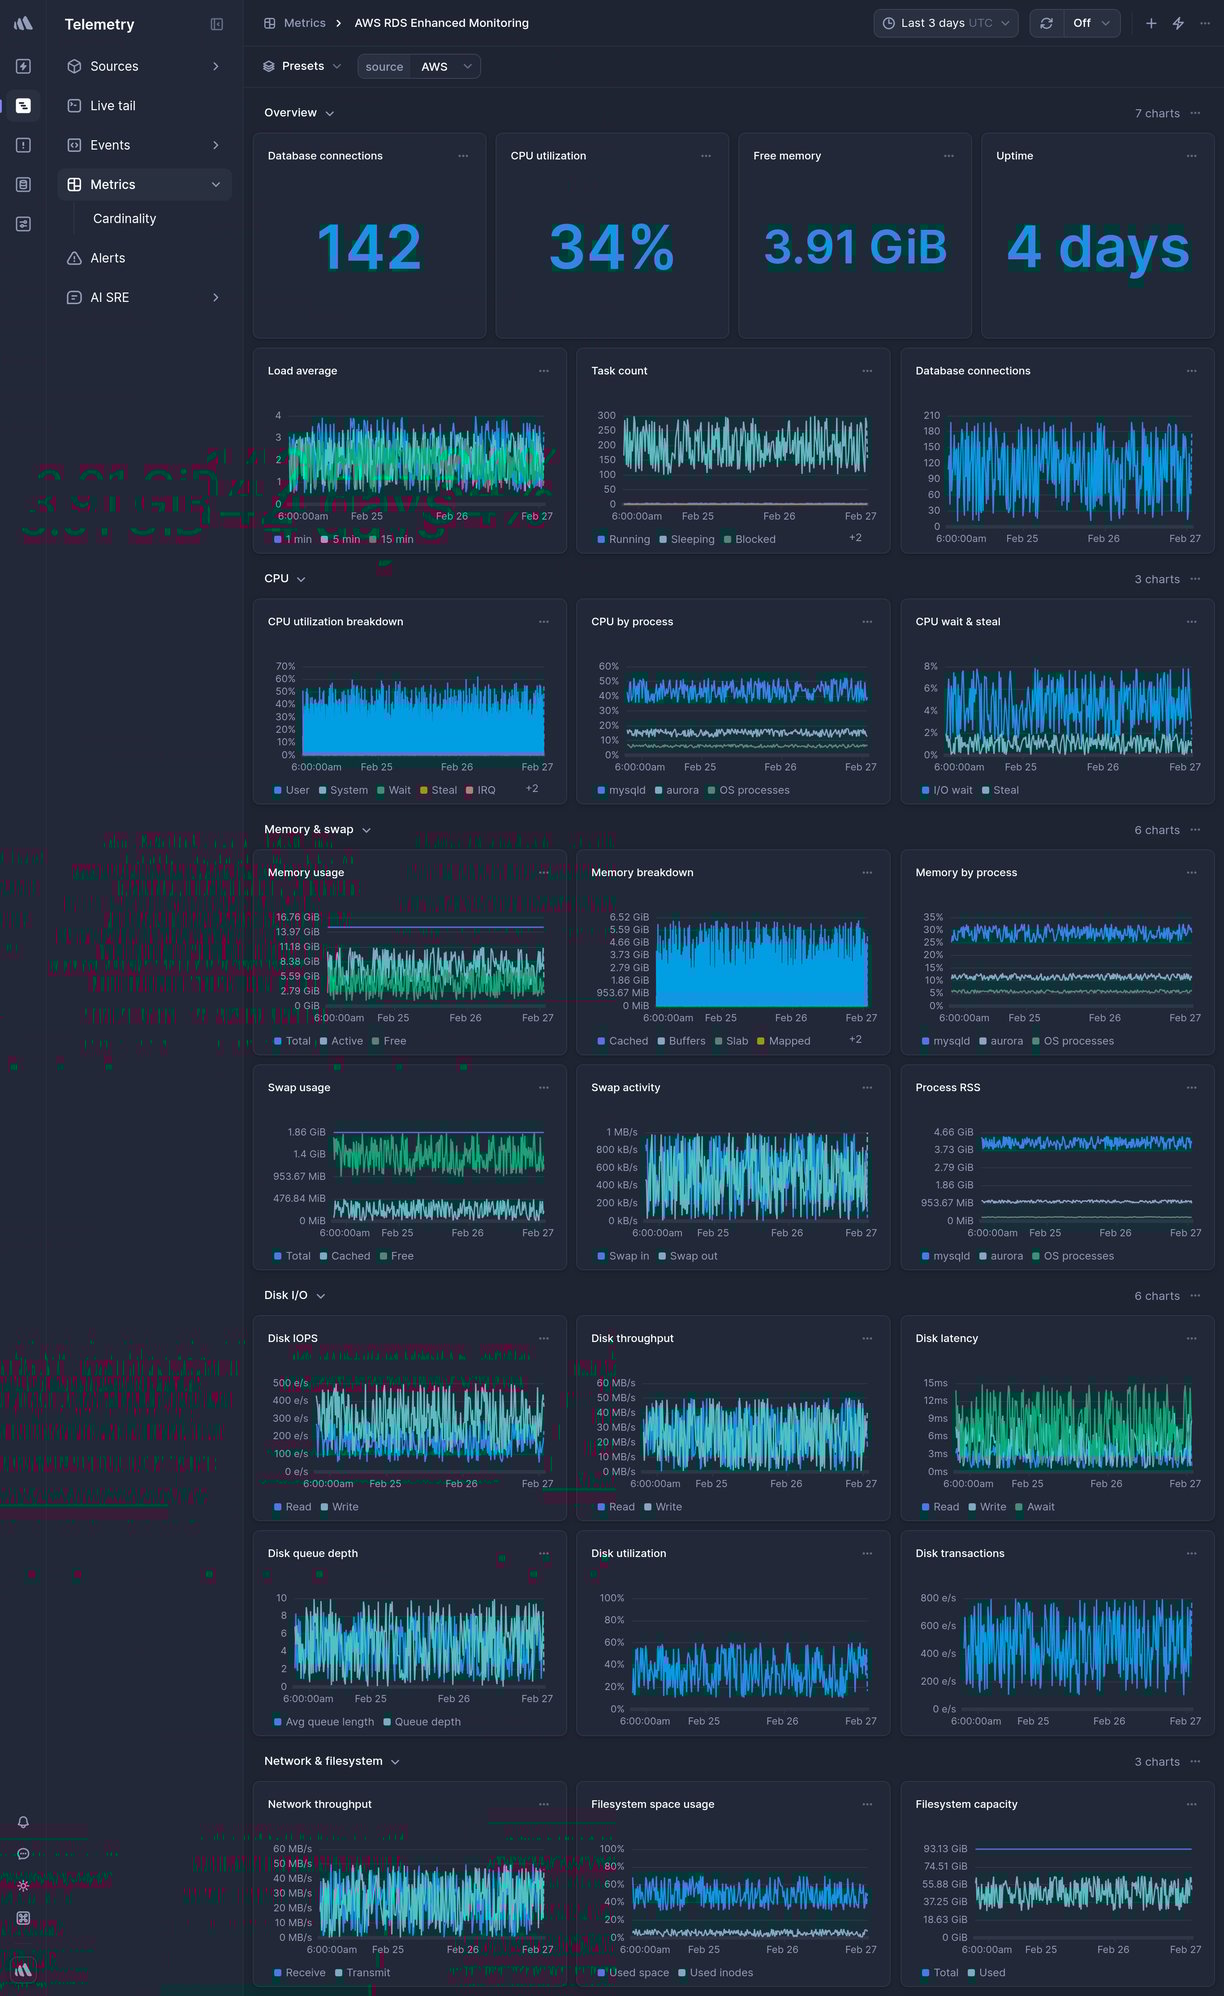
Data source
AWS CloudWatch
* * *

Overview
--------
This is a ready-made AWS RDS Enhanced Monitoring Telemetry dashboard in Better Stack.
To get it, [sign up](https://betterstack.com/users/sign-up)
for Better Stack, [connect your log or metrics source](https://betterstack.com/docs/logs/logging-start/)
, and select one of the beautiful [pre-built dashboards](https://betterstack.com/dashboards)
you want to get.
### What charts are included
* CPU utilization
* Memory usage
* File system usage
* Disk I/O
* And much more, explore on your own to see all the chart options.

### How to create a custom chart
Need a custom chart? You can create one by writing a regular SQL query.
Here is how to do it:
1. **Pick a chart type:** the most popular options include a line chart, bar chart, pie chart, a single number, and a live tail (a stream of the newest logs).
2. **Pick a source and timeframe:** we use [variables](https://betterstack.com/docs/logs/dashboards/variables/)
in the SQL queries, which makes it easy to edit and work with any query. The main variables are `source` and `timeframe`. Once you set those, as in the example above, you can use the timeframe switcher easily, and the dashboard will update automatically.
3. **Write your SQL query:** there is no need to use any specific querying language. Just write SQL like you’re used to.
**Learn more:** [How to build SQL queries in Better Stack](https://betterstack.com/docs/logs/dashboards/sql-queries/)

### How to create an alert for a metric
You can get easily alerted on irregularities before they become incidents.
Everything is fully integrated into dashboards, there is no need to set up complex workflows.
Here are the most popular alert types:
* **Threshold Alerts:** Perfect for scenarios where you need to be notified when a metric crosses a certain predefined threshold. For instance, if your application's response time exceeds a set limit, you’ll get an alert.
* **Relative Alerts:** Want to monitor changes in metrics relative to their historical data? Whether it's an unexpected drop in sales, a surge in new user signups, or any other relative metric anomaly, we've got you covered.
* **Anomaly detection:** Use this alerting method if you're unsure about what threshold to set. It will notify you about any significant deviation from the predicted value of the series. Think of this method as covering what you didn’t even know can occur.
**Learn more:** [How to use alerts in Better Stack](https://betterstack.com/docs/logs/dashboards/alerts/)

### How to receive notification about issues
Once you set up what metric irregularities you want to get alerted to, you can select a broad spectrum of notification options.
The most popular include Slack, Microsoft Teams, Phone calls, SMS, emails, webhooks, and more.
The best part is that notifications within Better Stack are unlimited. This way, you don’t have to worry about being charged extra in case of significant incidents.
**Learn more:** [How to use escalation policies in Better Stack](https://betterstack.com/docs/uptime/escalation-policies/)
### How to set up your AWS RDS Enhanced Monitoring dashboard
Once you’ve signed up for [Better Stack](https://betterstack.com/logs)
, you can collect logs and metrics from AWS RDS Enhanced Monitoring in just 2 minutes. Here is the official [documentation](https://betterstack.com/docs/logs/aws-cloudformation/)
on how to do it.
Are you already using another log forwarder that you’re used to? See the documentation for [Fluent Bit](https://betterstack.com/docs/logs/fluent-bit/)
, [Logstash](https://betterstack.com/docs/logs/logstash/)
, [Fluentd](https://betterstack.com/docs/logs/fluentd/)
, [Filebeat](https://betterstack.com/docs/logs/filebeat/)
, [Syslog](https://betterstack.com/docs/logs/syslog-setup/)
, and [others](https://betterstack.com/docs/logs/start/)
.
### Have any questions?
Please feel free to message us at [hello@betterstack.com](mailto:hello@betterstack.com?subject=Question%20about%20Better%20Stack&body=)
.
We'll get back to you as soon as we can, typically within a few hours. 🙏 Thank you!
* * *
#### You might also like
[\
\
### AWS ElastiCache Memcached\
\
Managed in-memory Memcached-compatible caching service.](https://betterstack.com/dashboards/aws-elasticache-memcached)
[\
\
### AWS RDS PostgreSQL\
\
Managed PostgreSQL-compatible relational database on AWS.](https://betterstack.com/dashboards/aws-rds-postgresql)

### Please accept cookies
We use cookies to authenticate users, improve the product user experience, and for [personalized ads](https://business.safety.google/privacy/)
. [Learn more.](https://betterstack.com/privacy)
Deny Accept required Accept all
---
# AWS ECS dashboard template | Better Stack
[Back to dashboards](https://betterstack.com/dashboards)
AWS ECS
=======
Container orchestration service on AWS.
[Add dashboard](https://telemetry.betterstack.com/team/0/dashboards#template-95601)
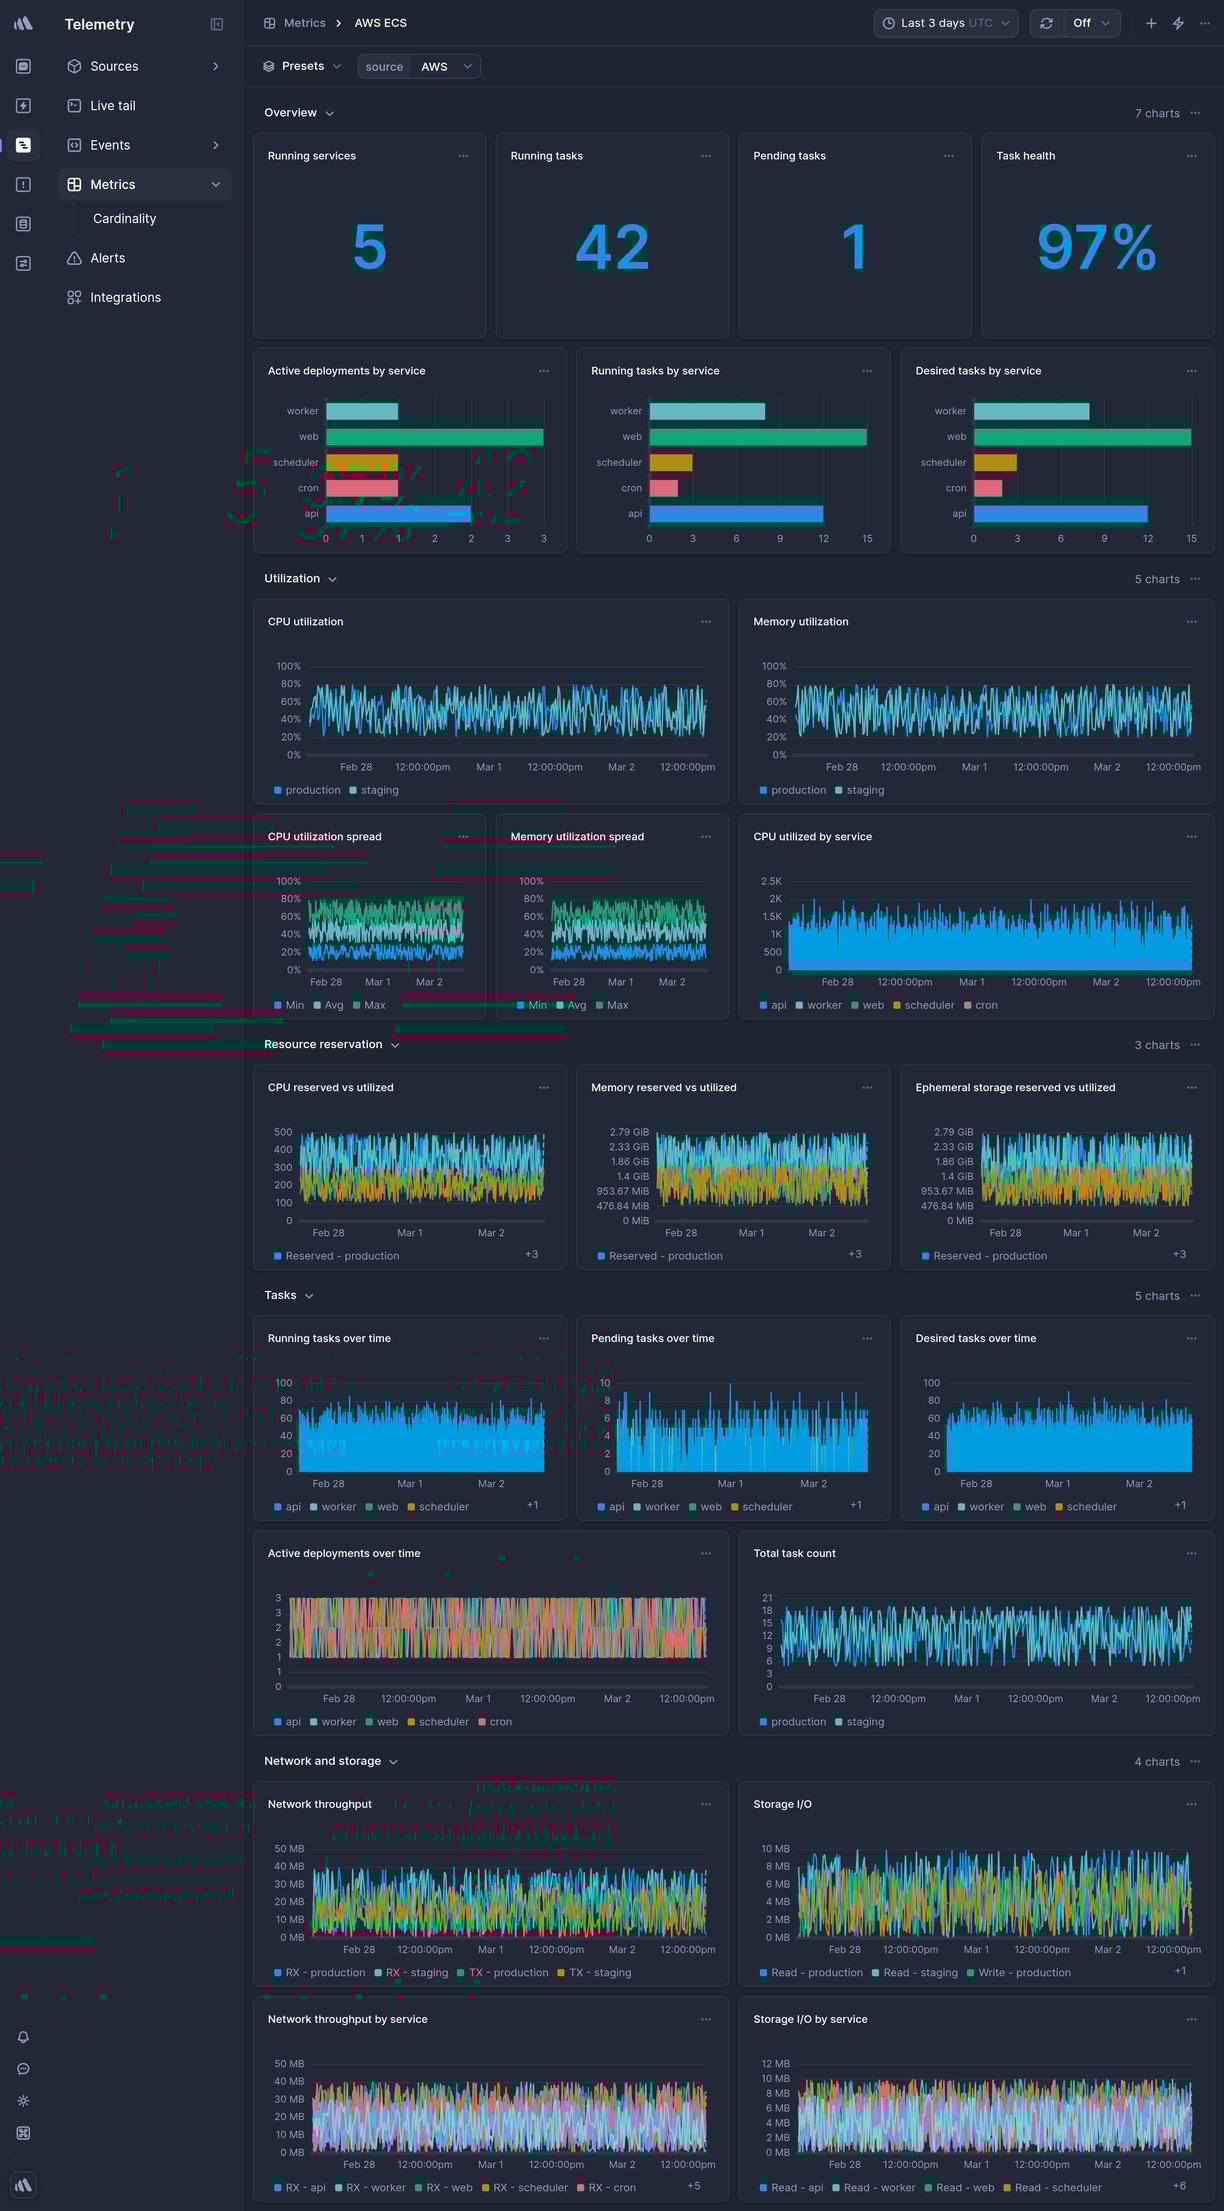
Data source
AWS CloudWatch
* * *

Overview
--------
This is a ready-made AWS ECS Telemetry dashboard in Better Stack.
To get it, [sign up](https://betterstack.com/users/sign-up)
for Better Stack, [connect your log or metrics source](https://betterstack.com/docs/logs/logging-start/)
, and select one of the beautiful [pre-built dashboards](https://betterstack.com/dashboards)
you want to get.
### What charts are included
* CPU utilization
* Memory utilization
* Running tasks
* Service count
* And much more, explore on your own to see all the chart options.

### How to create a custom chart
Need a custom chart? You can create one by writing a regular SQL query.
Here is how to do it:
1. **Pick a chart type:** the most popular options include a line chart, bar chart, pie chart, a single number, and a live tail (a stream of the newest logs).
2. **Pick a source and timeframe:** we use [variables](https://betterstack.com/docs/logs/dashboards/variables/)
in the SQL queries, which makes it easy to edit and work with any query. The main variables are `source` and `timeframe`. Once you set those, as in the example above, you can use the timeframe switcher easily, and the dashboard will update automatically.
3. **Write your SQL query:** there is no need to use any specific querying language. Just write SQL like you’re used to.
**Learn more:** [How to build SQL queries in Better Stack](https://betterstack.com/docs/logs/dashboards/sql-queries/)

### How to create an alert for a metric
You can get easily alerted on irregularities before they become incidents.
Everything is fully integrated into dashboards, there is no need to set up complex workflows.
Here are the most popular alert types:
* **Threshold Alerts:** Perfect for scenarios where you need to be notified when a metric crosses a certain predefined threshold. For instance, if your application's response time exceeds a set limit, you’ll get an alert.
* **Relative Alerts:** Want to monitor changes in metrics relative to their historical data? Whether it's an unexpected drop in sales, a surge in new user signups, or any other relative metric anomaly, we've got you covered.
* **Anomaly detection:** Use this alerting method if you're unsure about what threshold to set. It will notify you about any significant deviation from the predicted value of the series. Think of this method as covering what you didn’t even know can occur.
**Learn more:** [How to use alerts in Better Stack](https://betterstack.com/docs/logs/dashboards/alerts/)

### How to receive notification about issues
Once you set up what metric irregularities you want to get alerted to, you can select a broad spectrum of notification options.
The most popular include Slack, Microsoft Teams, Phone calls, SMS, emails, webhooks, and more.
The best part is that notifications within Better Stack are unlimited. This way, you don’t have to worry about being charged extra in case of significant incidents.
**Learn more:** [How to use escalation policies in Better Stack](https://betterstack.com/docs/uptime/escalation-policies/)
### How to set up your AWS ECS dashboard
Once you’ve signed up for [Better Stack](https://betterstack.com/logs)
, you can collect logs and metrics from AWS ECS in just 2 minutes. Here is the official [documentation](https://betterstack.com/docs/logs/aws-cloudformation/)
on how to do it.
Are you already using another log forwarder that you’re used to? See the documentation for [Fluent Bit](https://betterstack.com/docs/logs/fluent-bit/)
, [Logstash](https://betterstack.com/docs/logs/logstash/)
, [Fluentd](https://betterstack.com/docs/logs/fluentd/)
, [Filebeat](https://betterstack.com/docs/logs/filebeat/)
, [Syslog](https://betterstack.com/docs/logs/syslog-setup/)
, and [others](https://betterstack.com/docs/logs/start/)
.
### Have any questions?
Please feel free to message us at [hello@betterstack.com](mailto:hello@betterstack.com?subject=Question%20about%20Better%20Stack&body=)
.
We'll get back to you as soon as we can, typically within a few hours. 🙏 Thank you!
* * *
#### You might also like
[\
\
### Redis\
\
Open-source in-memory key-value database and cache with durability.](https://betterstack.com/dashboards/redis)
[\
\
### Kubernetes\
\
Container orchestration platform.](https://betterstack.com/dashboards/kubernetes)

### Please accept cookies
We use cookies to authenticate users, improve the product user experience, and for [personalized ads](https://business.safety.google/privacy/)
. [Learn more.](https://betterstack.com/privacy)
Deny Accept required Accept all
---
# Cloudflare HTTP Requests dashboard template | Better Stack
[Back to dashboards](https://betterstack.com/dashboards)
Cloudflare HTTP Requests
========================
HTTP requests processed by Cloudflare. Uses http\_requests Logpush dataset.
[Add dashboard](https://telemetry.betterstack.com/team/0/dashboards#template-94572)
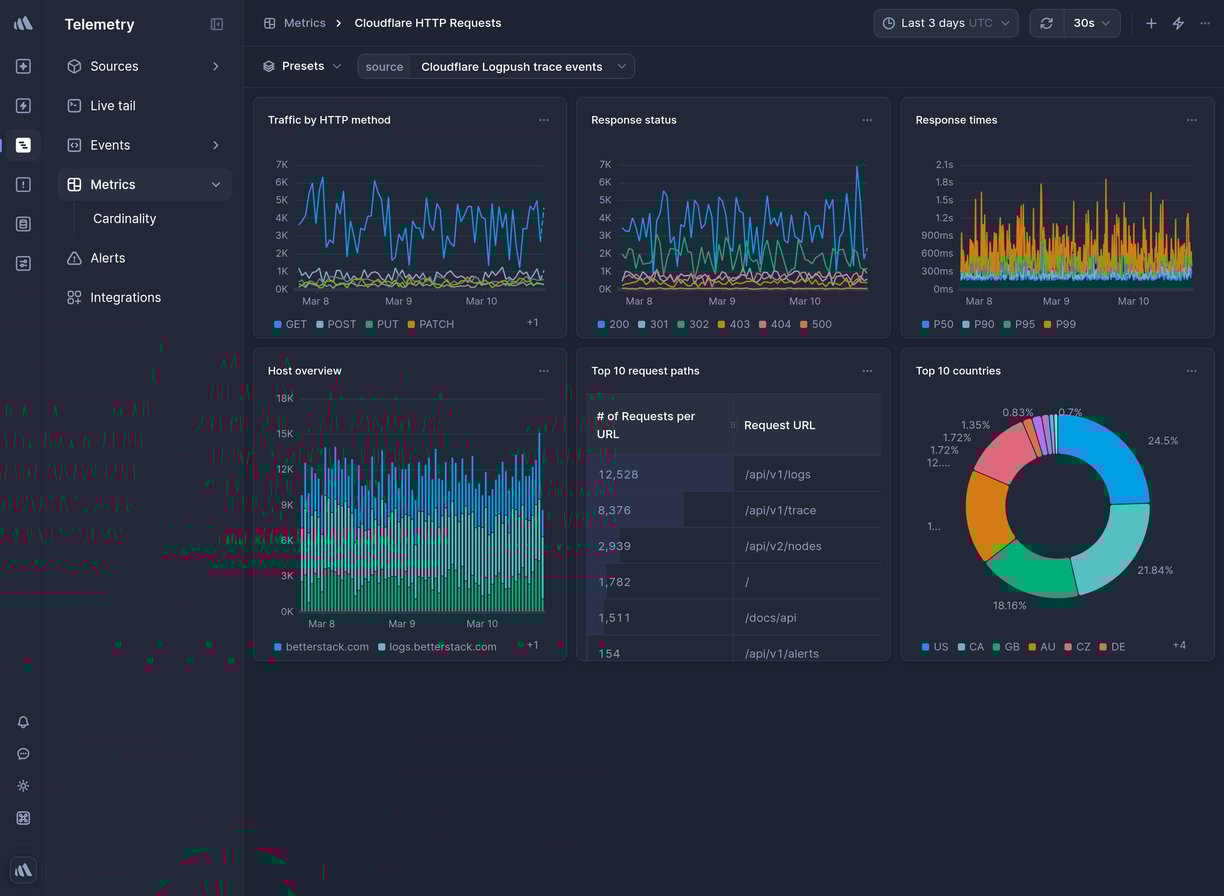
Data source
Cloudflare Logpush
* * *

Overview
--------
This is a ready-made Cloudflare HTTP Requests Telemetry dashboard in Better Stack.
To get it, [sign up](https://betterstack.com/users/sign-up)
for Better Stack, [connect your log or metrics source](https://betterstack.com/docs/logs/logging-start/)
, and select one of the beautiful [pre-built dashboards](https://betterstack.com/dashboards)
you want to get.
### What charts are included
* Traffic by HTTP Method
* Response status
* Traffic by zone
* Average request bytes
* Top request paths
* Client IPs
* And much more, explore on your own to see all the chart options.

### How to create a custom chart
Need a custom chart? You can create one by writing a regular SQL query.
Here is how to do it:
1. **Pick a chart type:** the most popular options include a line chart, bar chart, pie chart, a single number, and a live tail (a stream of the newest logs).
2. **Pick a source and timeframe:** we use [variables](https://betterstack.com/docs/logs/dashboards/variables/)
in the SQL queries, which makes it easy to edit and work with any query. The main variables are `source` and `timeframe`. Once you set those, as in the example above, you can use the timeframe switcher easily, and the dashboard will update automatically.
3. **Write your SQL query:** there is no need to use any specific querying language. Just write SQL like you’re used to.
**Learn more:** [How to build SQL queries in Better Stack](https://betterstack.com/docs/logs/dashboards/sql-queries/)

### How to create an alert for a metric
You can get easily alerted on irregularities before they become incidents.
Everything is fully integrated into dashboards, there is no need to set up complex workflows.
Here are the most popular alert types:
* **Threshold Alerts:** Perfect for scenarios where you need to be notified when a metric crosses a certain predefined threshold. For instance, if your application's response time exceeds a set limit, you’ll get an alert.
* **Relative Alerts:** Want to monitor changes in metrics relative to their historical data? Whether it's an unexpected drop in sales, a surge in new user signups, or any other relative metric anomaly, we've got you covered.
* **Anomaly detection:** Use this alerting method if you're unsure about what threshold to set. It will notify you about any significant deviation from the predicted value of the series. Think of this method as covering what you didn’t even know can occur.
**Learn more:** [How to use alerts in Better Stack](https://betterstack.com/docs/logs/dashboards/alerts/)

### How to receive notification about issues
Once you set up what metric irregularities you want to get alerted to, you can select a broad spectrum of notification options.
The most popular include Slack, Microsoft Teams, Phone calls, SMS, emails, webhooks, and more.
The best part is that notifications within Better Stack are unlimited. This way, you don’t have to worry about being charged extra in case of significant incidents.
**Learn more:** [How to use escalation policies in Better Stack](https://betterstack.com/docs/uptime/escalation-policies/)
### How to set up your Cloudflare HTTP Requests dashboard
Once you’ve signed up for [Better Stack](https://betterstack.com/logs)
, you can collect logs and metrics from Cloudflare HTTP Requests in just 2 minutes. Here is the official [documentation](https://betterstack.com/docs/logs/cloudflare/logpush/)
on how to do it.
Are you already using another log forwarder that you’re used to? See the documentation for [Fluent Bit](https://betterstack.com/docs/logs/fluent-bit/)
, [Logstash](https://betterstack.com/docs/logs/logstash/)
, [Fluentd](https://betterstack.com/docs/logs/fluentd/)
, [Filebeat](https://betterstack.com/docs/logs/filebeat/)
, [Syslog](https://betterstack.com/docs/logs/syslog-setup/)
, and [others](https://betterstack.com/docs/logs/start/)
.
### Have any questions?
Please feel free to message us at [hello@betterstack.com](mailto:hello@betterstack.com?subject=Question%20about%20Better%20Stack&body=)
.
We'll get back to you as soon as we can, typically within a few hours. 🙏 Thank you!
* * *
#### You might also like
[\
\
### Web vitals\
\
Get alerted when your Core Web Vitals decline.](https://betterstack.com/dashboards/web-vitals)
[\
\
### Traefik\
\
Open-source reverse proxy and load balancer for HTTP and TCP-based applications.](https://betterstack.com/dashboards/traefik)

### Please accept cookies
We use cookies to authenticate users, improve the product user experience, and for [personalized ads](https://business.safety.google/privacy/)
. [Learn more.](https://betterstack.com/privacy)
Deny Accept required Accept all
---
# Redis dashboard template | Better Stack
[Back to dashboards](https://betterstack.com/dashboards)
Redis
=====
Open-source in-memory key-value database and cache with durability.
[Add dashboard](https://telemetry.betterstack.com/team/0/dashboards#template-94565)
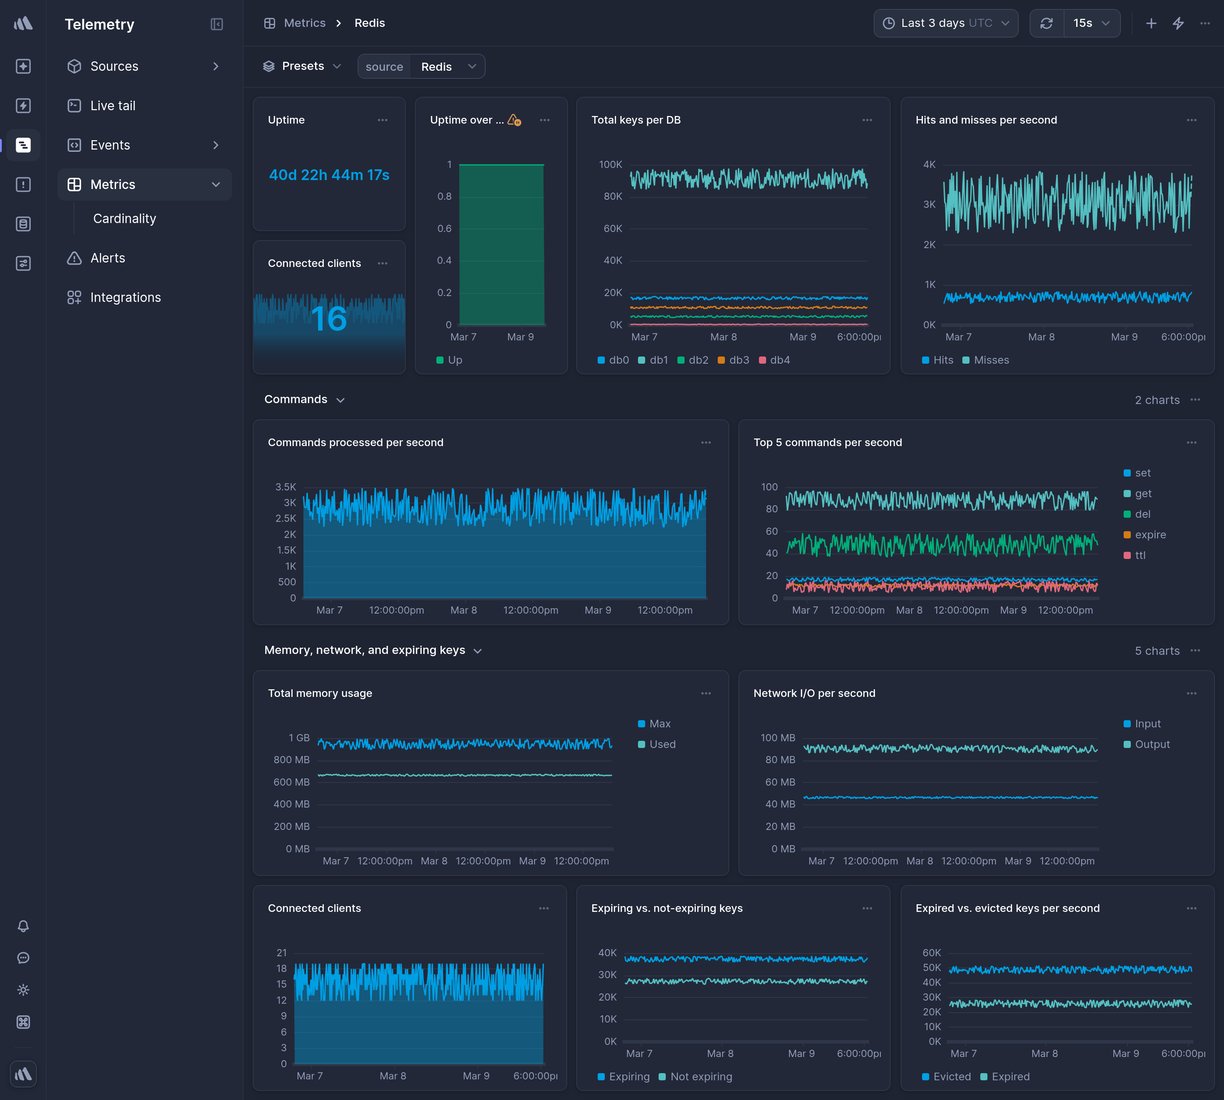
Data source
Redis
* * *

Overview
--------
This is a ready-made Redis Telemetry dashboard in Better Stack.
To get it, [sign up](https://betterstack.com/users/sign-up)
for Better Stack, [connect your log or metrics source](https://betterstack.com/docs/logs/logging-start/)
, and select one of the beautiful [pre-built dashboards](https://betterstack.com/dashboards)
you want to get.
### What charts are included
* Total keys per DB
* Total memory usage
* Network I/O per second
* Hits / Misses per second
* Commands processed per second
* And much more, explore on your own to see all the chart options.

### How to create a custom chart
Need a custom chart? You can create one by writing a regular SQL query.
Here is how to do it:
1. **Pick a chart type:** the most popular options include a line chart, bar chart, pie chart, a single number, and a live tail (a stream of the newest logs).
2. **Pick a source and timeframe:** we use [variables](https://betterstack.com/docs/logs/dashboards/variables/)
in the SQL queries, which makes it easy to edit and work with any query. The main variables are `source` and `timeframe`. Once you set those, as in the example above, you can use the timeframe switcher easily, and the dashboard will update automatically.
3. **Write your SQL query:** there is no need to use any specific querying language. Just write SQL like you’re used to.
**Learn more:** [How to build SQL queries in Better Stack](https://betterstack.com/docs/logs/dashboards/sql-queries/)

### How to create an alert for a metric
You can get easily alerted on irregularities before they become incidents.
Everything is fully integrated into dashboards, there is no need to set up complex workflows.
Here are the most popular alert types:
* **Threshold Alerts:** Perfect for scenarios where you need to be notified when a metric crosses a certain predefined threshold. For instance, if your application's response time exceeds a set limit, you’ll get an alert.
* **Relative Alerts:** Want to monitor changes in metrics relative to their historical data? Whether it's an unexpected drop in sales, a surge in new user signups, or any other relative metric anomaly, we've got you covered.
* **Anomaly detection:** Use this alerting method if you're unsure about what threshold to set. It will notify you about any significant deviation from the predicted value of the series. Think of this method as covering what you didn’t even know can occur.
**Learn more:** [How to use alerts in Better Stack](https://betterstack.com/docs/logs/dashboards/alerts/)

### How to receive notification about issues
Once you set up what metric irregularities you want to get alerted to, you can select a broad spectrum of notification options.
The most popular include Slack, Microsoft Teams, Phone calls, SMS, emails, webhooks, and more.
The best part is that notifications within Better Stack are unlimited. This way, you don’t have to worry about being charged extra in case of significant incidents.
**Learn more:** [How to use escalation policies in Better Stack](https://betterstack.com/docs/uptime/escalation-policies/)
### How to set up your Redis dashboard
Once you’ve signed up for [Better Stack](https://betterstack.com/logs)
, you can collect logs and metrics from Redis in just 2 minutes. Here is the official [documentation](https://betterstack.com/docs/logs/redis/)
on how to do it.
Are you already using another log forwarder that you’re used to? See the documentation for [Fluent Bit](https://betterstack.com/docs/logs/fluent-bit/)
, [Logstash](https://betterstack.com/docs/logs/logstash/)
, [Fluentd](https://betterstack.com/docs/logs/fluentd/)
, [Filebeat](https://betterstack.com/docs/logs/filebeat/)
, [Syslog](https://betterstack.com/docs/logs/syslog-setup/)
, and [others](https://betterstack.com/docs/logs/start/)
.
### Have any questions?
Please feel free to message us at [hello@betterstack.com](mailto:hello@betterstack.com?subject=Question%20about%20Better%20Stack&body=)
.
We'll get back to you as soon as we can, typically within a few hours. 🙏 Thank you!
* * *
#### You might also like
[\
\
### PostgreSQL\
\
Relational database management system emphasizing extensibility and SQL compliance.](https://betterstack.com/dashboards/postgresql)
[\
\
### GCP Cloud Functions\
\
Event-driven serverless functions for lightweight workloads.](https://betterstack.com/dashboards/gcp-cloud-functions)

### Please accept cookies
We use cookies to authenticate users, improve the product user experience, and for [personalized ads](https://business.safety.google/privacy/)
. [Learn more.](https://betterstack.com/privacy)
Deny Accept required Accept all
---
# Vercel dashboard template | Better Stack
[Back to dashboards](https://betterstack.com/dashboards)
Vercel
======
Jamstack hosting with Git integration.
[Add dashboard](https://telemetry.betterstack.com/team/0/dashboards#template-94560)
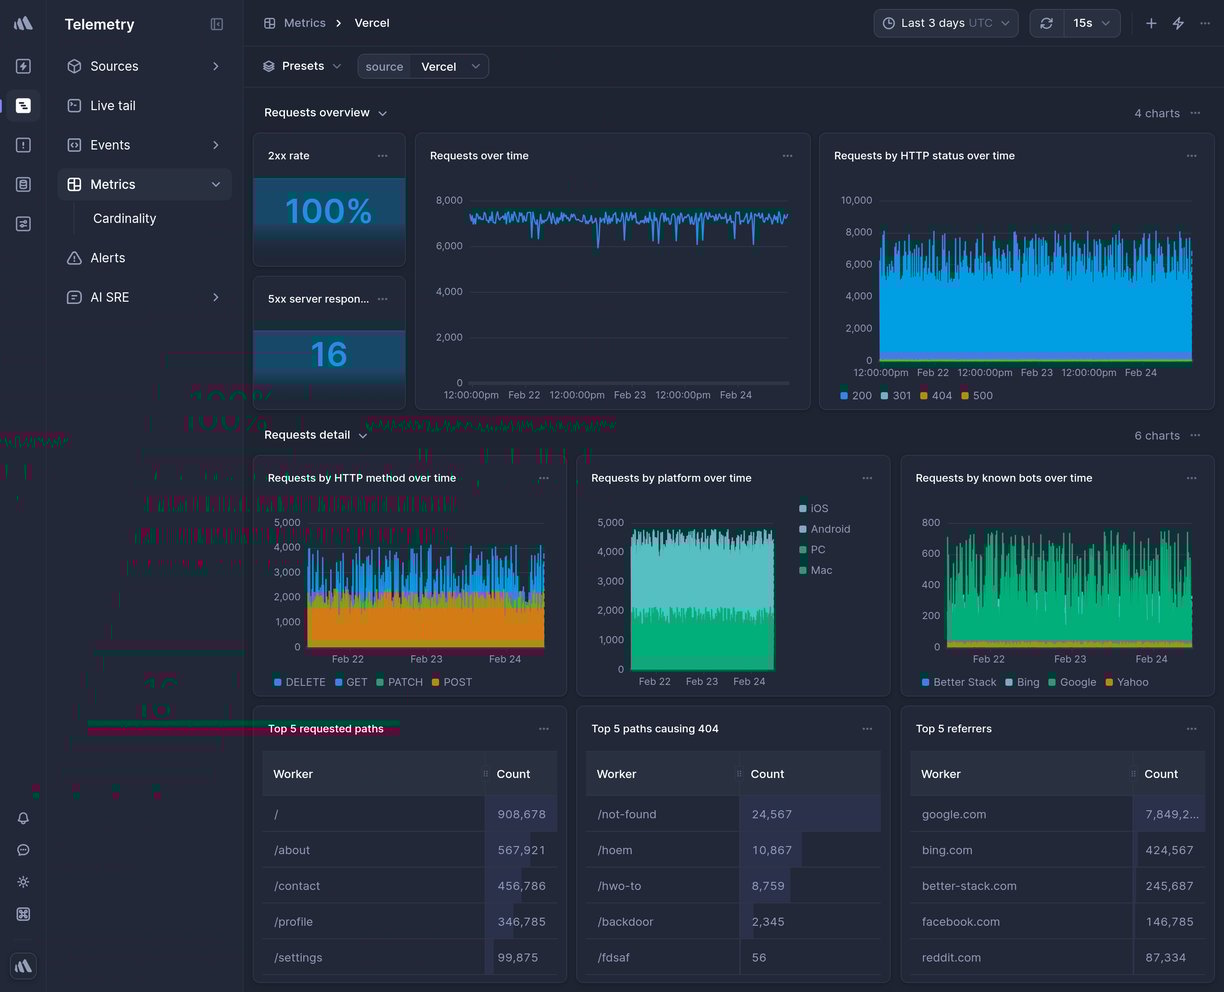
Data source
Vercel
* * *

Overview
--------
This is a ready-made Vercel Telemetry dashboard in Better Stack.
To get it, [sign up](https://betterstack.com/users/sign-up)
for Better Stack, [connect your log or metrics source](https://betterstack.com/docs/logs/logging-start/)
, and select one of the beautiful [pre-built dashboards](https://betterstack.com/dashboards)
you want to get.
### What charts are included
* Requests over time
* 2xx rate
* Request by HTTP status over time
* Request by HTTP method over time
* Request by platform over time
* And much more, explore on your own to see all the chart options.

### How to create a custom chart
Need a custom chart? You can create one by writing a regular SQL query.
Here is how to do it:
1. **Pick a chart type:** the most popular options include a line chart, bar chart, pie chart, a single number, and a live tail (a stream of the newest logs).
2. **Pick a source and timeframe:** we use [variables](https://betterstack.com/docs/logs/dashboards/variables/)
in the SQL queries, which makes it easy to edit and work with any query. The main variables are `source` and `timeframe`. Once you set those, as in the example above, you can use the timeframe switcher easily, and the dashboard will update automatically.
3. **Write your SQL query:** there is no need to use any specific querying language. Just write SQL like you’re used to.
**Learn more:** [How to build SQL queries in Better Stack](https://betterstack.com/docs/logs/dashboards/sql-queries/)

### How to create an alert for a metric
You can get easily alerted on irregularities before they become incidents.
Everything is fully integrated into dashboards, there is no need to set up complex workflows.
Here are the most popular alert types:
* **Threshold Alerts:** Perfect for scenarios where you need to be notified when a metric crosses a certain predefined threshold. For instance, if your application's response time exceeds a set limit, you’ll get an alert.
* **Relative Alerts:** Want to monitor changes in metrics relative to their historical data? Whether it's an unexpected drop in sales, a surge in new user signups, or any other relative metric anomaly, we've got you covered.
* **Anomaly detection:** Use this alerting method if you're unsure about what threshold to set. It will notify you about any significant deviation from the predicted value of the series. Think of this method as covering what you didn’t even know can occur.
**Learn more:** [How to use alerts in Better Stack](https://betterstack.com/docs/logs/dashboards/alerts/)

### How to receive notification about issues
Once you set up what metric irregularities you want to get alerted to, you can select a broad spectrum of notification options.
The most popular include Slack, Microsoft Teams, Phone calls, SMS, emails, webhooks, and more.
The best part is that notifications within Better Stack are unlimited. This way, you don’t have to worry about being charged extra in case of significant incidents.
**Learn more:** [How to use escalation policies in Better Stack](https://betterstack.com/docs/uptime/escalation-policies/)
### How to set up your Vercel dashboard
Once you’ve signed up for [Better Stack](https://betterstack.com/logs)
, you can collect logs and metrics from Vercel in just 2 minutes. Here is the official [documentation](https://betterstack.com/docs/logs/vercel/)
on how to do it.
Are you already using another log forwarder that you’re used to? See the documentation for [Fluent Bit](https://betterstack.com/docs/logs/fluent-bit/)
, [Logstash](https://betterstack.com/docs/logs/logstash/)
, [Fluentd](https://betterstack.com/docs/logs/fluentd/)
, [Filebeat](https://betterstack.com/docs/logs/filebeat/)
, [Syslog](https://betterstack.com/docs/logs/syslog-setup/)
, and [others](https://betterstack.com/docs/logs/start/)
.
### Have any questions?
Please feel free to message us at [hello@betterstack.com](mailto:hello@betterstack.com?subject=Question%20about%20Better%20Stack&body=)
.
We'll get back to you as soon as we can, typically within a few hours. 🙏 Thank you!
* * *
#### You might also like
[\
\
### Kubernetes\
\
Container orchestration platform.](https://betterstack.com/dashboards/kubernetes)
[\
\
### AWS S3\
\
Scalable object storage for data of any size.](https://betterstack.com/dashboards/aws-s3)

### Please accept cookies
We use cookies to authenticate users, improve the product user experience, and for [personalized ads](https://business.safety.google/privacy/)
. [Learn more.](https://betterstack.com/privacy)
Deny Accept required Accept all
---
# Cloudflare HTTP Requests dashboard template | Better Stack
[Back to dashboards](https://betterstack.com/dashboards)
Cloudflare HTTP Requests
========================
Use custom Cloudflare Worker code to log HTTP requests.
[Add dashboard](https://telemetry.betterstack.com/team/0/dashboards#template-94573)

Data source
Cloudflare HTTP Requests
* * *

Overview
--------
This is a ready-made Cloudflare HTTP Requests Telemetry dashboard in Better Stack.
To get it, [sign up](https://betterstack.com/users/sign-up)
for Better Stack, [connect your log or metrics source](https://betterstack.com/docs/logs/logging-start/)
, and select one of the beautiful [pre-built dashboards](https://betterstack.com/dashboards)
you want to get.
### What charts are included
* Traffic by HTTP Method
* Response status
* Response times
* Host overview
* Top 10 countries
* Top request paths
* Client IPs
* And much more, explore on your own to see all the chart options.

### How to create a custom chart
Need a custom chart? You can create one by writing a regular SQL query.
Here is how to do it:
1. **Pick a chart type:** the most popular options include a line chart, bar chart, pie chart, a single number, and a live tail (a stream of the newest logs).
2. **Pick a source and timeframe:** we use [variables](https://betterstack.com/docs/logs/dashboards/variables/)
in the SQL queries, which makes it easy to edit and work with any query. The main variables are `source` and `timeframe`. Once you set those, as in the example above, you can use the timeframe switcher easily, and the dashboard will update automatically.
3. **Write your SQL query:** there is no need to use any specific querying language. Just write SQL like you’re used to.
**Learn more:** [How to build SQL queries in Better Stack](https://betterstack.com/docs/logs/dashboards/sql-queries/)

### How to create an alert for a metric
You can get easily alerted on irregularities before they become incidents.
Everything is fully integrated into dashboards, there is no need to set up complex workflows.
Here are the most popular alert types:
* **Threshold Alerts:** Perfect for scenarios where you need to be notified when a metric crosses a certain predefined threshold. For instance, if your application's response time exceeds a set limit, you’ll get an alert.
* **Relative Alerts:** Want to monitor changes in metrics relative to their historical data? Whether it's an unexpected drop in sales, a surge in new user signups, or any other relative metric anomaly, we've got you covered.
* **Anomaly detection:** Use this alerting method if you're unsure about what threshold to set. It will notify you about any significant deviation from the predicted value of the series. Think of this method as covering what you didn’t even know can occur.
**Learn more:** [How to use alerts in Better Stack](https://betterstack.com/docs/logs/dashboards/alerts/)

### How to receive notification about issues
Once you set up what metric irregularities you want to get alerted to, you can select a broad spectrum of notification options.
The most popular include Slack, Microsoft Teams, Phone calls, SMS, emails, webhooks, and more.
The best part is that notifications within Better Stack are unlimited. This way, you don’t have to worry about being charged extra in case of significant incidents.
**Learn more:** [How to use escalation policies in Better Stack](https://betterstack.com/docs/uptime/escalation-policies/)
### How to set up your Cloudflare HTTP Requests dashboard
Once you’ve signed up for [Better Stack](https://betterstack.com/logs)
, you can collect logs and metrics from Cloudflare HTTP Requests in just 2 minutes. Here is the official [documentation](https://betterstack.com/docs/logs/cloudflare-http-requests)
on how to do it.
Are you already using another log forwarder that you’re used to? See the documentation for [Fluent Bit](https://betterstack.com/docs/logs/fluent-bit/)
, [Logstash](https://betterstack.com/docs/logs/logstash/)
, [Fluentd](https://betterstack.com/docs/logs/fluentd/)
, [Filebeat](https://betterstack.com/docs/logs/filebeat/)
, [Syslog](https://betterstack.com/docs/logs/syslog-setup/)
, and [others](https://betterstack.com/docs/logs/start/)
.
### Have any questions?
Please feel free to message us at [hello@betterstack.com](mailto:hello@betterstack.com?subject=Question%20about%20Better%20Stack&body=)
.
We'll get back to you as soon as we can, typically within a few hours. 🙏 Thank you!
* * *
#### You might also like
[\
\
### AWS ElastiCache Redis\
\
Managed in-memory Redis-compatible cache and data store.](https://betterstack.com/dashboards/aws-elasticache-redis)
[\
\
### PostgreSQL\
\
Relational database management system emphasizing extensibility and SQL compliance.](https://betterstack.com/dashboards/postgresql)

### Please accept cookies
We use cookies to authenticate users, improve the product user experience, and for [personalized ads](https://business.safety.google/privacy/)
. [Learn more.](https://betterstack.com/privacy)
Deny Accept required Accept all
---
# Host (Datadog) dashboard template | Better Stack
[Back to dashboards](https://betterstack.com/dashboards)
Host (Datadog)
==============
Monitor your server with Datadog agent.
[Add dashboard](https://telemetry.betterstack.com/team/0/dashboards#template-94554)
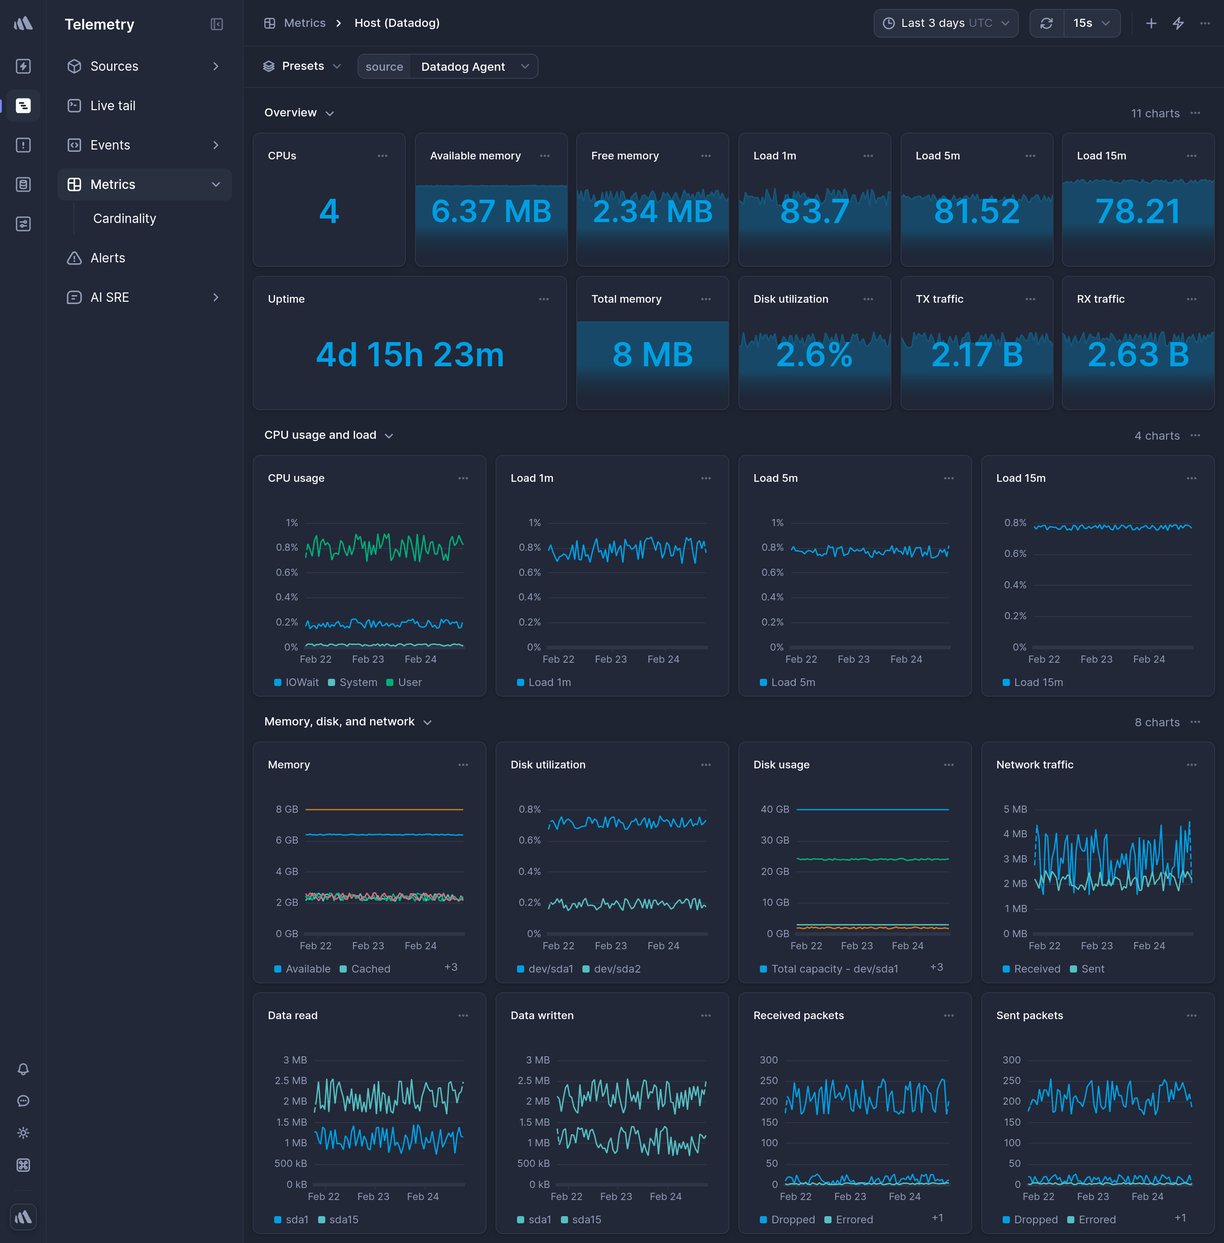
Data source
Datadog Agent
* * *

Overview
--------
This is a ready-made Host (Datadog) Telemetry dashboard in Better Stack.
To get it, [sign up](https://betterstack.com/users/sign-up)
for Better Stack, [connect your log or metrics source](https://betterstack.com/docs/logs/logging-start/)
, and select one of the beautiful [pre-built dashboards](https://betterstack.com/dashboards)
you want to get.
### What charts are included
* Uptime status
* CPUs
* Total RAM
* Available RAM
* CPU usage
* Disk utilization (%)
* And much more, explore on your own to see all the chart options.

### How to create a custom chart
Need a custom chart? You can create one by writing a regular SQL query.
Here is how to do it:
1. **Pick a chart type:** the most popular options include a line chart, bar chart, pie chart, a single number, and a live tail (a stream of the newest logs).
2. **Pick a source and timeframe:** we use [variables](https://betterstack.com/docs/logs/dashboards/variables/)
in the SQL queries, which makes it easy to edit and work with any query. The main variables are `source` and `timeframe`. Once you set those, as in the example above, you can use the timeframe switcher easily, and the dashboard will update automatically.
3. **Write your SQL query:** there is no need to use any specific querying language. Just write SQL like you’re used to.
**Learn more:** [How to build SQL queries in Better Stack](https://betterstack.com/docs/logs/dashboards/sql-queries/)

### How to create an alert for a metric
You can get easily alerted on irregularities before they become incidents.
Everything is fully integrated into dashboards, there is no need to set up complex workflows.
Here are the most popular alert types:
* **Threshold Alerts:** Perfect for scenarios where you need to be notified when a metric crosses a certain predefined threshold. For instance, if your application's response time exceeds a set limit, you’ll get an alert.
* **Relative Alerts:** Want to monitor changes in metrics relative to their historical data? Whether it's an unexpected drop in sales, a surge in new user signups, or any other relative metric anomaly, we've got you covered.
* **Anomaly detection:** Use this alerting method if you're unsure about what threshold to set. It will notify you about any significant deviation from the predicted value of the series. Think of this method as covering what you didn’t even know can occur.
**Learn more:** [How to use alerts in Better Stack](https://betterstack.com/docs/logs/dashboards/alerts/)

### How to receive notification about issues
Once you set up what metric irregularities you want to get alerted to, you can select a broad spectrum of notification options.
The most popular include Slack, Microsoft Teams, Phone calls, SMS, emails, webhooks, and more.
The best part is that notifications within Better Stack are unlimited. This way, you don’t have to worry about being charged extra in case of significant incidents.
**Learn more:** [How to use escalation policies in Better Stack](https://betterstack.com/docs/uptime/escalation-policies/)
### How to set up your Host (Datadog) dashboard
Once you’ve signed up for [Better Stack](https://betterstack.com/logs)
, you can collect logs and metrics from Host (Datadog) in just 2 minutes. Here is the official [documentation](https://betterstack.com/docs/logs/datadog-agent/)
on how to do it.
Are you already using another log forwarder that you’re used to? See the documentation for [Fluent Bit](https://betterstack.com/docs/logs/fluent-bit/)
, [Logstash](https://betterstack.com/docs/logs/logstash/)
, [Fluentd](https://betterstack.com/docs/logs/fluentd/)
, [Filebeat](https://betterstack.com/docs/logs/filebeat/)
, [Syslog](https://betterstack.com/docs/logs/syslog-setup/)
, and [others](https://betterstack.com/docs/logs/start/)
.
### Have any questions?
Please feel free to message us at [hello@betterstack.com](mailto:hello@betterstack.com?subject=Question%20about%20Better%20Stack&body=)
.
We'll get back to you as soon as we can, typically within a few hours. 🙏 Thank you!
* * *
#### You might also like
[\
\
### Nginx\
\
Web server, reverse proxy, and load balancer.](https://betterstack.com/dashboards/nginx)
[\
\
### GCP BigQuery\
\
Serverless data warehouse for analytics at any scale.](https://betterstack.com/dashboards/gcp-bigquery)

### Please accept cookies
We use cookies to authenticate users, improve the product user experience, and for [personalized ads](https://business.safety.google/privacy/)
. [Learn more.](https://betterstack.com/privacy)
Deny Accept required Accept all
---
# Careers | Better Stack

Schladming hike

Code. Ship. Have fun!

On the move

Living the brand

Regular Tuesday

Deploying to production

Iceland
Work with us
We are engineers, making the tools we always wanted
===================================================
Async-first. No bs meetings™.
No Zoom calls. We use Slack huddles & Loom.
No 60 min meetings. 26 min 1:1 quick syncs instead.
Smart & talented colleagues. Challenging tasks & rapid pace.
Our goal is to get out of your way and let you do your best work.
Cozy office. Prefer to work remotely? Fine by us! It’s not about how much time you spend working, it’s about what you ship.
Delicious lunch every day. Great coffee. Bartender in-house.
[Pragmatic approach to product, engineering,](https://betterstack.com/careers/engineering)
marketing & growth.
Off-sites & parties, moments to remember.
Get things done
---------------
[We care about winning.](https://x.com/alexkehr/status/1823480786349383879)
We’re an early stage startup, and we move with urgency. We don’t whiteboard, brainstorm ideas or waste time in endless meetings.
We ship things, we fix things, we make things happen.
We are working on exceptionally challenging tasks at a rapid pace. We care about results, not efforts. We don’t keep slackers around, and we don’t prioritize seniority over great ideas. [We’re in the details.](https://youtu.be/4ef0juAMqoE?si=k6tKwgI39VpdbR-z&t=19)
A great workplace is not about having the best gym, sleeping pods, or frequent parties. It’s about working as a team on some of the most ambitious goals. It’s a place where we learn the most and do the work we can be proud of.
Be the person who executes the “deploy” command. Be the one who organizes a customer conference. Take charge. Real artists ship.
01
Do a lot with little
--------------------
We’re a small team and we can’t do what years-old big-tech corporations do — and we believe that’s a good thing. We can’t buy an F1 sponsorship or a Super Bowl ad, but we can sponsor a tech blogger to start their side hustle.
Doing a lot with little is our **think different**. It means we have to find original and better ways of doing things, not replicating how they have always been done. It’s this David-like approach that makes us succeed even in the Goliath-like challenges.
02
Be nice, do the right thing
---------------------------
Being nice to each other is a vital value of the company we all want to work at. There is no space for “brilliant jerks”. You have to be kind. Well-meant feedback is always delivered with respect.
We nurture a culture of quiet confidence and open humbleness. There is no space for selfishness on our team. We appreciate the privilege of working with each other and lift each other up.
We won’t compromise on what we believe in to cut corners. We’re in this for the long run and want to win right, even if that means taking the harder path. This applies to not just treating our people well but also to how we do business with everyone outside the company.
03
Don’t ask for permission
------------------------
We hire A players and let them make the decisions independently without asking for a permission first.
Our goal isn’t to micromanage. Our goal is to get out of your way and let you do your best work.
04
Reason from first principles
----------------------------
We don’t let the anecdotal evidence of how things have been done until now limit us in thinking what’s possible. We ask why. We question the requirements.
We get inspiration from others to learn from their mistakes, but we always prioritize the common sense over anecdotes. The only true limitations are the laws of physics.
05
Work at a fast-growing startup in a team of super-talented colleagues (Y Combinator alumni, ex-Google & ex-Shopify engineers, and… you?).
[Work hard, treat people well, and have fun.](https://www.youtube.com/watch?v=0cGi68ALLik)
### Our investors
 
2021
Founded
300,000+
Developers
$28.6M
Funding
Lachy Groom
Ex-Stripe
Rahul Mehta
Managing partner at DST Global
Aaron Levie
CEO Box
Madhu Muthukumar
CPO at Notion
Ryan Petersen
CEO at Flexport
Kulpreet Singh
ex-UiPath
Michael Stoppelman
Ex-VP at Yelp
Zach Sims
CEO at Codecademy
Emil Eifrem
Founder of Neo4j
Kevin Indig
Director of SEO at Shopify
Tim Soulo
CMO at Ahrefs
Jakub Jurovych
Founder of Deepnote
### Open roles
Remote
Remote (North America & Europe)
Hardcore mode
Work 1.5x the hours, earn 2x the compensation
/^Full-?stack Engineer$/i
$60K - $300K/year + equity $120K - $600K/year + equity · Remote Prague
Founding Product Engineer
$150K - $400K/year + equity $300K - $800K/year + equity · Remote Prague
Recruiter
$50K - $100K/year + equity $100K - $200K/year + equity · Remote Prague
Customer Engineer
$60K - $120K/year + equity $120K - $240K/year + equity · Remote Prague
Customer Advocate
$30K - $120K/year + equity $60K - $240K/year + equity · Remote Prague
/^Full-?stack Engineer$/i
$60K - $300K/year + equity $120K - $600K/year + equity · Remote Prague
Founding Product Engineer
$150K - $400K/year + equity $300K - $800K/year + equity · Remote Prague
Recruiter
$50K - $100K/year + equity $100K - $200K/year + equity · Remote Prague
Customer Engineer
$60K - $120K/year + equity $120K - $240K/year + equity · Remote Prague
Customer Advocate
$30K - $120K/year + equity $60K - $240K/year + equity · Remote Prague
### /^Full-?stack Engineer$/i
Hardcore
Remote (North America & Europe)
Prague
$60K - $300K/year + equity
$120K - $600K/year + equity
[Apply](https://betterstack.typeform.com/apply-engineer)
The challenge
Read about [how we think about software](https://betterstack.com/careers/engineering)
and [what it’s like to work here](https://betterstack.com/careers)
.
We’re designing a product by engineers, for engineers. Our CTO, CEO, and COO are all software builders who understand what it takes to craft elegant, efficient, and delightful products. And we’re continuously looking for more amazing engineers to help us create high-quality software with exceptional UX—end to end.
You’ll do more than write code. You’ll shape the [product user experience](https://juraj.blog/p/consistency)
, polish user interface, optimize backend performance, benchmark database queries, and ship secure, scalable software. **We’re looking for software engineers who, if given enough time, could build Better Stack on their own.** This role is not about filling a narrow niche but taking ownership and shipping impactful software that users love.
We believe the best software engineers are at [least 100x more productive](https://juraj.blog/p/100x-software-engineering)
than the average ones, as they can pragmatically switch between [different styles of engineering](https://juraj.blog/p/two-sides)
. We don’t think of [software engineers as a commodity](https://juraj.blog/p/we-are-hiring-42-engineers-this-year)
.
What you’ll do
* **Use AI to aggressively ship high-quality code.** We expect you to [be on top of the latest tools](https://x.com/jurajmasar/status/1962465031720731118)
, models and trends in AI-assisted software engineering. We think that using AI is no longer optional. We expect you to be amazing at prompting, to know when to leverage different models, and to have first-hand experience with Claude Code, Cursor, and opencode among others. At the same time, we expect you know when _not_ to use LLMs and instead debug or design an algorithm by hand. We’re not looking for vibe coders.
* You’ll implement, test, and deploy secure, fast, and scalable code in production—**independently** or with lightweight collaboration.
* Work directly with our CTO, CEO, and our designer to deliver end-to-end features, from backend to frontend, within a single day.
* Use our modern yet opinionated tech stack—Ruby on Rails, PostgreSQL, Redis, ClickHouse, Redpanda, JavaScript, Vue.js, Tailwind, Docker, and more.
* Keep our frontend fast and consider SEO & AEO.
* Ship software while maintaining security and performance across the stack—**understanding basic web security principles** without over-relying on frameworks.
* Collaborate asynchronously while avoiding unnecessary meetings.
We trust you to manage your time and ship.
This might be for you if
* **Software is your hobby.** You’ve written web scrapers for fun, built apps for personal use, or explored side projects to learn new tech.
* **You love shipping things end-to-end.** Styling buttons in the morning, adjusting the database schema at noon, and deploying to production in the afternoon? You’ll like it here.
* **You value speed and pragmatism.** You know how to prioritize and [cut the right 5% of a feature to simplify its implementation by 100x.](https://juraj.blog/p/100x-software-engineering)
* **You take security very seriously,** without blindly relying on modern frameworks.
* **You write fast software.** From optimizing SQL queries to reducing frontend reflows and choosing the right number of threads, you’re always looking for ways to keep applications fast.
* **You’re a generalist.** You don’t need to be an expert in every area of software engineering, but you’re comfortable wearing multiple hats and learning quickly.
* **You care about UI and UX.** Pixel-perfect designs and seamless user flows aren’t “just for designers.” [Refactoring UI](https://www.refactoringui.com/)
is/would be your go-to guide.
* **You prefer fewer meetings and more doing instead.** Team stand-ups? No thanks. Async tools and clear communication? Yes, please.
* It’s great if you’ve worked with our stack **but it’s definitely not a requirement.** We need you to be flexible about the tools you use. Great software engineers can pick up new stack fast. As far as you worked with some web technologies and at least some SQL databases, you’re just fine!
* **You agree that software engineers are the artists of our age.**
Read [Paul Graham](https://www.paulgraham.com/)
’s [Hackers and Painters](https://www.amazon.com/Hackers-Painters-Big-Ideas-Computer/dp/1449389554)
, one of our favorite books.
Who you’ll work with
* We consider our team to be a professional sports team. Everyone aims to be the best in the world in what they do. From YC alumni to ex-Google and ex-Shopify colleagues, you’ll be in great company.
* Our founders Juraj (CEO) and Veronika (COO), and Tomas (CTO) who remain hands-on and ship code.
* Our 1-man design team Juraj jr., and Simon, engineer turned technical product manager, who ensure that every feature you build looks and feels incredible and consistent with the rest of the product.
[Apply](https://betterstack.typeform.com/apply-engineer)
### Founding Product Engineer
Hardcore
Remote (North America & Europe)
Prague
$150K - $400K/year + equity
$300K - $800K/year + equity
[Apply](https://betterstack.typeform.com/apply-engineer)
The challenge
Please start by reading the description of the /^Full-?stack Engineer$/i role.
You need to be an **amazing full-stack engineer** before moving to the Founding Product Engineering role.
You can also read about [how we think about software](https://betterstack.com/careers/engineering)
and [what it’s like to work here](https://betterstack.com/careers)
.
What you’ll do
* You’ll essentially run a startup within a startup.
* You’re ready to work extremely hard. This is a senior role with high expectations.
* Given enough time, you’d be able to build Better Stack from scratch and take others with you along the way.
* You’re an extremely strong /^Full-?stack Engineer$/i.
* You can analyze business models and you’re the kind of person who constantly comes up with new product ideas.
* You’re able to validate your product idea with pre-product design interviews.
* You’re [great at user experience](https://sensible.com/dont-make-me-think/)
and copywriting.
* You can design and build a [simple, lovable, and complete product](https://longform.asmartbear.com/slc/)
.
* You understand the [difference between prototyping and production engineering](https://juraj.blog/p/two-sides)
.
* You’re not just a product manager or an engineering manager. During the first year of the product, you’ll be the most active code committer in the product’s Github repository. You’ll be leading your team by example from the front lines.
* You know that a product without distribution is useless, you read the [Coldstart problem](https://a16z.com/books/the-cold-start-problem/)
, and admire products with built-in virality.
* You’re a skilled engineering manager, both [a people manager](https://juraj.blog/p/giving-feedback)
, and [a strong technical leader](https://juraj.blog/p/100x-software-engineering)
.
* You love data and you watched [Alex Schultz’s lectures on growth](https://www.youtube.com/watch?v=n_yHZ_vKjno)
. You’re ready to watch the first 10,000 Fullstory session recordings of people using your product.
* You’re a decent sales person. You can hop on a podcast, give a lecture, and fly across the country for a product demo.
Why you should work with us
* Reading the above, you should be thinking: "if I can do all of those things, should I just start a startup myself?". Maybe you should! If that’s you, in fact you might be the perfect person for this job. Hear me out.
* Working with us, as opposed to starting your own startup, has multiple advantages:
* **You know you’ll get paid.** Most startups go to 0. With Better Stack you get no downside, yet an unlimited upside.
* **You’ll have way less stress.** You don’t have the balance sheet to worry about. You don’t need to calculate the runway till going bankrupt.
* Although you should be great at leading technical teams, **we’ll help you with the ugly side of managing people**. We’ll have your back.
* **You don’t have to deal with legal, operations, compliance or VCs.** You can fully focus on building great products. That’s a luxury most startup CEOs don’t have.
* **You’ll learn _a lot_.** You’ll work with the team who built Better Stack from the ground up. We’ve seen the story of building both successful and failed products many times. You’ll go faster with us.
* You can fully leverage Better Stack’s existing resources to make your product successful: our data processing infrastructure, consistent UI/UX language, the strong developer brand, and [our strong existing distribution](https://www.youtube.com/@betterstack)
.
* There’s close to 0 bureaucracy & politics at Better Stack. Your success will be fully in your hands.
* ...and you can always start your company afterwards!
[Apply](https://betterstack.typeform.com/apply-engineer)
### Recruiter
Hardcore
Remote (North America & Europe)
Prague
$50K - $100K/year + equity
$100K - $200K/year + equity
[Apply](https://betterstack.typeform.com/apply-non-tech)
The challenge
* Better Stack has an unusually high concentration of makers.
* Every manager is an individual contributor and there’s close to 0 bureaucracy and politics.
* If you like meetings and 'strategy sessions', probably look elsewhere.
* But if you like winning and feel great about getting stuff done, you might love it here!
* Help us find like-minded makers that want to build the future of software.
* The way we work is quite different to most places. In fact, [most people would probably not want to work with us](https://old.reddit.com/r/ruby/comments/1gq860d/new_level_of_interview_hell/)
, and we think that’s ok! Most people should not build early stage startups, in fact.
* When done right, however, [even candidates we reject enjoy the interview experience](https://share.cleanshot.com/t6HMFwjF)
and learn a lot.
* If you’re smart, open minded, driven and can think for yourself, read on!
What you’ll do
* **Scout for new talented colleagues,** coordinate the hiring process, extend offers, and be the candidate’s voice throughout the company.
* **Talk to many new people every week** (20+ intro chats per week) and create genuine connections.
* **Balance inbound vs outbound hiring,** learning to spot candidates even if they never applied or may not have direct prior experience.
* **Work directly with both of our co-founders, our CTO,** and more teammates on bringing the very best people on board on-site in Prague as well as remotely in Europe and the US.
* Be in charge of creating an **[11-star candidate experience](https://www.youtube.com/watch?v=ntvueIsgQwc)
.**
* **[Craft extraordinary employer branding](https://www.youtube.com/watch?v=12D8zEdOPYo)** and make the company an obvious interview choice for talented candidates.
* **A great startup culture needs to be founder-driven.** You’ll be the fail-safe to make sure nothing falls through the cracks.
This might be for you if
* You **enjoy pitching a candidate the mission,** culture, product, and our work style.
* Learn fast and can [discuss engineering topics with engineers](https://betterstack.com/careers/engineering#our-tech-stack)
.
* You consider yourself **full-stack,** managing all aspects of recruiting, from sourcing to conducting intro calls with candidates, coordinating all stages of the interview process, and helping to extend the offer or providing the candidate with valuable feedback.
* You don’t hesitate to do a lot of outbound and you’re not waiting for candidates to apply on their own.
* You enjoy delighting candidates throughout the process by being fast, transparent, energetic, and kind.
* You have a builder’s mindset. There’s plenty of things we’re doing already, but a lot more we could be doing in the future!
* You are curious. You enjoy checking the latest trends and never miss an opportunity to read a good book, listen to a podcast episode, or watch a talk on talent or startup-related topics and share that knowledge.
Who you’ll work with
* A team of smart and talented colleagues who are extraordinary at what they do and collaborate together to build an amazing product. Namely:
* [Juraj](https://www.linkedin.com/in/jurajmasar/)
& [Veronika](https://www.linkedin.com/in/veronikakolejak/)
, both our co-founders, are hands-on and close to hiring every new colleague who joins the team. They’re the kind of founders who not only say the company is only as good as the people within the company; they act on it and are always ready to help bring more talented teammates on board. Both of them still interview all the candidates too, of course.
* [Tomas](https://www.linkedin.com/in/tom%C3%A1%C5%A1-hromada-8568344a/)
, our CTO, engaged in sourcing, interviewing, extending offers, and onboarding.
* [Magdalena](https://www.linkedin.com/in/magdalenahavlickova/)
has lived and traveled all over the world, which helps her connect with candidates and shape how Better Stack is seen from the outside. She takes care of growth, marketing, and technical recruiting, always juggling multiple hats with a focus on operational excellence. She is also a supporter of the [Ruby community.](https://www.linkedin.com/posts/magdalenahavlickova_grateful-for-the-chance-to-share-lessons-activity-7344846153022074880-4Dbm?utm_source=share)
* [Anna](https://www.linkedin.com/in/anna-rojkova/)
, our head of operations, who previously ran a space company developing software for satellites and probes.
Where to go next?
* Read about [what it’s like to work here](https://betterstack.com/careers)
– feel the atmosphere, understand the culture.
* Read more about how we [think about software engineering](https://betterstack.com/careers/engineering)
. It’s quite different from other companies! (Most of the principles we describe there apply to other parts of the company as well.)
[Apply](https://betterstack.typeform.com/apply-non-tech)
### Customer Engineer
Hardcore
Remote (North America & Europe)
Prague
$60K - $120K/year + equity
$120K - $240K/year + equity
[Apply](https://betterstack.typeform.com/apply-engineer)
The challenge
* Customers at the core of everything we do here and we strive to deliver an [11-star experience](https://coda.io/@reidhoffman/rituals-of-great-boards/11-star-experience-6)
to each and every one of them.
What you’ll do
* **Be the engineering guide for CTOs implementing Better Stack.** Work with engineers from companies around the world to implement the best in class observability.
* **Solve customer’s engineering challenges.** Identify issues, design and analyze the best solutions, or hop on a call to discuss your recommendations with your customers.
* **Dive into our code, monitoring dashboards, Vector configs** and get creative with solutions for any kind of stack our customers use.
* **Empower our customers** and help them implement the best practices for logging and incident management.
* **Shape the user experience** of our products. By talking with our customers daily, you’ll know what matters to them the most. Help make our tools the vehicle through which the engineering magic happens.
* **Bring your unique perspective** on how to solve any challenges that our customers may come across.
This might be for you if
* **You have an engineering background** and like our approach to [engineering](https://betterstack.com/careers/engineering)
culture.
* You are passionate about **driving change from the start to the finish line.** It will be up to you to talk with our customers, draft out the solutions, and solve their technical challenges.
* You are an **excellent and effective communicator with native-level English skills.** Both written and spoken form.
* **You are independent, resourceful, and not afraid to roll up your sleeves.**
* **You want to help us [build love brand](https://www.youtube.com/@betterstack)
.**
Who you’ll work with
* A team of smart and talented colleagues who are extraordinary at what they do and collaborate together to build an amazing product. Namely:
* [Veronika](https://linkedin.com/in/veronikakolejak/)
, our co-founder & COO, who was previously at Google and Shopify.
* [Simon](https://www.linkedin.com/in/simon-let/)
, our amazing engineer turned technical product manager.
* [Tomas](https://www.linkedin.com/in/tomas-hromada/)
, our CTO, hands on engineering wizard who still ships code daily.
Where to go next?
* [What it’s like to work here](https://betterstack.com/careers)
– feel the atmosphere, understand the culture.
* [How we think about software engineering](https://betterstack.com/careers/engineering)
(most of the principles we describe there apply to other parts of the company as well 😉).
[Apply](https://betterstack.typeform.com/apply-engineer)
### Customer Advocate
Hardcore
Remote (North America & Europe)
Prague
$30K - $120K/year + equity
$60K - $240K/year + equity
[Apply](https://betterstack.typeform.com/apply-non-tech)
The challenge
* Customers at the core of everything we do here and we strive to deliver an [11-star experience](https://coda.io/@reidhoffman/rituals-of-great-boards/11-star-experience-6)
to each and every one of them.
What you’ll do
* **Own your portfolio of client companies.** Educating their teams on new best practices, upselling them on new features, and helping them jump through the hoops of procurement departments. Think of it as being a consultant but [owning your work in the long-term](https://www.youtube.com/watch?v=-c4CNB80SRc&ab_channel=Malonus)
.
* **Build business relationships.** Be it a CTO, engineering team lead, or an indie hacker. We give everyone the [11-star experience](https://coda.io/@reidhoffman/rituals-of-great-boards/11-star-experience-6)
approach in everything we do.
* **Solve customer’s problems.** Identify issues, design and analyze the best solutions, or even hop on a call to discuss your recommendations with your customers.
* **Bring your unique perspective** on how to solve any challenges that our customers may come across.
This might be for you if
* You want to be a part of **a high-growth environment** and **engage in a client-facing consultant & advocacy role.**
* **You are passionate about learning and dive head straight into any challenge.** It will be up to you to discuss the technical challenges, organizational goals of our customers and be **responsible for driving the solutions from the start to the finish line.**
* You are an **excellent and effective communicator with native-level English skills.** Both written and spoken form.
* **You are independent, resourceful, and not afraid to roll up your sleeves.**
* **You want to help us [build love brand](https://www.youtube.com/@betterstack)
.**
Who you’ll work with
* A team of smart and talented colleagues who are extraordinary at what they do and collaborate together to build an amazing product. Namely:
* [Veronika](https://linkedin.com/in/veronikakolejak/)
, our co-founder & COO, who was previously at Google and Shopify.
* [Filip](https://www.linkedin.com/in/filipminhhoang/)
, our technical magician, who can help setup anything from config for an indie hacker to the migration of a 300-strong team.
* Our amazing engineers, whose wizard-level skills can solve any technical problem and are always willing to help, as well as our customer success and sales teams.
Where to go next?
* [What it’s like to work here](https://betterstack.com/careers)
– feel the atmosphere, understand the culture.
* Read about [How we think about software engineering](https://betterstack.com/careers/engineering)
.
[Apply](https://betterstack.typeform.com/apply-non-tech)
### Please accept cookies
We use cookies to authenticate users, improve the product user experience, and for [personalized ads](https://business.safety.google/privacy/)
. [Learn more.](https://betterstack.com/privacy)
Deny Accept required Accept all
---
# Tracing dashboard template | Better Stack
[Back to dashboards](https://betterstack.com/dashboards)
Tracing
=======
Monitor performance of your services based on OpenTelemetry traces.
[Add dashboard](https://telemetry.betterstack.com/team/0/dashboards#template-95575)
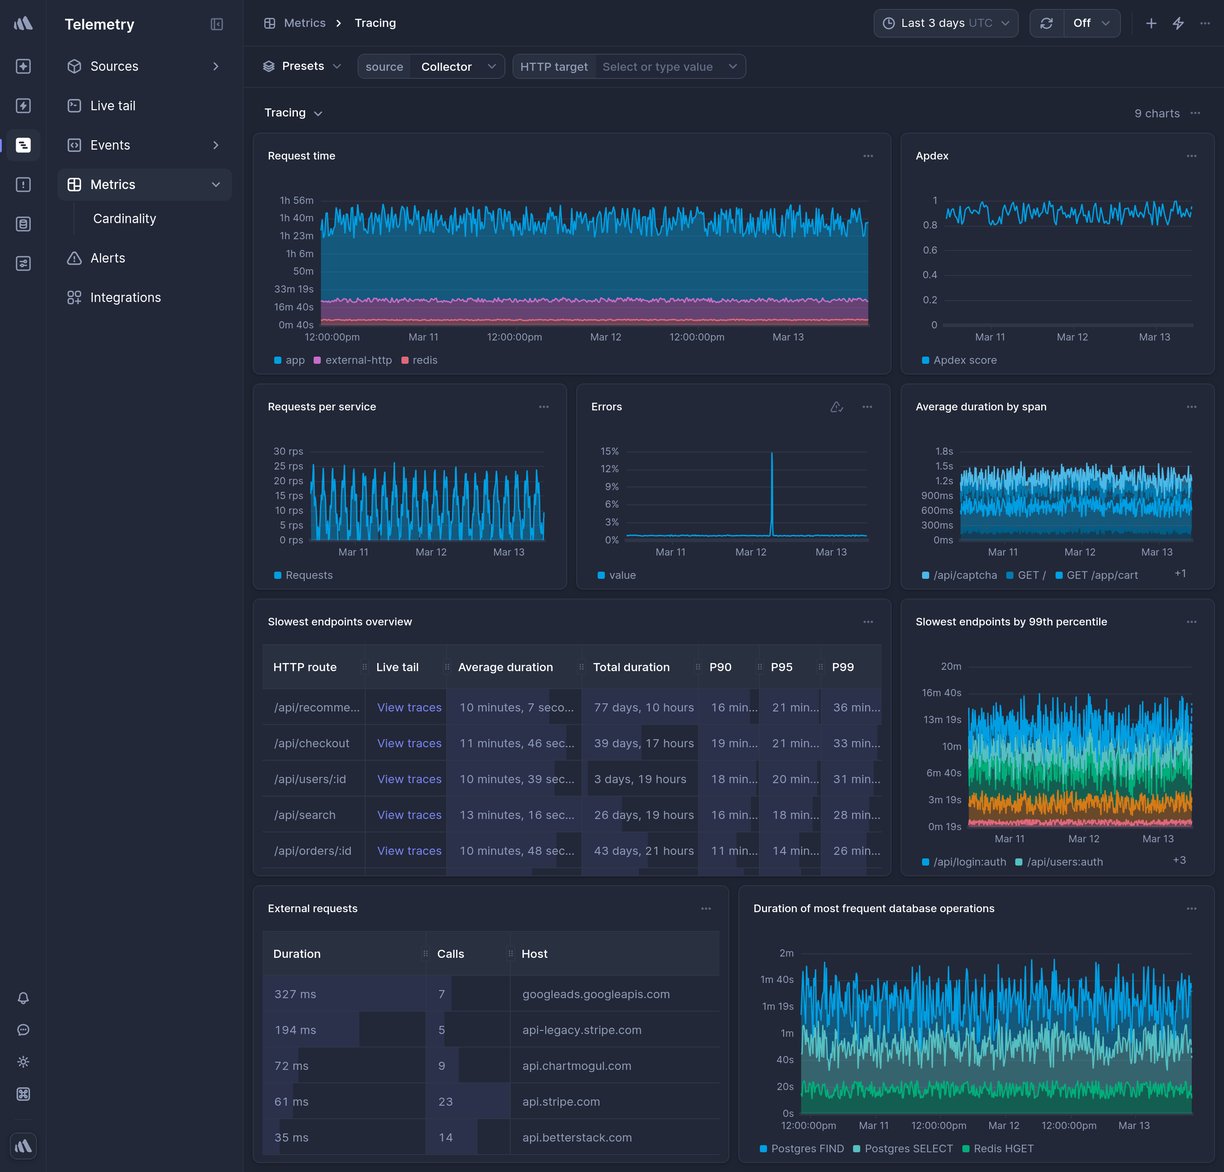
Data source
OpenTelemetry
* * *

Overview
--------
This is a ready-made Tracing Telemetry dashboard in Better Stack.
To get it, [sign up](https://betterstack.com/users/sign-up)
for Better Stack, [connect your log or metrics source](https://betterstack.com/docs/logs/logging-start/)
, and select one of the beautiful [pre-built dashboards](https://betterstack.com/dashboards)
you want to get.
### What charts are included
* Web transaction time
* Apdex scoreExternal requests
* Errors
* And much more, explore on your own to see all the chart options.

### How to create a custom chart
Need a custom chart? You can create one by writing a regular SQL query.
Here is how to do it:
1. **Pick a chart type:** the most popular options include a line chart, bar chart, pie chart, a single number, and a live tail (a stream of the newest logs).
2. **Pick a source and timeframe:** we use [variables](https://betterstack.com/docs/logs/dashboards/variables/)
in the SQL queries, which makes it easy to edit and work with any query. The main variables are `source` and `timeframe`. Once you set those, as in the example above, you can use the timeframe switcher easily, and the dashboard will update automatically.
3. **Write your SQL query:** there is no need to use any specific querying language. Just write SQL like you’re used to.
**Learn more:** [How to build SQL queries in Better Stack](https://betterstack.com/docs/logs/dashboards/sql-queries/)

### How to create an alert for a metric
You can get easily alerted on irregularities before they become incidents.
Everything is fully integrated into dashboards, there is no need to set up complex workflows.
Here are the most popular alert types:
* **Threshold Alerts:** Perfect for scenarios where you need to be notified when a metric crosses a certain predefined threshold. For instance, if your application's response time exceeds a set limit, you’ll get an alert.
* **Relative Alerts:** Want to monitor changes in metrics relative to their historical data? Whether it's an unexpected drop in sales, a surge in new user signups, or any other relative metric anomaly, we've got you covered.
* **Anomaly detection:** Use this alerting method if you're unsure about what threshold to set. It will notify you about any significant deviation from the predicted value of the series. Think of this method as covering what you didn’t even know can occur.
**Learn more:** [How to use alerts in Better Stack](https://betterstack.com/docs/logs/dashboards/alerts/)

### How to receive notification about issues
Once you set up what metric irregularities you want to get alerted to, you can select a broad spectrum of notification options.
The most popular include Slack, Microsoft Teams, Phone calls, SMS, emails, webhooks, and more.
The best part is that notifications within Better Stack are unlimited. This way, you don’t have to worry about being charged extra in case of significant incidents.
**Learn more:** [How to use escalation policies in Better Stack](https://betterstack.com/docs/uptime/escalation-policies/)
### How to set up your Tracing dashboard
Once you’ve signed up for [Better Stack](https://betterstack.com/logs)
, you can collect logs and metrics from Tracing in just 2 minutes. Here is the official [documentation](https://betterstack.com/docs/logs/open-telemetry/)
on how to do it.
Are you already using another log forwarder that you’re used to? See the documentation for [Fluent Bit](https://betterstack.com/docs/logs/fluent-bit/)
, [Logstash](https://betterstack.com/docs/logs/logstash/)
, [Fluentd](https://betterstack.com/docs/logs/fluentd/)
, [Filebeat](https://betterstack.com/docs/logs/filebeat/)
, [Syslog](https://betterstack.com/docs/logs/syslog-setup/)
, and [others](https://betterstack.com/docs/logs/start/)
.
### Have any questions?
Please feel free to message us at [hello@betterstack.com](mailto:hello@betterstack.com?subject=Question%20about%20Better%20Stack&body=)
.
We'll get back to you as soon as we can, typically within a few hours. 🙏 Thank you!
* * *
#### You might also like
[\
\
### AWS S3\
\
Scalable object storage for data of any size.](https://betterstack.com/dashboards/aws-s3)
[\
\
### GCP Cloud Run\
\
Fully managed serverless container platform on Google Cloud.](https://betterstack.com/dashboards/gcp-cloud-run)

### Please accept cookies
We use cookies to authenticate users, improve the product user experience, and for [personalized ads](https://business.safety.google/privacy/)
. [Learn more.](https://betterstack.com/privacy)
Deny Accept required Accept all
---
# Docker dashboard template | Better Stack
[Back to dashboards](https://betterstack.com/dashboards)
Docker
======
Platform for containerized applications.
[Add dashboard](https://telemetry.betterstack.com/team/0/dashboards#template-94552)
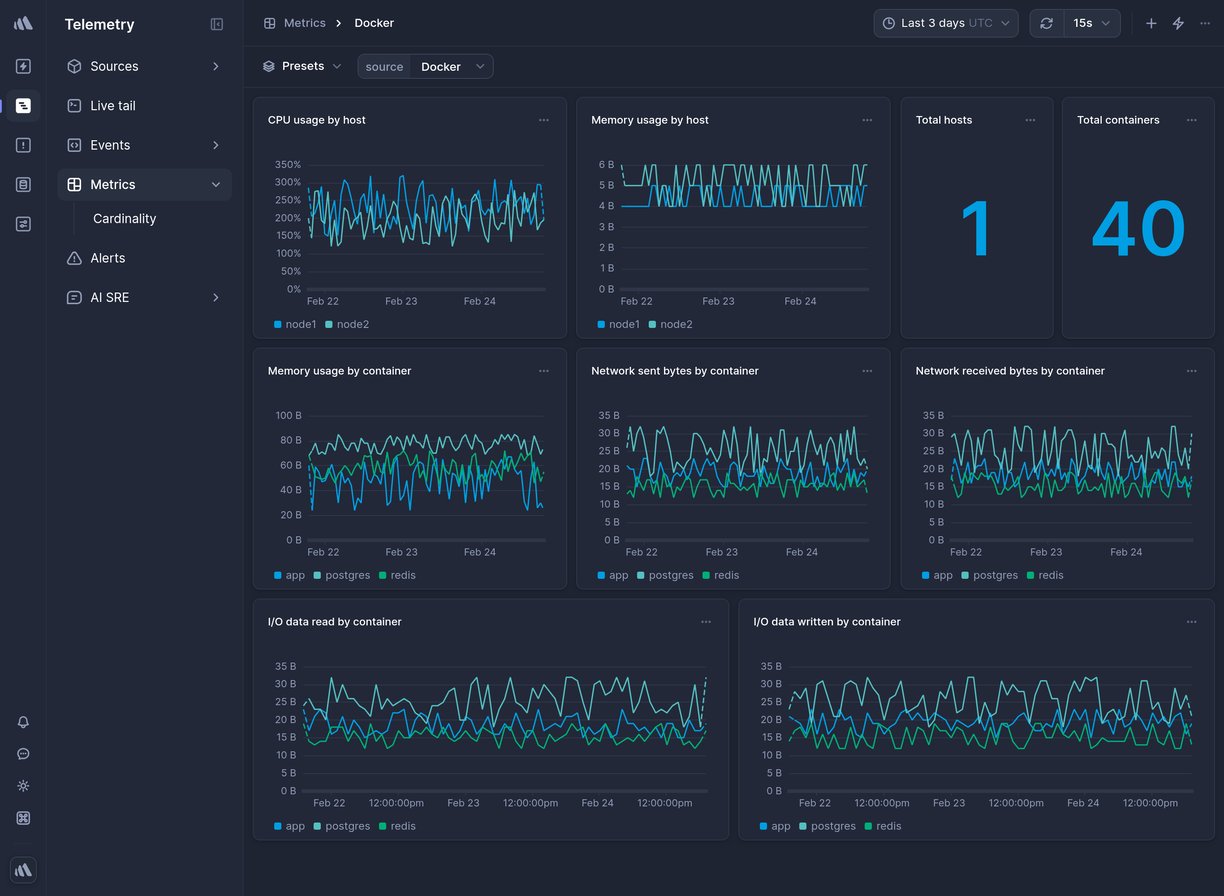
Data source
Docker
* * *

Overview
--------
This is a ready-made Docker Telemetry dashboard in Better Stack.
To get it, [sign up](https://betterstack.com/users/sign-up)
for Better Stack, [connect your log or metrics source](https://betterstack.com/docs/logs/logging-start/)
, and select one of the beautiful [pre-built dashboards](https://betterstack.com/dashboards)
you want to get.
### What charts are included
* CPU percentage by host
* Total hosts
* Total containers
* Memory used by host
* Memory percentage by container
* I/O data read by container
* I/O data written by container
* Network received bytes by container
* Network sent bytes by container
* And much more, explore on your own to see all the chart options.

### How to create a custom chart
Need a custom chart? You can create one by writing a regular SQL query.
Here is how to do it:
1. **Pick a chart type:** the most popular options include a line chart, bar chart, pie chart, a single number, and a live tail (a stream of the newest logs).
2. **Pick a source and timeframe:** we use [variables](https://betterstack.com/docs/logs/dashboards/variables/)
in the SQL queries, which makes it easy to edit and work with any query. The main variables are `source` and `timeframe`. Once you set those, as in the example above, you can use the timeframe switcher easily, and the dashboard will update automatically.
3. **Write your SQL query:** there is no need to use any specific querying language. Just write SQL like you’re used to.
**Learn more:** [How to build SQL queries in Better Stack](https://betterstack.com/docs/logs/dashboards/sql-queries/)

### How to create an alert for a metric
You can get easily alerted on irregularities before they become incidents.
Everything is fully integrated into dashboards, there is no need to set up complex workflows.
Here are the most popular alert types:
* **Threshold Alerts:** Perfect for scenarios where you need to be notified when a metric crosses a certain predefined threshold. For instance, if your application's response time exceeds a set limit, you’ll get an alert.
* **Relative Alerts:** Want to monitor changes in metrics relative to their historical data? Whether it's an unexpected drop in sales, a surge in new user signups, or any other relative metric anomaly, we've got you covered.
* **Anomaly detection:** Use this alerting method if you're unsure about what threshold to set. It will notify you about any significant deviation from the predicted value of the series. Think of this method as covering what you didn’t even know can occur.
**Learn more:** [How to use alerts in Better Stack](https://betterstack.com/docs/logs/dashboards/alerts/)

### How to receive notification about issues
Once you set up what metric irregularities you want to get alerted to, you can select a broad spectrum of notification options.
The most popular include Slack, Microsoft Teams, Phone calls, SMS, emails, webhooks, and more.
The best part is that notifications within Better Stack are unlimited. This way, you don’t have to worry about being charged extra in case of significant incidents.
**Learn more:** [How to use escalation policies in Better Stack](https://betterstack.com/docs/uptime/escalation-policies/)
### How to set up your Docker dashboard
Once you’ve signed up for [Better Stack](https://betterstack.com/logs)
, you can collect logs and metrics from Docker in just 2 minutes. Here is the official [documentation](https://betterstack.com/docs/logs/docker/)
on how to do it.
Are you already using another log forwarder that you’re used to? See the documentation for [Fluent Bit](https://betterstack.com/docs/logs/fluent-bit/)
, [Logstash](https://betterstack.com/docs/logs/logstash/)
, [Fluentd](https://betterstack.com/docs/logs/fluentd/)
, [Filebeat](https://betterstack.com/docs/logs/filebeat/)
, [Syslog](https://betterstack.com/docs/logs/syslog-setup/)
, and [others](https://betterstack.com/docs/logs/start/)
.
### Have any questions?
Please feel free to message us at [hello@betterstack.com](mailto:hello@betterstack.com?subject=Question%20about%20Better%20Stack&body=)
.
We'll get back to you as soon as we can, typically within a few hours. 🙏 Thank you!
* * *
#### You might also like
[\
\
### AWS RDS Aurora PostgreSQL\
\
High-performance PostgreSQL-compatible database with Aurora engine.](https://betterstack.com/dashboards/aws-rds-aurora-postgresql)
[\
\
### HAProxy\
\
Load balancer for TCP and HTTP.](https://betterstack.com/dashboards/haproxy)

### Please accept cookies
We use cookies to authenticate users, improve the product user experience, and for [personalized ads](https://business.safety.google/privacy/)
. [Learn more.](https://betterstack.com/privacy)
Deny Accept required Accept all
---
# OpenTelemetry collector dashboard template | Better Stack
[Back to dashboards](https://betterstack.com/dashboards)
OpenTelemetry collector
=======================
Monitor operations of OpenTelemetry collector.
[Add dashboard](https://telemetry.betterstack.com/team/0/dashboards#template-94558)
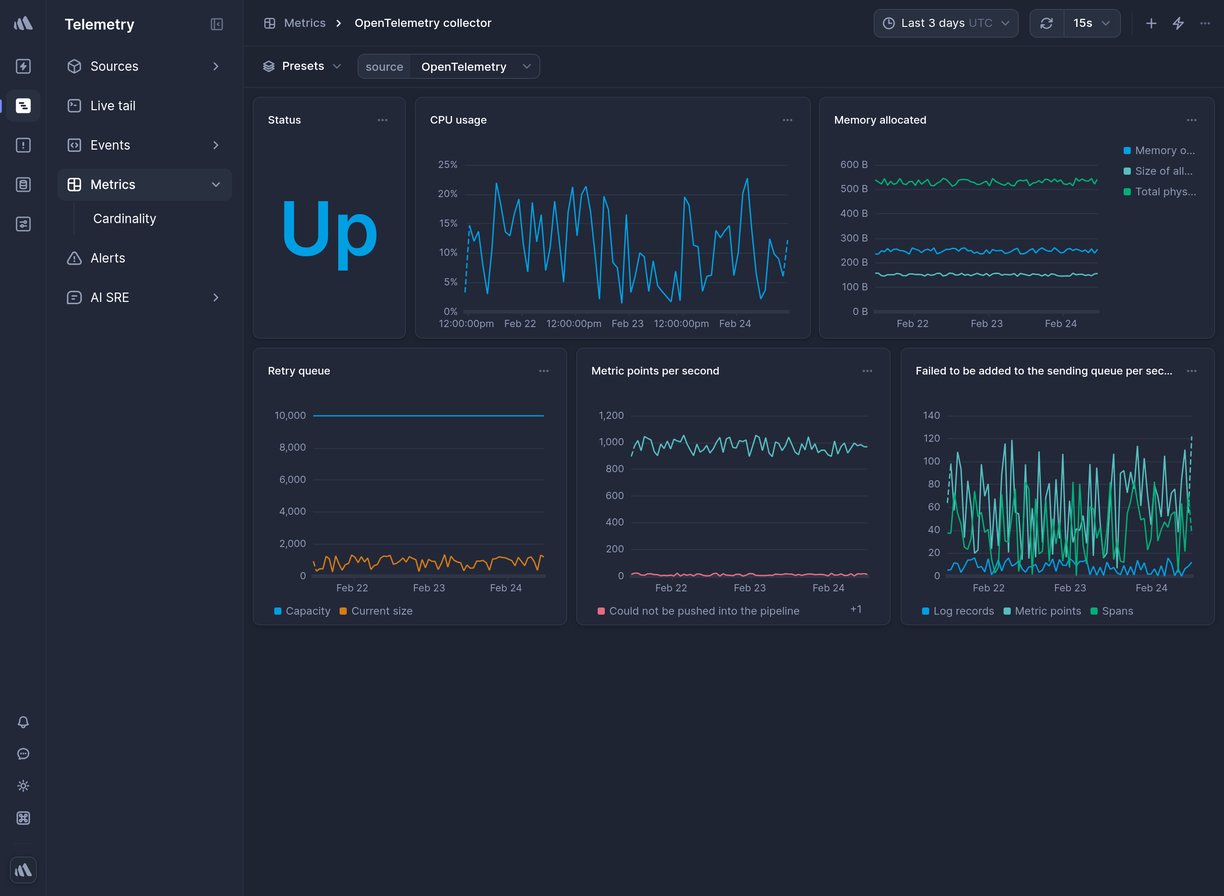
Data source
OpenTelemetry
* * *

Overview
--------
This is a ready-made OpenTelemetry collector Telemetry dashboard in Better Stack.
To get it, [sign up](https://betterstack.com/users/sign-up)
for Better Stack, [connect your log or metrics source](https://betterstack.com/docs/logs/logging-start/)
, and select one of the beautiful [pre-built dashboards](https://betterstack.com/dashboards)
you want to get.
### What charts are included
* Metric points per second
* CPU usage
* Uptime status
* Memory allocated
* Retry queue
* And much more, explore on your own to see all the chart options.

### How to create a custom chart
Need a custom chart? You can create one by writing a regular SQL query.
Here is how to do it:
1. **Pick a chart type:** the most popular options include a line chart, bar chart, pie chart, a single number, and a live tail (a stream of the newest logs).
2. **Pick a source and timeframe:** we use [variables](https://betterstack.com/docs/logs/dashboards/variables/)
in the SQL queries, which makes it easy to edit and work with any query. The main variables are `source` and `timeframe`. Once you set those, as in the example above, you can use the timeframe switcher easily, and the dashboard will update automatically.
3. **Write your SQL query:** there is no need to use any specific querying language. Just write SQL like you’re used to.
**Learn more:** [How to build SQL queries in Better Stack](https://betterstack.com/docs/logs/dashboards/sql-queries/)

### How to create an alert for a metric
You can get easily alerted on irregularities before they become incidents.
Everything is fully integrated into dashboards, there is no need to set up complex workflows.
Here are the most popular alert types:
* **Threshold Alerts:** Perfect for scenarios where you need to be notified when a metric crosses a certain predefined threshold. For instance, if your application's response time exceeds a set limit, you’ll get an alert.
* **Relative Alerts:** Want to monitor changes in metrics relative to their historical data? Whether it's an unexpected drop in sales, a surge in new user signups, or any other relative metric anomaly, we've got you covered.
* **Anomaly detection:** Use this alerting method if you're unsure about what threshold to set. It will notify you about any significant deviation from the predicted value of the series. Think of this method as covering what you didn’t even know can occur.
**Learn more:** [How to use alerts in Better Stack](https://betterstack.com/docs/logs/dashboards/alerts/)

### How to receive notification about issues
Once you set up what metric irregularities you want to get alerted to, you can select a broad spectrum of notification options.
The most popular include Slack, Microsoft Teams, Phone calls, SMS, emails, webhooks, and more.
The best part is that notifications within Better Stack are unlimited. This way, you don’t have to worry about being charged extra in case of significant incidents.
**Learn more:** [How to use escalation policies in Better Stack](https://betterstack.com/docs/uptime/escalation-policies/)
### How to set up your OpenTelemetry collector dashboard
Once you’ve signed up for [Better Stack](https://betterstack.com/logs)
, you can collect logs and metrics from OpenTelemetry collector in just 2 minutes. Here is the official [documentation](https://betterstack.com/docs/logs/open-telemetry/)
on how to do it.
Are you already using another log forwarder that you’re used to? See the documentation for [Fluent Bit](https://betterstack.com/docs/logs/fluent-bit/)
, [Logstash](https://betterstack.com/docs/logs/logstash/)
, [Fluentd](https://betterstack.com/docs/logs/fluentd/)
, [Filebeat](https://betterstack.com/docs/logs/filebeat/)
, [Syslog](https://betterstack.com/docs/logs/syslog-setup/)
, and [others](https://betterstack.com/docs/logs/start/)
.
### Have any questions?
Please feel free to message us at [hello@betterstack.com](mailto:hello@betterstack.com?subject=Question%20about%20Better%20Stack&body=)
.
We'll get back to you as soon as we can, typically within a few hours. 🙏 Thank you!
* * *
#### You might also like
[\
\
### AWS DynamoDB\
\
Fully managed NoSQL key-value and document database.](https://betterstack.com/dashboards/aws-dynamodb)
[\
\
### AWS S3\
\
Scalable object storage for data of any size.](https://betterstack.com/dashboards/aws-s3)

### Please accept cookies
We use cookies to authenticate users, improve the product user experience, and for [personalized ads](https://business.safety.google/privacy/)
. [Learn more.](https://betterstack.com/privacy)
Deny Accept required Accept all
---
# Kubernetes dashboard template | Better Stack
[Back to dashboards](https://betterstack.com/dashboards)
Kubernetes
==========
Container orchestration platform.
[Add dashboard](https://telemetry.betterstack.com/team/0/dashboards#template-94557)
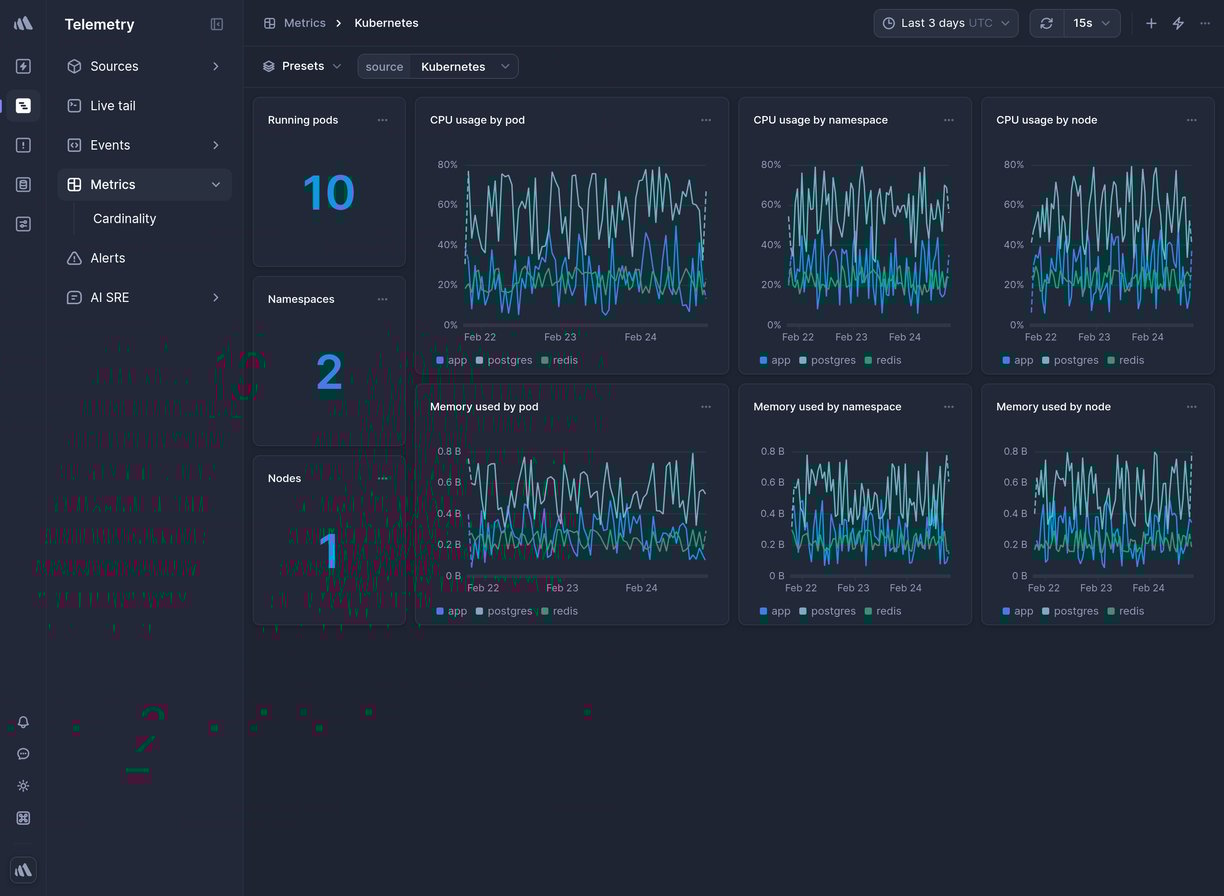
Data source
Kubernetes
* * *

Overview
--------
This is a ready-made Kubernetes Telemetry dashboard in Better Stack.
To get it, [sign up](https://betterstack.com/users/sign-up)
for Better Stack, [connect your log or metrics source](https://betterstack.com/docs/logs/logging-start/)
, and select one of the beautiful [pre-built dashboards](https://betterstack.com/dashboards)
you want to get.
### What charts are included
* Running pods
* Namespaces
* Nodes
* CPU cores by pod
* CPU cores by namespace
* CPU cores by node
* Memory used by node
* And much more, explore on your own to see all the chart options.

### How to create a custom chart
Need a custom chart? You can create one by writing a regular SQL query.
Here is how to do it:
1. **Pick a chart type:** the most popular options include a line chart, bar chart, pie chart, a single number, and a live tail (a stream of the newest logs).
2. **Pick a source and timeframe:** we use [variables](https://betterstack.com/docs/logs/dashboards/variables/)
in the SQL queries, which makes it easy to edit and work with any query. The main variables are `source` and `timeframe`. Once you set those, as in the example above, you can use the timeframe switcher easily, and the dashboard will update automatically.
3. **Write your SQL query:** there is no need to use any specific querying language. Just write SQL like you’re used to.
**Learn more:** [How to build SQL queries in Better Stack](https://betterstack.com/docs/logs/dashboards/sql-queries/)

### How to create an alert for a metric
You can get easily alerted on irregularities before they become incidents.
Everything is fully integrated into dashboards, there is no need to set up complex workflows.
Here are the most popular alert types:
* **Threshold Alerts:** Perfect for scenarios where you need to be notified when a metric crosses a certain predefined threshold. For instance, if your application's response time exceeds a set limit, you’ll get an alert.
* **Relative Alerts:** Want to monitor changes in metrics relative to their historical data? Whether it's an unexpected drop in sales, a surge in new user signups, or any other relative metric anomaly, we've got you covered.
* **Anomaly detection:** Use this alerting method if you're unsure about what threshold to set. It will notify you about any significant deviation from the predicted value of the series. Think of this method as covering what you didn’t even know can occur.
**Learn more:** [How to use alerts in Better Stack](https://betterstack.com/docs/logs/dashboards/alerts/)

### How to receive notification about issues
Once you set up what metric irregularities you want to get alerted to, you can select a broad spectrum of notification options.
The most popular include Slack, Microsoft Teams, Phone calls, SMS, emails, webhooks, and more.
The best part is that notifications within Better Stack are unlimited. This way, you don’t have to worry about being charged extra in case of significant incidents.
**Learn more:** [How to use escalation policies in Better Stack](https://betterstack.com/docs/uptime/escalation-policies/)
### How to set up your Kubernetes dashboard
Once you’ve signed up for [Better Stack](https://betterstack.com/logs)
, you can collect logs and metrics from Kubernetes in just 2 minutes. Here is the official [documentation](https://betterstack.com/docs/logs/kubernetes/)
on how to do it.
Are you already using another log forwarder that you’re used to? See the documentation for [Fluent Bit](https://betterstack.com/docs/logs/fluent-bit/)
, [Logstash](https://betterstack.com/docs/logs/logstash/)
, [Fluentd](https://betterstack.com/docs/logs/fluentd/)
, [Filebeat](https://betterstack.com/docs/logs/filebeat/)
, [Syslog](https://betterstack.com/docs/logs/syslog-setup/)
, and [others](https://betterstack.com/docs/logs/start/)
.
### Have any questions?
Please feel free to message us at [hello@betterstack.com](mailto:hello@betterstack.com?subject=Question%20about%20Better%20Stack&body=)
.
We'll get back to you as soon as we can, typically within a few hours. 🙏 Thank you!
* * *
#### You might also like
[\
\
### RabbitMQ\
\
Open-source message broker for complex message routing between systems.](https://betterstack.com/dashboards/rabbitmq)
[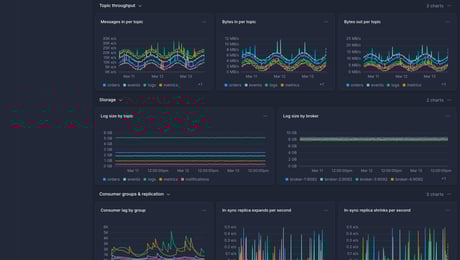\
\
### Kafka\
\
Monitor Apache Kafka message broker performance and throughput.](https://betterstack.com/dashboards/kafka)

### Please accept cookies
We use cookies to authenticate users, improve the product user experience, and for [personalized ads](https://business.safety.google/privacy/)
. [Learn more.](https://betterstack.com/privacy)
Deny Accept required Accept all
---
# Heroku dashboard template | Better Stack
[Back to dashboards](https://betterstack.com/dashboards)
Heroku
======
Cloud PaaS for easy app deployment.
[Add dashboard](https://telemetry.betterstack.com/team/0/dashboards#template-94553)
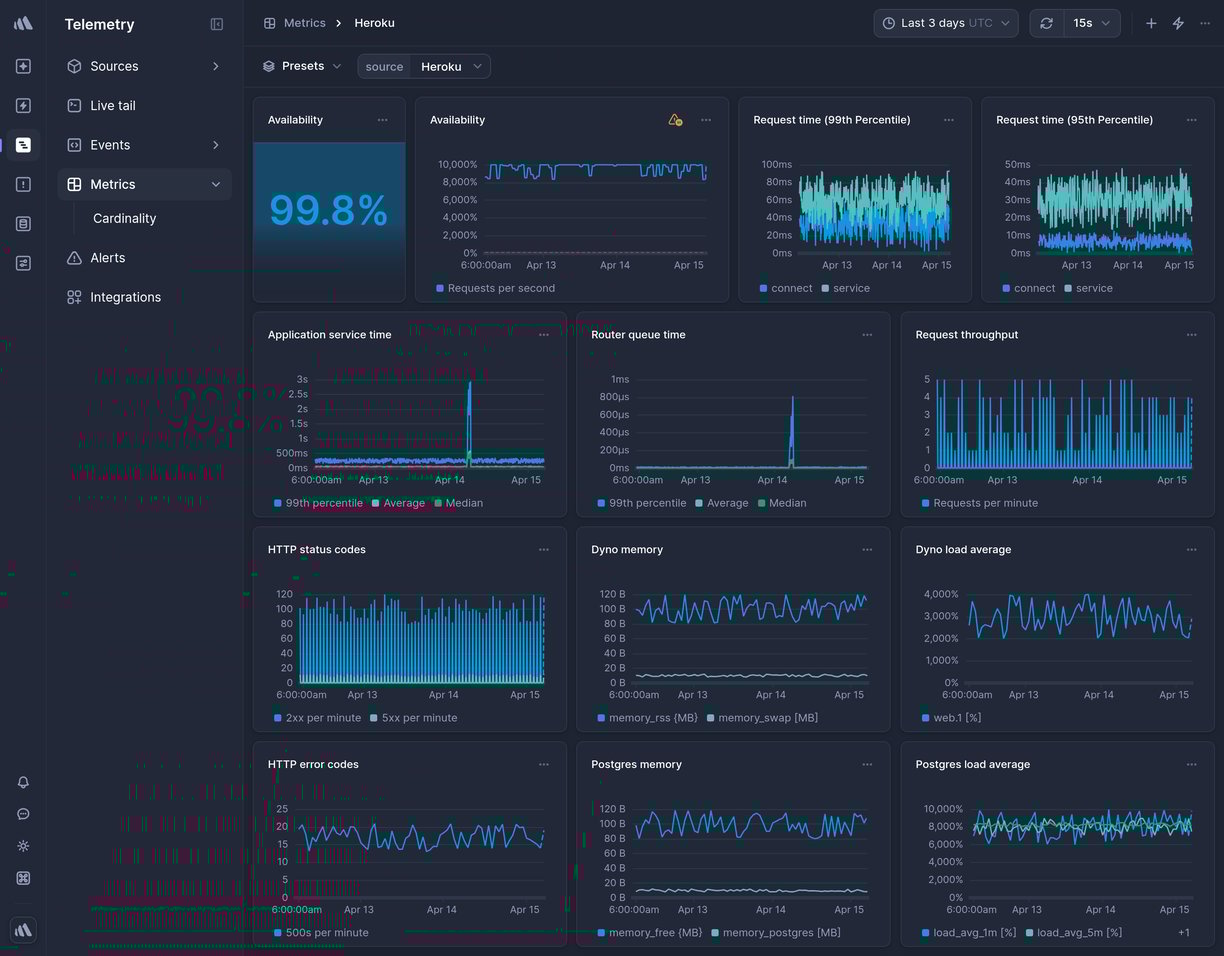
Data source
Heroku
Heroku (Add-on)
* * *

Overview
--------
This is a ready-made Heroku Telemetry dashboard in Better Stack.
To get it, [sign up](https://betterstack.com/users/sign-up)
for Better Stack, [connect your log or metrics source](https://betterstack.com/docs/logs/logging-start/)
, and select one of the beautiful [pre-built dashboards](https://betterstack.com/dashboards)
you want to get.
### What charts are included
* Availability
* Request time (95th percentile)
* Request time (99th percentile)
* Application service time
* Router queue time
* Request throughput
* HTTP status codes
* Dyno memory
* And much more, explore on your own to see all the chart options.

### How to create a custom chart
Need a custom chart? You can create one by writing a regular SQL query.
Here is how to do it:
1. **Pick a chart type:** the most popular options include a line chart, bar chart, pie chart, a single number, and a live tail (a stream of the newest logs).
2. **Pick a source and timeframe:** we use [variables](https://betterstack.com/docs/logs/dashboards/variables/)
in the SQL queries, which makes it easy to edit and work with any query. The main variables are `source` and `timeframe`. Once you set those, as in the example above, you can use the timeframe switcher easily, and the dashboard will update automatically.
3. **Write your SQL query:** there is no need to use any specific querying language. Just write SQL like you’re used to.
**Learn more:** [How to build SQL queries in Better Stack](https://betterstack.com/docs/logs/dashboards/sql-queries/)

### How to create an alert for a metric
You can get easily alerted on irregularities before they become incidents.
Everything is fully integrated into dashboards, there is no need to set up complex workflows.
Here are the most popular alert types:
* **Threshold Alerts:** Perfect for scenarios where you need to be notified when a metric crosses a certain predefined threshold. For instance, if your application's response time exceeds a set limit, you’ll get an alert.
* **Relative Alerts:** Want to monitor changes in metrics relative to their historical data? Whether it's an unexpected drop in sales, a surge in new user signups, or any other relative metric anomaly, we've got you covered.
* **Anomaly detection:** Use this alerting method if you're unsure about what threshold to set. It will notify you about any significant deviation from the predicted value of the series. Think of this method as covering what you didn’t even know can occur.
**Learn more:** [How to use alerts in Better Stack](https://betterstack.com/docs/logs/dashboards/alerts/)

### How to receive notification about issues
Once you set up what metric irregularities you want to get alerted to, you can select a broad spectrum of notification options.
The most popular include Slack, Microsoft Teams, Phone calls, SMS, emails, webhooks, and more.
The best part is that notifications within Better Stack are unlimited. This way, you don’t have to worry about being charged extra in case of significant incidents.
**Learn more:** [How to use escalation policies in Better Stack](https://betterstack.com/docs/uptime/escalation-policies/)
### How to set up your Heroku dashboard
Once you’ve signed up for [Better Stack](https://betterstack.com/logs)
, you can collect logs and metrics from Heroku in just 2 minutes. Here is the official [documentation](https://betterstack.com/docs/logs/heroku/)
on how to do it.
Are you already using another log forwarder that you’re used to? See the documentation for [Fluent Bit](https://betterstack.com/docs/logs/fluent-bit/)
, [Logstash](https://betterstack.com/docs/logs/logstash/)
, [Fluentd](https://betterstack.com/docs/logs/fluentd/)
, [Filebeat](https://betterstack.com/docs/logs/filebeat/)
, [Syslog](https://betterstack.com/docs/logs/syslog-setup/)
, and [others](https://betterstack.com/docs/logs/start/)
.
### Have any questions?
Please feel free to message us at [hello@betterstack.com](mailto:hello@betterstack.com?subject=Question%20about%20Better%20Stack&body=)
.
We'll get back to you as soon as we can, typically within a few hours. 🙏 Thank you!
* * *
#### You might also like
[\
\
### Redis\
\
Open-source in-memory key-value database and cache with durability.](https://betterstack.com/dashboards/redis)
[\
\
### Host overview\
\
Monitor your server infrastructure with comprehensive host metrics.](https://betterstack.com/dashboards/host-overview)

### Please accept cookies
We use cookies to authenticate users, improve the product user experience, and for [personalized ads](https://business.safety.google/privacy/)
. [Learn more.](https://betterstack.com/privacy)
Deny Accept required Accept all
---
# Host (Prometheus) dashboard template | Better Stack
[Back to dashboards](https://betterstack.com/dashboards)
Host (Prometheus)
=================
Monitor your server with Prometheus Node Exporter.
[Add dashboard](https://telemetry.betterstack.com/team/0/dashboards#template-94556)
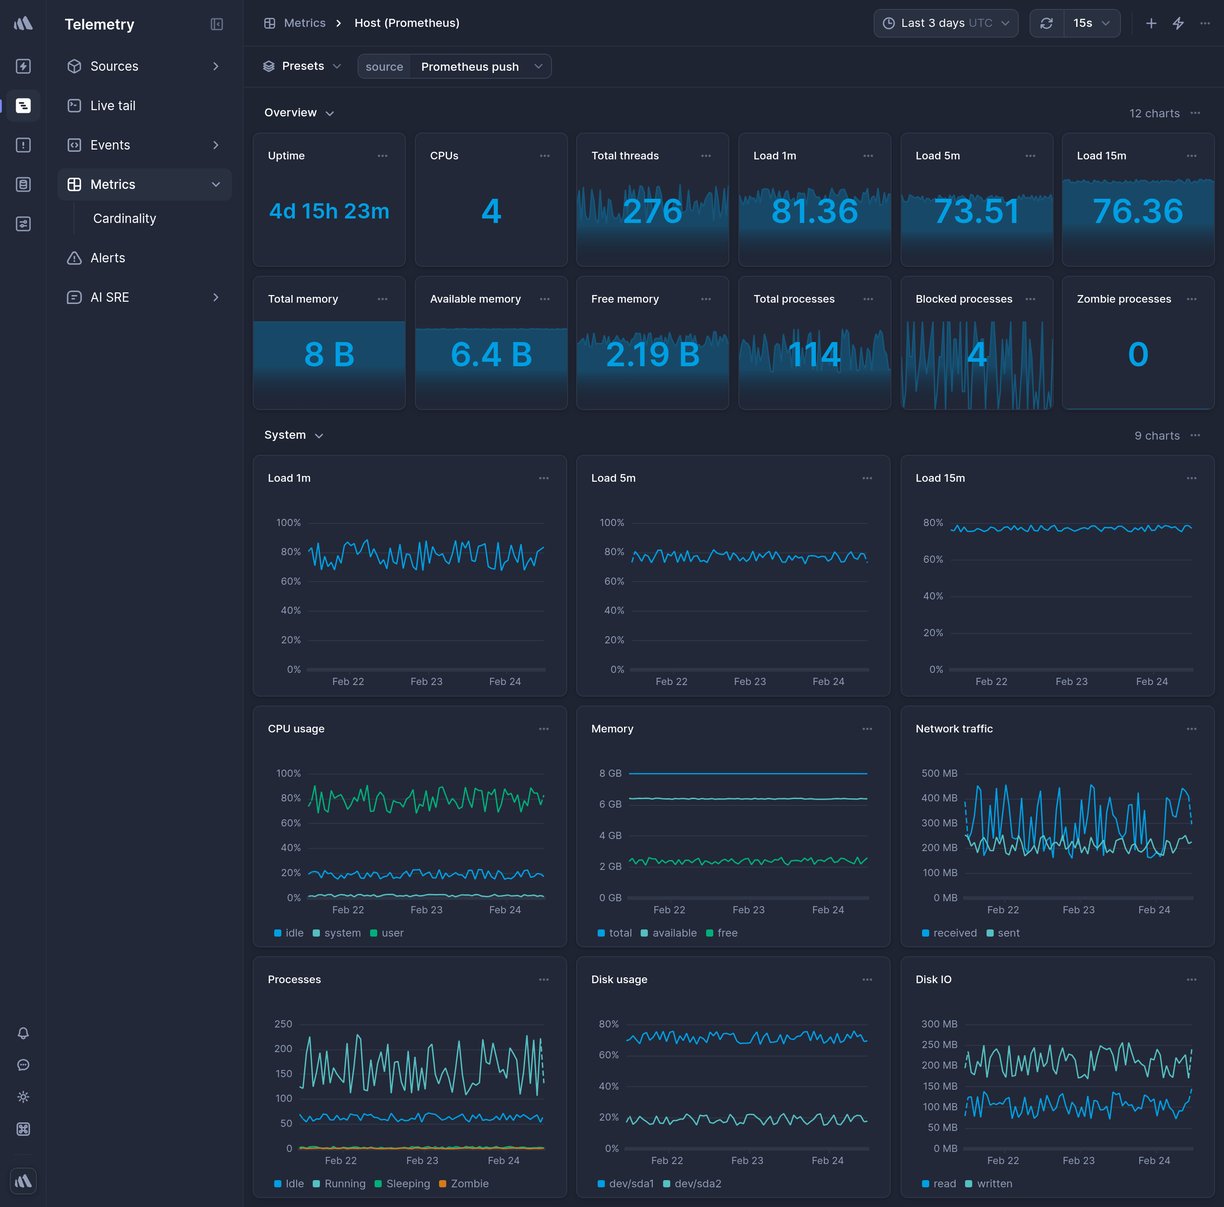
Data source
Prometheus
* * *

Overview
--------
This is a ready-made Host (Prometheus) Telemetry dashboard in Better Stack.
To get it, [sign up](https://betterstack.com/users/sign-up)
for Better Stack, [connect your log or metrics source](https://betterstack.com/docs/logs/logging-start/)
, and select one of the beautiful [pre-built dashboards](https://betterstack.com/dashboards)
you want to get.
### What charts are included
* Uptime status
* CPUs
* Total RAM
* Available RAM
* CPU usage
* Disk utilization (%)
* And much more, explore on your own to see all the chart options.

### How to create a custom chart
Need a custom chart? You can create one by writing a regular SQL query.
Here is how to do it:
1. **Pick a chart type:** the most popular options include a line chart, bar chart, pie chart, a single number, and a live tail (a stream of the newest logs).
2. **Pick a source and timeframe:** we use [variables](https://betterstack.com/docs/logs/dashboards/variables/)
in the SQL queries, which makes it easy to edit and work with any query. The main variables are `source` and `timeframe`. Once you set those, as in the example above, you can use the timeframe switcher easily, and the dashboard will update automatically.
3. **Write your SQL query:** there is no need to use any specific querying language. Just write SQL like you’re used to.
**Learn more:** [How to build SQL queries in Better Stack](https://betterstack.com/docs/logs/dashboards/sql-queries/)

### How to create an alert for a metric
You can get easily alerted on irregularities before they become incidents.
Everything is fully integrated into dashboards, there is no need to set up complex workflows.
Here are the most popular alert types:
* **Threshold Alerts:** Perfect for scenarios where you need to be notified when a metric crosses a certain predefined threshold. For instance, if your application's response time exceeds a set limit, you’ll get an alert.
* **Relative Alerts:** Want to monitor changes in metrics relative to their historical data? Whether it's an unexpected drop in sales, a surge in new user signups, or any other relative metric anomaly, we've got you covered.
* **Anomaly detection:** Use this alerting method if you're unsure about what threshold to set. It will notify you about any significant deviation from the predicted value of the series. Think of this method as covering what you didn’t even know can occur.
**Learn more:** [How to use alerts in Better Stack](https://betterstack.com/docs/logs/dashboards/alerts/)

### How to receive notification about issues
Once you set up what metric irregularities you want to get alerted to, you can select a broad spectrum of notification options.
The most popular include Slack, Microsoft Teams, Phone calls, SMS, emails, webhooks, and more.
The best part is that notifications within Better Stack are unlimited. This way, you don’t have to worry about being charged extra in case of significant incidents.
**Learn more:** [How to use escalation policies in Better Stack](https://betterstack.com/docs/uptime/escalation-policies/)
### How to set up your Host (Prometheus) dashboard
Once you’ve signed up for [Better Stack](https://betterstack.com/logs)
, you can collect logs and metrics from Host (Prometheus) in just 2 minutes. Here is the official [documentation](https://betterstack.com/docs/logs/prometheus/)
on how to do it.
Are you already using another log forwarder that you’re used to? See the documentation for [Fluent Bit](https://betterstack.com/docs/logs/fluent-bit/)
, [Logstash](https://betterstack.com/docs/logs/logstash/)
, [Fluentd](https://betterstack.com/docs/logs/fluentd/)
, [Filebeat](https://betterstack.com/docs/logs/filebeat/)
, [Syslog](https://betterstack.com/docs/logs/syslog-setup/)
, and [others](https://betterstack.com/docs/logs/start/)
.
### Have any questions?
Please feel free to message us at [hello@betterstack.com](mailto:hello@betterstack.com?subject=Question%20about%20Better%20Stack&body=)
.
We'll get back to you as soon as we can, typically within a few hours. 🙏 Thank you!
* * *
#### You might also like
[\
\
### Hosts\
\
Monitor multiple hosts and servers in your infrastructure.](https://betterstack.com/dashboards/hosts)
[\
\
### Services\
\
Monitor application services and their performance metrics.](https://betterstack.com/dashboards/services)

### Please accept cookies
We use cookies to authenticate users, improve the product user experience, and for [personalized ads](https://business.safety.google/privacy/)
. [Learn more.](https://betterstack.com/privacy)
Deny Accept required Accept all
---
# Ruby on Rails dashboard template | Better Stack
[Back to dashboards](https://betterstack.com/dashboards)
Ruby on Rails
=============
Ruby web application framework.
[Add dashboard](https://telemetry.betterstack.com/team/0/dashboards#template-94559)
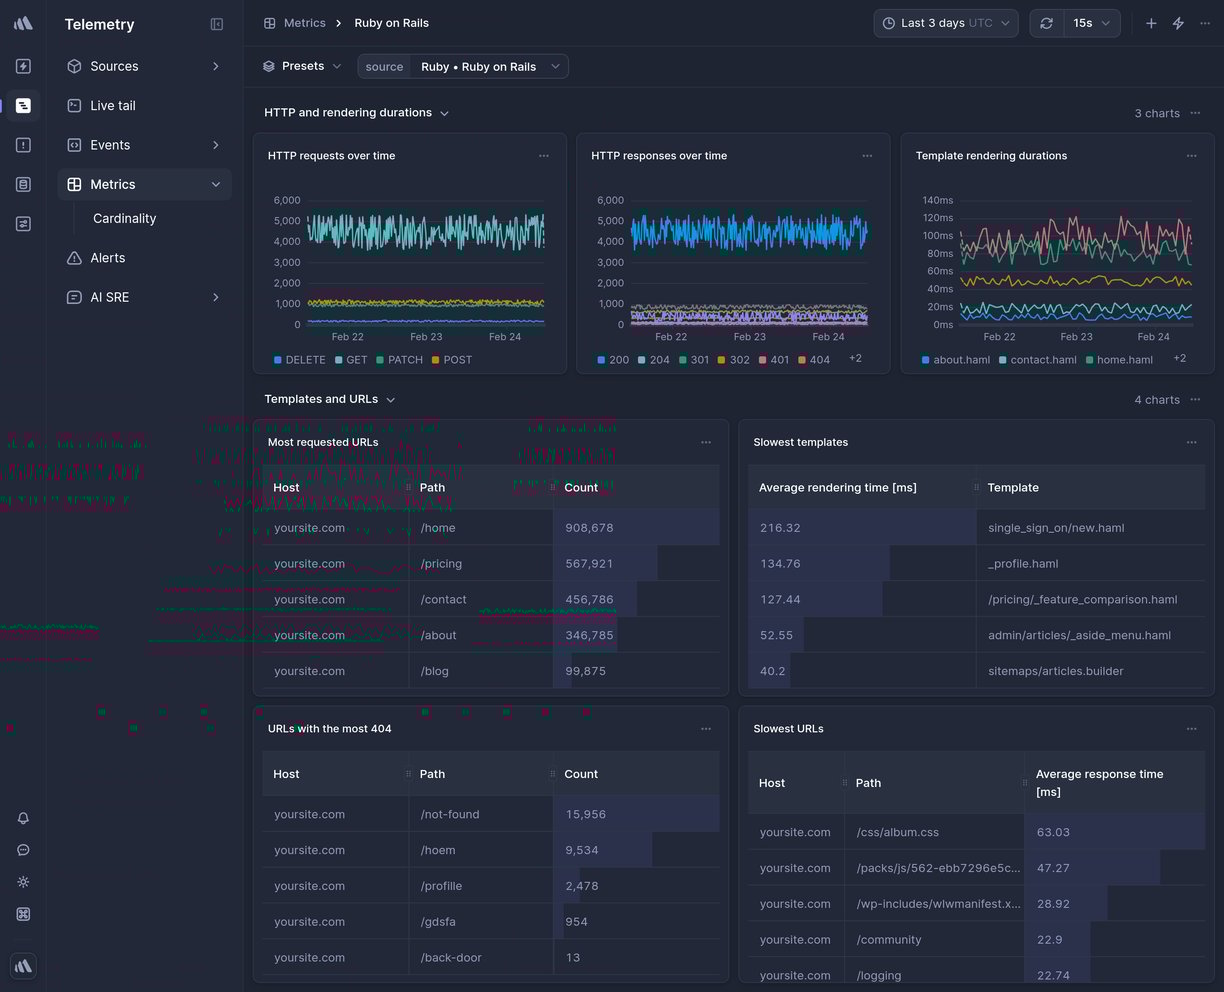
Data source
Ruby · Ruby on Rails
* * *

Overview
--------
This is a ready-made Ruby on Rails Telemetry dashboard in Better Stack.
To get it, [sign up](https://betterstack.com/users/sign-up)
for Better Stack, [connect your log or metrics source](https://betterstack.com/docs/logs/logging-start/)
, and select one of the beautiful [pre-built dashboards](https://betterstack.com/dashboards)
you want to get.
### What charts are included
* HTTP requests over time
* HTTP responses over time
* Uptime status
* And much more, explore on your own to see all the chart options.

### How to create a custom chart
Need a custom chart? You can create one by writing a regular SQL query.
Here is how to do it:
1. **Pick a chart type:** the most popular options include a line chart, bar chart, pie chart, a single number, and a live tail (a stream of the newest logs).
2. **Pick a source and timeframe:** we use [variables](https://betterstack.com/docs/logs/dashboards/variables/)
in the SQL queries, which makes it easy to edit and work with any query. The main variables are `source` and `timeframe`. Once you set those, as in the example above, you can use the timeframe switcher easily, and the dashboard will update automatically.
3. **Write your SQL query:** there is no need to use any specific querying language. Just write SQL like you’re used to.
**Learn more:** [How to build SQL queries in Better Stack](https://betterstack.com/docs/logs/dashboards/sql-queries/)

### How to create an alert for a metric
You can get easily alerted on irregularities before they become incidents.
Everything is fully integrated into dashboards, there is no need to set up complex workflows.
Here are the most popular alert types:
* **Threshold Alerts:** Perfect for scenarios where you need to be notified when a metric crosses a certain predefined threshold. For instance, if your application's response time exceeds a set limit, you’ll get an alert.
* **Relative Alerts:** Want to monitor changes in metrics relative to their historical data? Whether it's an unexpected drop in sales, a surge in new user signups, or any other relative metric anomaly, we've got you covered.
* **Anomaly detection:** Use this alerting method if you're unsure about what threshold to set. It will notify you about any significant deviation from the predicted value of the series. Think of this method as covering what you didn’t even know can occur.
**Learn more:** [How to use alerts in Better Stack](https://betterstack.com/docs/logs/dashboards/alerts/)

### How to receive notification about issues
Once you set up what metric irregularities you want to get alerted to, you can select a broad spectrum of notification options.
The most popular include Slack, Microsoft Teams, Phone calls, SMS, emails, webhooks, and more.
The best part is that notifications within Better Stack are unlimited. This way, you don’t have to worry about being charged extra in case of significant incidents.
**Learn more:** [How to use escalation policies in Better Stack](https://betterstack.com/docs/uptime/escalation-policies/)
### How to set up your Ruby on Rails dashboard
Once you’ve signed up for [Better Stack](https://betterstack.com/logs)
, you can collect logs and metrics from Ruby on Rails in just 2 minutes. Here is the official [documentation](https://betterstack.com/docs/logs/ruby-and-rails/)
on how to do it.
Are you already using another log forwarder that you’re used to? See the documentation for [Fluent Bit](https://betterstack.com/docs/logs/fluent-bit/)
, [Logstash](https://betterstack.com/docs/logs/logstash/)
, [Fluentd](https://betterstack.com/docs/logs/fluentd/)
, [Filebeat](https://betterstack.com/docs/logs/filebeat/)
, [Syslog](https://betterstack.com/docs/logs/syslog-setup/)
, and [others](https://betterstack.com/docs/logs/start/)
.
### Have any questions?
Please feel free to message us at [hello@betterstack.com](mailto:hello@betterstack.com?subject=Question%20about%20Better%20Stack&body=)
.
We'll get back to you as soon as we can, typically within a few hours. 🙏 Thank you!
* * *
#### You might also like
[\
\
### GCP Load Balancing\
\
Global and regional load balancing for HTTP(S) and TCP/UDP traffic.](https://betterstack.com/dashboards/gcp-load-balancing)
[\
\
### PostgreSQL\
\
Relational database management system emphasizing extensibility and SQL compliance.](https://betterstack.com/dashboards/postgresql)

### Please accept cookies
We use cookies to authenticate users, improve the product user experience, and for [personalized ads](https://business.safety.google/privacy/)
. [Learn more.](https://betterstack.com/privacy)
Deny Accept required Accept all
---
# PostgreSQL dashboard template | Better Stack
[Back to dashboards](https://betterstack.com/dashboards)
PostgreSQL
==========
Relational database management system emphasizing extensibility and SQL compliance.
[Add dashboard](https://telemetry.betterstack.com/team/0/dashboards#template-95586)
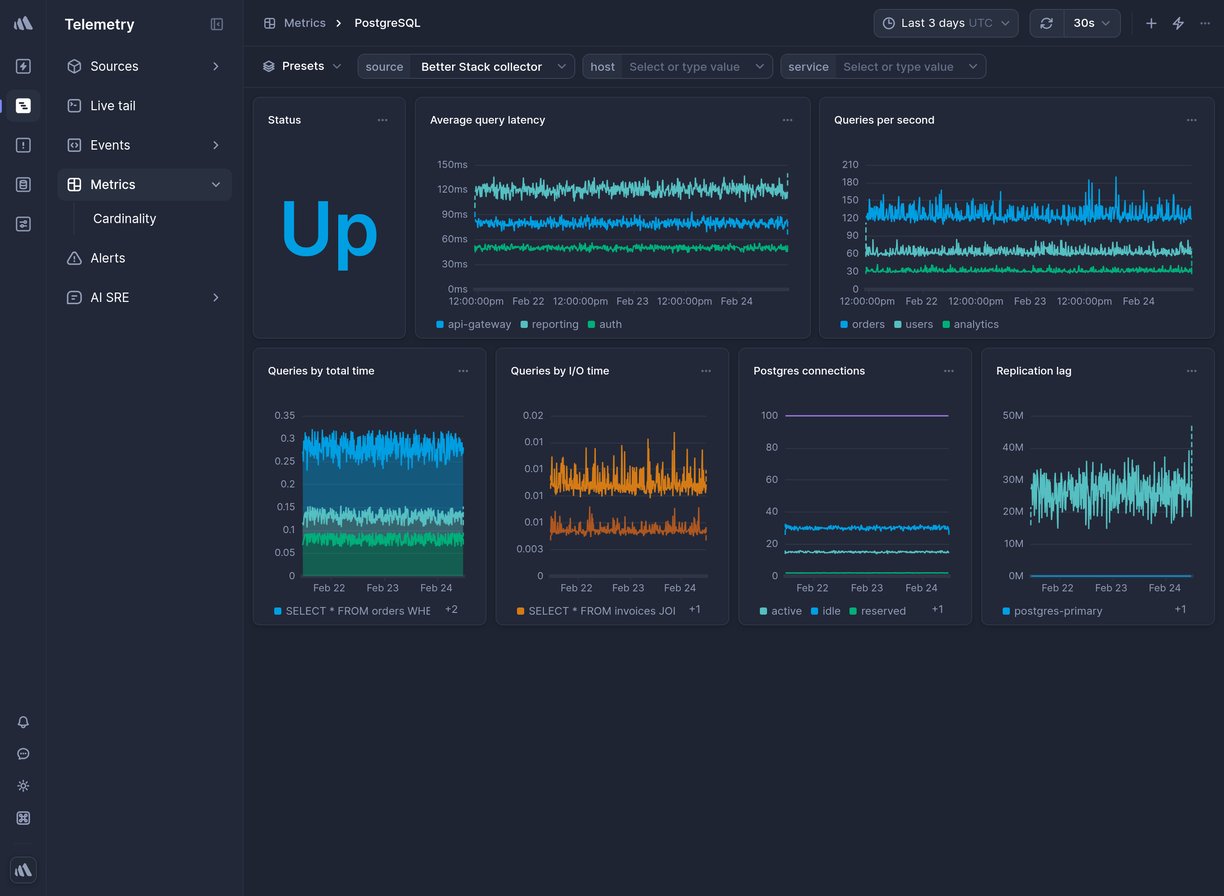
Data source
PostgreSQL
* * *

Overview
--------
This is a ready-made PostgreSQL Telemetry dashboard in Better Stack.
To get it, [sign up](https://betterstack.com/users/sign-up)
for Better Stack, [connect your log or metrics source](https://betterstack.com/docs/logs/logging-start/)
, and select one of the beautiful [pre-built dashboards](https://betterstack.com/dashboards)
you want to get.
### What charts are included
* Status
* Queries per second
* Queries by total time
* Connections
* Query latency
* Replication lag
* And much more, explore on your own to see all the chart options.

### How to create a custom chart
Need a custom chart? You can create one by writing a regular SQL query.
Here is how to do it:
1. **Pick a chart type:** the most popular options include a line chart, bar chart, pie chart, a single number, and a live tail (a stream of the newest logs).
2. **Pick a source and timeframe:** we use [variables](https://betterstack.com/docs/logs/dashboards/variables/)
in the SQL queries, which makes it easy to edit and work with any query. The main variables are `source` and `timeframe`. Once you set those, as in the example above, you can use the timeframe switcher easily, and the dashboard will update automatically.
3. **Write your SQL query:** there is no need to use any specific querying language. Just write SQL like you’re used to.
**Learn more:** [How to build SQL queries in Better Stack](https://betterstack.com/docs/logs/dashboards/sql-queries/)

### How to create an alert for a metric
You can get easily alerted on irregularities before they become incidents.
Everything is fully integrated into dashboards, there is no need to set up complex workflows.
Here are the most popular alert types:
* **Threshold Alerts:** Perfect for scenarios where you need to be notified when a metric crosses a certain predefined threshold. For instance, if your application's response time exceeds a set limit, you’ll get an alert.
* **Relative Alerts:** Want to monitor changes in metrics relative to their historical data? Whether it's an unexpected drop in sales, a surge in new user signups, or any other relative metric anomaly, we've got you covered.
* **Anomaly detection:** Use this alerting method if you're unsure about what threshold to set. It will notify you about any significant deviation from the predicted value of the series. Think of this method as covering what you didn’t even know can occur.
**Learn more:** [How to use alerts in Better Stack](https://betterstack.com/docs/logs/dashboards/alerts/)

### How to receive notification about issues
Once you set up what metric irregularities you want to get alerted to, you can select a broad spectrum of notification options.
The most popular include Slack, Microsoft Teams, Phone calls, SMS, emails, webhooks, and more.
The best part is that notifications within Better Stack are unlimited. This way, you don’t have to worry about being charged extra in case of significant incidents.
**Learn more:** [How to use escalation policies in Better Stack](https://betterstack.com/docs/uptime/escalation-policies/)
### How to set up your PostgreSQL dashboard
Once you’ve signed up for [Better Stack](https://betterstack.com/logs)
, you can collect logs and metrics from PostgreSQL in just 2 minutes. Here is the official [documentation](https://betterstack.com/docs/logs/postgresql/)
on how to do it.
Are you already using another log forwarder that you’re used to? See the documentation for [Fluent Bit](https://betterstack.com/docs/logs/fluent-bit/)
, [Logstash](https://betterstack.com/docs/logs/logstash/)
, [Fluentd](https://betterstack.com/docs/logs/fluentd/)
, [Filebeat](https://betterstack.com/docs/logs/filebeat/)
, [Syslog](https://betterstack.com/docs/logs/syslog-setup/)
, and [others](https://betterstack.com/docs/logs/start/)
.
### Have any questions?
Please feel free to message us at [hello@betterstack.com](mailto:hello@betterstack.com?subject=Question%20about%20Better%20Stack&body=)
.
We'll get back to you as soon as we can, typically within a few hours. 🙏 Thank you!
* * *
#### You might also like
[\
\
### Web vitals\
\
Get alerted when your Core Web Vitals decline.](https://betterstack.com/dashboards/web-vitals)
[\
\
### GCP Cloud Functions\
\
Event-driven serverless functions for lightweight workloads.](https://betterstack.com/dashboards/gcp-cloud-functions)

### Please accept cookies
We use cookies to authenticate users, improve the product user experience, and for [personalized ads](https://business.safety.google/privacy/)
. [Learn more.](https://betterstack.com/privacy)
Deny Accept required Accept all
---
# Traefik dashboard template | Better Stack
[Back to dashboards](https://betterstack.com/dashboards)
Traefik
=======
Open-source reverse proxy and load balancer for HTTP and TCP-based applications.
[Add dashboard](https://telemetry.betterstack.com/team/0/dashboards#template-95584)
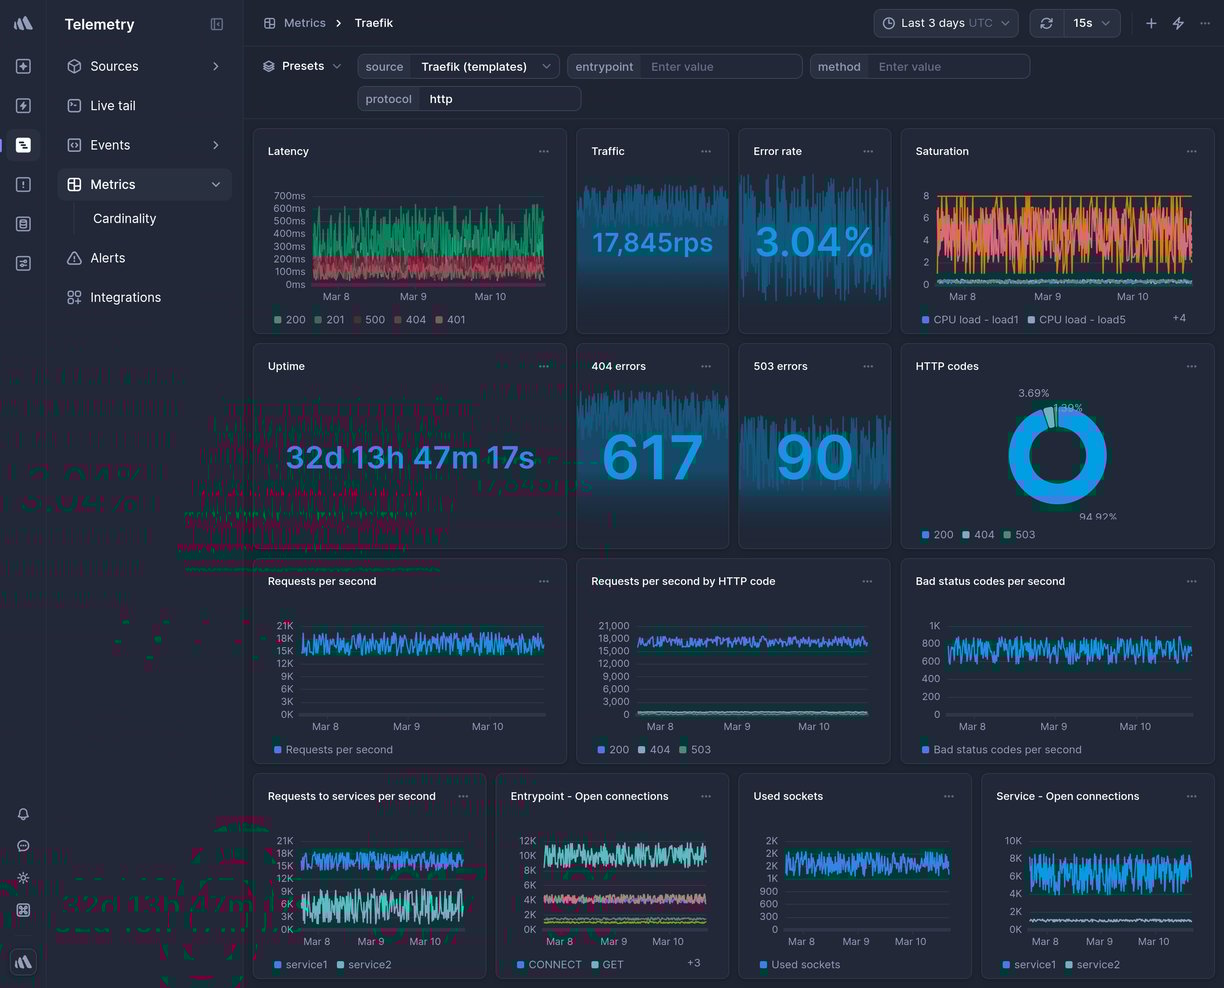
Data source
Traefik
* * *

Overview
--------
This is a ready-made Traefik Telemetry dashboard in Better Stack.
To get it, [sign up](https://betterstack.com/users/sign-up)
for Better Stack, [connect your log or metrics source](https://betterstack.com/docs/logs/logging-start/)
, and select one of the beautiful [pre-built dashboards](https://betterstack.com/dashboards)
you want to get.
### What charts are included
* Requests per second
* Error rate
* Uptime
* Traffic
* Requests per second by HTTP code
* Requests per second by entrypoint
* And much more, explore on your own to see all the chart options.

### How to create a custom chart
Need a custom chart? You can create one by writing a regular SQL query.
Here is how to do it:
1. **Pick a chart type:** the most popular options include a line chart, bar chart, pie chart, a single number, and a live tail (a stream of the newest logs).
2. **Pick a source and timeframe:** we use [variables](https://betterstack.com/docs/logs/dashboards/variables/)
in the SQL queries, which makes it easy to edit and work with any query. The main variables are `source` and `timeframe`. Once you set those, as in the example above, you can use the timeframe switcher easily, and the dashboard will update automatically.
3. **Write your SQL query:** there is no need to use any specific querying language. Just write SQL like you’re used to.
**Learn more:** [How to build SQL queries in Better Stack](https://betterstack.com/docs/logs/dashboards/sql-queries/)

### How to create an alert for a metric
You can get easily alerted on irregularities before they become incidents.
Everything is fully integrated into dashboards, there is no need to set up complex workflows.
Here are the most popular alert types:
* **Threshold Alerts:** Perfect for scenarios where you need to be notified when a metric crosses a certain predefined threshold. For instance, if your application's response time exceeds a set limit, you’ll get an alert.
* **Relative Alerts:** Want to monitor changes in metrics relative to their historical data? Whether it's an unexpected drop in sales, a surge in new user signups, or any other relative metric anomaly, we've got you covered.
* **Anomaly detection:** Use this alerting method if you're unsure about what threshold to set. It will notify you about any significant deviation from the predicted value of the series. Think of this method as covering what you didn’t even know can occur.
**Learn more:** [How to use alerts in Better Stack](https://betterstack.com/docs/logs/dashboards/alerts/)

### How to receive notification about issues
Once you set up what metric irregularities you want to get alerted to, you can select a broad spectrum of notification options.
The most popular include Slack, Microsoft Teams, Phone calls, SMS, emails, webhooks, and more.
The best part is that notifications within Better Stack are unlimited. This way, you don’t have to worry about being charged extra in case of significant incidents.
**Learn more:** [How to use escalation policies in Better Stack](https://betterstack.com/docs/uptime/escalation-policies/)
### How to set up your Traefik dashboard
Once you’ve signed up for [Better Stack](https://betterstack.com/logs)
, you can collect logs and metrics from Traefik in just 2 minutes. Here is the official [documentation](https://betterstack.com/docs/logs/traefik/)
on how to do it.
Are you already using another log forwarder that you’re used to? See the documentation for [Fluent Bit](https://betterstack.com/docs/logs/fluent-bit/)
, [Logstash](https://betterstack.com/docs/logs/logstash/)
, [Fluentd](https://betterstack.com/docs/logs/fluentd/)
, [Filebeat](https://betterstack.com/docs/logs/filebeat/)
, [Syslog](https://betterstack.com/docs/logs/syslog-setup/)
, and [others](https://betterstack.com/docs/logs/start/)
.
### Have any questions?
Please feel free to message us at [hello@betterstack.com](mailto:hello@betterstack.com?subject=Question%20about%20Better%20Stack&body=)
.
We'll get back to you as soon as we can, typically within a few hours. 🙏 Thank you!
* * *
#### You might also like
[\
\
### Nginx\
\
Web server, reverse proxy, and load balancer.](https://betterstack.com/dashboards/nginx)
[\
\
### AWS RDS PostgreSQL\
\
Managed PostgreSQL-compatible relational database on AWS.](https://betterstack.com/dashboards/aws-rds-postgresql)

### Please accept cookies
We use cookies to authenticate users, improve the product user experience, and for [personalized ads](https://business.safety.google/privacy/)
. [Learn more.](https://betterstack.com/privacy)
Deny Accept required Accept all
---
# MinIO dashboard template | Better Stack
[Back to dashboards](https://betterstack.com/dashboards)
MinIO
=====
High-performance objectsStorage with S3 compatible API.
[Add dashboard](https://telemetry.betterstack.com/team/0/dashboards#template-94566)

Data source
MinIO
* * *

Overview
--------
This is a ready-made MinIO Telemetry dashboard in Better Stack.
To get it, [sign up](https://betterstack.com/users/sign-up)
for Better Stack, [connect your log or metrics source](https://betterstack.com/docs/logs/logging-start/)
, and select one of the beautiful [pre-built dashboards](https://betterstack.com/dashboards)
you want to get.
### What charts are included
* S3 API data sent per second
* Total S3 inbound traffic
* Free inodes
* Buckets
* And much more, explore on your own to see all the chart options.

### How to create a custom chart
Need a custom chart? You can create one by writing a regular SQL query.
Here is how to do it:
1. **Pick a chart type:** the most popular options include a line chart, bar chart, pie chart, a single number, and a live tail (a stream of the newest logs).
2. **Pick a source and timeframe:** we use [variables](https://betterstack.com/docs/logs/dashboards/variables/)
in the SQL queries, which makes it easy to edit and work with any query. The main variables are `source` and `timeframe`. Once you set those, as in the example above, you can use the timeframe switcher easily, and the dashboard will update automatically.
3. **Write your SQL query:** there is no need to use any specific querying language. Just write SQL like you’re used to.
**Learn more:** [How to build SQL queries in Better Stack](https://betterstack.com/docs/logs/dashboards/sql-queries/)

### How to create an alert for a metric
You can get easily alerted on irregularities before they become incidents.
Everything is fully integrated into dashboards, there is no need to set up complex workflows.
Here are the most popular alert types:
* **Threshold Alerts:** Perfect for scenarios where you need to be notified when a metric crosses a certain predefined threshold. For instance, if your application's response time exceeds a set limit, you’ll get an alert.
* **Relative Alerts:** Want to monitor changes in metrics relative to their historical data? Whether it's an unexpected drop in sales, a surge in new user signups, or any other relative metric anomaly, we've got you covered.
* **Anomaly detection:** Use this alerting method if you're unsure about what threshold to set. It will notify you about any significant deviation from the predicted value of the series. Think of this method as covering what you didn’t even know can occur.
**Learn more:** [How to use alerts in Better Stack](https://betterstack.com/docs/logs/dashboards/alerts/)

### How to receive notification about issues
Once you set up what metric irregularities you want to get alerted to, you can select a broad spectrum of notification options.
The most popular include Slack, Microsoft Teams, Phone calls, SMS, emails, webhooks, and more.
The best part is that notifications within Better Stack are unlimited. This way, you don’t have to worry about being charged extra in case of significant incidents.
**Learn more:** [How to use escalation policies in Better Stack](https://betterstack.com/docs/uptime/escalation-policies/)
### How to set up your MinIO dashboard
Once you’ve signed up for [Better Stack](https://betterstack.com/logs)
, you can collect logs and metrics from MinIO in just 2 minutes. Here is the official [documentation](https://betterstack.com/docs/logs/minio/)
on how to do it.
Are you already using another log forwarder that you’re used to? See the documentation for [Fluent Bit](https://betterstack.com/docs/logs/fluent-bit/)
, [Logstash](https://betterstack.com/docs/logs/logstash/)
, [Fluentd](https://betterstack.com/docs/logs/fluentd/)
, [Filebeat](https://betterstack.com/docs/logs/filebeat/)
, [Syslog](https://betterstack.com/docs/logs/syslog-setup/)
, and [others](https://betterstack.com/docs/logs/start/)
.
### Have any questions?
Please feel free to message us at [hello@betterstack.com](mailto:hello@betterstack.com?subject=Question%20about%20Better%20Stack&body=)
.
We'll get back to you as soon as we can, typically within a few hours. 🙏 Thank you!
* * *
#### You might also like
[\
\
### MySQL\
\
Open-source relational database management system.](https://betterstack.com/dashboards/mysql)
[\
\
### PostgreSQL\
\
Relational database management system emphasizing extensibility and SQL compliance.](https://betterstack.com/dashboards/postgresql)

### Please accept cookies
We use cookies to authenticate users, improve the product user experience, and for [personalized ads](https://business.safety.google/privacy/)
. [Learn more.](https://betterstack.com/privacy)
Deny Accept required Accept all
---
# Vector dashboard template | Better Stack
[Back to dashboards](https://betterstack.com/dashboards)
Vector
======
Vector data pipeline input, transform, and output monitoring.
[Add dashboard](https://telemetry.betterstack.com/team/0/dashboards#template-95608)
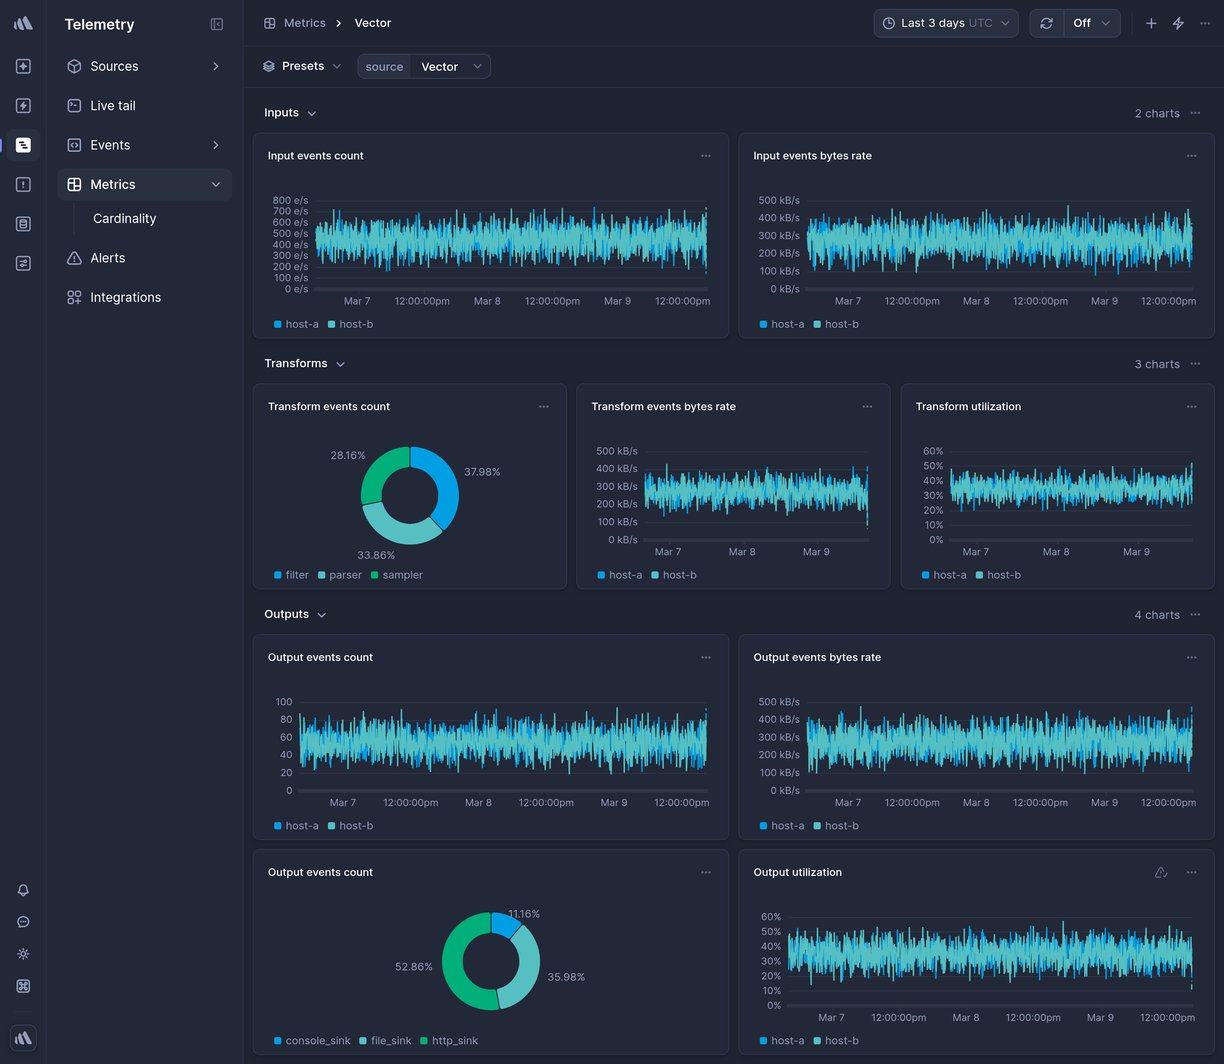
Data source
Vector
* * *

Overview
--------
This is a ready-made Vector Telemetry dashboard in Better Stack.
To get it, [sign up](https://betterstack.com/users/sign-up)
for Better Stack, [connect your log or metrics source](https://betterstack.com/docs/logs/logging-start/)
, and select one of the beautiful [pre-built dashboards](https://betterstack.com/dashboards)
you want to get.
### What charts are included
* Pipeline throughput
* Component utilization
* Error rate
* And much more, explore on your own to see all the chart options.

### How to create a custom chart
Need a custom chart? You can create one by writing a regular SQL query.
Here is how to do it:
1. **Pick a chart type:** the most popular options include a line chart, bar chart, pie chart, a single number, and a live tail (a stream of the newest logs).
2. **Pick a source and timeframe:** we use [variables](https://betterstack.com/docs/logs/dashboards/variables/)
in the SQL queries, which makes it easy to edit and work with any query. The main variables are `source` and `timeframe`. Once you set those, as in the example above, you can use the timeframe switcher easily, and the dashboard will update automatically.
3. **Write your SQL query:** there is no need to use any specific querying language. Just write SQL like you’re used to.
**Learn more:** [How to build SQL queries in Better Stack](https://betterstack.com/docs/logs/dashboards/sql-queries/)

### How to create an alert for a metric
You can get easily alerted on irregularities before they become incidents.
Everything is fully integrated into dashboards, there is no need to set up complex workflows.
Here are the most popular alert types:
* **Threshold Alerts:** Perfect for scenarios where you need to be notified when a metric crosses a certain predefined threshold. For instance, if your application's response time exceeds a set limit, you’ll get an alert.
* **Relative Alerts:** Want to monitor changes in metrics relative to their historical data? Whether it's an unexpected drop in sales, a surge in new user signups, or any other relative metric anomaly, we've got you covered.
* **Anomaly detection:** Use this alerting method if you're unsure about what threshold to set. It will notify you about any significant deviation from the predicted value of the series. Think of this method as covering what you didn’t even know can occur.
**Learn more:** [How to use alerts in Better Stack](https://betterstack.com/docs/logs/dashboards/alerts/)

### How to receive notification about issues
Once you set up what metric irregularities you want to get alerted to, you can select a broad spectrum of notification options.
The most popular include Slack, Microsoft Teams, Phone calls, SMS, emails, webhooks, and more.
The best part is that notifications within Better Stack are unlimited. This way, you don’t have to worry about being charged extra in case of significant incidents.
**Learn more:** [How to use escalation policies in Better Stack](https://betterstack.com/docs/uptime/escalation-policies/)
### How to set up your Vector dashboard
Once you’ve signed up for [Better Stack](https://betterstack.com/logs)
, you can collect logs and metrics from Vector in just 2 minutes. Here is the official [documentation](https://betterstack.com/docs/logs/vector/)
on how to do it.
Are you already using another log forwarder that you’re used to? See the documentation for [Fluent Bit](https://betterstack.com/docs/logs/fluent-bit/)
, [Logstash](https://betterstack.com/docs/logs/logstash/)
, [Fluentd](https://betterstack.com/docs/logs/fluentd/)
, [Filebeat](https://betterstack.com/docs/logs/filebeat/)
, [Syslog](https://betterstack.com/docs/logs/syslog-setup/)
, and [others](https://betterstack.com/docs/logs/start/)
.
### Have any questions?
Please feel free to message us at [hello@betterstack.com](mailto:hello@betterstack.com?subject=Question%20about%20Better%20Stack&body=)
.
We'll get back to you as soon as we can, typically within a few hours. 🙏 Thank you!
* * *
#### You might also like
[\
\
### GCP Load Balancing\
\
Global and regional load balancing for HTTP(S) and TCP/UDP traffic.](https://betterstack.com/dashboards/gcp-load-balancing)
[\
\
### Host overview\
\
Monitor your server infrastructure with comprehensive host metrics.](https://betterstack.com/dashboards/host-overview)

### Please accept cookies
We use cookies to authenticate users, improve the product user experience, and for [personalized ads](https://business.safety.google/privacy/)
. [Learn more.](https://betterstack.com/privacy)
Deny Accept required Accept all
---
# MySQL dashboard template | Better Stack
[Back to dashboards](https://betterstack.com/dashboards)
MySQL
=====
Open-source relational database management system.
[Add dashboard](https://telemetry.betterstack.com/team/0/dashboards#template-95583)
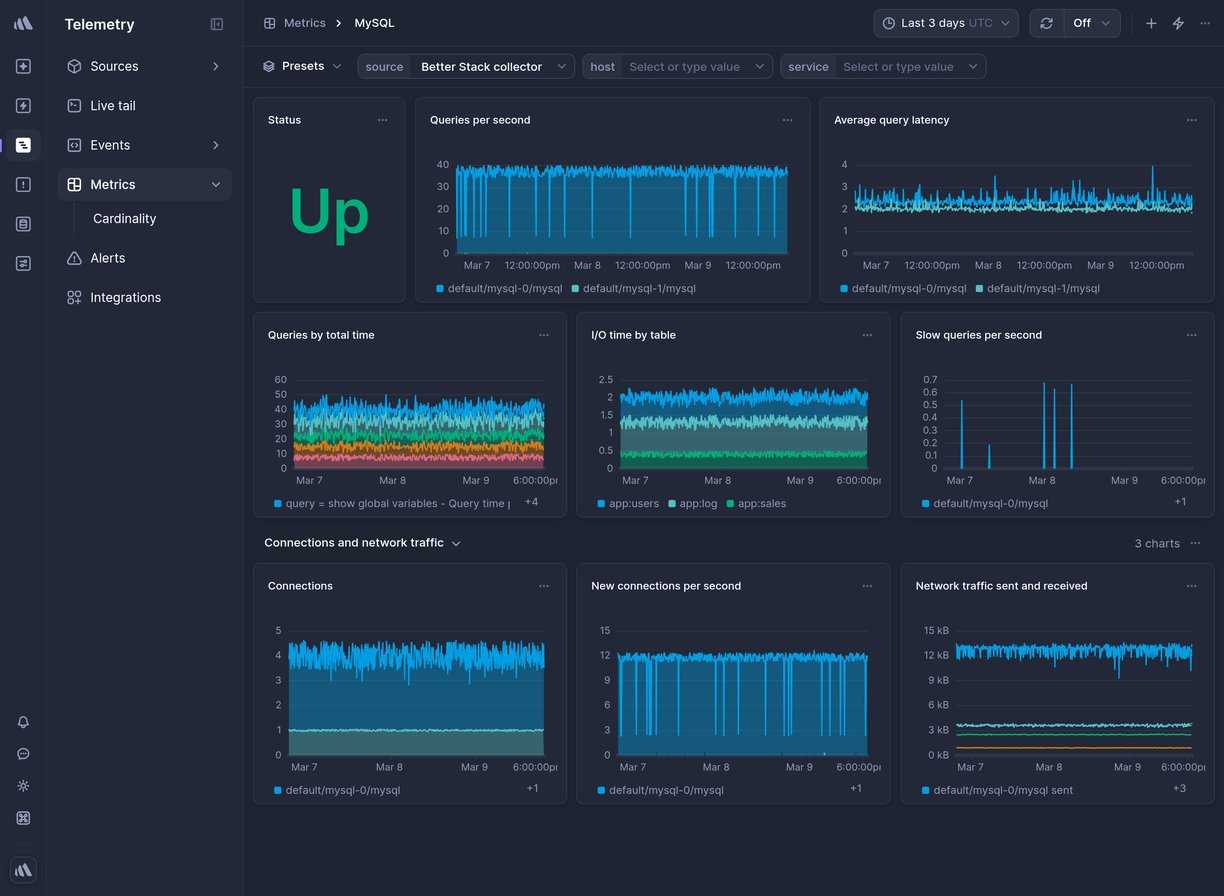
Data source
MySQL
* * *

Overview
--------
This is a ready-made MySQL Telemetry dashboard in Better Stack.
To get it, [sign up](https://betterstack.com/users/sign-up)
for Better Stack, [connect your log or metrics source](https://betterstack.com/docs/logs/logging-start/)
, and select one of the beautiful [pre-built dashboards](https://betterstack.com/dashboards)
you want to get.
### What charts are included
* Status
* Queries per second
* Connections
* Slow queries per second
* Network traffic
* I/O times
* And much more, explore on your own to see all the chart options.

### How to create a custom chart
Need a custom chart? You can create one by writing a regular SQL query.
Here is how to do it:
1. **Pick a chart type:** the most popular options include a line chart, bar chart, pie chart, a single number, and a live tail (a stream of the newest logs).
2. **Pick a source and timeframe:** we use [variables](https://betterstack.com/docs/logs/dashboards/variables/)
in the SQL queries, which makes it easy to edit and work with any query. The main variables are `source` and `timeframe`. Once you set those, as in the example above, you can use the timeframe switcher easily, and the dashboard will update automatically.
3. **Write your SQL query:** there is no need to use any specific querying language. Just write SQL like you’re used to.
**Learn more:** [How to build SQL queries in Better Stack](https://betterstack.com/docs/logs/dashboards/sql-queries/)

### How to create an alert for a metric
You can get easily alerted on irregularities before they become incidents.
Everything is fully integrated into dashboards, there is no need to set up complex workflows.
Here are the most popular alert types:
* **Threshold Alerts:** Perfect for scenarios where you need to be notified when a metric crosses a certain predefined threshold. For instance, if your application's response time exceeds a set limit, you’ll get an alert.
* **Relative Alerts:** Want to monitor changes in metrics relative to their historical data? Whether it's an unexpected drop in sales, a surge in new user signups, or any other relative metric anomaly, we've got you covered.
* **Anomaly detection:** Use this alerting method if you're unsure about what threshold to set. It will notify you about any significant deviation from the predicted value of the series. Think of this method as covering what you didn’t even know can occur.
**Learn more:** [How to use alerts in Better Stack](https://betterstack.com/docs/logs/dashboards/alerts/)

### How to receive notification about issues
Once you set up what metric irregularities you want to get alerted to, you can select a broad spectrum of notification options.
The most popular include Slack, Microsoft Teams, Phone calls, SMS, emails, webhooks, and more.
The best part is that notifications within Better Stack are unlimited. This way, you don’t have to worry about being charged extra in case of significant incidents.
**Learn more:** [How to use escalation policies in Better Stack](https://betterstack.com/docs/uptime/escalation-policies/)
### How to set up your MySQL dashboard
Once you’ve signed up for [Better Stack](https://betterstack.com/logs)
, you can collect logs and metrics from MySQL in just 2 minutes. Here is the official [documentation](https://betterstack.com/docs/logs/mysql/)
on how to do it.
Are you already using another log forwarder that you’re used to? See the documentation for [Fluent Bit](https://betterstack.com/docs/logs/fluent-bit/)
, [Logstash](https://betterstack.com/docs/logs/logstash/)
, [Fluentd](https://betterstack.com/docs/logs/fluentd/)
, [Filebeat](https://betterstack.com/docs/logs/filebeat/)
, [Syslog](https://betterstack.com/docs/logs/syslog-setup/)
, and [others](https://betterstack.com/docs/logs/start/)
.
### Have any questions?
Please feel free to message us at [hello@betterstack.com](mailto:hello@betterstack.com?subject=Question%20about%20Better%20Stack&body=)
.
We'll get back to you as soon as we can, typically within a few hours. 🙏 Thank you!
* * *
#### You might also like
[\
\
### AWS ECS\
\
Container orchestration service on AWS.](https://betterstack.com/dashboards/aws-ecs)
[\
\
### Host (Prometheus)\
\
Monitor your server with Prometheus Node Exporter.](https://betterstack.com/dashboards/prometheus)

### Please accept cookies
We use cookies to authenticate users, improve the product user experience, and for [personalized ads](https://business.safety.google/privacy/)
. [Learn more.](https://betterstack.com/privacy)
Deny Accept required Accept all
---
# HAProxy dashboard template | Better Stack
[Back to dashboards](https://betterstack.com/dashboards)
HAProxy
=======
Load balancer for TCP and HTTP.
[Add dashboard](https://telemetry.betterstack.com/team/0/dashboards#template-94549)
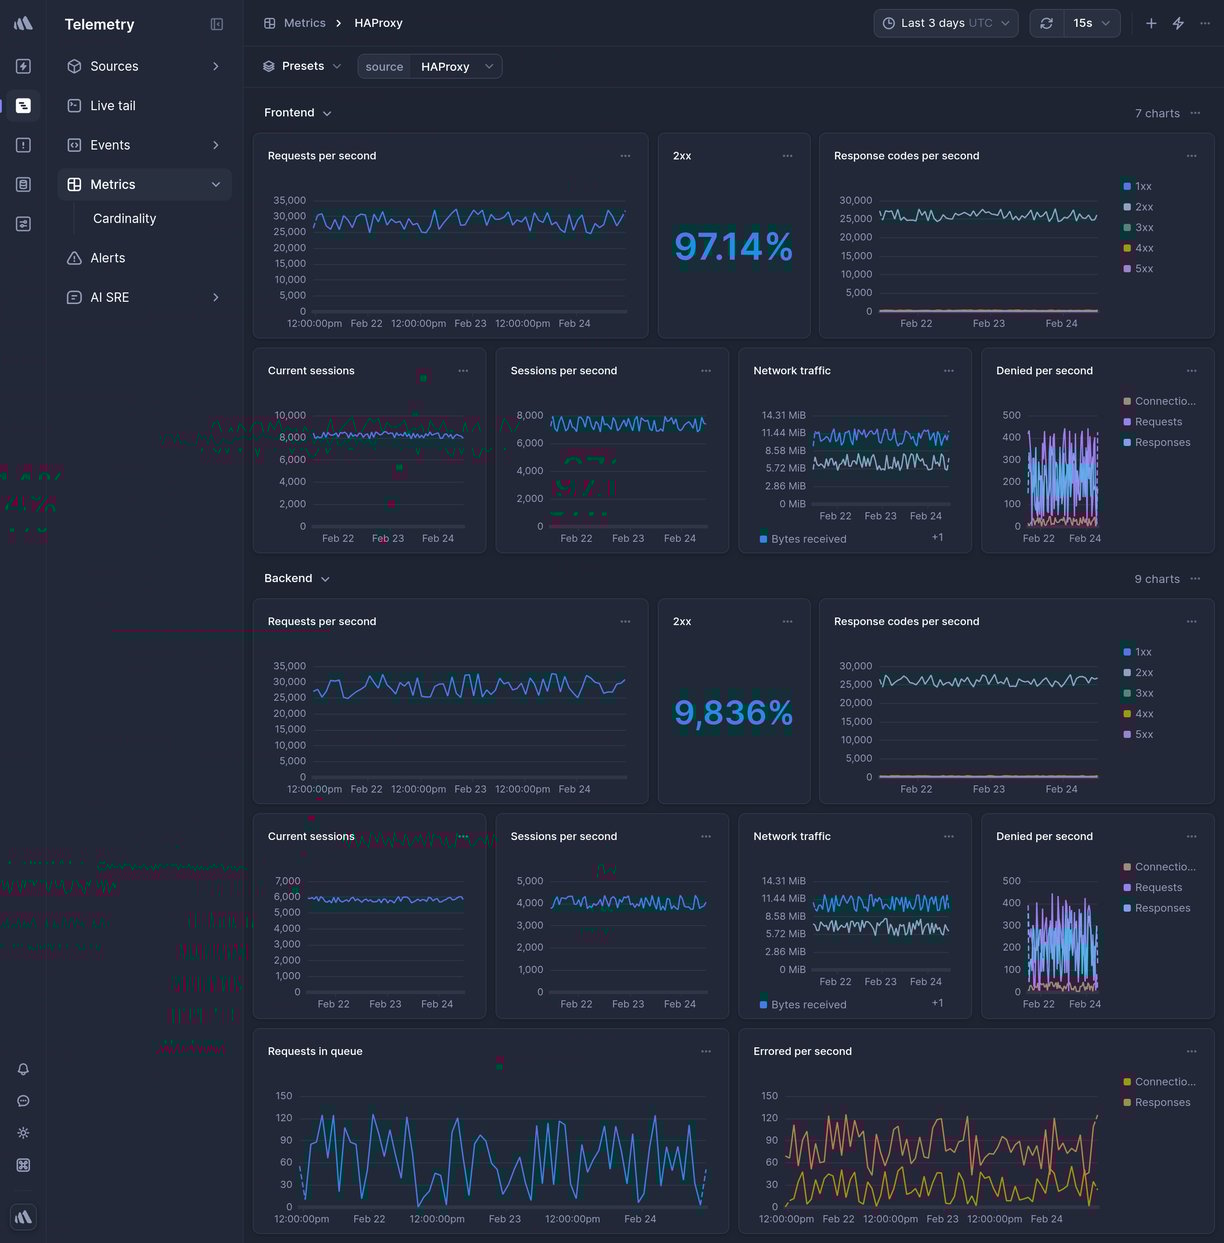
Data source
HAProxy
* * *

Overview
--------
This is a ready-made HAProxy Telemetry dashboard in Better Stack.
To get it, [sign up](https://betterstack.com/users/sign-up)
for Better Stack, [connect your log or metrics source](https://betterstack.com/docs/logs/logging-start/)
, and select one of the beautiful [pre-built dashboards](https://betterstack.com/dashboards)
you want to get.
### What charts are included
* Requests per second
* Sessions per second
* 2xx %
* Current sessions
* Response codes per second
* Network traffic
* Denied per second
* And much more, explore on your own to see all the chart options.

### How to create a custom chart
Need a custom chart? You can create one by writing a regular SQL query.
Here is how to do it:
1. **Pick a chart type:** the most popular options include a line chart, bar chart, pie chart, a single number, and a live tail (a stream of the newest logs).
2. **Pick a source and timeframe:** we use [variables](https://betterstack.com/docs/logs/dashboards/variables/)
in the SQL queries, which makes it easy to edit and work with any query. The main variables are `source` and `timeframe`. Once you set those, as in the example above, you can use the timeframe switcher easily, and the dashboard will update automatically.
3. **Write your SQL query:** there is no need to use any specific querying language. Just write SQL like you’re used to.
**Learn more:** [How to build SQL queries in Better Stack](https://betterstack.com/docs/logs/dashboards/sql-queries/)

### How to create an alert for a metric
You can get easily alerted on irregularities before they become incidents.
Everything is fully integrated into dashboards, there is no need to set up complex workflows.
Here are the most popular alert types:
* **Threshold Alerts:** Perfect for scenarios where you need to be notified when a metric crosses a certain predefined threshold. For instance, if your application's response time exceeds a set limit, you’ll get an alert.
* **Relative Alerts:** Want to monitor changes in metrics relative to their historical data? Whether it's an unexpected drop in sales, a surge in new user signups, or any other relative metric anomaly, we've got you covered.
* **Anomaly detection:** Use this alerting method if you're unsure about what threshold to set. It will notify you about any significant deviation from the predicted value of the series. Think of this method as covering what you didn’t even know can occur.
**Learn more:** [How to use alerts in Better Stack](https://betterstack.com/docs/logs/dashboards/alerts/)

### How to receive notification about issues
Once you set up what metric irregularities you want to get alerted to, you can select a broad spectrum of notification options.
The most popular include Slack, Microsoft Teams, Phone calls, SMS, emails, webhooks, and more.
The best part is that notifications within Better Stack are unlimited. This way, you don’t have to worry about being charged extra in case of significant incidents.
**Learn more:** [How to use escalation policies in Better Stack](https://betterstack.com/docs/uptime/escalation-policies/)
### How to set up your HAProxy dashboard
Once you’ve signed up for [Better Stack](https://betterstack.com/logs)
, you can collect logs and metrics from HAProxy in just 2 minutes. Here is the official [documentation](https://betterstack.com/docs/logs/haproxy/)
on how to do it.
Are you already using another log forwarder that you’re used to? See the documentation for [Fluent Bit](https://betterstack.com/docs/logs/fluent-bit/)
, [Logstash](https://betterstack.com/docs/logs/logstash/)
, [Fluentd](https://betterstack.com/docs/logs/fluentd/)
, [Filebeat](https://betterstack.com/docs/logs/filebeat/)
, [Syslog](https://betterstack.com/docs/logs/syslog-setup/)
, and [others](https://betterstack.com/docs/logs/start/)
.
### Have any questions?
Please feel free to message us at [hello@betterstack.com](mailto:hello@betterstack.com?subject=Question%20about%20Better%20Stack&body=)
.
We'll get back to you as soon as we can, typically within a few hours. 🙏 Thank you!
* * *
#### You might also like
[\
\
### Memcached\
\
Monitor Memcached caching server performance and hit rates.](https://betterstack.com/dashboards/memcached)
[\
\
### Heroku\
\
Cloud PaaS for easy app deployment.](https://betterstack.com/dashboards/heroku)

### Please accept cookies
We use cookies to authenticate users, improve the product user experience, and for [personalized ads](https://business.safety.google/privacy/)
. [Learn more.](https://betterstack.com/privacy)
Deny Accept required Accept all
---
# Host (Vector) dashboard template | Better Stack
[Back to dashboards](https://betterstack.com/dashboards)
Host (Vector)
=============
Monitor your server with Vector metrics.
[Add dashboard](https://telemetry.betterstack.com/team/0/dashboards#template-94571)
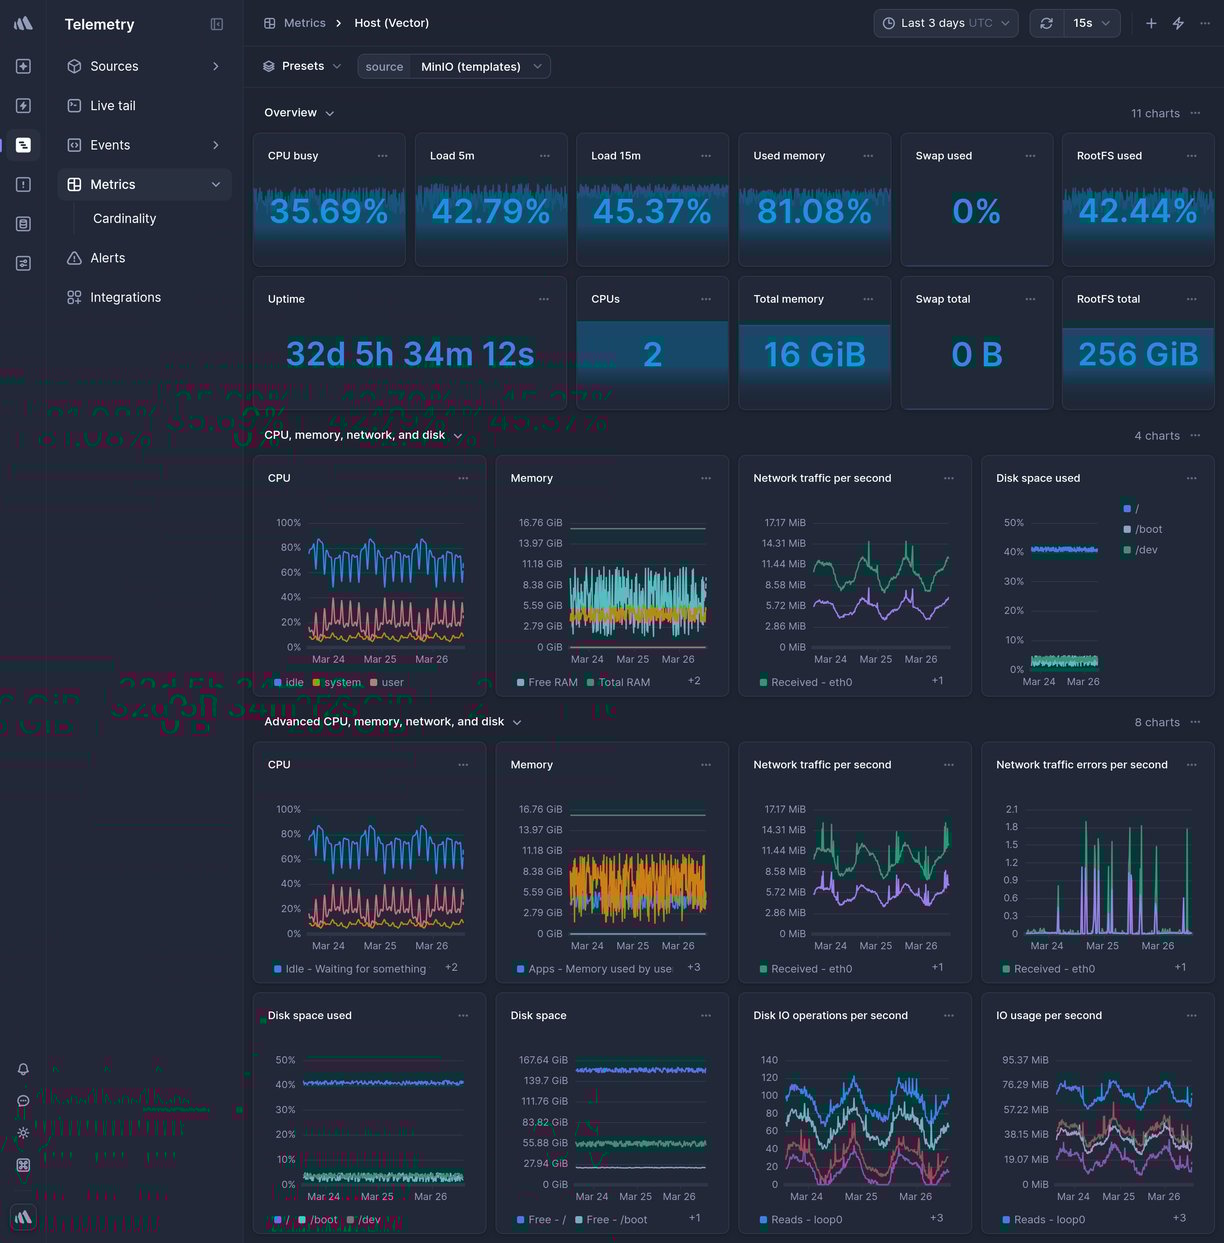
Data source
Vector
* * *

Overview
--------
This is a ready-made Host (Vector) Telemetry dashboard in Better Stack.
To get it, [sign up](https://betterstack.com/users/sign-up)
for Better Stack, [connect your log or metrics source](https://betterstack.com/docs/logs/logging-start/)
, and select one of the beautiful [pre-built dashboards](https://betterstack.com/dashboards)
you want to get.
### What charts are included
* Network traffic per second
* Disk IO operations per second
* CPU busy
* Memory
* And much more, explore on your own to see all the chart options.

### How to create a custom chart
Need a custom chart? You can create one by writing a regular SQL query.
Here is how to do it:
1. **Pick a chart type:** the most popular options include a line chart, bar chart, pie chart, a single number, and a live tail (a stream of the newest logs).
2. **Pick a source and timeframe:** we use [variables](https://betterstack.com/docs/logs/dashboards/variables/)
in the SQL queries, which makes it easy to edit and work with any query. The main variables are `source` and `timeframe`. Once you set those, as in the example above, you can use the timeframe switcher easily, and the dashboard will update automatically.
3. **Write your SQL query:** there is no need to use any specific querying language. Just write SQL like you’re used to.
**Learn more:** [How to build SQL queries in Better Stack](https://betterstack.com/docs/logs/dashboards/sql-queries/)

### How to create an alert for a metric
You can get easily alerted on irregularities before they become incidents.
Everything is fully integrated into dashboards, there is no need to set up complex workflows.
Here are the most popular alert types:
* **Threshold Alerts:** Perfect for scenarios where you need to be notified when a metric crosses a certain predefined threshold. For instance, if your application's response time exceeds a set limit, you’ll get an alert.
* **Relative Alerts:** Want to monitor changes in metrics relative to their historical data? Whether it's an unexpected drop in sales, a surge in new user signups, or any other relative metric anomaly, we've got you covered.
* **Anomaly detection:** Use this alerting method if you're unsure about what threshold to set. It will notify you about any significant deviation from the predicted value of the series. Think of this method as covering what you didn’t even know can occur.
**Learn more:** [How to use alerts in Better Stack](https://betterstack.com/docs/logs/dashboards/alerts/)

### How to receive notification about issues
Once you set up what metric irregularities you want to get alerted to, you can select a broad spectrum of notification options.
The most popular include Slack, Microsoft Teams, Phone calls, SMS, emails, webhooks, and more.
The best part is that notifications within Better Stack are unlimited. This way, you don’t have to worry about being charged extra in case of significant incidents.
**Learn more:** [How to use escalation policies in Better Stack](https://betterstack.com/docs/uptime/escalation-policies/)
### How to set up your Host (Vector) dashboard
Once you’ve signed up for [Better Stack](https://betterstack.com/logs)
, you can collect logs and metrics from Host (Vector) in just 2 minutes. Here is the official [documentation](https://betterstack.com/docs/logs/vector/)
on how to do it.
Are you already using another log forwarder that you’re used to? See the documentation for [Fluent Bit](https://betterstack.com/docs/logs/fluent-bit/)
, [Logstash](https://betterstack.com/docs/logs/logstash/)
, [Fluentd](https://betterstack.com/docs/logs/fluentd/)
, [Filebeat](https://betterstack.com/docs/logs/filebeat/)
, [Syslog](https://betterstack.com/docs/logs/syslog-setup/)
, and [others](https://betterstack.com/docs/logs/start/)
.
### Have any questions?
Please feel free to message us at [hello@betterstack.com](mailto:hello@betterstack.com?subject=Question%20about%20Better%20Stack&body=)
.
We'll get back to you as soon as we can, typically within a few hours. 🙏 Thank you!
* * *
#### You might also like
[\
\
### AWS EC2\
\
Scalable virtual server instances in the AWS cloud.](https://betterstack.com/dashboards/aws-ec2)
[\
\
### RabbitMQ\
\
Open-source message broker for complex message routing between systems.](https://betterstack.com/dashboards/rabbitmq)

### Please accept cookies
We use cookies to authenticate users, improve the product user experience, and for [personalized ads](https://business.safety.google/privacy/)
. [Learn more.](https://betterstack.com/privacy)
Deny Accept required Accept all
---
# Kafka dashboard template | Better Stack
[Back to dashboards](https://betterstack.com/dashboards)
Kafka
=====
Monitor Apache Kafka message broker performance and throughput.
[Add dashboard](https://telemetry.betterstack.com/team/0/dashboards#template-95585)
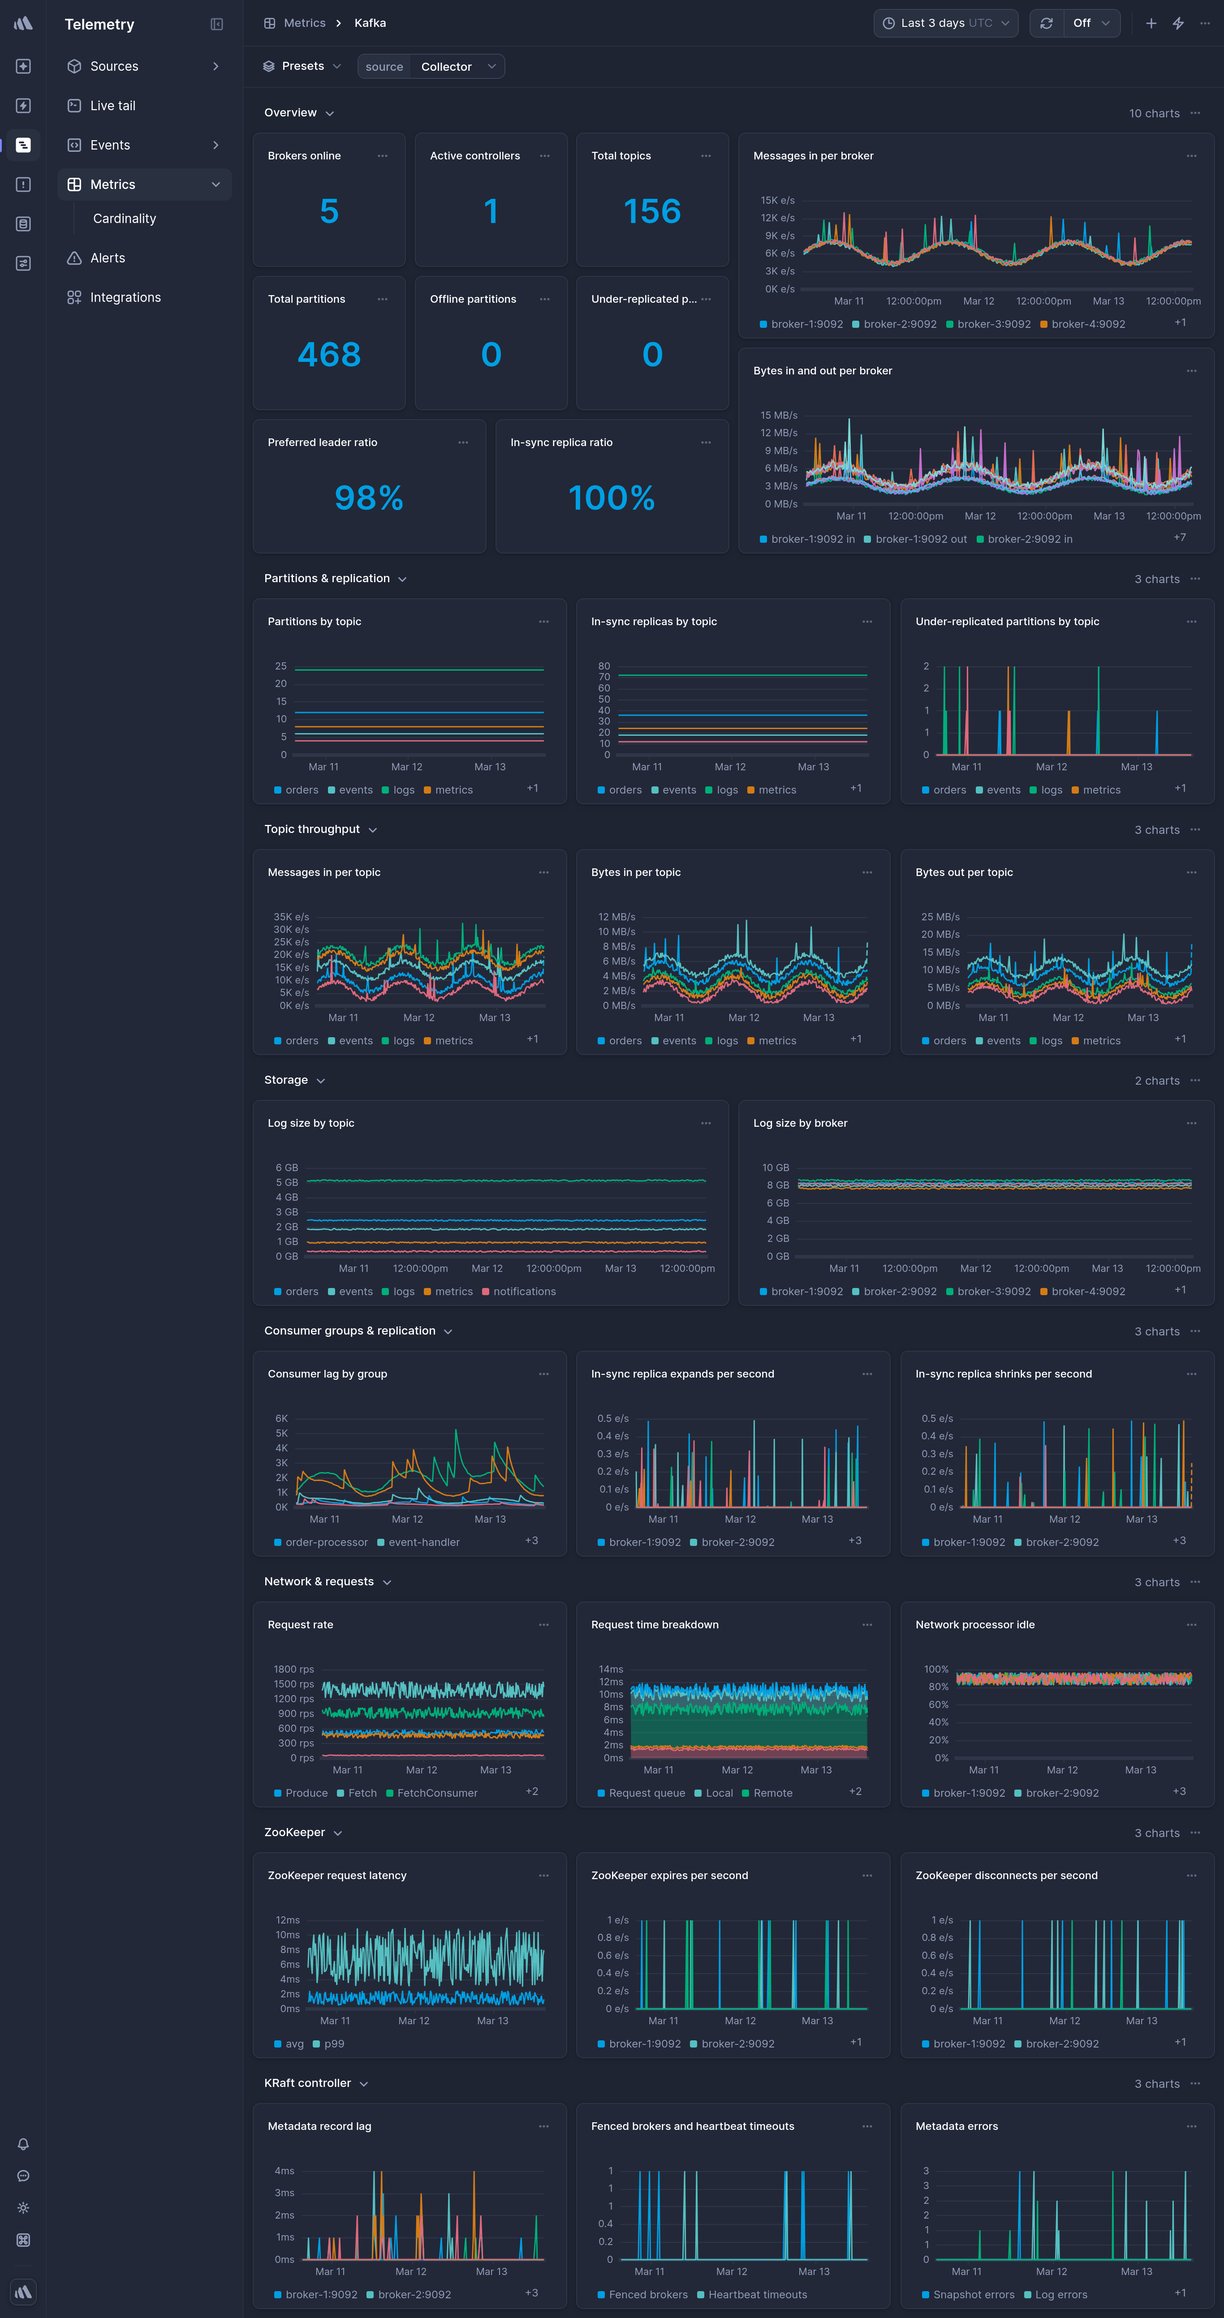
Data source
Kafka
* * *

Overview
--------
This is a ready-made Kafka Telemetry dashboard in Better Stack.
To get it, [sign up](https://betterstack.com/users/sign-up)
for Better Stack, [connect your log or metrics source](https://betterstack.com/docs/logs/logging-start/)
, and select one of the beautiful [pre-built dashboards](https://betterstack.com/dashboards)
you want to get.
### What charts are included
* Message throughput
* Consumer lag
* Broker metrics
* Topic metrics
* And much more, explore on your own to see all the chart options.

### How to create a custom chart
Need a custom chart? You can create one by writing a regular SQL query.
Here is how to do it:
1. **Pick a chart type:** the most popular options include a line chart, bar chart, pie chart, a single number, and a live tail (a stream of the newest logs).
2. **Pick a source and timeframe:** we use [variables](https://betterstack.com/docs/logs/dashboards/variables/)
in the SQL queries, which makes it easy to edit and work with any query. The main variables are `source` and `timeframe`. Once you set those, as in the example above, you can use the timeframe switcher easily, and the dashboard will update automatically.
3. **Write your SQL query:** there is no need to use any specific querying language. Just write SQL like you’re used to.
**Learn more:** [How to build SQL queries in Better Stack](https://betterstack.com/docs/logs/dashboards/sql-queries/)

### How to create an alert for a metric
You can get easily alerted on irregularities before they become incidents.
Everything is fully integrated into dashboards, there is no need to set up complex workflows.
Here are the most popular alert types:
* **Threshold Alerts:** Perfect for scenarios where you need to be notified when a metric crosses a certain predefined threshold. For instance, if your application's response time exceeds a set limit, you’ll get an alert.
* **Relative Alerts:** Want to monitor changes in metrics relative to their historical data? Whether it's an unexpected drop in sales, a surge in new user signups, or any other relative metric anomaly, we've got you covered.
* **Anomaly detection:** Use this alerting method if you're unsure about what threshold to set. It will notify you about any significant deviation from the predicted value of the series. Think of this method as covering what you didn’t even know can occur.
**Learn more:** [How to use alerts in Better Stack](https://betterstack.com/docs/logs/dashboards/alerts/)

### How to receive notification about issues
Once you set up what metric irregularities you want to get alerted to, you can select a broad spectrum of notification options.
The most popular include Slack, Microsoft Teams, Phone calls, SMS, emails, webhooks, and more.
The best part is that notifications within Better Stack are unlimited. This way, you don’t have to worry about being charged extra in case of significant incidents.
**Learn more:** [How to use escalation policies in Better Stack](https://betterstack.com/docs/uptime/escalation-policies/)
### How to set up your Kafka dashboard
Once you’ve signed up for [Better Stack](https://betterstack.com/logs)
, you can collect logs and metrics from Kafka in just 2 minutes. Here is the official [documentation](https://betterstack.com/docs/logs/kafka/)
on how to do it.
Are you already using another log forwarder that you’re used to? See the documentation for [Fluent Bit](https://betterstack.com/docs/logs/fluent-bit/)
, [Logstash](https://betterstack.com/docs/logs/logstash/)
, [Fluentd](https://betterstack.com/docs/logs/fluentd/)
, [Filebeat](https://betterstack.com/docs/logs/filebeat/)
, [Syslog](https://betterstack.com/docs/logs/syslog-setup/)
, and [others](https://betterstack.com/docs/logs/start/)
.
### Have any questions?
Please feel free to message us at [hello@betterstack.com](mailto:hello@betterstack.com?subject=Question%20about%20Better%20Stack&body=)
.
We'll get back to you as soon as we can, typically within a few hours. 🙏 Thank you!
* * *
#### You might also like
[\
\
### Memcached\
\
Monitor Memcached caching server performance and hit rates.](https://betterstack.com/dashboards/memcached)
[\
\
### Cloudflare HTTP Requests\
\
Use custom Cloudflare Worker code to log HTTP requests.](https://betterstack.com/dashboards/cloudflare-worker)

### Please accept cookies
We use cookies to authenticate users, improve the product user experience, and for [personalized ads](https://business.safety.google/privacy/)
. [Learn more.](https://betterstack.com/privacy)
Deny Accept required Accept all
---
# Host overview dashboard template | Better Stack
[Back to dashboards](https://betterstack.com/dashboards)
Host overview
=============
Monitor your server infrastructure with comprehensive host metrics.
[Add dashboard](https://telemetry.betterstack.com/team/0/dashboards#template-95579)

Data source
System Metrics
* * *

Overview
--------
This is a ready-made Host overview Telemetry dashboard in Better Stack.
To get it, [sign up](https://betterstack.com/users/sign-up)
for Better Stack, [connect your log or metrics source](https://betterstack.com/docs/logs/logging-start/)
, and select one of the beautiful [pre-built dashboards](https://betterstack.com/dashboards)
you want to get.
### What charts are included
* CPU usage
* Memory usage
* Disk usage
* Network traffic
* System load
* And much more, explore on your own to see all the chart options.

### How to create a custom chart
Need a custom chart? You can create one by writing a regular SQL query.
Here is how to do it:
1. **Pick a chart type:** the most popular options include a line chart, bar chart, pie chart, a single number, and a live tail (a stream of the newest logs).
2. **Pick a source and timeframe:** we use [variables](https://betterstack.com/docs/logs/dashboards/variables/)
in the SQL queries, which makes it easy to edit and work with any query. The main variables are `source` and `timeframe`. Once you set those, as in the example above, you can use the timeframe switcher easily, and the dashboard will update automatically.
3. **Write your SQL query:** there is no need to use any specific querying language. Just write SQL like you’re used to.
**Learn more:** [How to build SQL queries in Better Stack](https://betterstack.com/docs/logs/dashboards/sql-queries/)

### How to create an alert for a metric
You can get easily alerted on irregularities before they become incidents.
Everything is fully integrated into dashboards, there is no need to set up complex workflows.
Here are the most popular alert types:
* **Threshold Alerts:** Perfect for scenarios where you need to be notified when a metric crosses a certain predefined threshold. For instance, if your application's response time exceeds a set limit, you’ll get an alert.
* **Relative Alerts:** Want to monitor changes in metrics relative to their historical data? Whether it's an unexpected drop in sales, a surge in new user signups, or any other relative metric anomaly, we've got you covered.
* **Anomaly detection:** Use this alerting method if you're unsure about what threshold to set. It will notify you about any significant deviation from the predicted value of the series. Think of this method as covering what you didn’t even know can occur.
**Learn more:** [How to use alerts in Better Stack](https://betterstack.com/docs/logs/dashboards/alerts/)

### How to receive notification about issues
Once you set up what metric irregularities you want to get alerted to, you can select a broad spectrum of notification options.
The most popular include Slack, Microsoft Teams, Phone calls, SMS, emails, webhooks, and more.
The best part is that notifications within Better Stack are unlimited. This way, you don’t have to worry about being charged extra in case of significant incidents.
**Learn more:** [How to use escalation policies in Better Stack](https://betterstack.com/docs/uptime/escalation-policies/)
### How to set up your Host overview dashboard
Once you’ve signed up for [Better Stack](https://betterstack.com/logs)
, you can collect logs and metrics from Host overview in just 2 minutes. Here is the official [documentation](https://betterstack.com/docs/logs/collector/)
on how to do it.
Are you already using another log forwarder that you’re used to? See the documentation for [Fluent Bit](https://betterstack.com/docs/logs/fluent-bit/)
, [Logstash](https://betterstack.com/docs/logs/logstash/)
, [Fluentd](https://betterstack.com/docs/logs/fluentd/)
, [Filebeat](https://betterstack.com/docs/logs/filebeat/)
, [Syslog](https://betterstack.com/docs/logs/syslog-setup/)
, and [others](https://betterstack.com/docs/logs/start/)
.
### Have any questions?
Please feel free to message us at [hello@betterstack.com](mailto:hello@betterstack.com?subject=Question%20about%20Better%20Stack&body=)
.
We'll get back to you as soon as we can, typically within a few hours. 🙏 Thank you!
* * *
#### You might also like
[\
\
### AWS Lambda\
\
Serverless compute service that runs code in response to events.](https://betterstack.com/dashboards/aws-lambda)
[\
\
### Cloudflare HTTP Requests\
\
Use custom Cloudflare Worker code to log HTTP requests.](https://betterstack.com/dashboards/cloudflare-worker)

### Please accept cookies
We use cookies to authenticate users, improve the product user experience, and for [personalized ads](https://business.safety.google/privacy/)
. [Learn more.](https://betterstack.com/privacy)
Deny Accept required Accept all
---
# Uptime Monitoring by Better Stack
The most reliable uptime monitoring
===================================
Get 10 monitors, 10 heartbeats and a status page with 3-minute checks totally free.
Get started in 30 seconds
Looking for an enterprise solution? [Book a demo](https://betterstack.com/book-a-demo)
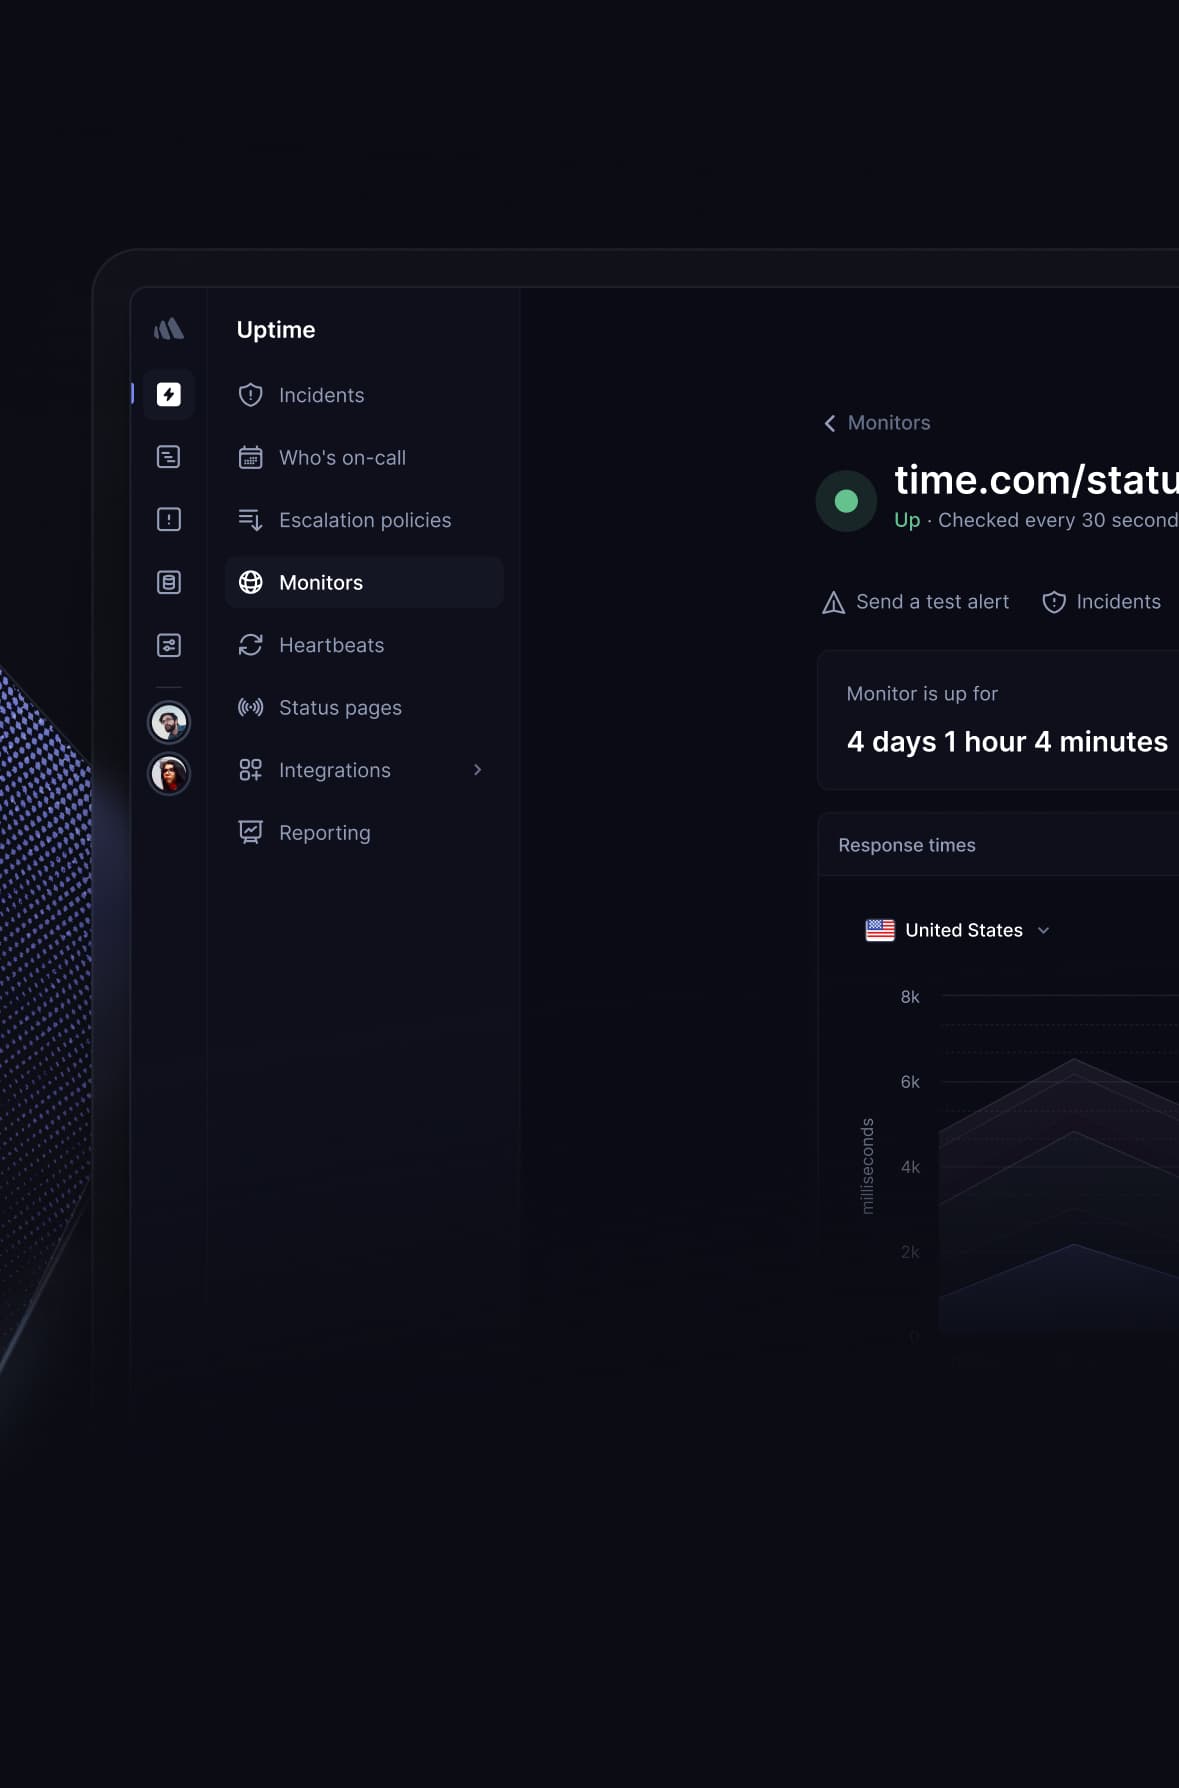 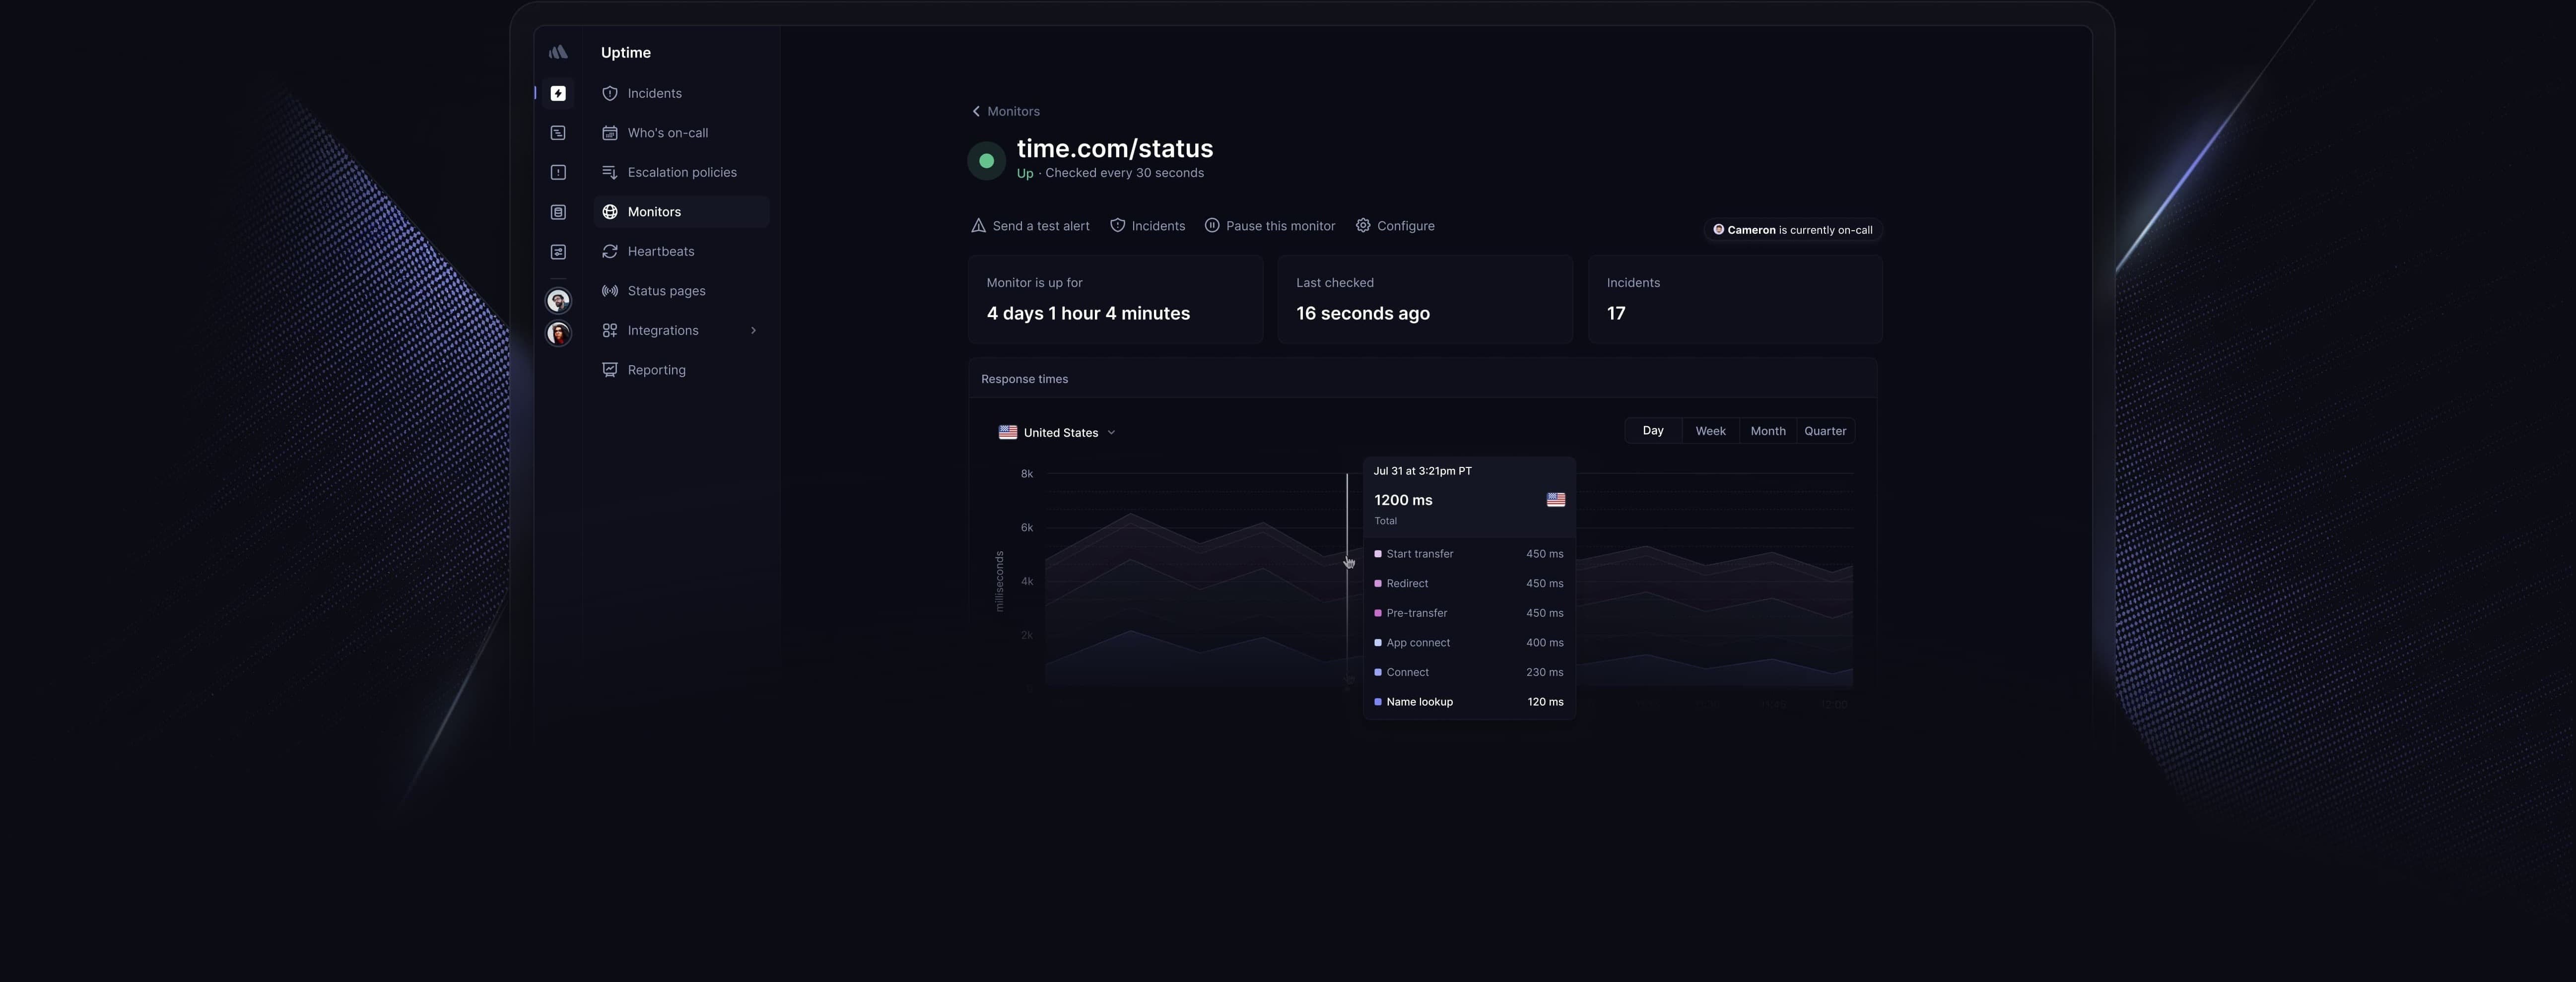
Relied on by the world’s best engineering teams
Best-in-class uptime monitoring. No false positives.
----------------------------------------------------
Get a screenshot of the error and a second-by-second timeline with our fastest 30-second checks.
[Explore website monitoring](https://betterstack.com/website-monitoring)
 
### Traceroute & MTR for timeouts
Understand connection timeouts and request timeouts with edge-based traceroute and MTR outputs.


#### Screenshots & error logs
We record your API's error message and take a screenshot of your website being down so that you know exactly what happened.

#### Playwright transaction monitoring
We test all vital interactions by running a real Chrome browser instance, with a full-fledged JavaScript runtime.

##### From SSL to domain expiration
Monitor everything. Whether it's your web page, API, ping, SSL, domain expiration, POP3, IMAP, SMTP, DNS, or generic network monitoring. We've got you covered.

##### 30s checks from around the world
Get a screenshot of the error and a second-by-second timeline with our fastest 30-second checks.

##### Cron monitoring
Never lose a database backup again. Track your CRON jobs and serverless workers and get alerted if they don't run correctly.
* * *
A lot more than uptime monitoring. Batteries included.
------------------------------------------------------
Get all the debug data you need and collaborate with your colleagues on fixing the root cause of the incident.
[Explore incident management](https://betterstack.com/incident-management)

### Smart incident merging
30 incidents get created at the same time. Acknowledge them with a single tap and stop your phone from ringing.

#### Flexible incident escalations
Configure complex rules for escalating incidents based on time, team availability, and incident origin.

#### Unlimited voice call alerts
As well as SMS, e-mail, Slack, Teams, and push notifications with our all-you-can-alert pricing.
Elegant status page
-------------------
Build confidence in your product by sharing your system status at status.yourdomain.com.
[Explore status page](https://betterstack.com/status-page)

### Share incident updates
Communicate ongoing incidents, planned maintenance, and service degradations.

#### Custom status.yourdomain.com
Host a branded status page on your own custom subdomain and build confidence in your brand.

#### Subscribe to updates
Let your customers subscribe to email updates so that they always know what's going on.
* * *
Save big with
Better Stack
----------------------------
Better Stack replaces a bunch of existing tools. See how our fixed price for unlimited monitors compares with PagerDuty, Pingdom, and Statuspage.io.
[See pricing](https://betterstack.com/pricing)

PagerDuty
Incident management
+

Pingdom
Uptime monitoring
+

Statuspage.io
Branded status page
$ 673 /mo
6 team members, 60 monitors,
and 2,000 subscribers
Incident management with on-call
Uptime monitoring built-in
Branded status page on your own sub-domain status.domain.com
$ 269 /mo
6 team members, 60 monitors,
and 2,000 subscribers
#### Don’t just take our word for it
We're proud to be working with publicly traded companies as well as individual indie hackers and are thankful for their feedback, suggestions, and support.
[@BetterStackHQ](https://twitter.com/betterstackhq)
is one of the best products I've ever used. Went from 0-100 on logging in 15 minutes. Incredible
[\
\
Conor\
\
@cnrstvns\
\
](https://twitter.com/@cnrstvns)
I tested [@BetterStackHQ](https://twitter.com/betterstackhq)
for @gamubsapp! So much easier to configure and the interface is better than @FreshworksInc!
[\
\
Quentin\
\
@glaffont\
\
](https://twitter.com/qlaffont/status/1442463552007147527)
[@BetterStackHQ](https://twitter.com/betterstackhq)
status page looks SO neat! A fantastic tool for SaaS products like @Snapodcast
[\
\
TonyHe\
\
@ttttonyhe\
\
](https://twitter.com/ttttonyhe/status/1433488160294678529)
By far [@BetterStackHQ](https://twitter.com/betterstackhq)
has given me more pleasant surprises other tool in this space. We had an outage due to a domain name expiring, and it turns out we can even be alered about that. Great user experience and UI on top of all the features. How is it not more popular?
[\
\
John\
\
@johncjago\
\
](https://twitter.com/johncjago/status/1462624489284513793)
One year one tool. @linear won my heart last year. This year so far, [@BetterStackHQ](https://twitter.com/betterstackhq)
is the frontrunner, well designed 👏
[\
\
Tianzhou\
\
@tianzhouchen\
\
](https://twitter.com/tianzhouchen/status/1441046890502520835)
I just checked this out, and have never been so happy that I saw an ad 👏
[\
\
Chris\
\
@chrishow\
\
](https://twitter.com/chrislhow/status/1417794338130698240)
Looking for a status page? I recommend [@BetterStackHQ](https://twitter.com/betterstackhq)
. Perfect support, answered my dms in a couple of minutes, and it's the first actual cool looking status page which allows custom domains (on the free plan 😱) haven't actually tried it, but it looks good so far.
#NotSponsor
[\
\
NeverLand\
\
@neverlandoff\
\
](https://twitter.com/neverlandoff/status/1444299269872267266)
Switched from @Statuspage to [@BetterStackHQ](https://twitter.com/betterstackhq)
over the week end, looking pretty good status.speakbox.ca
[\
\
Valentin Prugnaud 🦊\
\
@valentinprgnd\
\
](https://twitter.com/valentinprgnd/status/1435163698201464832)
What are you using for logging and incident management?
For me the go to is currently [@BetterStackHQ](https://twitter.com/betterstackhq)
- love their simplicity and powerful features. Would like to learn more about what's out there.
[\
\
Markus Leimer\
\
@markuslei22\
\
](https://x.com/markuslei22/status/1781299692254765185)
I'm utterly blown away by [@BetterStackHQ](https://twitter.com/betterstackhq)
! They do everything. I'm now monitoring one of our US servers for every kind of log Ubuntu creates, custom alerts for errors, website downtime, incident logging, Slack notifications, S3 log storage, and loads more. 😍
[\
\
Darren Pinder\
\
@dmpinder\
\
](https://twitter.com/dmpinder/status/1446246301407105033)
I absolutely love services like [@BetterStackHQ](https://twitter.com/betterstackhq)
simple, does a great job, and has a generous free plan for companies just starting out
I don't remember finding anything even close to it ~4 years ago when i was looking for a monitoring tool for one of my projects
[\
\
kostya\
\
@nstkostyal\
\
](https://x.com/nstkostya/status/1844361763304702401)
Show more
* * *
Get started in 30 seconds
-------------------------
We call you when your website goes down.
Get started in just 30 seconds, completely for free.
Start for free
Start monitoring for free or [book a demo](https://betterstack.com/book-a-demo)
### Please accept cookies
We use cookies to authenticate users, improve the product user experience, and for [personalized ads](https://business.safety.google/privacy/)
. [Learn more.](https://betterstack.com/privacy)
Deny Accept required Accept all
---
# Website analytics dashboard template | Better Stack
[Back to dashboards](https://betterstack.com/dashboards)
Website analytics
=================
Page views, unique visitors, attribution and engagement metrics for your website.
[Add dashboard](https://telemetry.betterstack.com/team/0/dashboards#template-95604)
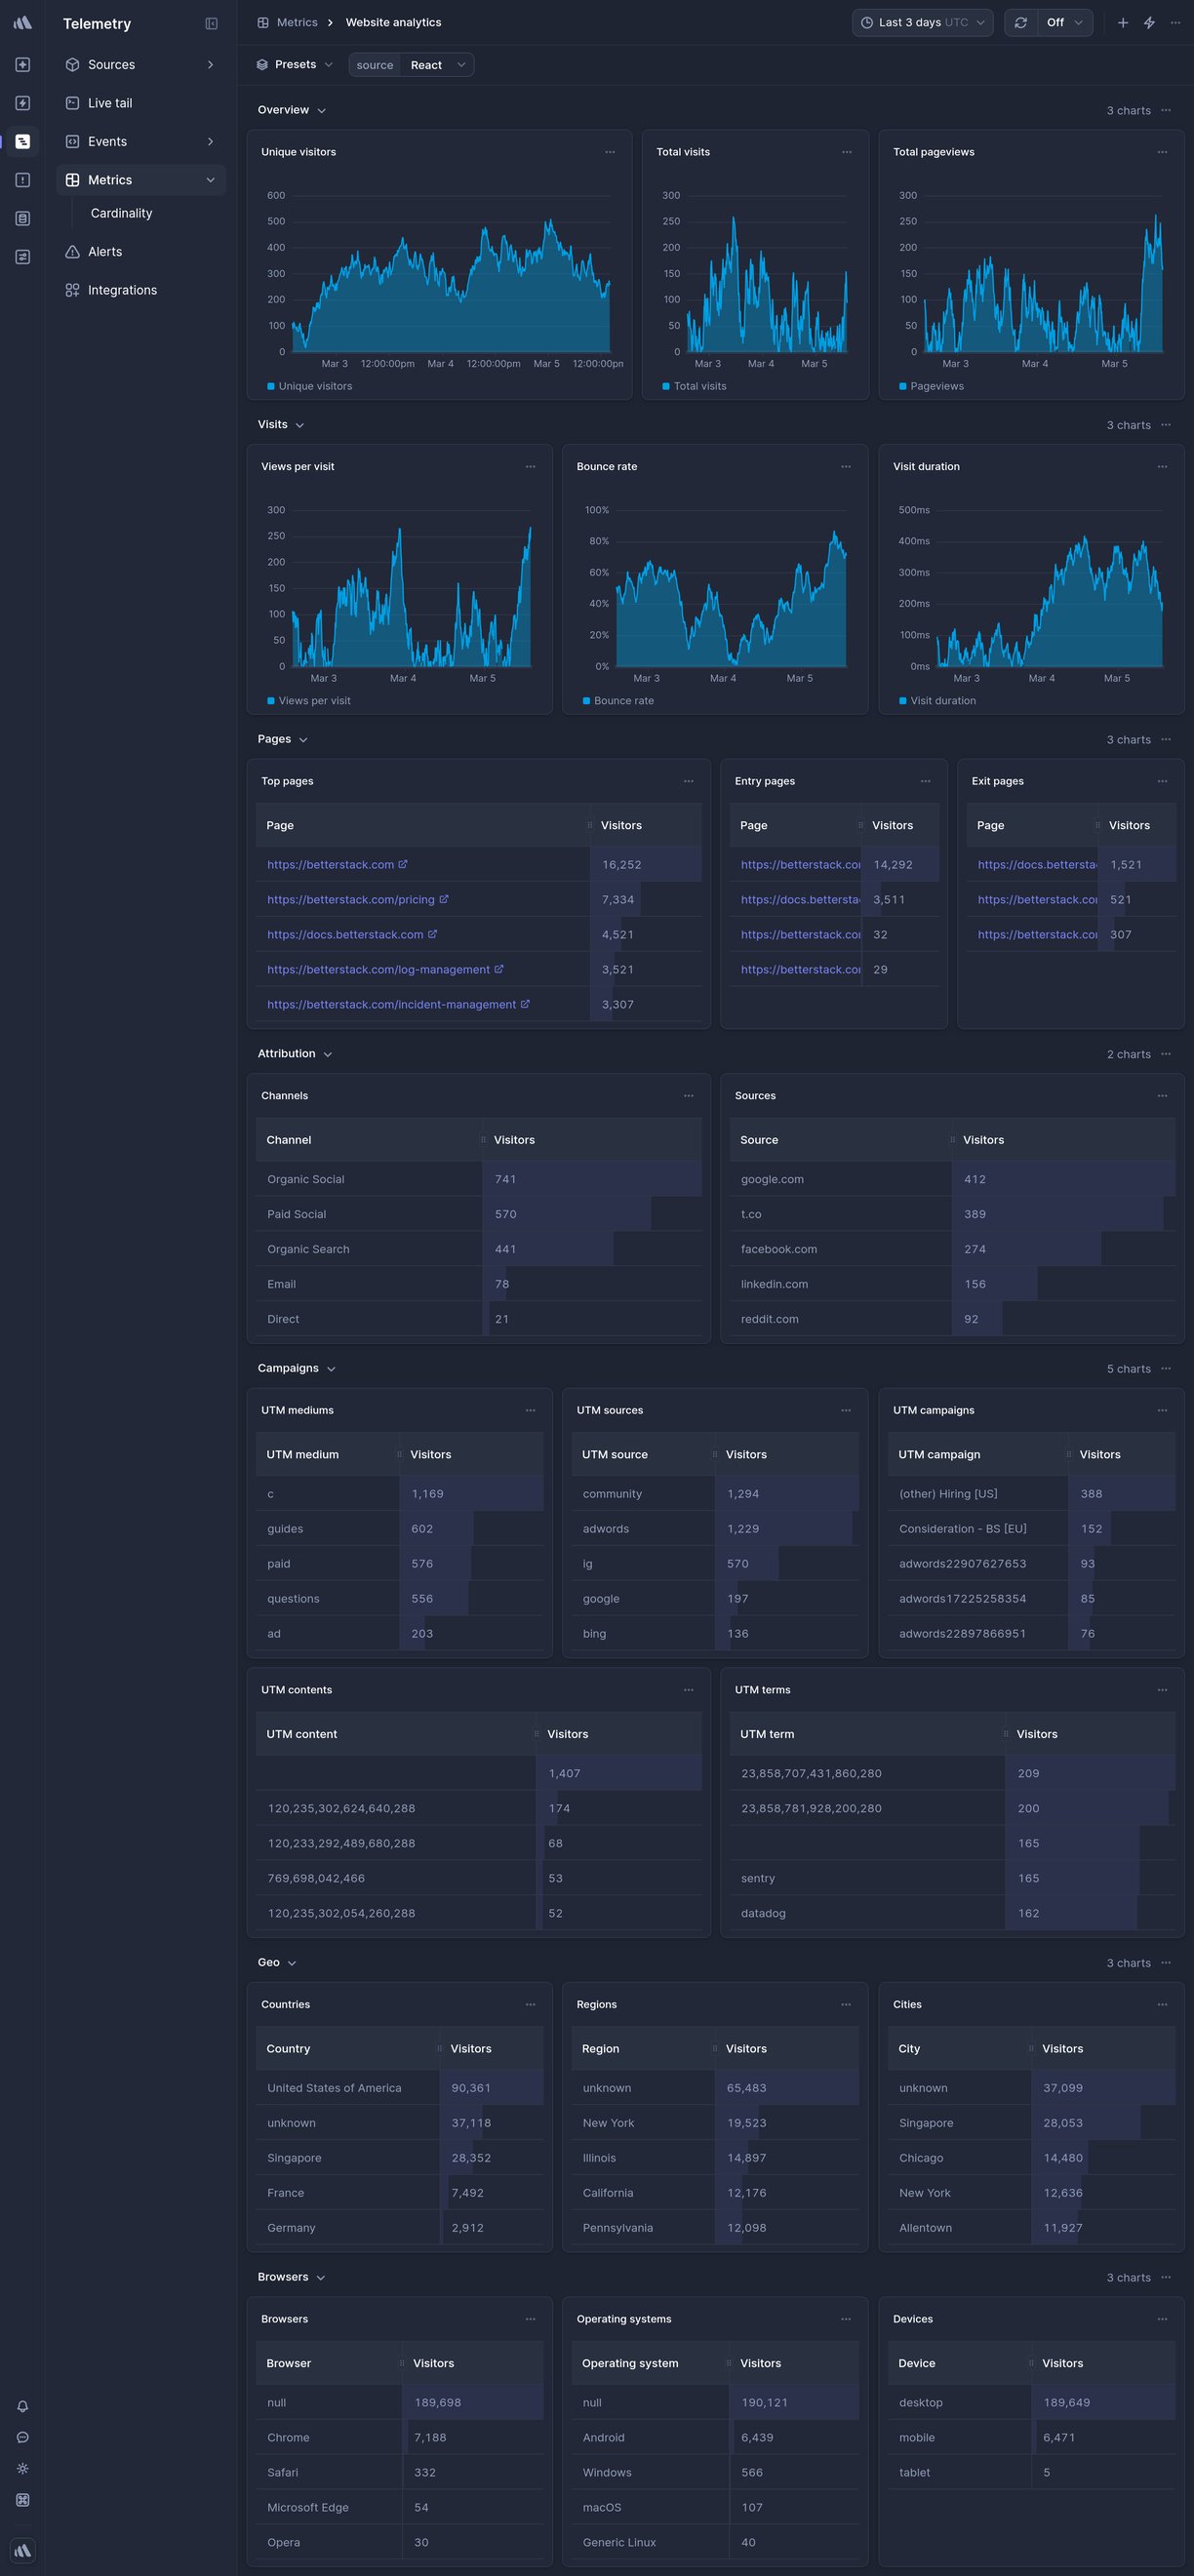
Data source
JavaScript tag
* * *

Overview
--------
This is a ready-made Website analytics Telemetry dashboard in Better Stack.
To get it, [sign up](https://betterstack.com/users/sign-up)
for Better Stack, [connect your log or metrics source](https://betterstack.com/docs/logs/logging-start/)
, and select one of the beautiful [pre-built dashboards](https://betterstack.com/dashboards)
you want to get.
### What charts are included
* Unique visitors
* Pageviews
* Attribution channels
* Traffic sources
* Visitor geolocation
* And much more, explore on your own to see all the chart options.

### How to create a custom chart
Need a custom chart? You can create one by writing a regular SQL query.
Here is how to do it:
1. **Pick a chart type:** the most popular options include a line chart, bar chart, pie chart, a single number, and a live tail (a stream of the newest logs).
2. **Pick a source and timeframe:** we use [variables](https://betterstack.com/docs/logs/dashboards/variables/)
in the SQL queries, which makes it easy to edit and work with any query. The main variables are `source` and `timeframe`. Once you set those, as in the example above, you can use the timeframe switcher easily, and the dashboard will update automatically.
3. **Write your SQL query:** there is no need to use any specific querying language. Just write SQL like you’re used to.
**Learn more:** [How to build SQL queries in Better Stack](https://betterstack.com/docs/logs/dashboards/sql-queries/)

### How to create an alert for a metric
You can get easily alerted on irregularities before they become incidents.
Everything is fully integrated into dashboards, there is no need to set up complex workflows.
Here are the most popular alert types:
* **Threshold Alerts:** Perfect for scenarios where you need to be notified when a metric crosses a certain predefined threshold. For instance, if your application's response time exceeds a set limit, you’ll get an alert.
* **Relative Alerts:** Want to monitor changes in metrics relative to their historical data? Whether it's an unexpected drop in sales, a surge in new user signups, or any other relative metric anomaly, we've got you covered.
* **Anomaly detection:** Use this alerting method if you're unsure about what threshold to set. It will notify you about any significant deviation from the predicted value of the series. Think of this method as covering what you didn’t even know can occur.
**Learn more:** [How to use alerts in Better Stack](https://betterstack.com/docs/logs/dashboards/alerts/)

### How to receive notification about issues
Once you set up what metric irregularities you want to get alerted to, you can select a broad spectrum of notification options.
The most popular include Slack, Microsoft Teams, Phone calls, SMS, emails, webhooks, and more.
The best part is that notifications within Better Stack are unlimited. This way, you don’t have to worry about being charged extra in case of significant incidents.
**Learn more:** [How to use escalation policies in Better Stack](https://betterstack.com/docs/uptime/escalation-policies/)
### How to set up your Website analytics dashboard
Once you’ve signed up for [Better Stack](https://betterstack.com/logs)
, you can collect logs and metrics from Website analytics in just 2 minutes. Here is the official [documentation](https://betterstack.com/dashboards/website-analytics)
on how to do it.
Are you already using another log forwarder that you’re used to? See the documentation for [Fluent Bit](https://betterstack.com/docs/logs/fluent-bit/)
, [Logstash](https://betterstack.com/docs/logs/logstash/)
, [Fluentd](https://betterstack.com/docs/logs/fluentd/)
, [Filebeat](https://betterstack.com/docs/logs/filebeat/)
, [Syslog](https://betterstack.com/docs/logs/syslog-setup/)
, and [others](https://betterstack.com/docs/logs/start/)
.
### Have any questions?
Please feel free to message us at [hello@betterstack.com](mailto:hello@betterstack.com?subject=Question%20about%20Better%20Stack&body=)
.
We'll get back to you as soon as we can, typically within a few hours. 🙏 Thank you!
* * *
#### You might also like
[\
\
### Cloudflare Prometheus Exporter\
\
Monitor Cloudflare metrics exported via Prometheus exporter.](https://betterstack.com/dashboards/cloudflare-prometheus-exporter)
[\
\
### Web vitals\
\
Get alerted when your Core Web Vitals decline.](https://betterstack.com/dashboards/web-vitals)

### Please accept cookies
We use cookies to authenticate users, improve the product user experience, and for [personalized ads](https://business.safety.google/privacy/)
. [Learn more.](https://betterstack.com/privacy)
Deny Accept required Accept all
---
# Web vitals dashboard template | Better Stack
[Back to dashboards](https://betterstack.com/dashboards)
Web vitals
==========
Get alerted when your Core Web Vitals decline.
[Add dashboard](https://telemetry.betterstack.com/team/0/dashboards#template-95605)
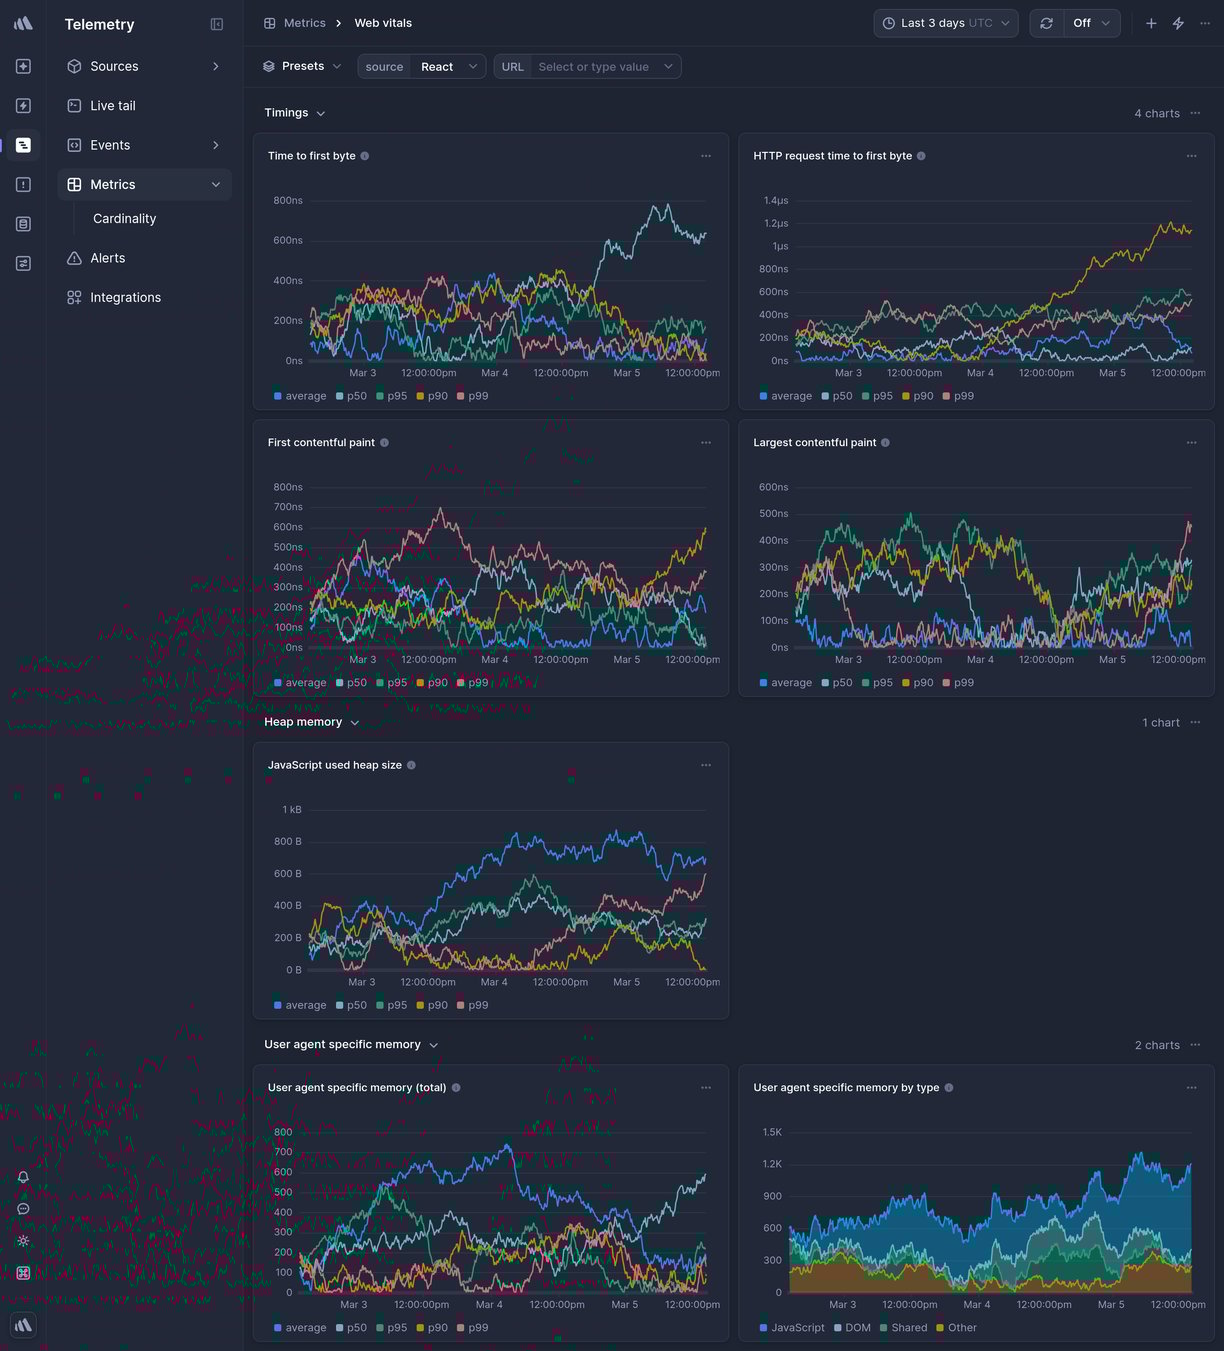
Data source
JavaScript tag
* * *

Overview
--------
This is a ready-made Web vitals Telemetry dashboard in Better Stack.
To get it, [sign up](https://betterstack.com/users/sign-up)
for Better Stack, [connect your log or metrics source](https://betterstack.com/docs/logs/logging-start/)
, and select one of the beautiful [pre-built dashboards](https://betterstack.com/dashboards)
you want to get.
### What charts are included
* First contentful paint
* Largest contentful paint
* Memory usage
* Time to first byte
* And much more, explore on your own to see all the chart options.

### How to create a custom chart
Need a custom chart? You can create one by writing a regular SQL query.
Here is how to do it:
1. **Pick a chart type:** the most popular options include a line chart, bar chart, pie chart, a single number, and a live tail (a stream of the newest logs).
2. **Pick a source and timeframe:** we use [variables](https://betterstack.com/docs/logs/dashboards/variables/)
in the SQL queries, which makes it easy to edit and work with any query. The main variables are `source` and `timeframe`. Once you set those, as in the example above, you can use the timeframe switcher easily, and the dashboard will update automatically.
3. **Write your SQL query:** there is no need to use any specific querying language. Just write SQL like you’re used to.
**Learn more:** [How to build SQL queries in Better Stack](https://betterstack.com/docs/logs/dashboards/sql-queries/)

### How to create an alert for a metric
You can get easily alerted on irregularities before they become incidents.
Everything is fully integrated into dashboards, there is no need to set up complex workflows.
Here are the most popular alert types:
* **Threshold Alerts:** Perfect for scenarios where you need to be notified when a metric crosses a certain predefined threshold. For instance, if your application's response time exceeds a set limit, you’ll get an alert.
* **Relative Alerts:** Want to monitor changes in metrics relative to their historical data? Whether it's an unexpected drop in sales, a surge in new user signups, or any other relative metric anomaly, we've got you covered.
* **Anomaly detection:** Use this alerting method if you're unsure about what threshold to set. It will notify you about any significant deviation from the predicted value of the series. Think of this method as covering what you didn’t even know can occur.
**Learn more:** [How to use alerts in Better Stack](https://betterstack.com/docs/logs/dashboards/alerts/)

### How to receive notification about issues
Once you set up what metric irregularities you want to get alerted to, you can select a broad spectrum of notification options.
The most popular include Slack, Microsoft Teams, Phone calls, SMS, emails, webhooks, and more.
The best part is that notifications within Better Stack are unlimited. This way, you don’t have to worry about being charged extra in case of significant incidents.
**Learn more:** [How to use escalation policies in Better Stack](https://betterstack.com/docs/uptime/escalation-policies/)
### How to set up your Web vitals dashboard
Once you’ve signed up for [Better Stack](https://betterstack.com/logs)
, you can collect logs and metrics from Web vitals in just 2 minutes. Here is the official [documentation](https://betterstack.com/dashboards/web-vitals)
on how to do it.
Are you already using another log forwarder that you’re used to? See the documentation for [Fluent Bit](https://betterstack.com/docs/logs/fluent-bit/)
, [Logstash](https://betterstack.com/docs/logs/logstash/)
, [Fluentd](https://betterstack.com/docs/logs/fluentd/)
, [Filebeat](https://betterstack.com/docs/logs/filebeat/)
, [Syslog](https://betterstack.com/docs/logs/syslog-setup/)
, and [others](https://betterstack.com/docs/logs/start/)
.
### Have any questions?
Please feel free to message us at [hello@betterstack.com](mailto:hello@betterstack.com?subject=Question%20about%20Better%20Stack&body=)
.
We'll get back to you as soon as we can, typically within a few hours. 🙏 Thank you!
* * *
#### You might also like
[\
\
### GCP Compute Engine\
\
Scalable virtual machine instances on Google Cloud.](https://betterstack.com/dashboards/gcp-compute-engine)
[\
\
### Host (Datadog)\
\
Monitor your server with Datadog agent.](https://betterstack.com/dashboards/datadog)

### Please accept cookies
We use cookies to authenticate users, improve the product user experience, and for [personalized ads](https://business.safety.google/privacy/)
. [Learn more.](https://betterstack.com/privacy)
Deny Accept required Accept all
---
# AWS EC2 dashboard template | Better Stack
[Back to dashboards](https://betterstack.com/dashboards)
AWS EC2
=======
Scalable virtual server instances in the AWS cloud.
[Add dashboard](https://telemetry.betterstack.com/team/0/dashboards#template-95590)
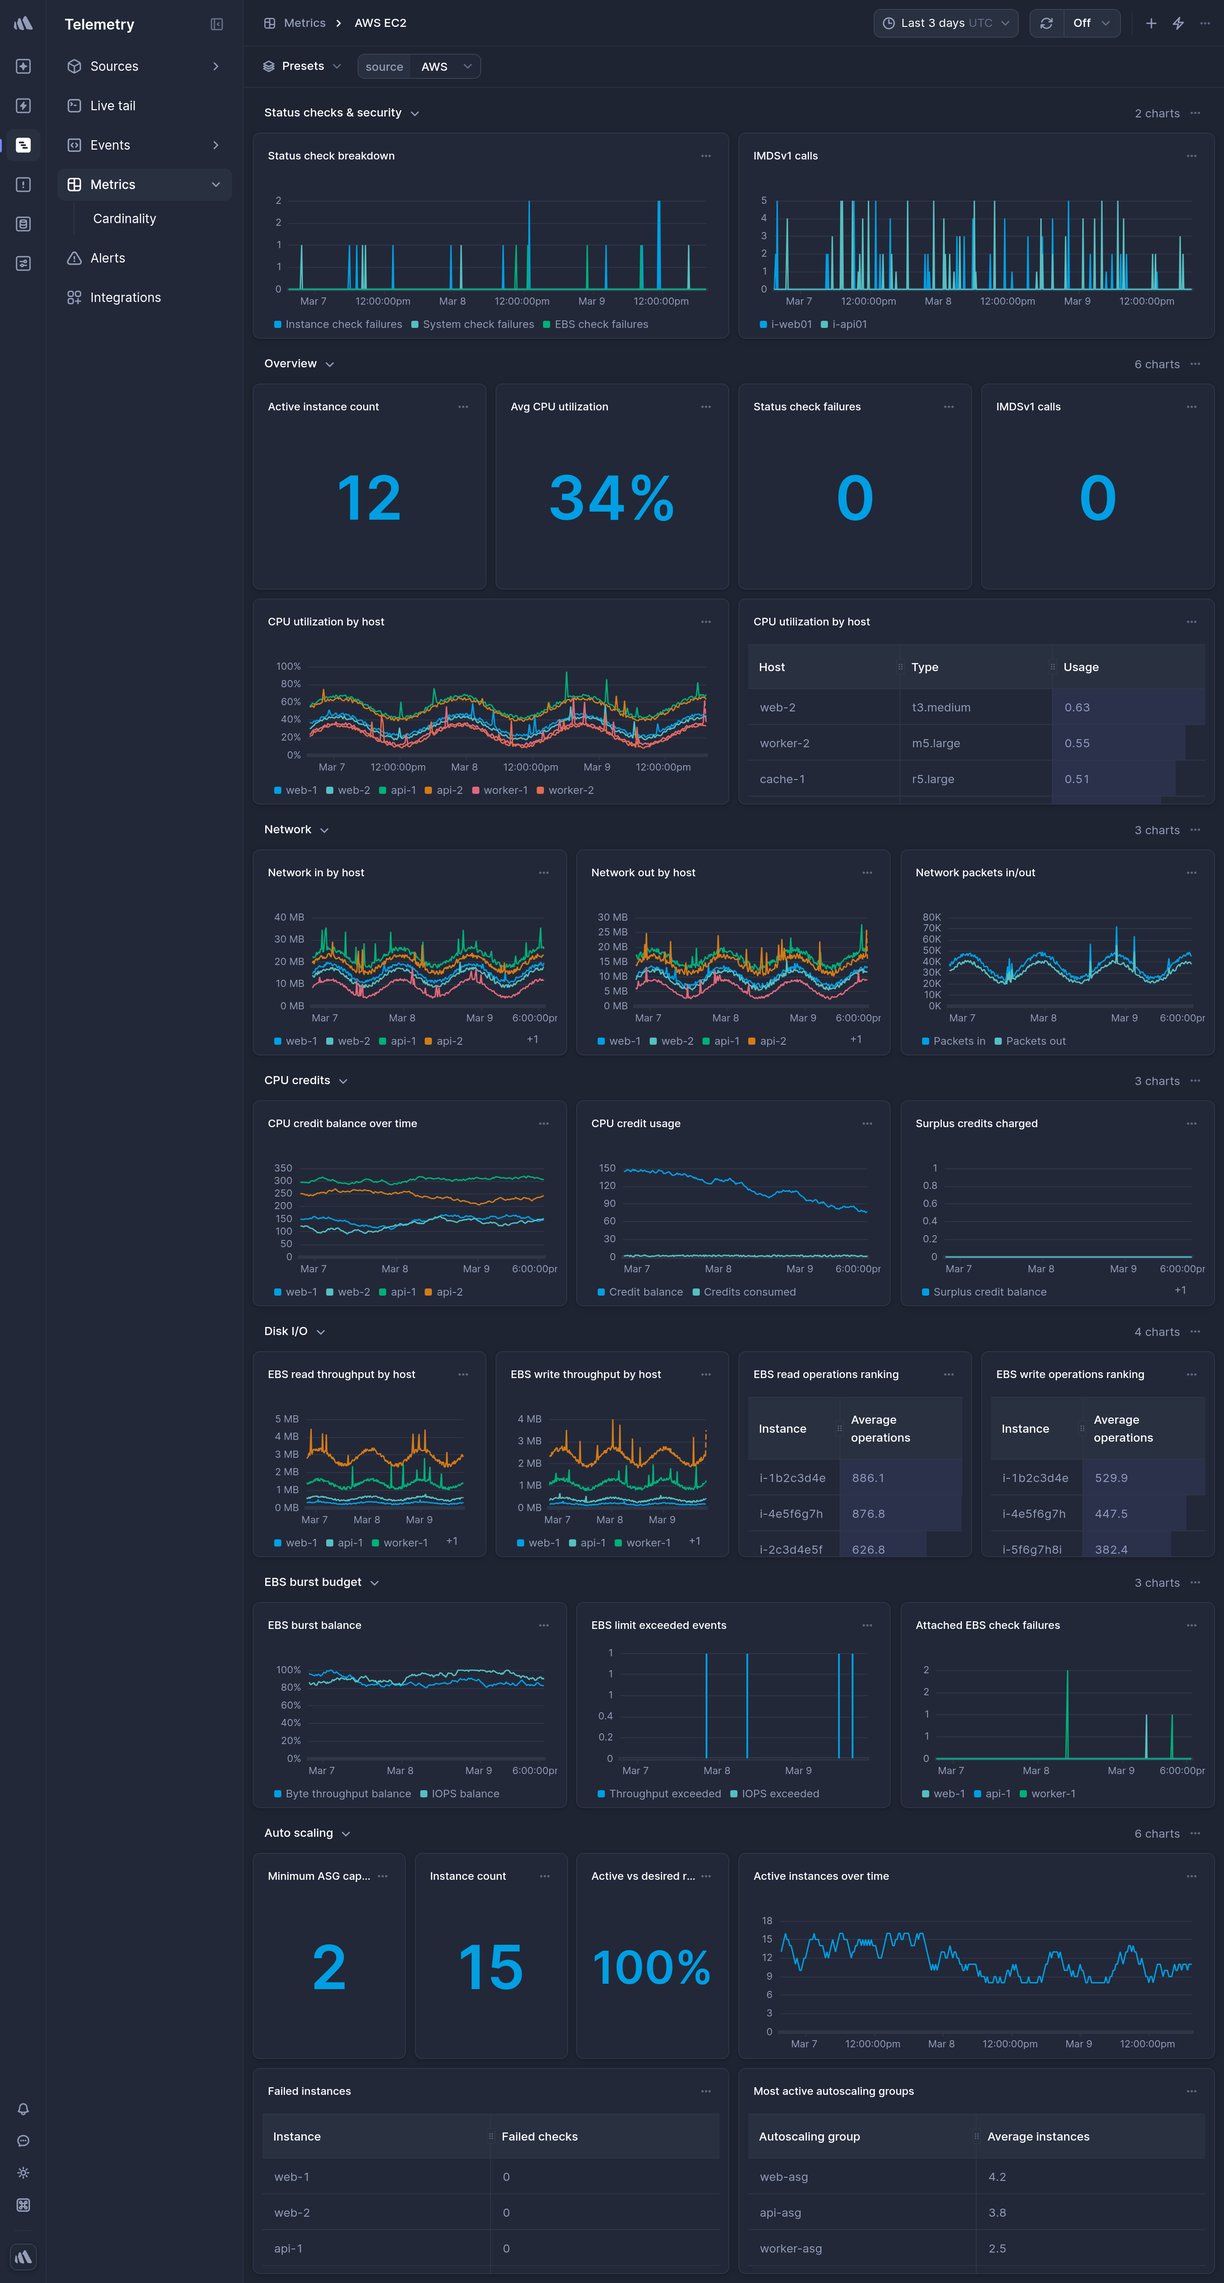
Data source
AWS CloudWatch
* * *

Overview
--------
This is a ready-made AWS EC2 Telemetry dashboard in Better Stack.
To get it, [sign up](https://betterstack.com/users/sign-up)
for Better Stack, [connect your log or metrics source](https://betterstack.com/docs/logs/logging-start/)
, and select one of the beautiful [pre-built dashboards](https://betterstack.com/dashboards)
you want to get.
### What charts are included
* CPU utilization
* Network traffic
* Disk I/O
* Status checks
* And much more, explore on your own to see all the chart options.

### How to create a custom chart
Need a custom chart? You can create one by writing a regular SQL query.
Here is how to do it:
1. **Pick a chart type:** the most popular options include a line chart, bar chart, pie chart, a single number, and a live tail (a stream of the newest logs).
2. **Pick a source and timeframe:** we use [variables](https://betterstack.com/docs/logs/dashboards/variables/)
in the SQL queries, which makes it easy to edit and work with any query. The main variables are `source` and `timeframe`. Once you set those, as in the example above, you can use the timeframe switcher easily, and the dashboard will update automatically.
3. **Write your SQL query:** there is no need to use any specific querying language. Just write SQL like you’re used to.
**Learn more:** [How to build SQL queries in Better Stack](https://betterstack.com/docs/logs/dashboards/sql-queries/)

### How to create an alert for a metric
You can get easily alerted on irregularities before they become incidents.
Everything is fully integrated into dashboards, there is no need to set up complex workflows.
Here are the most popular alert types:
* **Threshold Alerts:** Perfect for scenarios where you need to be notified when a metric crosses a certain predefined threshold. For instance, if your application's response time exceeds a set limit, you’ll get an alert.
* **Relative Alerts:** Want to monitor changes in metrics relative to their historical data? Whether it's an unexpected drop in sales, a surge in new user signups, or any other relative metric anomaly, we've got you covered.
* **Anomaly detection:** Use this alerting method if you're unsure about what threshold to set. It will notify you about any significant deviation from the predicted value of the series. Think of this method as covering what you didn’t even know can occur.
**Learn more:** [How to use alerts in Better Stack](https://betterstack.com/docs/logs/dashboards/alerts/)

### How to receive notification about issues
Once you set up what metric irregularities you want to get alerted to, you can select a broad spectrum of notification options.
The most popular include Slack, Microsoft Teams, Phone calls, SMS, emails, webhooks, and more.
The best part is that notifications within Better Stack are unlimited. This way, you don’t have to worry about being charged extra in case of significant incidents.
**Learn more:** [How to use escalation policies in Better Stack](https://betterstack.com/docs/uptime/escalation-policies/)
### How to set up your AWS EC2 dashboard
Once you’ve signed up for [Better Stack](https://betterstack.com/logs)
, you can collect logs and metrics from AWS EC2 in just 2 minutes. Here is the official [documentation](https://betterstack.com/docs/logs/aws-cloudformation/)
on how to do it.
Are you already using another log forwarder that you’re used to? See the documentation for [Fluent Bit](https://betterstack.com/docs/logs/fluent-bit/)
, [Logstash](https://betterstack.com/docs/logs/logstash/)
, [Fluentd](https://betterstack.com/docs/logs/fluentd/)
, [Filebeat](https://betterstack.com/docs/logs/filebeat/)
, [Syslog](https://betterstack.com/docs/logs/syslog-setup/)
, and [others](https://betterstack.com/docs/logs/start/)
.
### Have any questions?
Please feel free to message us at [hello@betterstack.com](mailto:hello@betterstack.com?subject=Question%20about%20Better%20Stack&body=)
.
We'll get back to you as soon as we can, typically within a few hours. 🙏 Thank you!
* * *
#### You might also like
[\
\
### GCP Compute Engine\
\
Scalable virtual machine instances on Google Cloud.](https://betterstack.com/dashboards/gcp-compute-engine)
[\
\
### AWS DynamoDB\
\
Fully managed NoSQL key-value and document database.](https://betterstack.com/dashboards/aws-dynamodb)

### Please accept cookies
We use cookies to authenticate users, improve the product user experience, and for [personalized ads](https://business.safety.google/privacy/)
. [Learn more.](https://betterstack.com/privacy)
Deny Accept required Accept all
---
# AWS ElastiCache Redis dashboard template | Better Stack
[Back to dashboards](https://betterstack.com/dashboards)
AWS ElastiCache Redis
=====================
Managed in-memory Redis-compatible cache and data store.
[Add dashboard](https://telemetry.betterstack.com/team/0/dashboards#template-95599)
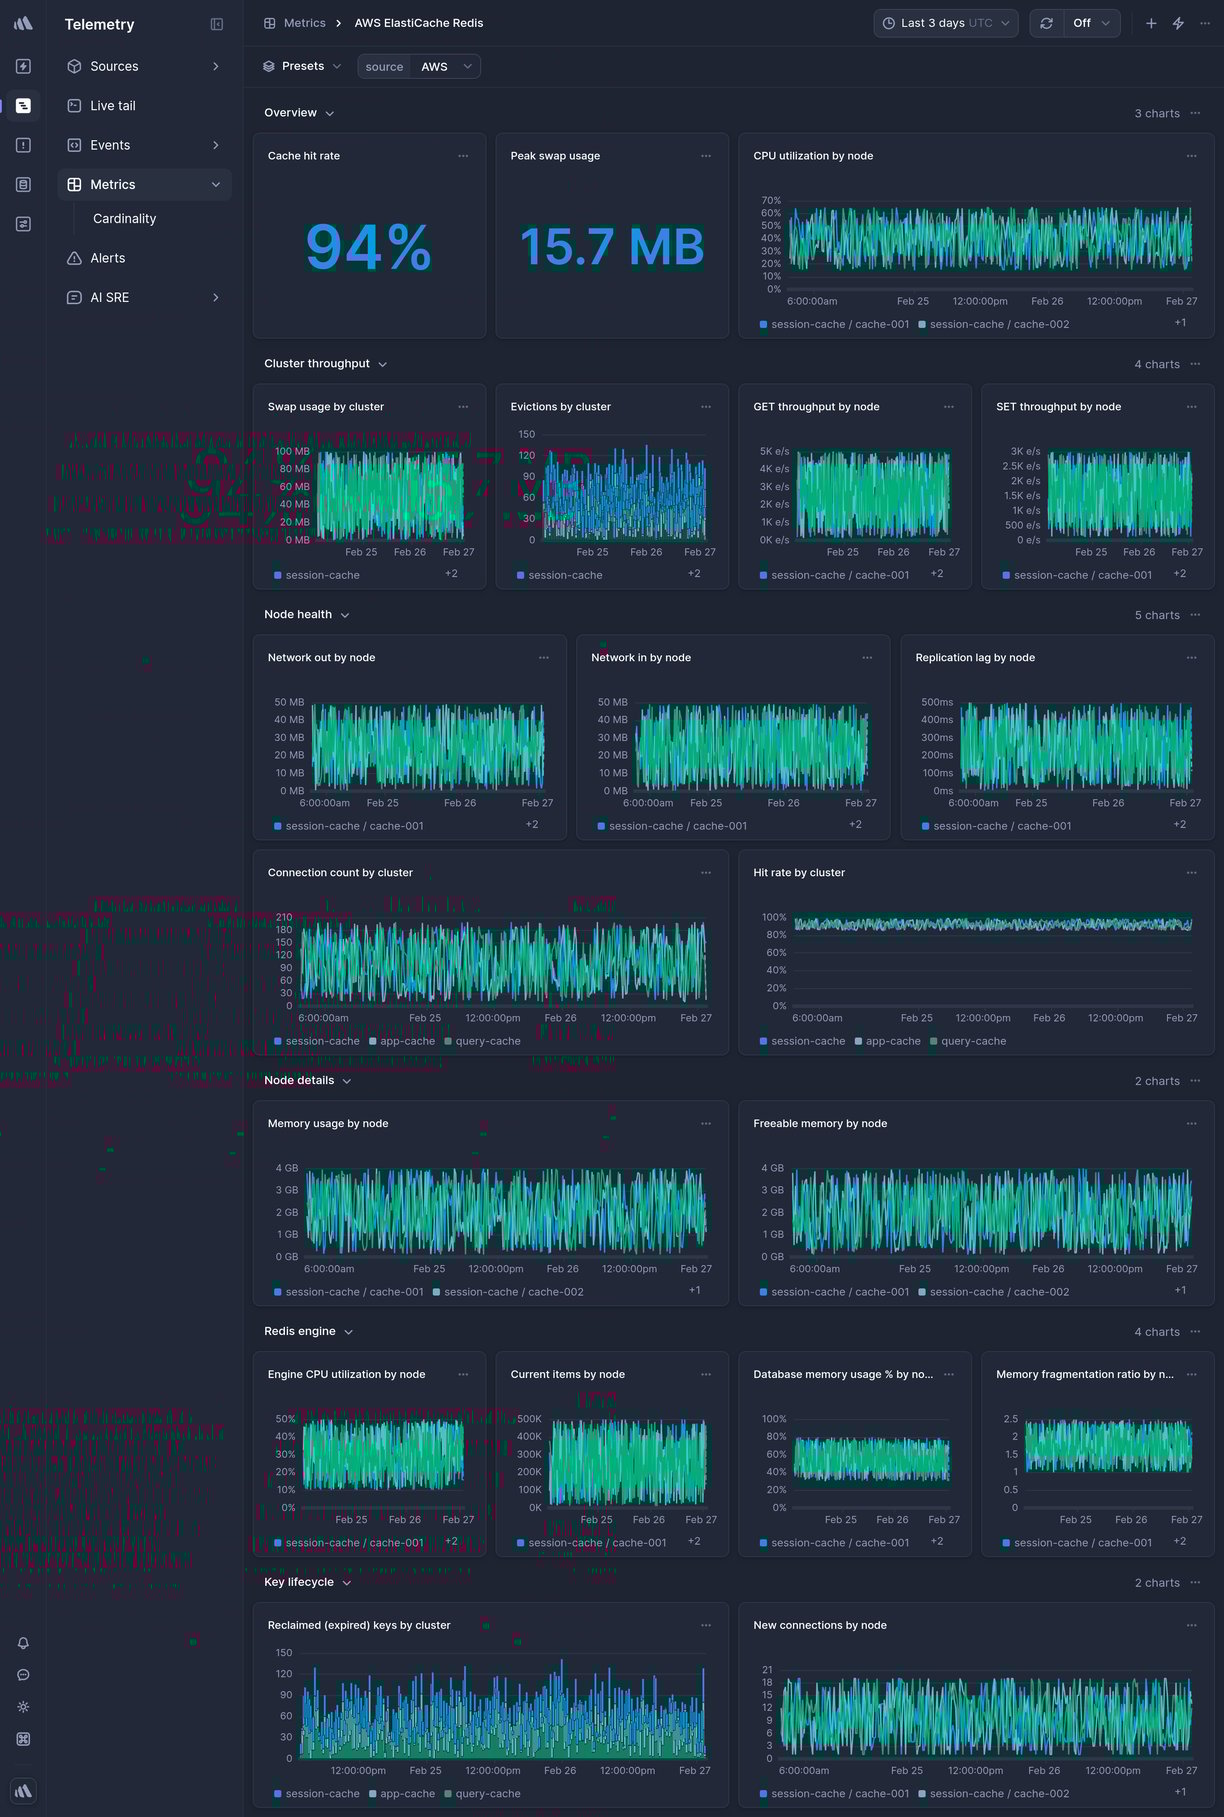
Data source
AWS CloudWatch
* * *

Overview
--------
This is a ready-made AWS ElastiCache Redis Telemetry dashboard in Better Stack.
To get it, [sign up](https://betterstack.com/users/sign-up)
for Better Stack, [connect your log or metrics source](https://betterstack.com/docs/logs/logging-start/)
, and select one of the beautiful [pre-built dashboards](https://betterstack.com/dashboards)
you want to get.
### What charts are included
* Cache hits
* Cache misses
* Replication lag
* Current connections
* And much more, explore on your own to see all the chart options.

### How to create a custom chart
Need a custom chart? You can create one by writing a regular SQL query.
Here is how to do it:
1. **Pick a chart type:** the most popular options include a line chart, bar chart, pie chart, a single number, and a live tail (a stream of the newest logs).
2. **Pick a source and timeframe:** we use [variables](https://betterstack.com/docs/logs/dashboards/variables/)
in the SQL queries, which makes it easy to edit and work with any query. The main variables are `source` and `timeframe`. Once you set those, as in the example above, you can use the timeframe switcher easily, and the dashboard will update automatically.
3. **Write your SQL query:** there is no need to use any specific querying language. Just write SQL like you’re used to.
**Learn more:** [How to build SQL queries in Better Stack](https://betterstack.com/docs/logs/dashboards/sql-queries/)

### How to create an alert for a metric
You can get easily alerted on irregularities before they become incidents.
Everything is fully integrated into dashboards, there is no need to set up complex workflows.
Here are the most popular alert types:
* **Threshold Alerts:** Perfect for scenarios where you need to be notified when a metric crosses a certain predefined threshold. For instance, if your application's response time exceeds a set limit, you’ll get an alert.
* **Relative Alerts:** Want to monitor changes in metrics relative to their historical data? Whether it's an unexpected drop in sales, a surge in new user signups, or any other relative metric anomaly, we've got you covered.
* **Anomaly detection:** Use this alerting method if you're unsure about what threshold to set. It will notify you about any significant deviation from the predicted value of the series. Think of this method as covering what you didn’t even know can occur.
**Learn more:** [How to use alerts in Better Stack](https://betterstack.com/docs/logs/dashboards/alerts/)

### How to receive notification about issues
Once you set up what metric irregularities you want to get alerted to, you can select a broad spectrum of notification options.
The most popular include Slack, Microsoft Teams, Phone calls, SMS, emails, webhooks, and more.
The best part is that notifications within Better Stack are unlimited. This way, you don’t have to worry about being charged extra in case of significant incidents.
**Learn more:** [How to use escalation policies in Better Stack](https://betterstack.com/docs/uptime/escalation-policies/)
### How to set up your AWS ElastiCache Redis dashboard
Once you’ve signed up for [Better Stack](https://betterstack.com/logs)
, you can collect logs and metrics from AWS ElastiCache Redis in just 2 minutes. Here is the official [documentation](https://betterstack.com/docs/logs/aws-cloudformation/)
on how to do it.
Are you already using another log forwarder that you’re used to? See the documentation for [Fluent Bit](https://betterstack.com/docs/logs/fluent-bit/)
, [Logstash](https://betterstack.com/docs/logs/logstash/)
, [Fluentd](https://betterstack.com/docs/logs/fluentd/)
, [Filebeat](https://betterstack.com/docs/logs/filebeat/)
, [Syslog](https://betterstack.com/docs/logs/syslog-setup/)
, and [others](https://betterstack.com/docs/logs/start/)
.
### Have any questions?
Please feel free to message us at [hello@betterstack.com](mailto:hello@betterstack.com?subject=Question%20about%20Better%20Stack&body=)
.
We'll get back to you as soon as we can, typically within a few hours. 🙏 Thank you!
* * *
#### You might also like
[\
\
### Cloudflare HTTP Requests\
\
HTTP requests processed by Cloudflare. Uses http\_requests Logpush dataset.](https://betterstack.com/dashboards/cloudflare-logpush-http-requests)
[\
\
### Hosts\
\
Monitor multiple hosts and servers in your infrastructure.](https://betterstack.com/dashboards/hosts)

### Please accept cookies
We use cookies to authenticate users, improve the product user experience, and for [personalized ads](https://business.safety.google/privacy/)
. [Learn more.](https://betterstack.com/privacy)
Deny Accept required Accept all
---
# AWS RDS PostgreSQL dashboard template | Better Stack
[Back to dashboards](https://betterstack.com/dashboards)
AWS RDS PostgreSQL
==================
Managed PostgreSQL-compatible relational database on AWS.
[Add dashboard](https://telemetry.betterstack.com/team/0/dashboards#template-95597)
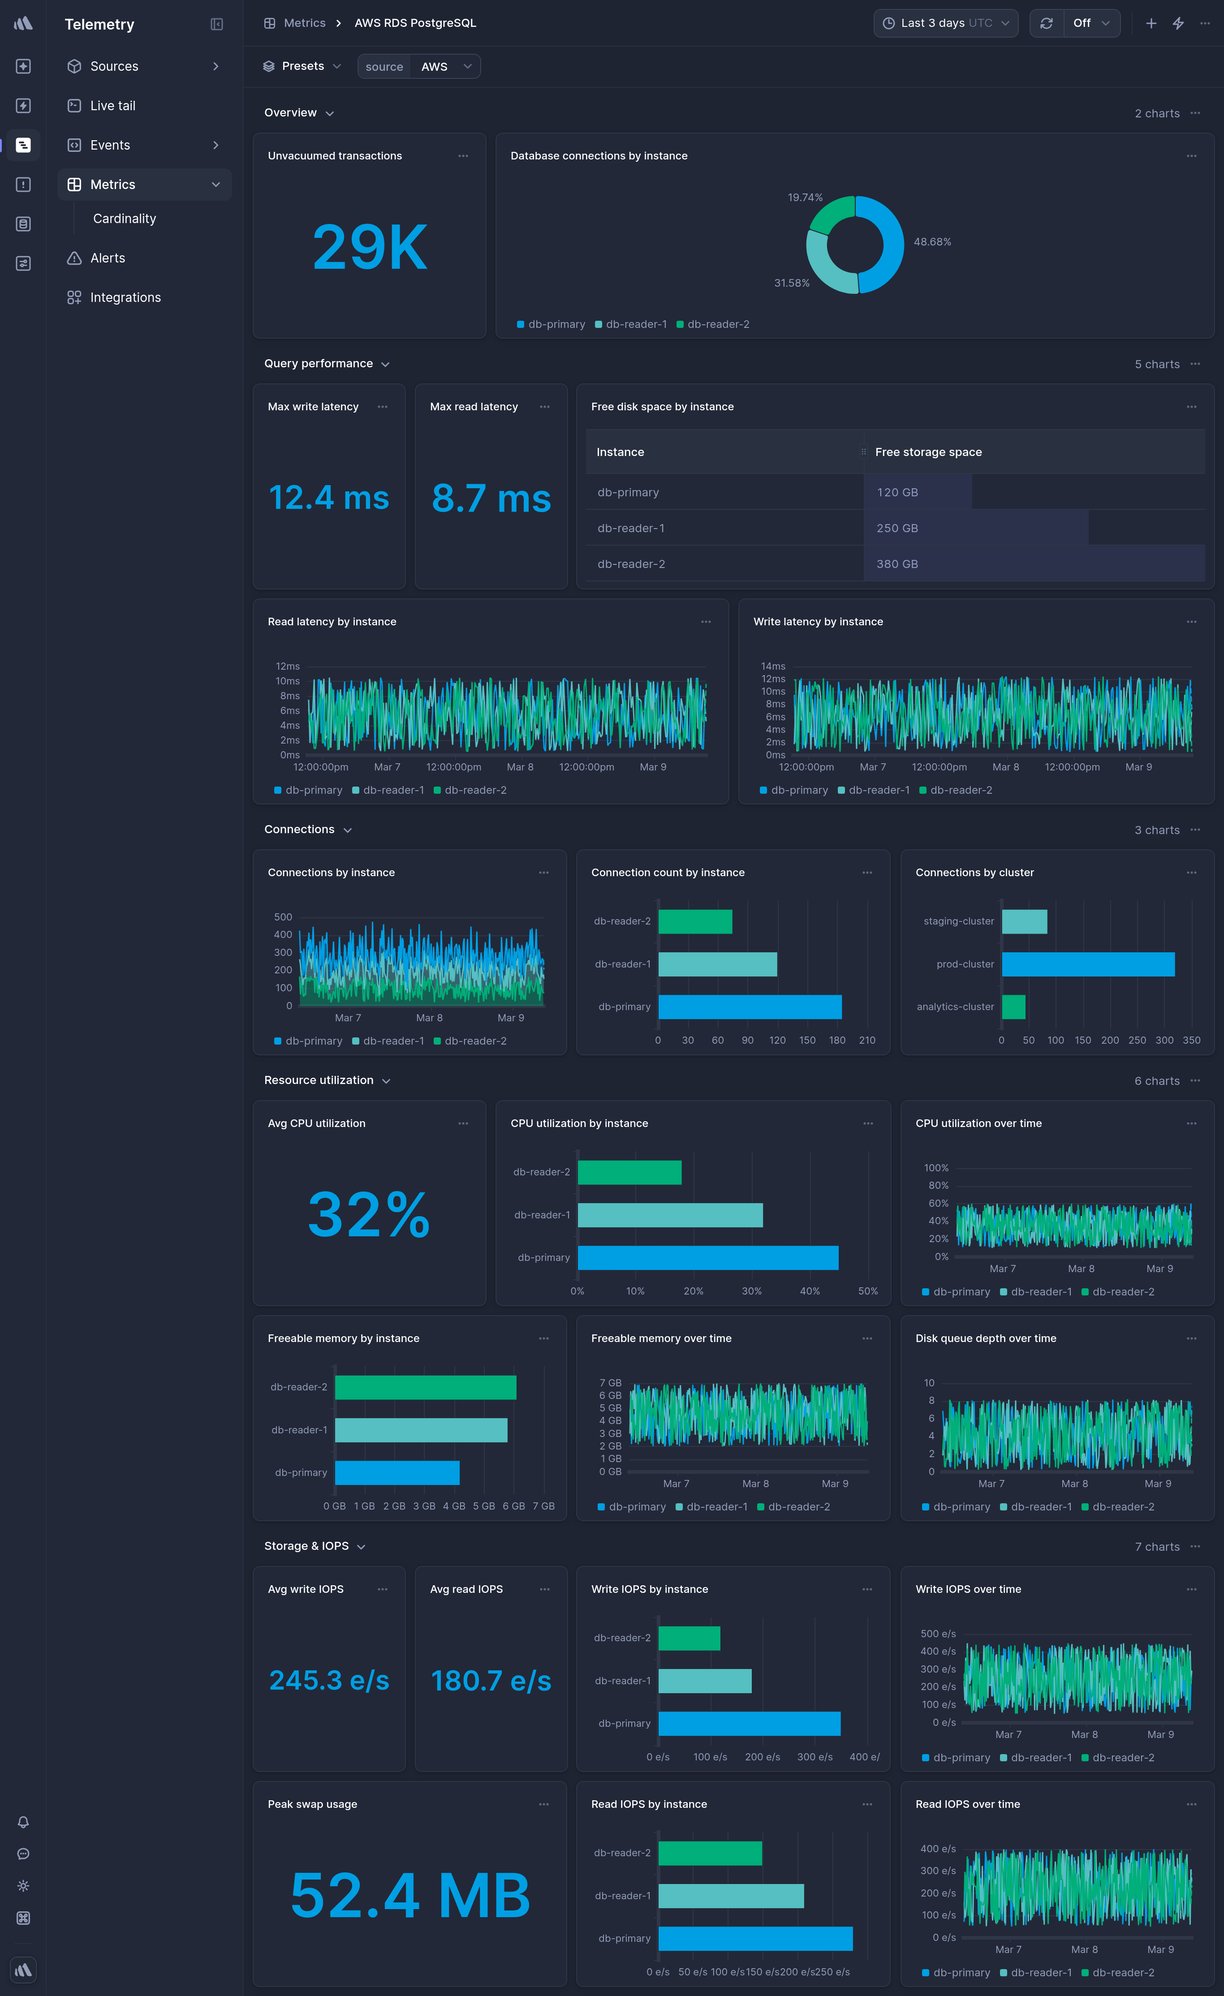
Data source
AWS CloudWatch
* * *

Overview
--------
This is a ready-made AWS RDS PostgreSQL Telemetry dashboard in Better Stack.
To get it, [sign up](https://betterstack.com/users/sign-up)
for Better Stack, [connect your log or metrics source](https://betterstack.com/docs/logs/logging-start/)
, and select one of the beautiful [pre-built dashboards](https://betterstack.com/dashboards)
you want to get.
### What charts are included
* CPU utilization
* Database connections
* Read/Write IOPS
* Free storage space
* And much more, explore on your own to see all the chart options.

### How to create a custom chart
Need a custom chart? You can create one by writing a regular SQL query.
Here is how to do it:
1. **Pick a chart type:** the most popular options include a line chart, bar chart, pie chart, a single number, and a live tail (a stream of the newest logs).
2. **Pick a source and timeframe:** we use [variables](https://betterstack.com/docs/logs/dashboards/variables/)
in the SQL queries, which makes it easy to edit and work with any query. The main variables are `source` and `timeframe`. Once you set those, as in the example above, you can use the timeframe switcher easily, and the dashboard will update automatically.
3. **Write your SQL query:** there is no need to use any specific querying language. Just write SQL like you’re used to.
**Learn more:** [How to build SQL queries in Better Stack](https://betterstack.com/docs/logs/dashboards/sql-queries/)

### How to create an alert for a metric
You can get easily alerted on irregularities before they become incidents.
Everything is fully integrated into dashboards, there is no need to set up complex workflows.
Here are the most popular alert types:
* **Threshold Alerts:** Perfect for scenarios where you need to be notified when a metric crosses a certain predefined threshold. For instance, if your application's response time exceeds a set limit, you’ll get an alert.
* **Relative Alerts:** Want to monitor changes in metrics relative to their historical data? Whether it's an unexpected drop in sales, a surge in new user signups, or any other relative metric anomaly, we've got you covered.
* **Anomaly detection:** Use this alerting method if you're unsure about what threshold to set. It will notify you about any significant deviation from the predicted value of the series. Think of this method as covering what you didn’t even know can occur.
**Learn more:** [How to use alerts in Better Stack](https://betterstack.com/docs/logs/dashboards/alerts/)

### How to receive notification about issues
Once you set up what metric irregularities you want to get alerted to, you can select a broad spectrum of notification options.
The most popular include Slack, Microsoft Teams, Phone calls, SMS, emails, webhooks, and more.
The best part is that notifications within Better Stack are unlimited. This way, you don’t have to worry about being charged extra in case of significant incidents.
**Learn more:** [How to use escalation policies in Better Stack](https://betterstack.com/docs/uptime/escalation-policies/)
### How to set up your AWS RDS PostgreSQL dashboard
Once you’ve signed up for [Better Stack](https://betterstack.com/logs)
, you can collect logs and metrics from AWS RDS PostgreSQL in just 2 minutes. Here is the official [documentation](https://betterstack.com/docs/logs/aws-cloudformation/)
on how to do it.
Are you already using another log forwarder that you’re used to? See the documentation for [Fluent Bit](https://betterstack.com/docs/logs/fluent-bit/)
, [Logstash](https://betterstack.com/docs/logs/logstash/)
, [Fluentd](https://betterstack.com/docs/logs/fluentd/)
, [Filebeat](https://betterstack.com/docs/logs/filebeat/)
, [Syslog](https://betterstack.com/docs/logs/syslog-setup/)
, and [others](https://betterstack.com/docs/logs/start/)
.
### Have any questions?
Please feel free to message us at [hello@betterstack.com](mailto:hello@betterstack.com?subject=Question%20about%20Better%20Stack&body=)
.
We'll get back to you as soon as we can, typically within a few hours. 🙏 Thank you!
* * *
#### You might also like
[\
\
### AWS S3\
\
Scalable object storage for data of any size.](https://betterstack.com/dashboards/aws-s3)
[\
\
### AWS RDS PostgreSQL\
\
Managed PostgreSQL-compatible relational database on AWS.](https://betterstack.com/dashboards/aws-rds-postgresql)

### Please accept cookies
We use cookies to authenticate users, improve the product user experience, and for [personalized ads](https://business.safety.google/privacy/)
. [Learn more.](https://betterstack.com/privacy)
Deny Accept required Accept all
---
# Hosts dashboard template | Better Stack
[Back to dashboards](https://betterstack.com/dashboards)
Hosts
=====
Monitor multiple hosts and servers in your infrastructure.
[Add dashboard](https://telemetry.betterstack.com/team/0/dashboards#template-95578)

Data source
System Metrics
* * *

Overview
--------
This is a ready-made Hosts Telemetry dashboard in Better Stack.
To get it, [sign up](https://betterstack.com/users/sign-up)
for Better Stack, [connect your log or metrics source](https://betterstack.com/docs/logs/logging-start/)
, and select one of the beautiful [pre-built dashboards](https://betterstack.com/dashboards)
you want to get.
### What charts are included
* Host status
* CPU usage by host
* Memory usage by host
* Network traffic by host
* And much more, explore on your own to see all the chart options.

### How to create a custom chart
Need a custom chart? You can create one by writing a regular SQL query.
Here is how to do it:
1. **Pick a chart type:** the most popular options include a line chart, bar chart, pie chart, a single number, and a live tail (a stream of the newest logs).
2. **Pick a source and timeframe:** we use [variables](https://betterstack.com/docs/logs/dashboards/variables/)
in the SQL queries, which makes it easy to edit and work with any query. The main variables are `source` and `timeframe`. Once you set those, as in the example above, you can use the timeframe switcher easily, and the dashboard will update automatically.
3. **Write your SQL query:** there is no need to use any specific querying language. Just write SQL like you’re used to.
**Learn more:** [How to build SQL queries in Better Stack](https://betterstack.com/docs/logs/dashboards/sql-queries/)

### How to create an alert for a metric
You can get easily alerted on irregularities before they become incidents.
Everything is fully integrated into dashboards, there is no need to set up complex workflows.
Here are the most popular alert types:
* **Threshold Alerts:** Perfect for scenarios where you need to be notified when a metric crosses a certain predefined threshold. For instance, if your application's response time exceeds a set limit, you’ll get an alert.
* **Relative Alerts:** Want to monitor changes in metrics relative to their historical data? Whether it's an unexpected drop in sales, a surge in new user signups, or any other relative metric anomaly, we've got you covered.
* **Anomaly detection:** Use this alerting method if you're unsure about what threshold to set. It will notify you about any significant deviation from the predicted value of the series. Think of this method as covering what you didn’t even know can occur.
**Learn more:** [How to use alerts in Better Stack](https://betterstack.com/docs/logs/dashboards/alerts/)

### How to receive notification about issues
Once you set up what metric irregularities you want to get alerted to, you can select a broad spectrum of notification options.
The most popular include Slack, Microsoft Teams, Phone calls, SMS, emails, webhooks, and more.
The best part is that notifications within Better Stack are unlimited. This way, you don’t have to worry about being charged extra in case of significant incidents.
**Learn more:** [How to use escalation policies in Better Stack](https://betterstack.com/docs/uptime/escalation-policies/)
### How to set up your Hosts dashboard
Once you’ve signed up for [Better Stack](https://betterstack.com/logs)
, you can collect logs and metrics from Hosts in just 2 minutes. Here is the official [documentation](https://betterstack.com/docs/logs/collector/)
on how to do it.
Are you already using another log forwarder that you’re used to? See the documentation for [Fluent Bit](https://betterstack.com/docs/logs/fluent-bit/)
, [Logstash](https://betterstack.com/docs/logs/logstash/)
, [Fluentd](https://betterstack.com/docs/logs/fluentd/)
, [Filebeat](https://betterstack.com/docs/logs/filebeat/)
, [Syslog](https://betterstack.com/docs/logs/syslog-setup/)
, and [others](https://betterstack.com/docs/logs/start/)
.
### Have any questions?
Please feel free to message us at [hello@betterstack.com](mailto:hello@betterstack.com?subject=Question%20about%20Better%20Stack&body=)
.
We'll get back to you as soon as we can, typically within a few hours. 🙏 Thank you!
* * *
#### You might also like
[\
\
### AWS RDS Enhanced Monitoring\
\
OS-level metrics for RDS instances at per-second granularity.](https://betterstack.com/dashboards/aws-rds-enhanced-monitoring)
[\
\
### Apache\
\
Open-source HTTP server and load balancer.](https://betterstack.com/dashboards/apache)

### Please accept cookies
We use cookies to authenticate users, improve the product user experience, and for [personalized ads](https://business.safety.google/privacy/)
. [Learn more.](https://betterstack.com/privacy)
Deny Accept required Accept all
---
# Apache dashboard template | Better Stack
[Back to dashboards](https://betterstack.com/dashboards)
Apache
======
Open-source HTTP server and load balancer.
[Add dashboard](https://telemetry.betterstack.com/team/0/dashboards#template-94548)
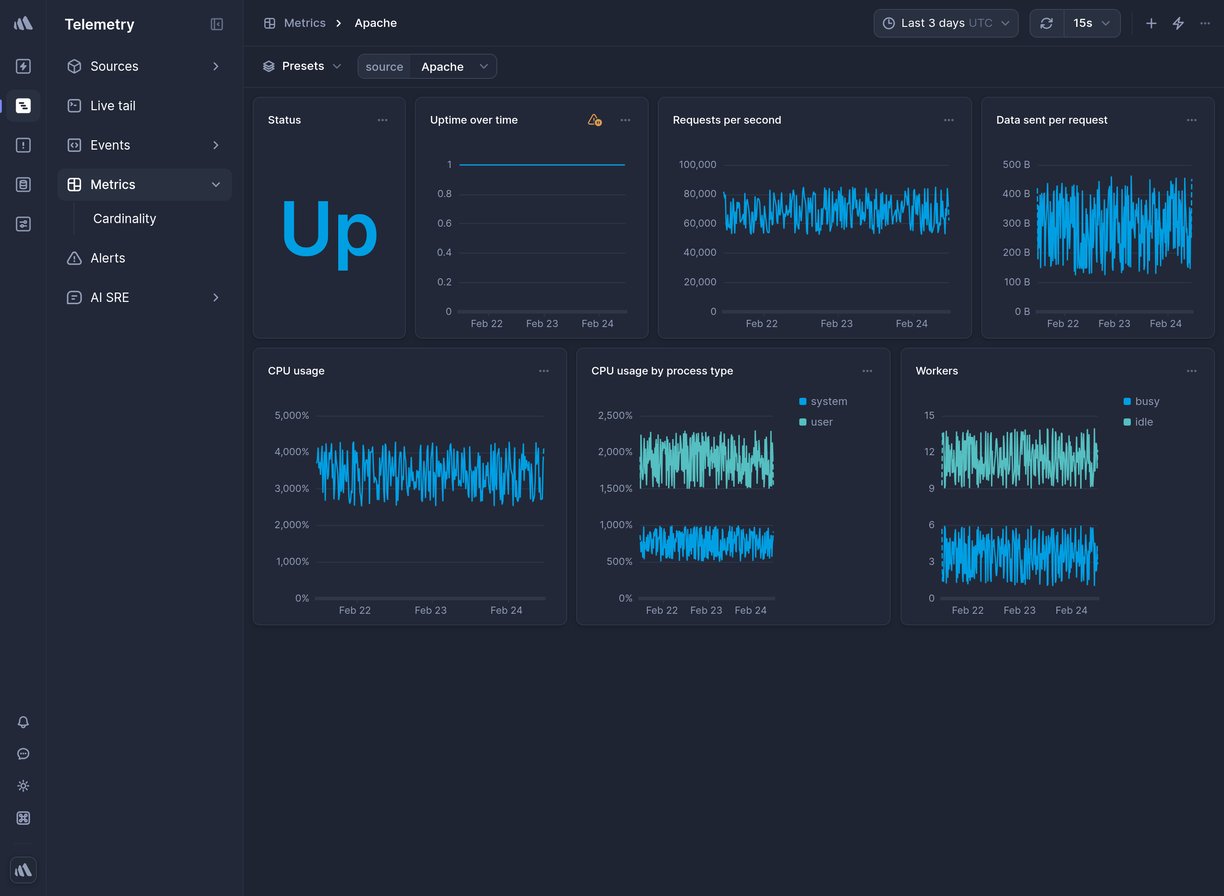
Data source
Apache
* * *

Overview
--------
This is a ready-made Apache Telemetry dashboard in Better Stack.
To get it, [sign up](https://betterstack.com/users/sign-up)
for Better Stack, [connect your log or metrics source](https://betterstack.com/docs/logs/logging-start/)
, and select one of the beautiful [pre-built dashboards](https://betterstack.com/dashboards)
you want to get.
### What charts are included
* Uptime status
* Requests per second
* Busy and idle workers
* Sent kilobytes per request
* CPU usage (%) per process
* CPU Load (%)
* And much more, explore on your own to see all the chart options.

### How to create a custom chart
Need a custom chart? You can create one by writing a regular SQL query.
Here is how to do it:
1. **Pick a chart type:** the most popular options include a line chart, bar chart, pie chart, a single number, and a live tail (a stream of the newest logs).
2. **Pick a source and timeframe:** we use [variables](https://betterstack.com/docs/logs/dashboards/variables/)
in the SQL queries, which makes it easy to edit and work with any query. The main variables are `source` and `timeframe`. Once you set those, as in the example above, you can use the timeframe switcher easily, and the dashboard will update automatically.
3. **Write your SQL query:** there is no need to use any specific querying language. Just write SQL like you’re used to.
**Learn more:** [How to build SQL queries in Better Stack](https://betterstack.com/docs/logs/dashboards/sql-queries/)

### How to create an alert for a metric
You can get easily alerted on irregularities before they become incidents.
Everything is fully integrated into dashboards, there is no need to set up complex workflows.
Here are the most popular alert types:
* **Threshold Alerts:** Perfect for scenarios where you need to be notified when a metric crosses a certain predefined threshold. For instance, if your application's response time exceeds a set limit, you’ll get an alert.
* **Relative Alerts:** Want to monitor changes in metrics relative to their historical data? Whether it's an unexpected drop in sales, a surge in new user signups, or any other relative metric anomaly, we've got you covered.
* **Anomaly detection:** Use this alerting method if you're unsure about what threshold to set. It will notify you about any significant deviation from the predicted value of the series. Think of this method as covering what you didn’t even know can occur.
**Learn more:** [How to use alerts in Better Stack](https://betterstack.com/docs/logs/dashboards/alerts/)

### How to receive notification about issues
Once you set up what metric irregularities you want to get alerted to, you can select a broad spectrum of notification options.
The most popular include Slack, Microsoft Teams, Phone calls, SMS, emails, webhooks, and more.
The best part is that notifications within Better Stack are unlimited. This way, you don’t have to worry about being charged extra in case of significant incidents.
**Learn more:** [How to use escalation policies in Better Stack](https://betterstack.com/docs/uptime/escalation-policies/)
### How to set up your Apache dashboard
Once you’ve signed up for [Better Stack](https://betterstack.com/logs)
, you can collect logs and metrics from Apache in just 2 minutes. Here is the official [documentation](https://betterstack.com/docs/logs/apache/)
on how to do it.
Are you already using another log forwarder that you’re used to? See the documentation for [Fluent Bit](https://betterstack.com/docs/logs/fluent-bit/)
, [Logstash](https://betterstack.com/docs/logs/logstash/)
, [Fluentd](https://betterstack.com/docs/logs/fluentd/)
, [Filebeat](https://betterstack.com/docs/logs/filebeat/)
, [Syslog](https://betterstack.com/docs/logs/syslog-setup/)
, and [others](https://betterstack.com/docs/logs/start/)
.
### Have any questions?
Please feel free to message us at [hello@betterstack.com](mailto:hello@betterstack.com?subject=Question%20about%20Better%20Stack&body=)
.
We'll get back to you as soon as we can, typically within a few hours. 🙏 Thank you!
* * *
#### You might also like
[\
\
### AWS RDS Enhanced Monitoring\
\
OS-level metrics for RDS instances at per-second granularity.](https://betterstack.com/dashboards/aws-rds-enhanced-monitoring)
[\
\
### Kafka\
\
Monitor Apache Kafka message broker performance and throughput.](https://betterstack.com/dashboards/kafka)

### Please accept cookies
We use cookies to authenticate users, improve the product user experience, and for [personalized ads](https://business.safety.google/privacy/)
. [Learn more.](https://betterstack.com/privacy)
Deny Accept required Accept all
---
# GCP Cloud Run dashboard template | Better Stack
[Back to dashboards](https://betterstack.com/dashboards)
GCP Cloud Run
=============
Fully managed serverless container platform on Google Cloud.
[Add dashboard](https://telemetry.betterstack.com/team/0/dashboards#template-95612)
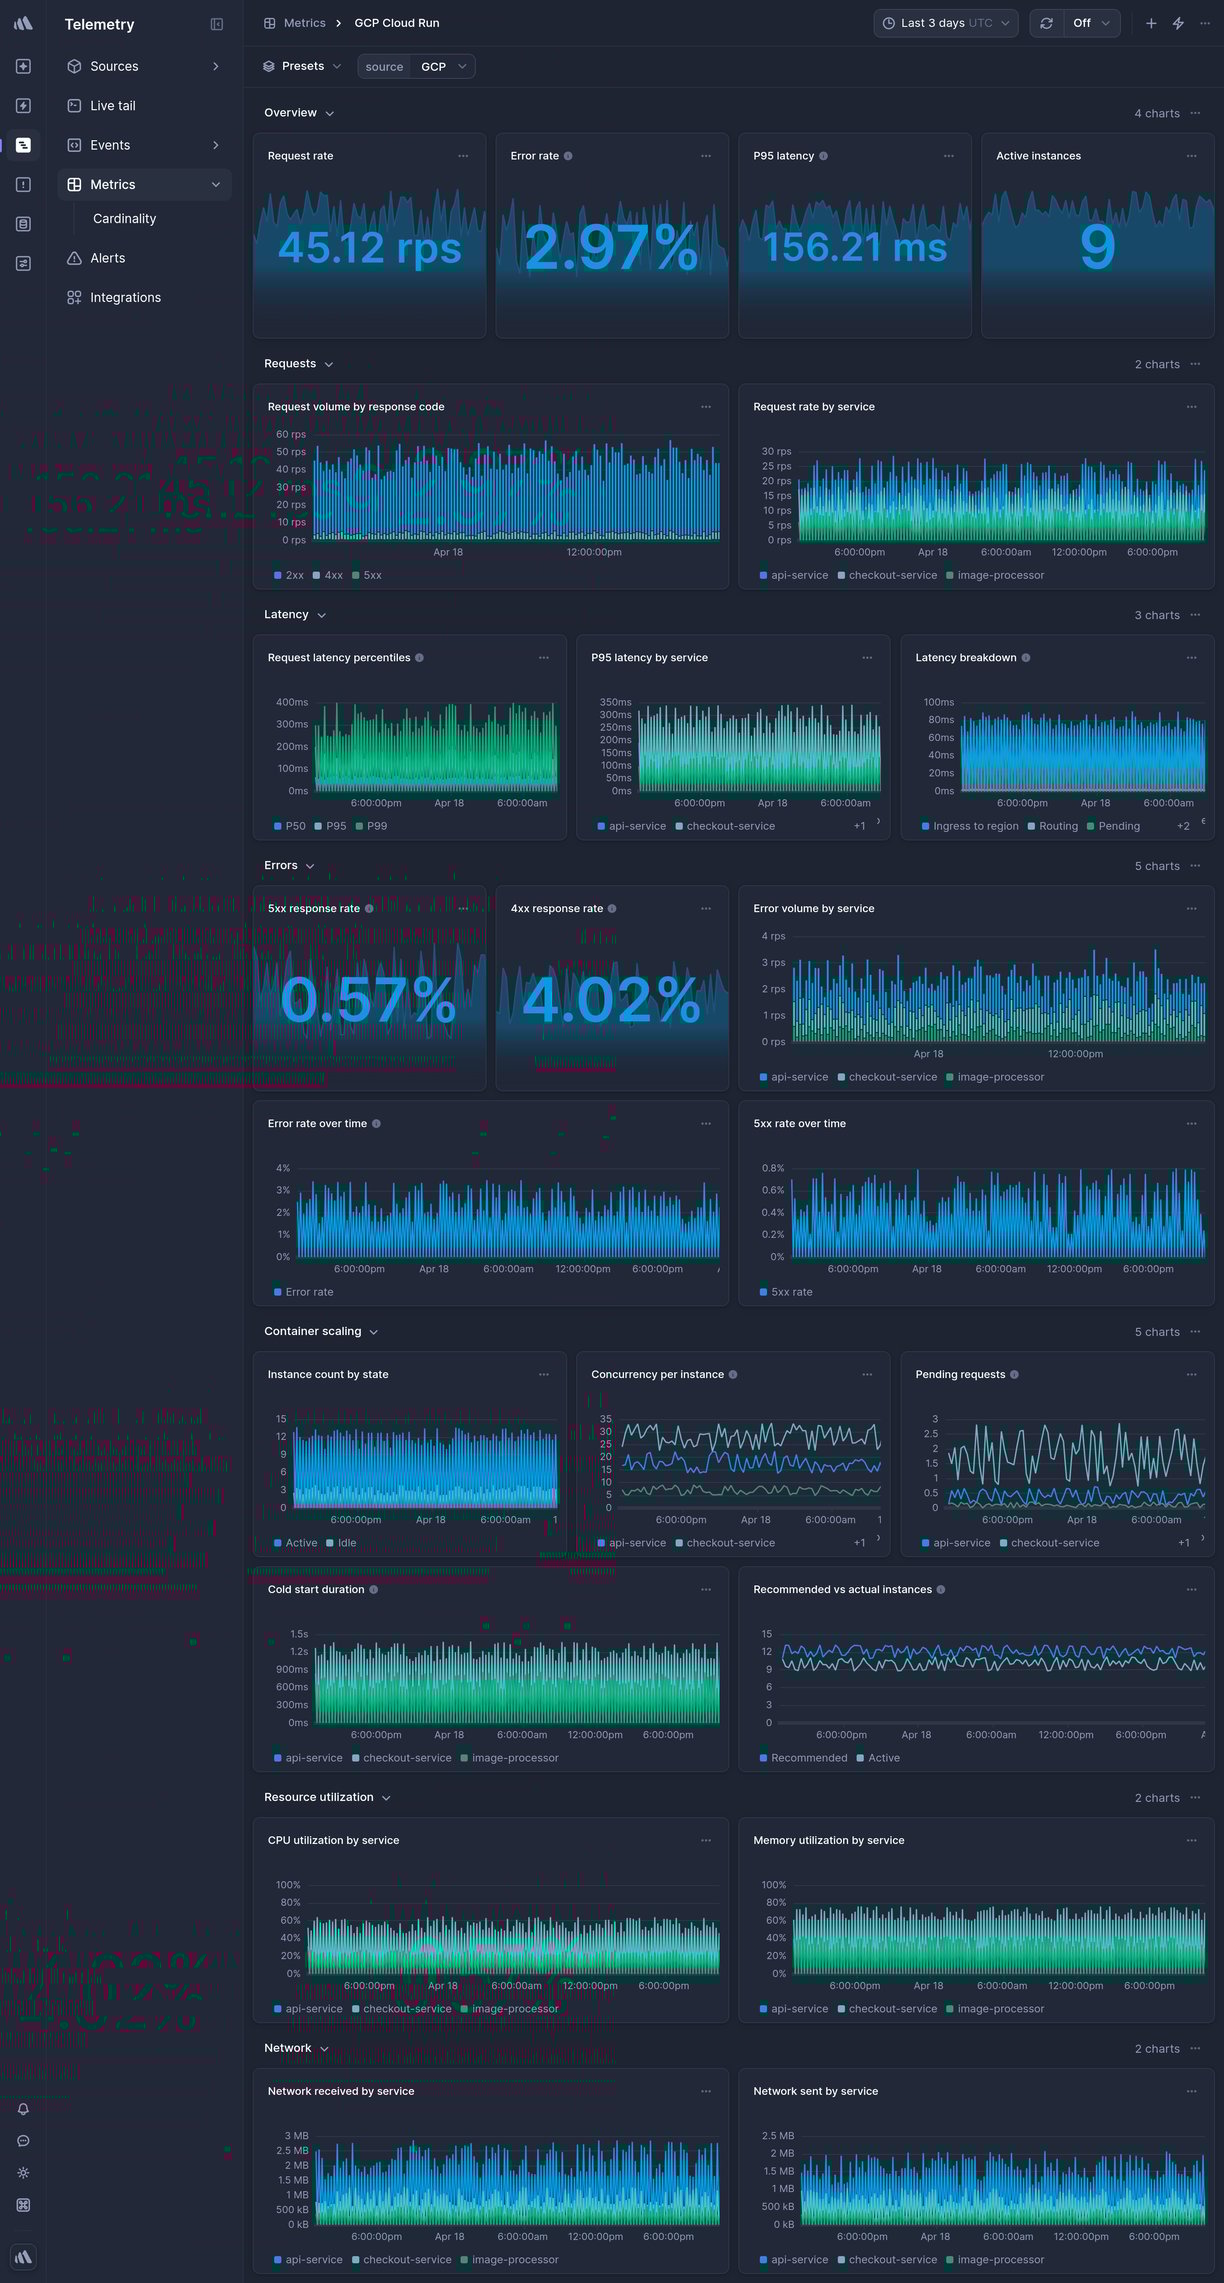
Data source
Google Cloud Monitoring
* * *

Overview
--------
This is a ready-made GCP Cloud Run Telemetry dashboard in Better Stack.
To get it, [sign up](https://betterstack.com/users/sign-up)
for Better Stack, [connect your log or metrics source](https://betterstack.com/docs/logs/logging-start/)
, and select one of the beautiful [pre-built dashboards](https://betterstack.com/dashboards)
you want to get.
### What charts are included
* Request count
* Request latency
* Container instance count
* CPU utilization
* Memory utilization
* And much more, explore on your own to see all the chart options.

### How to create a custom chart
Need a custom chart? You can create one by writing a regular SQL query.
Here is how to do it:
1. **Pick a chart type:** the most popular options include a line chart, bar chart, pie chart, a single number, and a live tail (a stream of the newest logs).
2. **Pick a source and timeframe:** we use [variables](https://betterstack.com/docs/logs/dashboards/variables/)
in the SQL queries, which makes it easy to edit and work with any query. The main variables are `source` and `timeframe`. Once you set those, as in the example above, you can use the timeframe switcher easily, and the dashboard will update automatically.
3. **Write your SQL query:** there is no need to use any specific querying language. Just write SQL like you’re used to.
**Learn more:** [How to build SQL queries in Better Stack](https://betterstack.com/docs/logs/dashboards/sql-queries/)

### How to create an alert for a metric
You can get easily alerted on irregularities before they become incidents.
Everything is fully integrated into dashboards, there is no need to set up complex workflows.
Here are the most popular alert types:
* **Threshold Alerts:** Perfect for scenarios where you need to be notified when a metric crosses a certain predefined threshold. For instance, if your application's response time exceeds a set limit, you’ll get an alert.
* **Relative Alerts:** Want to monitor changes in metrics relative to their historical data? Whether it's an unexpected drop in sales, a surge in new user signups, or any other relative metric anomaly, we've got you covered.
* **Anomaly detection:** Use this alerting method if you're unsure about what threshold to set. It will notify you about any significant deviation from the predicted value of the series. Think of this method as covering what you didn’t even know can occur.
**Learn more:** [How to use alerts in Better Stack](https://betterstack.com/docs/logs/dashboards/alerts/)

### How to receive notification about issues
Once you set up what metric irregularities you want to get alerted to, you can select a broad spectrum of notification options.
The most popular include Slack, Microsoft Teams, Phone calls, SMS, emails, webhooks, and more.
The best part is that notifications within Better Stack are unlimited. This way, you don’t have to worry about being charged extra in case of significant incidents.
**Learn more:** [How to use escalation policies in Better Stack](https://betterstack.com/docs/uptime/escalation-policies/)
### How to set up your GCP Cloud Run dashboard
Once you’ve signed up for [Better Stack](https://betterstack.com/logs)
, you can collect logs and metrics from GCP Cloud Run in just 2 minutes. Here is the official [documentation](https://betterstack.com/docs/logs/google-cloud/)
on how to do it.
Are you already using another log forwarder that you’re used to? See the documentation for [Fluent Bit](https://betterstack.com/docs/logs/fluent-bit/)
, [Logstash](https://betterstack.com/docs/logs/logstash/)
, [Fluentd](https://betterstack.com/docs/logs/fluentd/)
, [Filebeat](https://betterstack.com/docs/logs/filebeat/)
, [Syslog](https://betterstack.com/docs/logs/syslog-setup/)
, and [others](https://betterstack.com/docs/logs/start/)
.
### Have any questions?
Please feel free to message us at [hello@betterstack.com](mailto:hello@betterstack.com?subject=Question%20about%20Better%20Stack&body=)
.
We'll get back to you as soon as we can, typically within a few hours. 🙏 Thank you!
* * *
#### You might also like
[\
\
### Cloudflare HTTP Requests\
\
Use custom Cloudflare Worker code to log HTTP requests.](https://betterstack.com/dashboards/cloudflare-worker)
[\
\
### GCP Cloud Spanner\
\
Globally distributed, horizontally scalable relational database.](https://betterstack.com/dashboards/gcp-cloud-spanner)

### Please accept cookies
We use cookies to authenticate users, improve the product user experience, and for [personalized ads](https://business.safety.google/privacy/)
. [Learn more.](https://betterstack.com/privacy)
Deny Accept required Accept all
---
# Nginx dashboard template | Better Stack
[Back to dashboards](https://betterstack.com/dashboards)
Nginx
=====
Web server, reverse proxy, and load balancer.
[Add dashboard](https://telemetry.betterstack.com/team/0/dashboards#template-94550)
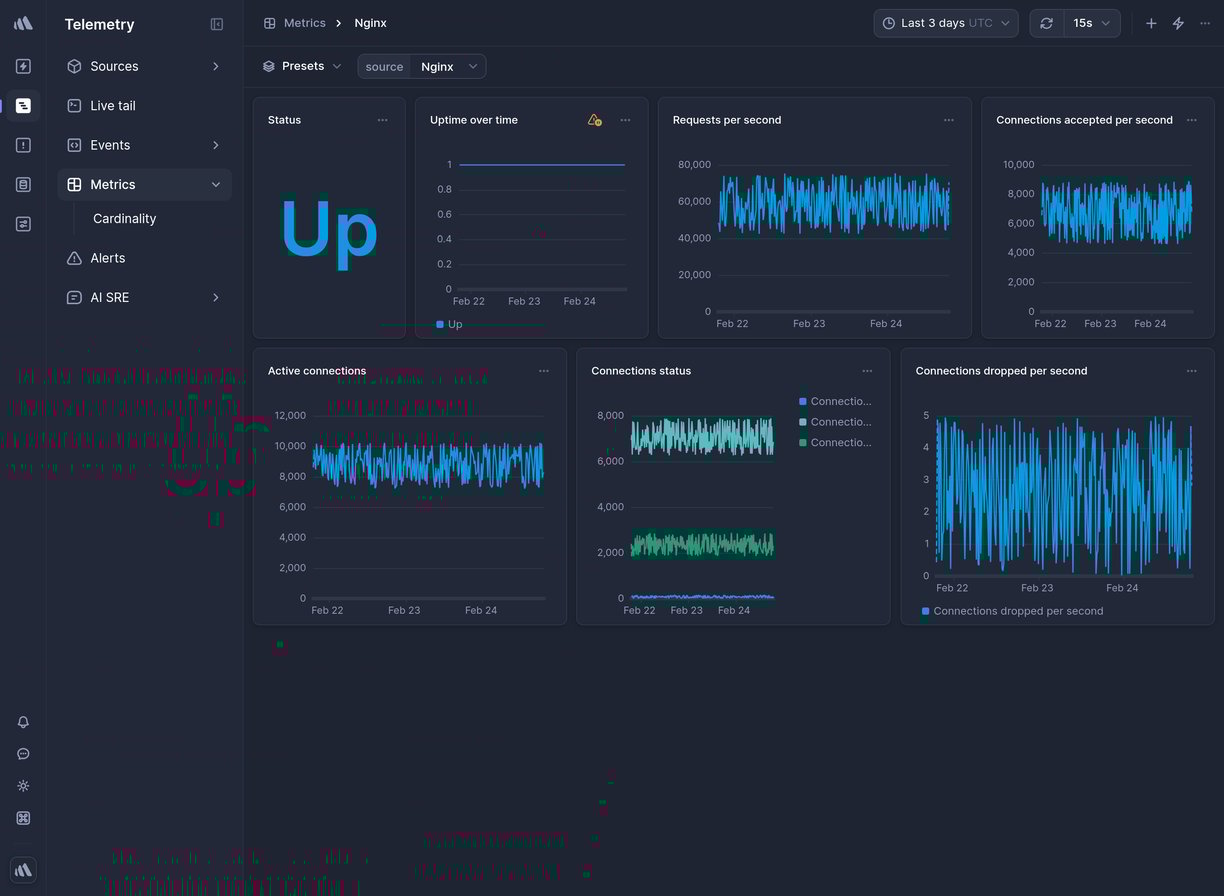
Data source
Nginx
* * *

Overview
--------
This is a ready-made Nginx Telemetry dashboard in Better Stack.
To get it, [sign up](https://betterstack.com/users/sign-up)
for Better Stack, [connect your log or metrics source](https://betterstack.com/docs/logs/logging-start/)
, and select one of the beautiful [pre-built dashboards](https://betterstack.com/dashboards)
you want to get.
### What charts are included
* Uptime status
* Requests per second
* Connections accepted per second
* Connections dropped per second
* Active connections
* Connection status
* And much more, explore on your own to see all the chart options.

### How to create a custom chart
Need a custom chart? You can create one by writing a regular SQL query.
Here is how to do it:
1. **Pick a chart type:** the most popular options include a line chart, bar chart, pie chart, a single number, and a live tail (a stream of the newest logs).
2. **Pick a source and timeframe:** we use [variables](https://betterstack.com/docs/logs/dashboards/variables/)
in the SQL queries, which makes it easy to edit and work with any query. The main variables are `source` and `timeframe`. Once you set those, as in the example above, you can use the timeframe switcher easily, and the dashboard will update automatically.
3. **Write your SQL query:** there is no need to use any specific querying language. Just write SQL like you’re used to.
**Learn more:** [How to build SQL queries in Better Stack](https://betterstack.com/docs/logs/dashboards/sql-queries/)

### How to create an alert for a metric
You can get easily alerted on irregularities before they become incidents.
Everything is fully integrated into dashboards, there is no need to set up complex workflows.
Here are the most popular alert types:
* **Threshold Alerts:** Perfect for scenarios where you need to be notified when a metric crosses a certain predefined threshold. For instance, if your application's response time exceeds a set limit, you’ll get an alert.
* **Relative Alerts:** Want to monitor changes in metrics relative to their historical data? Whether it's an unexpected drop in sales, a surge in new user signups, or any other relative metric anomaly, we've got you covered.
* **Anomaly detection:** Use this alerting method if you're unsure about what threshold to set. It will notify you about any significant deviation from the predicted value of the series. Think of this method as covering what you didn’t even know can occur.
**Learn more:** [How to use alerts in Better Stack](https://betterstack.com/docs/logs/dashboards/alerts/)

### How to receive notification about issues
Once you set up what metric irregularities you want to get alerted to, you can select a broad spectrum of notification options.
The most popular include Slack, Microsoft Teams, Phone calls, SMS, emails, webhooks, and more.
The best part is that notifications within Better Stack are unlimited. This way, you don’t have to worry about being charged extra in case of significant incidents.
**Learn more:** [How to use escalation policies in Better Stack](https://betterstack.com/docs/uptime/escalation-policies/)
### How to set up your Nginx dashboard
Once you’ve signed up for [Better Stack](https://betterstack.com/logs)
, you can collect logs and metrics from Nginx in just 2 minutes. Here is the official [documentation](https://betterstack.com/docs/logs/nginx/)
on how to do it.
Are you already using another log forwarder that you’re used to? See the documentation for [Fluent Bit](https://betterstack.com/docs/logs/fluent-bit/)
, [Logstash](https://betterstack.com/docs/logs/logstash/)
, [Fluentd](https://betterstack.com/docs/logs/fluentd/)
, [Filebeat](https://betterstack.com/docs/logs/filebeat/)
, [Syslog](https://betterstack.com/docs/logs/syslog-setup/)
, and [others](https://betterstack.com/docs/logs/start/)
.
### Have any questions?
Please feel free to message us at [hello@betterstack.com](mailto:hello@betterstack.com?subject=Question%20about%20Better%20Stack&body=)
.
We'll get back to you as soon as we can, typically within a few hours. 🙏 Thank you!
* * *
#### You might also like
[\
\
### GCP Load Balancing\
\
Global and regional load balancing for HTTP(S) and TCP/UDP traffic.](https://betterstack.com/dashboards/gcp-load-balancing)
[\
\
### GCP Cloud Functions\
\
Event-driven serverless functions for lightweight workloads.](https://betterstack.com/dashboards/gcp-cloud-functions)

### Please accept cookies
We use cookies to authenticate users, improve the product user experience, and for [personalized ads](https://business.safety.google/privacy/)
. [Learn more.](https://betterstack.com/privacy)
Deny Accept required Accept all
---
# Cloudflare Prometheus Exporter dashboard template | Better Stack
[Back to dashboards](https://betterstack.com/dashboards)
Cloudflare Prometheus Exporter
==============================
Monitor Cloudflare metrics exported via Prometheus exporter.
[Add dashboard](https://telemetry.betterstack.com/team/0/dashboards#template-95588)
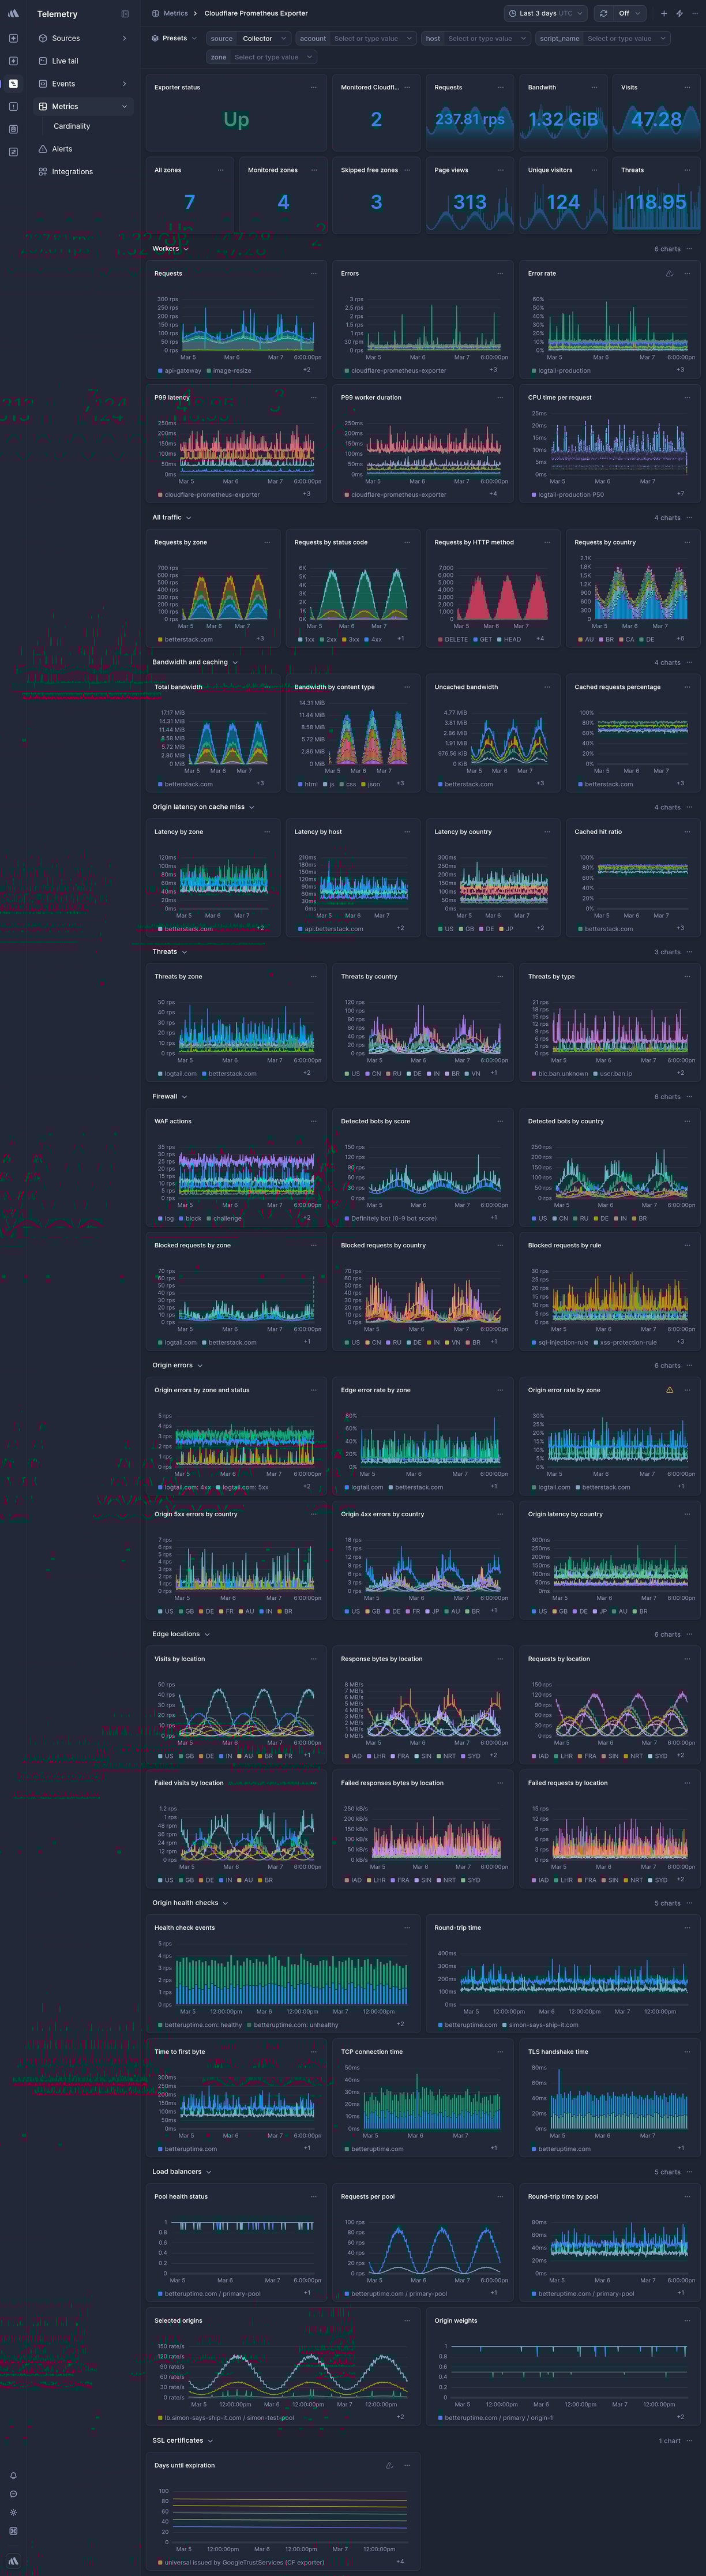
Data source
Cloudflare Prometheus Exporter
* * *

Overview
--------
This is a ready-made Cloudflare Prometheus Exporter Telemetry dashboard in Better Stack.
To get it, [sign up](https://betterstack.com/users/sign-up)
for Better Stack, [connect your log or metrics source](https://betterstack.com/docs/logs/logging-start/)
, and select one of the beautiful [pre-built dashboards](https://betterstack.com/dashboards)
you want to get.
### What charts are included
* Requests
* Errors
* Bandwidth
* Requests by status code
* Requests by HTTP method
* Requests by country
* And much more, explore on your own to see all the chart options.

### How to create a custom chart
Need a custom chart? You can create one by writing a regular SQL query.
Here is how to do it:
1. **Pick a chart type:** the most popular options include a line chart, bar chart, pie chart, a single number, and a live tail (a stream of the newest logs).
2. **Pick a source and timeframe:** we use [variables](https://betterstack.com/docs/logs/dashboards/variables/)
in the SQL queries, which makes it easy to edit and work with any query. The main variables are `source` and `timeframe`. Once you set those, as in the example above, you can use the timeframe switcher easily, and the dashboard will update automatically.
3. **Write your SQL query:** there is no need to use any specific querying language. Just write SQL like you’re used to.
**Learn more:** [How to build SQL queries in Better Stack](https://betterstack.com/docs/logs/dashboards/sql-queries/)

### How to create an alert for a metric
You can get easily alerted on irregularities before they become incidents.
Everything is fully integrated into dashboards, there is no need to set up complex workflows.
Here are the most popular alert types:
* **Threshold Alerts:** Perfect for scenarios where you need to be notified when a metric crosses a certain predefined threshold. For instance, if your application's response time exceeds a set limit, you’ll get an alert.
* **Relative Alerts:** Want to monitor changes in metrics relative to their historical data? Whether it's an unexpected drop in sales, a surge in new user signups, or any other relative metric anomaly, we've got you covered.
* **Anomaly detection:** Use this alerting method if you're unsure about what threshold to set. It will notify you about any significant deviation from the predicted value of the series. Think of this method as covering what you didn’t even know can occur.
**Learn more:** [How to use alerts in Better Stack](https://betterstack.com/docs/logs/dashboards/alerts/)

### How to receive notification about issues
Once you set up what metric irregularities you want to get alerted to, you can select a broad spectrum of notification options.
The most popular include Slack, Microsoft Teams, Phone calls, SMS, emails, webhooks, and more.
The best part is that notifications within Better Stack are unlimited. This way, you don’t have to worry about being charged extra in case of significant incidents.
**Learn more:** [How to use escalation policies in Better Stack](https://betterstack.com/docs/uptime/escalation-policies/)
### How to set up your Cloudflare Prometheus Exporter dashboard
Once you’ve signed up for [Better Stack](https://betterstack.com/logs)
, you can collect logs and metrics from Cloudflare Prometheus Exporter in just 2 minutes. Here is the official [documentation](https://betterstack.com/docs/logs/cloudflare-exporter/)
on how to do it.
Are you already using another log forwarder that you’re used to? See the documentation for [Fluent Bit](https://betterstack.com/docs/logs/fluent-bit/)
, [Logstash](https://betterstack.com/docs/logs/logstash/)
, [Fluentd](https://betterstack.com/docs/logs/fluentd/)
, [Filebeat](https://betterstack.com/docs/logs/filebeat/)
, [Syslog](https://betterstack.com/docs/logs/syslog-setup/)
, and [others](https://betterstack.com/docs/logs/start/)
.
### Have any questions?
Please feel free to message us at [hello@betterstack.com](mailto:hello@betterstack.com?subject=Question%20about%20Better%20Stack&body=)
.
We'll get back to you as soon as we can, typically within a few hours. 🙏 Thank you!
* * *
#### You might also like
[\
\
### AWS EC2\
\
Scalable virtual server instances in the AWS cloud.](https://betterstack.com/dashboards/aws-ec2)
[\
\
### GCP Cloud Storage\
\
Scalable object storage for data of any size.](https://betterstack.com/dashboards/gcp-cloud-storage)

### Please accept cookies
We use cookies to authenticate users, improve the product user experience, and for [personalized ads](https://business.safety.google/privacy/)
. [Learn more.](https://betterstack.com/privacy)
Deny Accept required Accept all
---
# Pricing | Better Stack
Pricing
-------
Try Better Stack today risk‑free with our 60‑day money-back guarantee.
Monthly
Annually
Get ~2 months free
Incident management
[AI SRE](https://betterstack.com/pricing#ai-sre)
[Slack & MS Teams](https://betterstack.com/pricing#slack-workflows)
[On-call](https://betterstack.com/pricing#oncall-incident-management)
[Status pages](https://betterstack.com/pricing#status-pages)
[Call routing](https://betterstack.com/pricing#call-routing)
Telemetry
[Bundles](https://betterstack.com/pricing#bundles)
[Logs & Traces](https://betterstack.com/pricing#logs)
[Metrics](https://betterstack.com/pricing#metrics)
Real user monitoring
[Error tracking](https://betterstack.com/pricing#errors)
[Session replay](https://betterstack.com/pricing#session-replay)
[Web events](https://betterstack.com/pricing#web-events)
External monitoring
[Uptime monitoring](https://betterstack.com/pricing#monitors)
[Transaction monitoring](https://betterstack.com/pricing#transaction-monitoring)
[Heartbeats (CRON)](https://betterstack.com/pricing#heartbeats)
Infrastructure
[Warehouse](https://betterstack.com/pricing#warehouse)
Enterprise-ready
[Reporting & analytics](https://betterstack.com/pricing#reporting-analytics)
[Security](https://betterstack.com/pricing#security)
Pay annually
Get ~2 months off
Free for personal projects
$0
per month
[Start for free](https://betterstack.com/users/sign-up)
* 10 monitors & heartbeats, 1 status page
* Slack & e-mail alerts
* 100,000 exceptions per month
* 5,000 session replays
* 3 GB logs retained for 3 days
* 30 GB metrics
* 3 GB web events retained for 3 days
* 3 GB warehouse events stored for 30 days
Starts at just $34
Starts at just $29
--------------------------------------------
Includes a single responder with unlimited phone call alerts so that you can leverage the entire platform.
Unlimited team members
Free access to [Telemetry](https://betterstack.com/telemetry)
.
$0
per member per month
Responder
Access to [Uptime](https://betterstack.com/uptime)
with incident management, on-call, monitoring and status pages with unlimited phone call and SMS alerts.
$34
$29
per license per month
Incident management
-------------------
* * *
### AI SRE
Slack-native AI SRE agent that investigates incidents using your logs, metrics, traces, errors, and web events.
AI SRE chat
$0.00003 per token
* Agentic root cause analysis
* Create dashboards with AI
* Connect Datadog & Grafana
* Create GitHub pull requests
* Import Grafana dashboards
* Connect Notion & Linear
* Robust MCP server
* Import Datadog dashboards
* Connect Sentry
* * *
### Slack & Teams-based native incident management
Resolve incidents without leaving Slack or MS Teams by leveraging powerful automations.
Basic single-channel integration
included
Channel-based & Thread-based workflows
$9 per responder license per month
* `/incident` command
* Basic single-channel integration
* AI post-mortems
* Manage on-call schedules
* Channel per incident
* Shareable dashboards
* Assemble the team,
assign ownership
* Private channel per incident
* Reporting & analytics
* Advanced incident workflows
* Thread per incident
* Track MTTA, MTTR and more
* Quick status page updates
* Automated user synchronization
* * *
### On-call & incident management
On-call scheduling & alerting is built-in. Set up duties, get flexible alerting options, and resolve incidents collaboratively.
On-call scheduling for responders
included
* iOS & Android apps
* [Countless integrations](https://betterstack.com/integrations)
* AI post-mortems
* Unlimited phone call alerts
* Incident timeline
* Manual post-mortems
* Unlimited SMS
* On-call calendar & scheduling
* Collaboration built-in
* Push notifications
* Smart incident merging
* Google & Outlook calendar integration
* E-mail alerts
* Slack incident management
* On-call calendar ICS export
* Zapier integration
* Advanced incident escalations
* Reporting & analytics
* Webhooks
* Call routing
* Unlimited incident history
* Terraform provider
* REST API
* * *
### Status pages
Get a branded status.yourdomain.com and build credibility with customers. Monitoring and incident management is fully-integrated.
Status pages
1 status page included
Additional public status page
$15 per month
$12 per month
Custom CSS & JavaScript
$15 per page per month
$12 per page per month
White-label by removing "Powered by Better Stack" footer
$250 per page per month
$208 per page per month
Password authentication
$50 per page per month
$42 per page per month
IP allowlisting
$250 per page per month
$208 per page per month
Single Sign-On
$250 per page per month
$208 per page per month
Subscribers
1,000 subscribers included
Additional 1,000 subscribers
$40 per month
$40 per page per month
Send e-mails from your own domain
$250 per page per month
$208 per page per month
* Custom sub-domain
* Migration support
* Embeddable image badge
* Private status pages
* Importing existing subscribers
* Embeddable system status
* White-labeling
* Screenshots & error logs
* Google Search opt-out
* Embedded charts & metrics
* Password authentication
* Google Analytics pixel
* Public status subscriptions
* IP allowlisting
* Integrate with chat
* Send e-mails from your domain
* Single Sign-On
* Integrates with Mixpanel
* Customizable design
* Maintenance notices
* Integrates with Intercom
* Custom CSS
* Multi-language i18n support (beta)
* Integrates with Front
* Custom JavaScript
* REST API
* Integrates with Drift
* Terraform provider
* * *
### Call routing
Route incoming phone calls to the current on-call person to create incidents automatically.
Per phone number
$250 per month
$208 per month
* USA, CA, EU & UK
* Welcome message
* Call transcripts
* Allow-listing phone numbers
* No paperwork required
* Reporting & analytics
* Available in 50+ languages
* Advanced incident workflows
* AI post-mortems
Telemetry
---------
* * *
### Bundles
All bundles include 30 day logs retention. 60-day money back guarantee.
Nano
$25
22% OFF
$30
6% OFF
per month billed yearly
per month
40 GB
Traces
40 GB
Logs
40 GB
Metrics
40 GB
Traces
40 GB
Logs
40 GB
Metrics
Micro
$100
22% OFF
$120
6% OFF
per month billed yearly
per month
160 GB
Traces
160 GB
Logs
160 GB
Metrics
160 GB
Traces
160 GB
Logs
160 GB
Metrics
Mega
$210
23% OFF
$250
8% OFF
per month billed yearly
per month
340 GB
Traces
340 GB
Logs
340 GB
Metrics
340 GB
Traces
340 GB
Logs
340 GB
Metrics
Tera
$420
25% OFF
$500
11% OFF
per month billed yearly
per month
700 GB
Traces
700 GB
Logs
700 GB
Metrics
700 GB
Traces
700 GB
Logs
700 GB
Metrics
Nano
$38
22% OFF
$45
6% OFF
per month billed yearly
per month
40 GB
Traces
40 GB
Logs
40 GB
Metrics
40 GB
Traces
40 GB
Logs
40 GB
Metrics
Micro
$150
22% OFF
$180
6% OFF
per month billed yearly
per month
160 GB
Traces
160 GB
Logs
160 GB
Metrics
160 GB
Traces
160 GB
Logs
160 GB
Metrics
Mega
$315
23% OFF
$375
8% OFF
per month billed yearly
per month
340 GB
Traces
340 GB
Logs
340 GB
Metrics
340 GB
Traces
340 GB
Logs
340 GB
Metrics
Tera
$630
25% OFF
$750
11% OFF
per month billed yearly
per month
700 GB
Traces
700 GB
Logs
700 GB
Metrics
700 GB
Traces
700 GB
Logs
700 GB
Metrics
Nano
$38
22% OFF
$45
6% OFF
per month billed yearly
per month
40 GB
Traces
40 GB
Logs
40 GB
Metrics
40 GB
Traces
40 GB
Logs
40 GB
Metrics
Micro
$150
22% OFF
$180
6% OFF
per month billed yearly
per month
160 GB
Traces
160 GB
Logs
160 GB
Metrics
160 GB
Traces
160 GB
Logs
160 GB
Metrics
Mega
$315
23% OFF
$375
8% OFF
per month billed yearly
per month
340 GB
Traces
340 GB
Logs
340 GB
Metrics
340 GB
Traces
340 GB
Logs
340 GB
Metrics
Tera
$630
25% OFF
$750
11% OFF
per month billed yearly
per month
700 GB
Traces
700 GB
Logs
700 GB
Metrics
700 GB
Traces
700 GB
Logs
700 GB
Metrics
Nano
$88
22% OFF
$105
6% OFF
per month billed yearly
per month
40 GB
Traces
40 GB
Logs
40 GB
Metrics
40 GB
Traces
40 GB
Logs
40 GB
Metrics
Micro
$350
22% OFF
$420
6% OFF
per month billed yearly
per month
160 GB
Traces
160 GB
Logs
160 GB
Metrics
160 GB
Traces
160 GB
Logs
160 GB
Metrics
Mega
$735
23% OFF
$875
8% OFF
per month billed yearly
per month
340 GB
Traces
340 GB
Logs
340 GB
Metrics
340 GB
Traces
340 GB
Logs
340 GB
Metrics
Tera
$1,470
25% OFF
$1,750
11% OFF
per month billed yearly
per month
700 GB
Traces
700 GB
Logs
700 GB
Metrics
700 GB
Traces
700 GB
Logs
700 GB
Metrics
* * *
### Logs & Traces
Aggregate structured logs & traces from anywhere, transform them with VRL and query using Drag & drop, PromQL or SQL.
Included
3 GB per month retained for 3 days
Ingestion
$0.15 per GB
$0.15 per GB
$0.10 per GB
$0.35 per GB
approx. million events
Retention
$0.08 per GB per month
$0.08 per GB per month
$0.05 per GB per month
$0.18 per GB per month
Standard querying
included
Custom cluster deployment
[enterprise](https://betterstack.com/enterprise)
Host data in your own bucket
$250 per month
$208 per month
Query boost
$0.001 per GB scanned
* [Schema-less storage](https://betterstack.com/docs/logs/wide-events-time-series/)
* Anomaly detection alerts
* Real-time live tail
* Incident management built-in
* Drag & drop query builder
* One-click filter by context
* Integrated on-call
* Query logs with SQL
* Transform logs with VRL
* Embed charts into status page
* Transform data with JavaScript
* Host data in your own S3 bucket
* Long-term archival to S3
* Built-in collaboration
* Convert logs to metrics
* Shareable dashboards
* Anonymize PII
* * *
### Metrics
Visualize metrics with [ready-made dashboards](https://betterstack.com/dashboards)
. Generate metrics from logs or collect them via Prometheus or OpenTelemetry.
Included
30 GB
Retention
$0.75 per GB per month
$0.75 per GB per month
$0.50 per GB per month
$1.75 per GB per month
approx. 1,000 time series
Standard querying
included
Custom cluster deployment
[enterprise](https://betterstack.com/enterprise)
* Incident management built-in
* Anomaly detection alerts
* Shareable dashboards
* Integrated on-call
* Drag & drop query builder
* Built-in collaboration
* Query metrics with SQL
* Embed charts into status page
* Transform data with JavaScript
Real user monitoring
--------------------
* * *
### Error tracking
Sentry‑compatible at 1/6th the price. Scale your infrastructure, not your budget. AI‑native error tracking built on Better Stack.
Included
100,000 exceptions
Additional exceptions
$0.000075 per exception
$0.000075 per exception
$0.000050 per exception
$0.000175 per exception
approx. 6x cheaper than Sentry
Retention
90 days
* Sentry SDK-compatible
* Made for AI agents
* Incident management built-in
* Bugfix AI prompts with context
* Integrated with Claude Code
* Integrated with with Cursor
* Snooze errors
* Release tracking
* Configurable error merging
* Linear integration
* Slack integration
* Jira integration
* MCP server
* Terraform
* MS Teams integration
* * *
### Session replay
See how your users interact with your product. Watch at 2x speed, skip pauses, view correlated errors, traces, logs, and events.
Included
5,000 session replays
Additional session replays
$0.00225 per session replay
$0.00225 per session replay
$0.00150 per session replay
$0.00525 per session replay
upto 2x cheaper than PostHog
Retention
90 days
* Exclude sensitive HTML elements
* View at 2x speed
* Skip pauses
* See correlated errors and traces
* Optional sampling built-in
* SOC 2 Type 2 and GDPR
* * *
### Web events
At 1/10 of the cost of PostHog or Amplitude. Auto-capture user events, explore funnels, track web vitals, and Chrome RAM usage.
Included
3 GB per month retained for 3 days
Ingestion
$0.15 per GB
$0.15 per GB
$0.10 per GB
$0.35 per GB
approx. million events
Retention
$0.08 per GB per month
$0.08 per GB per month
$0.05 per GB per month
$0.18 per GB per month
Extracted metrics
[see above](https://betterstack.com/pricing#metrics)
* Website analytics
* Anonymize PII
* Real-time live tail
* Product analytics
* Identify signed-in users
* One-click filter by context
* Web vitals
* Built-in optional sampling
* Shareable dashboards
* Chrome RAM consumption
* Drag & drop query builder
* Host data in your own S3 bucket
* Auto-capture events
* Query events with SQL
* Long-term archival to S3
* Visualize funnels
* [Schema-less storage](https://betterstack.com/docs/logs/wide-events-time-series/)
* Integrated error tracking
* Fast dashboards at scale
* Embed charts into status page
* Integrated distributed tracing
External monitoring
-------------------
* * *
### Uptime monitoring
The most reliable external monitoring for your monolith application, SPA, REST API, or a bare metal server.
Monitors
10 monitors included
Additional 50 monitors
$25 per month
$21 per month
* Unlimited phone call alerts
* Up to 30 seconds check frequency
* Screenshots of errors
* Unlimited SMS
* HTTP(s) keyword checks
* Multi-location & Geo-specific checks
* Push notifications
* TCP/UDP port monitoring
* Multi-step incident verification
* E-mail alerts
* POP3/IMAP/SMTP
* AI post mortem analysis
* Slack integration
* SSL monitoring
* Uptime SLA reporting
* MS Teams integration
* TLD expiration monitoring
* Response time tracking
* Zapier integration
* DNS server monitoring
* Traceroute & MTR diagnosis
* REST API
* Ping monitoring
* Maintenance windows
* Terraform provider
* IPv6 support
* Status pages
* Webhooks
* * *
### Transaction monitoring (Playwright)
Hosted Playwright-based transaction checks let you monitor vital website interactions by running a real browser instance.
100 Playwright minutes
$1
* Unlimited phone call alerts
* Interactive Snapshots
* Multi-location & Geo-specific checks
* Unlimited SMS
* Generate with Codegen
* Multi-step incident verification
* Push notifications
* Inspect Playwright artifacts
* AI post mortem analysis
* E-mail alerts
* Up to 30 seconds check frequency
* Traceroute & MTR diagnosis
* Slack integration
* Screenshots of errors
* Uptime SLA reporting
* MS Teams integration
* Maintenance windows
* REST API
* Zapier integration
* IPv6 support
* Terraform provider
* Webhooks
* * *
### Heartbeats (Cron job monitoring)
Heartbeats let you monitor scheduled jobs like cron jobs or serverless workers. Never lose a database backup again.
Heartbeats
10 heartbeats included
Additional 10 heartbeats
$20 per month
$17 per month
* Unlimited phone call alerts
* Up to 1 second check resolution
* AI post mortem analysis
* Unlimited SMS
* Configurable grace period
* Uptime SLA reporting
* Push notifications
* IPv6 support
* REST API
* E-mail alerts
* Zapier integration
* Terraform provider
* Slack integration
* Maintenance windows
* Status pages
* MS Teams integration
* Webhook notifications
Infrastructure
--------------
* * *
### Warehouse
Get a time series data warehouse as an API without the scaling headache. Ingest petabytes and run analytical SQL queries at scale. Deploy to production today, not in a month.
Included
3 GB per month retained for 30 days
Ingestion
$0.15 per GB
$0.15 per GB
$0.10 per GB
$0.35 per GB
approx. million events
Retention on object storage[](https://betterstack.com/docs/logs/wide-events-time-series/#overview-wide-events-vs-time-series)
$0.08 per GB per month
$0.08 per GB per month
$0.05 per GB per month
$0.18 per GB per month
Retention on NVMe SSD[](https://betterstack.com/docs/logs/wide-events-time-series/#overview-wide-events-vs-time-series)
$1.50 per GB per month
$1.50 per GB per month
$1.00 per GB per month
$3.50 per GB per month
Standard querying
included
Turbo querying
$2,000 per month
$1,660 per month
$3,000 per month
$2,490 per month
$3,000 per month
$2,490 per month
$7,000 per month
$5,810 per month
Ultra querying
$4,000 per month
$3,330 per month
$6,000 per month
$4,995 per month
$6,000 per month
$4,995 per month
$14,000 per month
$11,655 per month
Hyper querying
$6,000 per month
$5,000 per month
$9,000 per month
$7,500 per month
$9,000 per month
$7,500 per month
$21,000 per month
$17,500 per month
Host data in your own bucket
$250 per month
$208 per month
Ingestion via AWS Direct Connect
$0.04 per GB
Embedding with `embeddinggemma:300m`
$0.20 per million tokens
Custom cluster deployment
[enterprise](https://betterstack.com/enterprise)
* [Raw events on object storage](https://betterstack.com/docs/logs/wide-events-time-series/)
* Time series on NVMe SSD
* No vendor lock-in
* Open source data formats
* Run SQL queries with an HTTP API
* Save a query as an API
* Generate vector embeddings
* Vector indices
* Approximate KNN
* Exact vector search
* Query time sampling
* Built-in geo IP
* Expire data with TTL
* MCP server
* Terraform
* Detailed usage reporting
* Spending alerts
* Spending limit
* SOC 2 Type 2
* GDPR-complaint
* ISO 27001 data centers
#### Others charge for
* Public internet data transfer
* Inter region data transfer
* Cached API requests
* vCPU hours
* per-query CPU hours
* Ingestion API requests
Enterprise-ready
----------------
* * *
### Reporting & analytics
Track team KPIs easily analyze incident metrics, on-call duties, and advanced SLAs/SLIs.
Reporting & analytics
$5 per member per month
$4 per member per month
* Historical uptime SLA
* AI post-mortems
* MTTA, MTTR and other KPIs
* Incident cause synthesis
* On-call duty reports
* SLA & SLI indicators
* Export to CSV
* Team member-based performance
* * *
### Security
Keep your data secure and control your costs by having visibility into your usage. Stay compliant with SOC 2, GDPR, and more.
Single Sign-On with Google
included
Single Sign-On with Azure
$5 per user per month
Single Sign-On with Okta
$5 per user per month
Generic SAML SSO
[enterprise](https://betterstack.com/enterprise)
Audit logs
$250 per month
$208 per month
* SOC 2 Type II-compliant
* Single Sign-On
* Two-factor authentication
* SOC 2 report under NDA
* SSO enforcement
* 2FA enforcement
* GDPR-compliant
* SCIM
* Custom Telemetry data residency
* Role-based access control
* Team-level isolation
* Custom VPC deployment
#### Enterprise-ready
Reach out for a custom quote.
Find out why the best teams rely on Better Stack.
[Book a demo](https://betterstack.com/book-a-demo)
Get a quote over e-mail
Get a quote over e-mail
=======================
Contact
First name
Last name
Work e-mail
Team members Select team size < 10 < 20 < 30 < 50 < 100 100+
Responders
Number of responders < 10 < 20 < 30 < 50 < 100 100+
Incident Management
Status pages Number of status pages 1 2-5 6-10 11-20 20+
Call routing
Slack & Teams workflows
Monitoring
Uptime monitors Number of monitors < 50 < 100 < 500 < 1000 1000+
Playwright executions Number of executions < 10k < 50k < 100k < 1M 1M+
Heartbeats Number of heartbeats < 10 < 50 < 100 < 500 500+
Telemetry
Logs & traces ingestion (GB/month) Monthly volume < 300 GB / month < 500 GB / month < 1 TB / month < 3 TB / month < 5 TB / month < 10 TB / month < 30 TB / month < 50 TB / month < 100 TB / month more than 100 TB / month I don't know
Logs & traces retention (weeks) Select retention < 1 week < 2 weeks < 4 weeks < 12 weeks < 52 weeks 52 weeks+
Metrics [Retained data points](https://betterstack.com/docs/logs/billing-for-metrics/) Monthly volume < 100 GB < 500 GB < 1 TB < 5 TB 5 TB+
Enterprise
Reporting
SSO
Audit logs
Anything else you want to share?
Request quote
Frequently asked questions
--------------------------
At Better Stack, we design our products and processes with security in mind.
We follow industry-standard best practices to keep your data safe.
Is Better Stack SOC 2 compliant?
Yes, Better Stack is SOC2 Type 2 compliant. [Contact us](mailto:hello@betterstack.com?subject=SOC%202%20report)
for more details or to access the latest report.
Is Better Stack GDPR compliant?
Yes. For more information, see our [Data Processing Agreement](https://betterstack.com/dpa)
. By default, all data is stored in the EU regions in GDPR-compliant DIN ISO/IEC 27001-certified data centers.
Is Better Stack HIPAA compliant?
Better Stack is currently not HIPAA compliant. [Contact us](mailto:hello@betterstack.com?subject=HIPAA)
if HIPAA is important for you, and we can share more details.
Is Better Stack PCI compliant?
Better Stack does not store personal credit card information for any of our customers. We use Stripe to securely process transactions and trust their commitment to best-in-class security. Stripe is a certified PCI Service Provider Level 1, which is the highest level of certification in the payments industry.
Does Better Stack encrypt data?
Relevant data is encrypted at rest (AES-256) and in transit (HTTPS/TLS).
Does Better Stack back up the data?
Yes. Automated backups are run regularly and data is stored redundantly where appropriate to prevent data loss.
Does Better Stack offer custom data locations?
Yes. We offer custom data locations for enterprise accounts. [Contact us](mailto:hello@betterstack.com?subject=Enterprise%20deployment)
to discuss a preferred data location.
Do you conduct regular penetration testing and vulnerability scans?
Yes. We conduct regular penetration testing through third-party pen testers. In addition, we run frequent code reviews, static analysis checks, and dependency vulnerability scans. Our enterprise customers have access to our latest pen test reports.
Is your question not listed here? Please get in touch at [hello@betterstack.com](mailto:hello@betterstack.com?subject=Question%20about%20security%20at%20Better%20Stack&body=)
.
### Please accept cookies
We use cookies to authenticate users, improve the product user experience, and for [personalized ads](https://business.safety.google/privacy/)
. [Learn more.](https://betterstack.com/privacy)
Deny Accept required Accept all
---
# Memcached dashboard template | Better Stack
[Back to dashboards](https://betterstack.com/dashboards)
Memcached
=========
Monitor Memcached caching server performance and hit rates.
[Add dashboard](https://telemetry.betterstack.com/team/0/dashboards#template-95582)
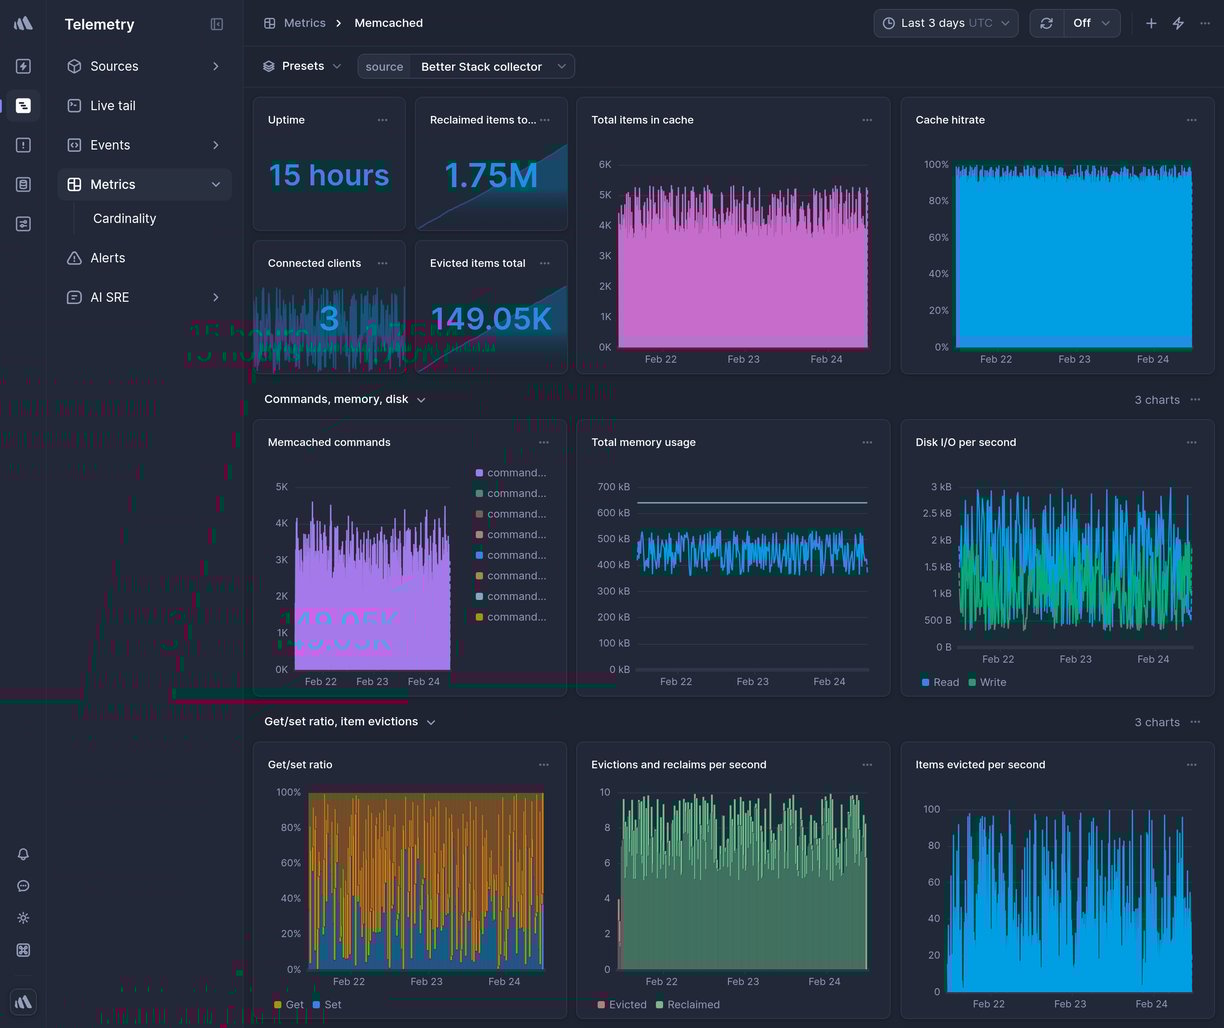
Data source
Memcached
* * *

Overview
--------
This is a ready-made Memcached Telemetry dashboard in Better Stack.
To get it, [sign up](https://betterstack.com/users/sign-up)
for Better Stack, [connect your log or metrics source](https://betterstack.com/docs/logs/logging-start/)
, and select one of the beautiful [pre-built dashboards](https://betterstack.com/dashboards)
you want to get.
### What charts are included
* Cache hit rate
* Memory usage
* Connection count
* Request rate
* And much more, explore on your own to see all the chart options.

### How to create a custom chart
Need a custom chart? You can create one by writing a regular SQL query.
Here is how to do it:
1. **Pick a chart type:** the most popular options include a line chart, bar chart, pie chart, a single number, and a live tail (a stream of the newest logs).
2. **Pick a source and timeframe:** we use [variables](https://betterstack.com/docs/logs/dashboards/variables/)
in the SQL queries, which makes it easy to edit and work with any query. The main variables are `source` and `timeframe`. Once you set those, as in the example above, you can use the timeframe switcher easily, and the dashboard will update automatically.
3. **Write your SQL query:** there is no need to use any specific querying language. Just write SQL like you’re used to.
**Learn more:** [How to build SQL queries in Better Stack](https://betterstack.com/docs/logs/dashboards/sql-queries/)

### How to create an alert for a metric
You can get easily alerted on irregularities before they become incidents.
Everything is fully integrated into dashboards, there is no need to set up complex workflows.
Here are the most popular alert types:
* **Threshold Alerts:** Perfect for scenarios where you need to be notified when a metric crosses a certain predefined threshold. For instance, if your application's response time exceeds a set limit, you’ll get an alert.
* **Relative Alerts:** Want to monitor changes in metrics relative to their historical data? Whether it's an unexpected drop in sales, a surge in new user signups, or any other relative metric anomaly, we've got you covered.
* **Anomaly detection:** Use this alerting method if you're unsure about what threshold to set. It will notify you about any significant deviation from the predicted value of the series. Think of this method as covering what you didn’t even know can occur.
**Learn more:** [How to use alerts in Better Stack](https://betterstack.com/docs/logs/dashboards/alerts/)

### How to receive notification about issues
Once you set up what metric irregularities you want to get alerted to, you can select a broad spectrum of notification options.
The most popular include Slack, Microsoft Teams, Phone calls, SMS, emails, webhooks, and more.
The best part is that notifications within Better Stack are unlimited. This way, you don’t have to worry about being charged extra in case of significant incidents.
**Learn more:** [How to use escalation policies in Better Stack](https://betterstack.com/docs/uptime/escalation-policies/)
### How to set up your Memcached dashboard
Once you’ve signed up for [Better Stack](https://betterstack.com/logs)
, you can collect logs and metrics from Memcached in just 2 minutes. Here is the official [documentation](https://betterstack.com/docs/logs/memcached/)
on how to do it.
Are you already using another log forwarder that you’re used to? See the documentation for [Fluent Bit](https://betterstack.com/docs/logs/fluent-bit/)
, [Logstash](https://betterstack.com/docs/logs/logstash/)
, [Fluentd](https://betterstack.com/docs/logs/fluentd/)
, [Filebeat](https://betterstack.com/docs/logs/filebeat/)
, [Syslog](https://betterstack.com/docs/logs/syslog-setup/)
, and [others](https://betterstack.com/docs/logs/start/)
.
### Have any questions?
Please feel free to message us at [hello@betterstack.com](mailto:hello@betterstack.com?subject=Question%20about%20Better%20Stack&body=)
.
We'll get back to you as soon as we can, typically within a few hours. 🙏 Thank you!
* * *
#### You might also like
[\
\
### GCP Load Balancing\
\
Global and regional load balancing for HTTP(S) and TCP/UDP traffic.](https://betterstack.com/dashboards/gcp-load-balancing)
[\
\
### AWS DynamoDB\
\
Fully managed NoSQL key-value and document database.](https://betterstack.com/dashboards/aws-dynamodb)

### Please accept cookies
We use cookies to authenticate users, improve the product user experience, and for [personalized ads](https://business.safety.google/privacy/)
. [Learn more.](https://betterstack.com/privacy)
Deny Accept required Accept all
---
# Elasticsearch dashboard template | Better Stack
[Back to dashboards](https://betterstack.com/dashboards)
Elasticsearch
=============
Scalable, open-source search engine for fast data indexing and real-time analytics.
[Add dashboard](https://telemetry.betterstack.com/team/0/dashboards#template-94570)
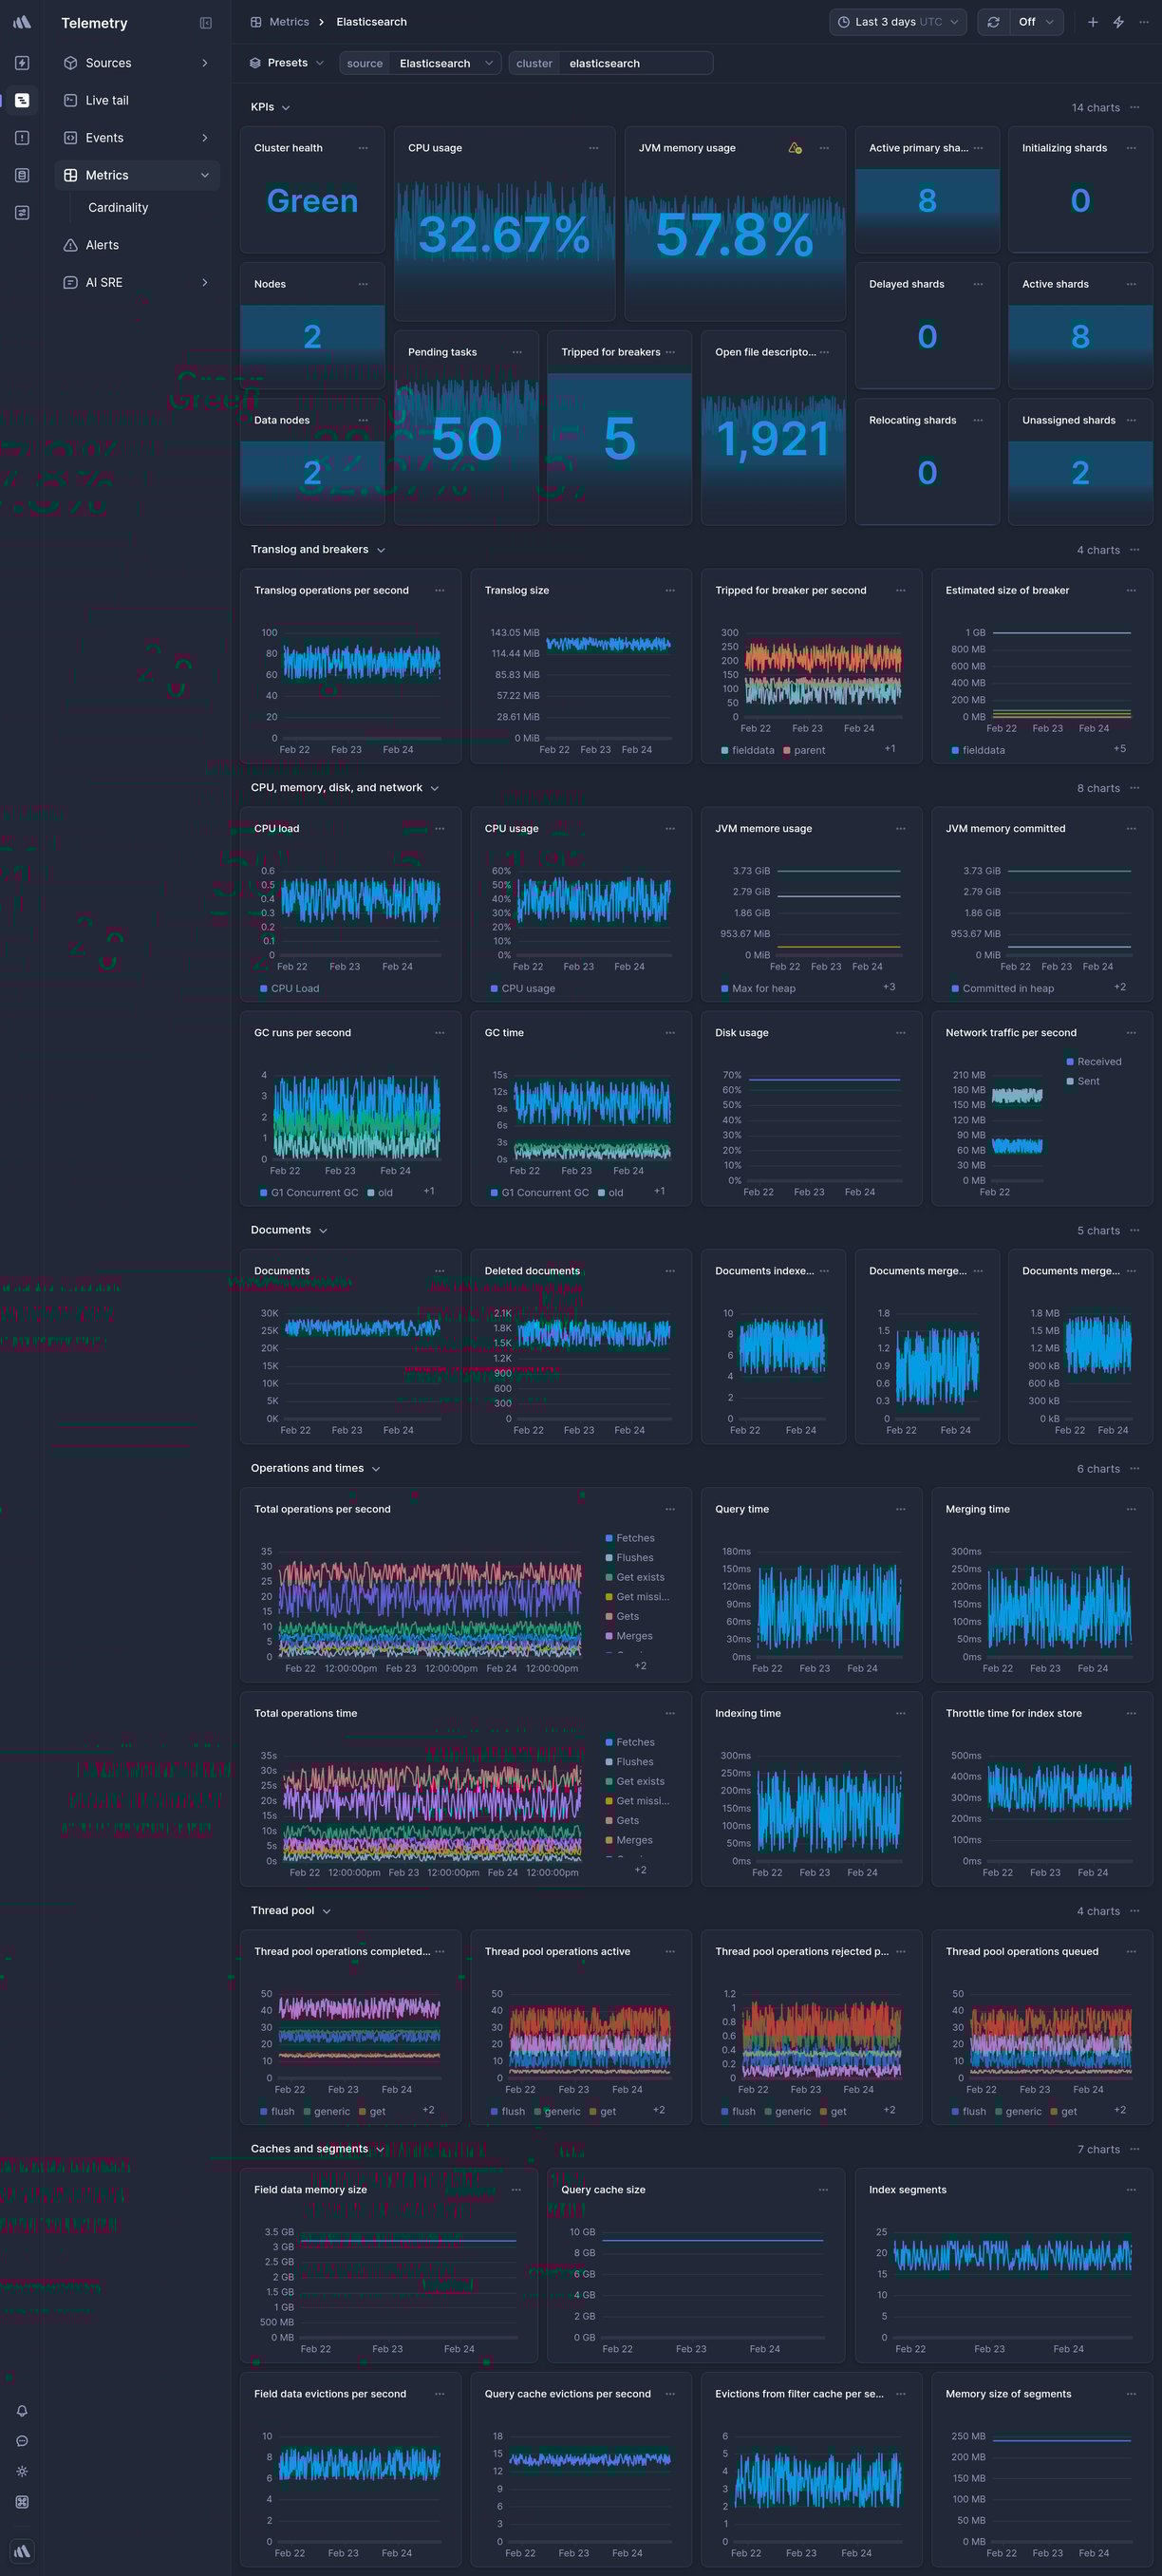
Data source
Elasticsearch
* * *

Overview
--------
This is a ready-made Elasticsearch Telemetry dashboard in Better Stack.
To get it, [sign up](https://betterstack.com/users/sign-up)
for Better Stack, [connect your log or metrics source](https://betterstack.com/docs/logs/logging-start/)
, and select one of the beautiful [pre-built dashboards](https://betterstack.com/dashboards)
you want to get.
### What charts are included
* CPU usage
* Pending tasks
* Total operations per second
* Network traffic per second
* Indexing time
* And much more, explore on your own to see all the chart options.

### How to create a custom chart
Need a custom chart? You can create one by writing a regular SQL query.
Here is how to do it:
1. **Pick a chart type:** the most popular options include a line chart, bar chart, pie chart, a single number, and a live tail (a stream of the newest logs).
2. **Pick a source and timeframe:** we use [variables](https://betterstack.com/docs/logs/dashboards/variables/)
in the SQL queries, which makes it easy to edit and work with any query. The main variables are `source` and `timeframe`. Once you set those, as in the example above, you can use the timeframe switcher easily, and the dashboard will update automatically.
3. **Write your SQL query:** there is no need to use any specific querying language. Just write SQL like you’re used to.
**Learn more:** [How to build SQL queries in Better Stack](https://betterstack.com/docs/logs/dashboards/sql-queries/)

### How to create an alert for a metric
You can get easily alerted on irregularities before they become incidents.
Everything is fully integrated into dashboards, there is no need to set up complex workflows.
Here are the most popular alert types:
* **Threshold Alerts:** Perfect for scenarios where you need to be notified when a metric crosses a certain predefined threshold. For instance, if your application's response time exceeds a set limit, you’ll get an alert.
* **Relative Alerts:** Want to monitor changes in metrics relative to their historical data? Whether it's an unexpected drop in sales, a surge in new user signups, or any other relative metric anomaly, we've got you covered.
* **Anomaly detection:** Use this alerting method if you're unsure about what threshold to set. It will notify you about any significant deviation from the predicted value of the series. Think of this method as covering what you didn’t even know can occur.
**Learn more:** [How to use alerts in Better Stack](https://betterstack.com/docs/logs/dashboards/alerts/)

### How to receive notification about issues
Once you set up what metric irregularities you want to get alerted to, you can select a broad spectrum of notification options.
The most popular include Slack, Microsoft Teams, Phone calls, SMS, emails, webhooks, and more.
The best part is that notifications within Better Stack are unlimited. This way, you don’t have to worry about being charged extra in case of significant incidents.
**Learn more:** [How to use escalation policies in Better Stack](https://betterstack.com/docs/uptime/escalation-policies/)
### How to set up your Elasticsearch dashboard
Once you’ve signed up for [Better Stack](https://betterstack.com/logs)
, you can collect logs and metrics from Elasticsearch in just 2 minutes. Here is the official [documentation](https://betterstack.com/docs/logs/elasticsearch/)
on how to do it.
Are you already using another log forwarder that you’re used to? See the documentation for [Fluent Bit](https://betterstack.com/docs/logs/fluent-bit/)
, [Logstash](https://betterstack.com/docs/logs/logstash/)
, [Fluentd](https://betterstack.com/docs/logs/fluentd/)
, [Filebeat](https://betterstack.com/docs/logs/filebeat/)
, [Syslog](https://betterstack.com/docs/logs/syslog-setup/)
, and [others](https://betterstack.com/docs/logs/start/)
.
### Have any questions?
Please feel free to message us at [hello@betterstack.com](mailto:hello@betterstack.com?subject=Question%20about%20Better%20Stack&body=)
.
We'll get back to you as soon as we can, typically within a few hours. 🙏 Thank you!
* * *
#### You might also like
[\
\
### Nginx\
\
Web server, reverse proxy, and load balancer.](https://betterstack.com/dashboards/nginx)
[\
\
### Cloudflare HTTP Requests\
\
HTTP requests processed by Cloudflare. Uses http\_requests Logpush dataset.](https://betterstack.com/dashboards/cloudflare-logpush-http-requests)

### Please accept cookies
We use cookies to authenticate users, improve the product user experience, and for [personalized ads](https://business.safety.google/privacy/)
. [Learn more.](https://betterstack.com/privacy)
Deny Accept required Accept all
---
# RabbitMQ dashboard template | Better Stack
[Back to dashboards](https://betterstack.com/dashboards)
RabbitMQ
========
Open-source message broker for complex message routing between systems.
[Add dashboard](https://telemetry.betterstack.com/team/0/dashboards#template-94568)
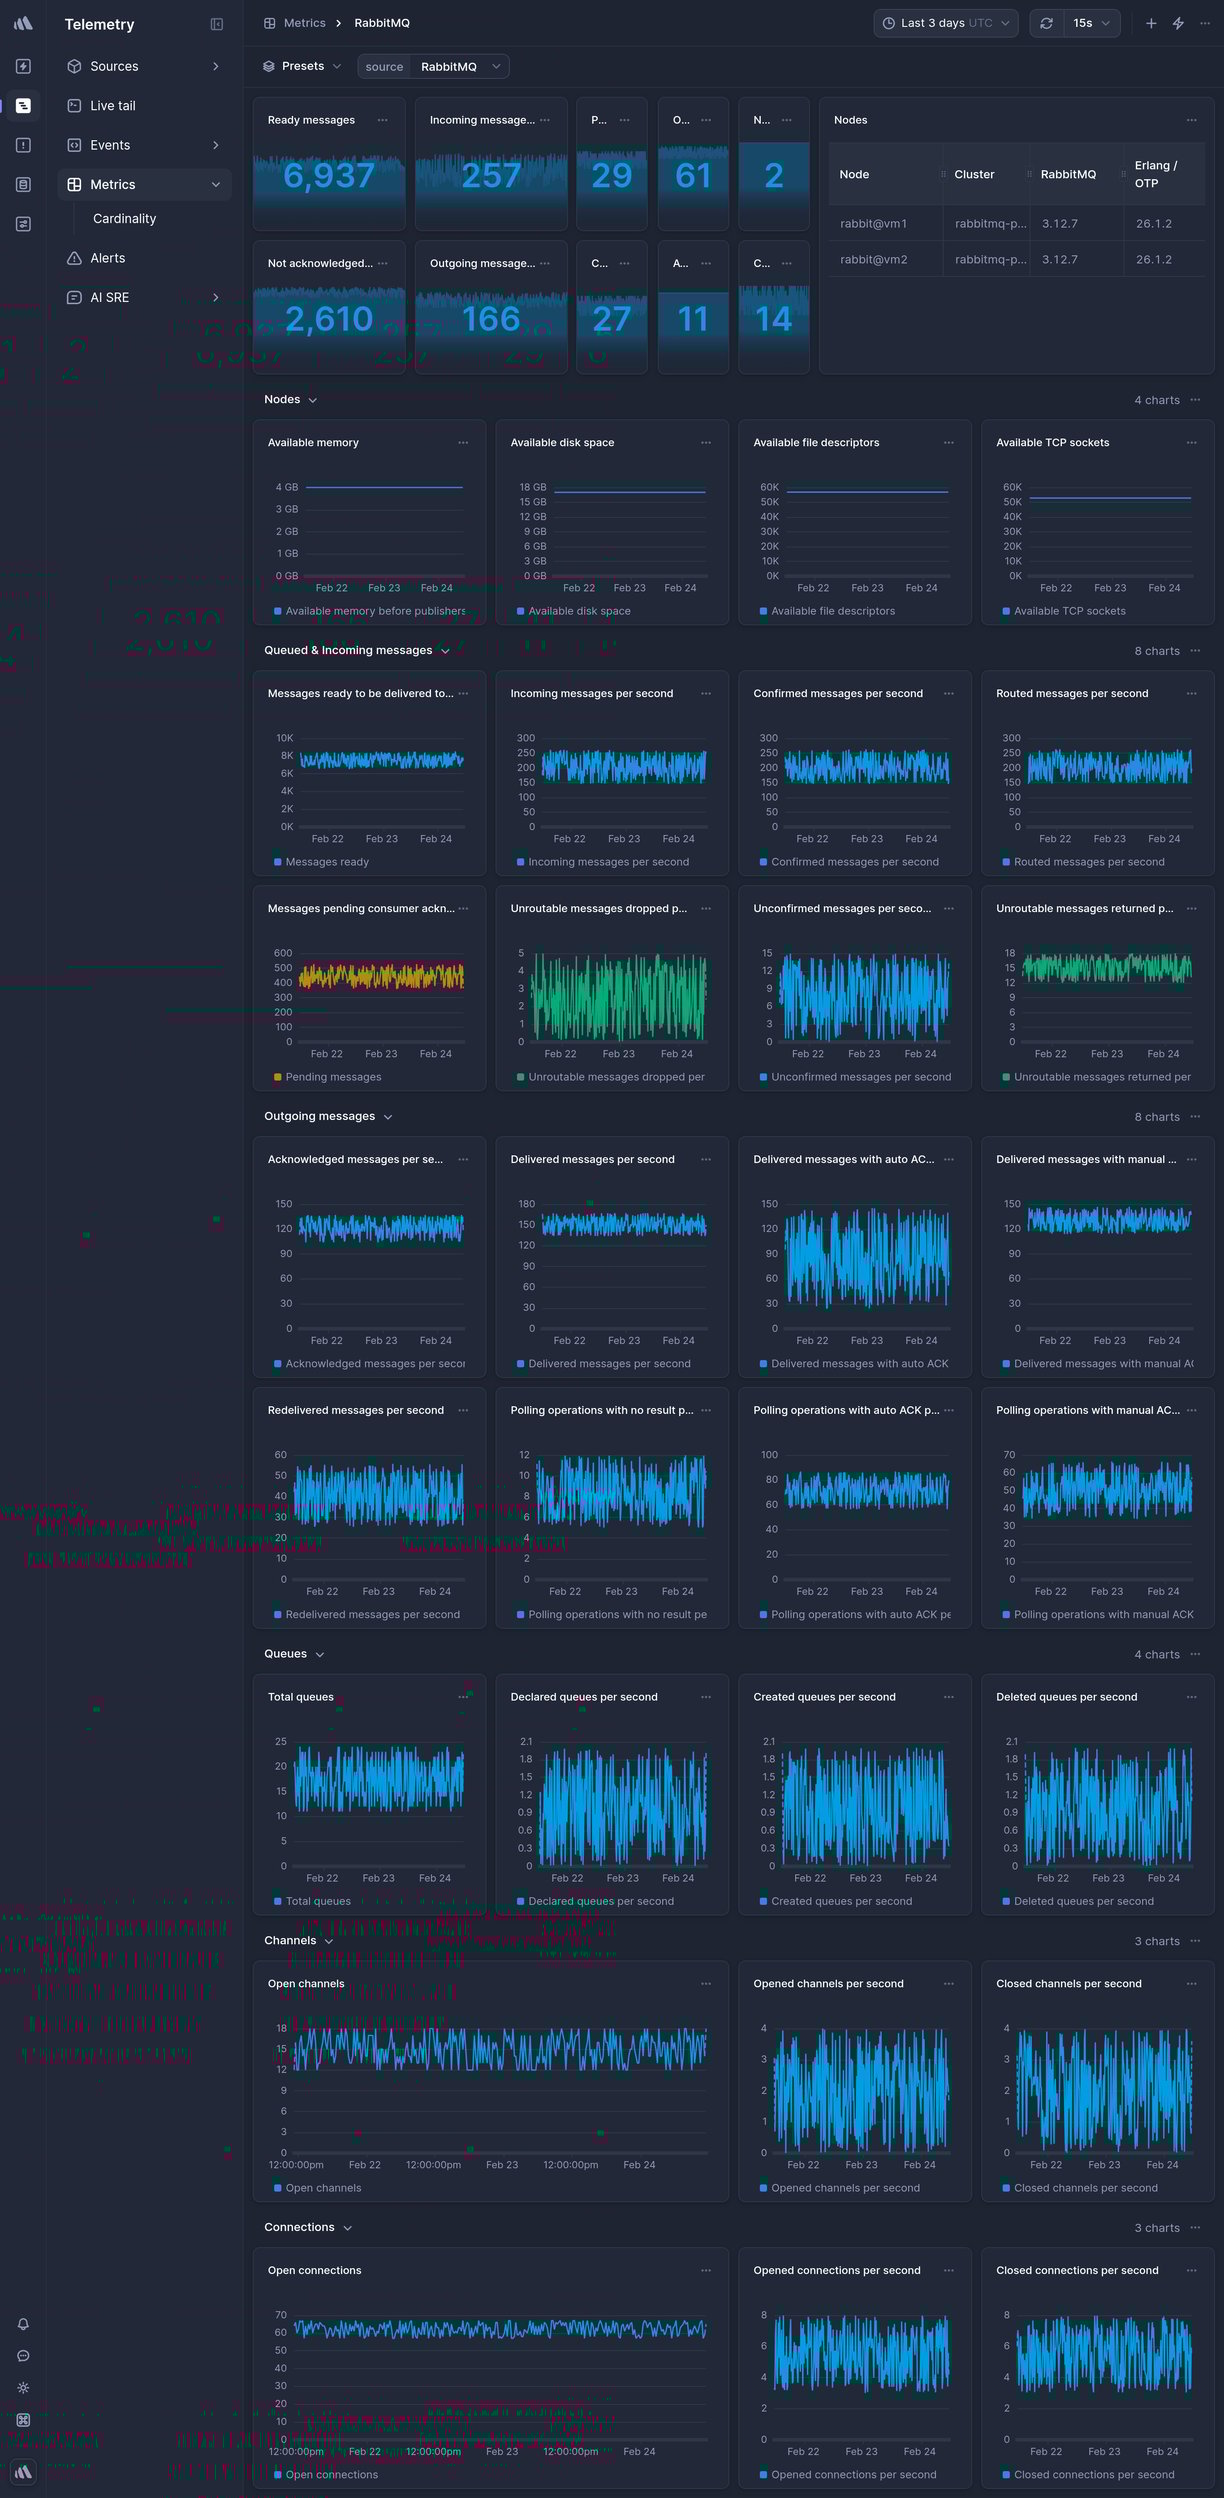
Data source
RabbitMQ
* * *

Overview
--------
This is a ready-made RabbitMQ Telemetry dashboard in Better Stack.
To get it, [sign up](https://betterstack.com/users/sign-up)
for Better Stack, [connect your log or metrics source](https://betterstack.com/docs/logs/logging-start/)
, and select one of the beautiful [pre-built dashboards](https://betterstack.com/dashboards)
you want to get.
### What charts are included
* Ready messages
* Publishers
* Open connections
* Incoming messages per second
* Acknowledged messages per second
* And much more, explore on your own to see all the chart options.

### How to create a custom chart
Need a custom chart? You can create one by writing a regular SQL query.
Here is how to do it:
1. **Pick a chart type:** the most popular options include a line chart, bar chart, pie chart, a single number, and a live tail (a stream of the newest logs).
2. **Pick a source and timeframe:** we use [variables](https://betterstack.com/docs/logs/dashboards/variables/)
in the SQL queries, which makes it easy to edit and work with any query. The main variables are `source` and `timeframe`. Once you set those, as in the example above, you can use the timeframe switcher easily, and the dashboard will update automatically.
3. **Write your SQL query:** there is no need to use any specific querying language. Just write SQL like you’re used to.
**Learn more:** [How to build SQL queries in Better Stack](https://betterstack.com/docs/logs/dashboards/sql-queries/)

### How to create an alert for a metric
You can get easily alerted on irregularities before they become incidents.
Everything is fully integrated into dashboards, there is no need to set up complex workflows.
Here are the most popular alert types:
* **Threshold Alerts:** Perfect for scenarios where you need to be notified when a metric crosses a certain predefined threshold. For instance, if your application's response time exceeds a set limit, you’ll get an alert.
* **Relative Alerts:** Want to monitor changes in metrics relative to their historical data? Whether it's an unexpected drop in sales, a surge in new user signups, or any other relative metric anomaly, we've got you covered.
* **Anomaly detection:** Use this alerting method if you're unsure about what threshold to set. It will notify you about any significant deviation from the predicted value of the series. Think of this method as covering what you didn’t even know can occur.
**Learn more:** [How to use alerts in Better Stack](https://betterstack.com/docs/logs/dashboards/alerts/)

### How to receive notification about issues
Once you set up what metric irregularities you want to get alerted to, you can select a broad spectrum of notification options.
The most popular include Slack, Microsoft Teams, Phone calls, SMS, emails, webhooks, and more.
The best part is that notifications within Better Stack are unlimited. This way, you don’t have to worry about being charged extra in case of significant incidents.
**Learn more:** [How to use escalation policies in Better Stack](https://betterstack.com/docs/uptime/escalation-policies/)
### How to set up your RabbitMQ dashboard
Once you’ve signed up for [Better Stack](https://betterstack.com/logs)
, you can collect logs and metrics from RabbitMQ in just 2 minutes. Here is the official [documentation](https://betterstack.com/docs/logs/rabbitmq/)
on how to do it.
Are you already using another log forwarder that you’re used to? See the documentation for [Fluent Bit](https://betterstack.com/docs/logs/fluent-bit/)
, [Logstash](https://betterstack.com/docs/logs/logstash/)
, [Fluentd](https://betterstack.com/docs/logs/fluentd/)
, [Filebeat](https://betterstack.com/docs/logs/filebeat/)
, [Syslog](https://betterstack.com/docs/logs/syslog-setup/)
, and [others](https://betterstack.com/docs/logs/start/)
.
### Have any questions?
Please feel free to message us at [hello@betterstack.com](mailto:hello@betterstack.com?subject=Question%20about%20Better%20Stack&body=)
.
We'll get back to you as soon as we can, typically within a few hours. 🙏 Thank you!
* * *
#### You might also like
[\
\
### MySQL\
\
Open-source relational database management system.](https://betterstack.com/dashboards/mysql)
[\
\
### GCP Cloud SQL\
\
Managed MySQL and PostgreSQL relational databases on Google Cloud.](https://betterstack.com/dashboards/gcp-cloud-sql)

### Please accept cookies
We use cookies to authenticate users, improve the product user experience, and for [personalized ads](https://business.safety.google/privacy/)
. [Learn more.](https://betterstack.com/privacy)
Deny Accept required Accept all
---
# Uptime API and Terraform | Demos
###### Explore documentation
* [Explore demos 👋](https://betterstack.com/demos/welcome/)
* [AI SRE & MCP server](https://betterstack.com/demos/ai-sre-and-mcp-server/)
* [Uptime](https://betterstack.com/demos/uptime-api/)
1. [Incidents](https://betterstack.com/demos/incident-management/)
2. [On-call and escalations](https://betterstack.com/demos/on-call/)
3. [Monitors](https://betterstack.com/demos/monitoring/)
4. [Heartbeats](https://betterstack.com/demos/uptime/heartbeats/)
5. [Status pages](https://betterstack.com/demos/status-page/)
6. [Integrations](https://betterstack.com/demos/uptime/integrations/)
7. [Reporting](https://betterstack.com/demos/reporting/)
8. [API and Terraform](https://betterstack.com/demos/uptime-api/)
* [Telemetry](https://betterstack.com/demos/uptime-api/)
1. [Sources](https://betterstack.com/demos/services/)
2. [Live tail](https://betterstack.com/demos/live-tail/)
3. [Events](https://betterstack.com/demos/logs/explore/)
4. [Metrics](https://betterstack.com/demos/metrics/)
5. [Alerts](https://betterstack.com/demos/logs/alerts/)
6. [AI SRE ↗](https://betterstack.com/demos/ai-sre-and-mcp-server/)
* [Errors](https://betterstack.com/demos/errors/)
1. [Error tracking](https://betterstack.com/demos/errors-intro/)
* [Warehouse](https://betterstack.com/demos/uptime-api/)
1. [Sources](https://betterstack.com/demos/warehouse-data/)
2. [Queries as APIs](https://betterstack.com/demos/warehouse-queries/)
3. [Ad-hoc SQL API](https://betterstack.com/demos/warehouse/ad-hoc-sql-api/)
* [Other](https://betterstack.com/demos/uptime-api/)
1. [Organization and teams](https://betterstack.com/demos/organisation-management/)
Uptime API and Terraform
========================
See how you can automate your workflows in Better Stack.
### Related resources
* [Documentation: Uptime API](https://betterstack.com/docs/uptime/api/getting-started-with-uptime-api/)
* [Terraform](https://registry.terraform.io/providers/BetterStackHQ/better-uptime/latest/docs)
MCP Server
----------
Connect AI assistants to your Uptime and Telemetry data through the Model Context Protocol.
* * *
[Previous article\
\
Uptime reporting](https://betterstack.com/demos/reporting/)
[Next article\
\
Telemetry sources](https://betterstack.com/demos/services/)
###### On this page
* [MCP Server](https://betterstack.com/demos/uptime-api/#mcp-server)
### Please accept cookies
We use cookies to authenticate users, improve the product user experience, and for [personalized ads](https://business.safety.google/privacy/)
. [Learn more.](https://betterstack.com/privacy)
Deny Accept required Accept all
---
# Uptime reporting | Demos
###### Explore documentation
* [Explore demos 👋](https://betterstack.com/demos/welcome/)
* [AI SRE & MCP server](https://betterstack.com/demos/ai-sre-and-mcp-server/)
* [Uptime](https://betterstack.com/demos/reporting/)
1. [Incidents](https://betterstack.com/demos/incident-management/)
2. [On-call and escalations](https://betterstack.com/demos/on-call/)
3. [Monitors](https://betterstack.com/demos/monitoring/)
4. [Heartbeats](https://betterstack.com/demos/uptime/heartbeats/)
5. [Status pages](https://betterstack.com/demos/status-page/)
6. [Integrations](https://betterstack.com/demos/uptime/integrations/)
7. [Reporting](https://betterstack.com/demos/reporting/)
8. [API and Terraform](https://betterstack.com/demos/uptime-api/)
* [Telemetry](https://betterstack.com/demos/reporting/)
1. [Sources](https://betterstack.com/demos/services/)
2. [Live tail](https://betterstack.com/demos/live-tail/)
3. [Events](https://betterstack.com/demos/logs/explore/)
4. [Metrics](https://betterstack.com/demos/metrics/)
5. [Alerts](https://betterstack.com/demos/logs/alerts/)
6. [AI SRE ↗](https://betterstack.com/demos/ai-sre-and-mcp-server/)
* [Errors](https://betterstack.com/demos/errors/)
1. [Error tracking](https://betterstack.com/demos/errors-intro/)
* [Warehouse](https://betterstack.com/demos/reporting/)
1. [Sources](https://betterstack.com/demos/warehouse-data/)
2. [Queries as APIs](https://betterstack.com/demos/warehouse-queries/)
3. [Ad-hoc SQL API](https://betterstack.com/demos/warehouse/ad-hoc-sql-api/)
* [Other](https://betterstack.com/demos/reporting/)
1. [Organization and teams](https://betterstack.com/demos/organisation-management/)
Uptime reporting
================
See how to use built-in reporting to analyze common metrics like MTTR and MTTA.
* * *
[Previous article\
\
Uptime integrations](https://betterstack.com/demos/uptime/integrations/)
[Next article\
\
Uptime API and Terraform](https://betterstack.com/demos/uptime-api/)
### Please accept cookies
We use cookies to authenticate users, improve the product user experience, and for [personalized ads](https://business.safety.google/privacy/)
. [Learn more.](https://betterstack.com/privacy)
Deny Accept required Accept all
---
# Bulk importing monitors | Better Stack Documentation
###### Explore documentation
* [Welcome to Uptime 👋](https://betterstack.com/docs/uptime/start/)
* [Frequently Asked Questions](https://betterstack.com/docs/uptime/frequently-asked-questions/)
* [On-call scheduling and alerting](https://betterstack.com/docs/uptime/bulk-importing-monitors/)
1. [Get started](https://betterstack.com/docs/uptime/getting-started-with-oncall-v2/)
2. [Slack and other integrations ↗](https://betterstack.com/docs/uptime/slack/)
3. [Connecting external calendars](https://betterstack.com/docs/uptime/connecting-external-calendars/)
4. [Advanced guide](https://betterstack.com/docs/uptime/escalation-policies/)
* [Incidents](https://betterstack.com/docs/uptime/bulk-importing-monitors/)
1. [Get started](https://betterstack.com/docs/uptime/working-with-incidents/)
2. [Advanced guide](https://betterstack.com/docs/uptime/post-mortems/)
3. [Reporting ↗](https://betterstack.com/docs/getting-started/team-and-account-management/reporting/)
* [Monitoring](https://betterstack.com/docs/uptime/bulk-importing-monitors/)
1. [Get started](https://betterstack.com/docs/uptime/monitoring-start/)
2. [Working with monitors](https://betterstack.com/docs/uptime/bulk-importing-monitors/)
1. [Bulk importing monitors](https://betterstack.com/docs/uptime/bulk-importing-monitors/)
2. [Grouping and ordering monitors](https://betterstack.com/docs/uptime/grouping-and-ordering-monitors/)
3. [Pausing monitors and maintenances](https://betterstack.com/docs/uptime/pausing-monitors-and-maintenances/)
4. [Removing monitors](https://betterstack.com/docs/uptime/removing-monitors/)
3. [Customizing monitors](https://betterstack.com/docs/uptime/naming-monitors/)
4. [Monitor types](https://betterstack.com/docs/uptime/uptime-monitor/)
* [Status pages](https://betterstack.com/docs/uptime/bulk-importing-monitors/)
1. [Get started](https://betterstack.com/docs/uptime/getting-started-with-status-pages/)
2. [Advanced guide](https://betterstack.com/docs/uptime/custom-subdomain/)
* [Uptime API](https://betterstack.com/docs/uptime/bulk-importing-monitors/)
1. [Getting an API token](https://betterstack.com/docs/uptime/api/getting-started-with-uptime-api/)
2. [Monitors](https://betterstack.com/docs/uptime/api/list-all-existing-monitors/)
3. [Heartbeats](https://betterstack.com/docs/uptime/api/list-all-existing-hearbeats/)
4. [On-call & incidents](https://betterstack.com/docs/uptime/api/on-call-calendar/)
5. [Status pages](https://betterstack.com/docs/uptime/api/list-all-existing-status-pages/)
6. [Metadata](https://betterstack.com/docs/uptime/api/metadata/)
7. [Integrations](https://betterstack.com/docs/uptime/api/list-all-new-relic-integrations/)
8. [Team members](https://betterstack.com/docs/uptime/api/team-members/list/)
Bulk importing monitors
=======================
You can use the [Monitors API](https://betterstack.com/docs/uptime/api/getting-started-with-uptime-api/)
to import multiple monitors at once or to import them from your dashboard:
* Go to **Create monitor**.
* Click **You can import multiple monitors here** just below the **URL to monitor** field.
* Paste or type in the list of URLs you'd like to import; make sure to keep it one URL per line.
* Edit the configuration.
* Click **Create monitors**.
### Need help with migration from an alternative service?
Please message us at **[hello@betterstack.com](mailto:hello@betterstack.com)
**, and we will help you with the transition.
* * *
[Previous article\
\
Get started with monitoring](https://betterstack.com/docs/uptime/monitoring-start/)
[Next article\
\
Grouping and ordering monitors](https://betterstack.com/docs/uptime/grouping-and-ordering-monitors/)
### Please accept cookies
We use cookies to authenticate users, improve the product user experience, and for [personalized ads](https://business.safety.google/privacy/)
. [Learn more.](https://betterstack.com/privacy)
Deny Accept required Accept all
---
# Services dashboard template | Better Stack
[Back to dashboards](https://betterstack.com/dashboards)
Services
========
Monitor application services and their performance metrics.
[Add dashboard](https://telemetry.betterstack.com/team/0/dashboards#template-95580)
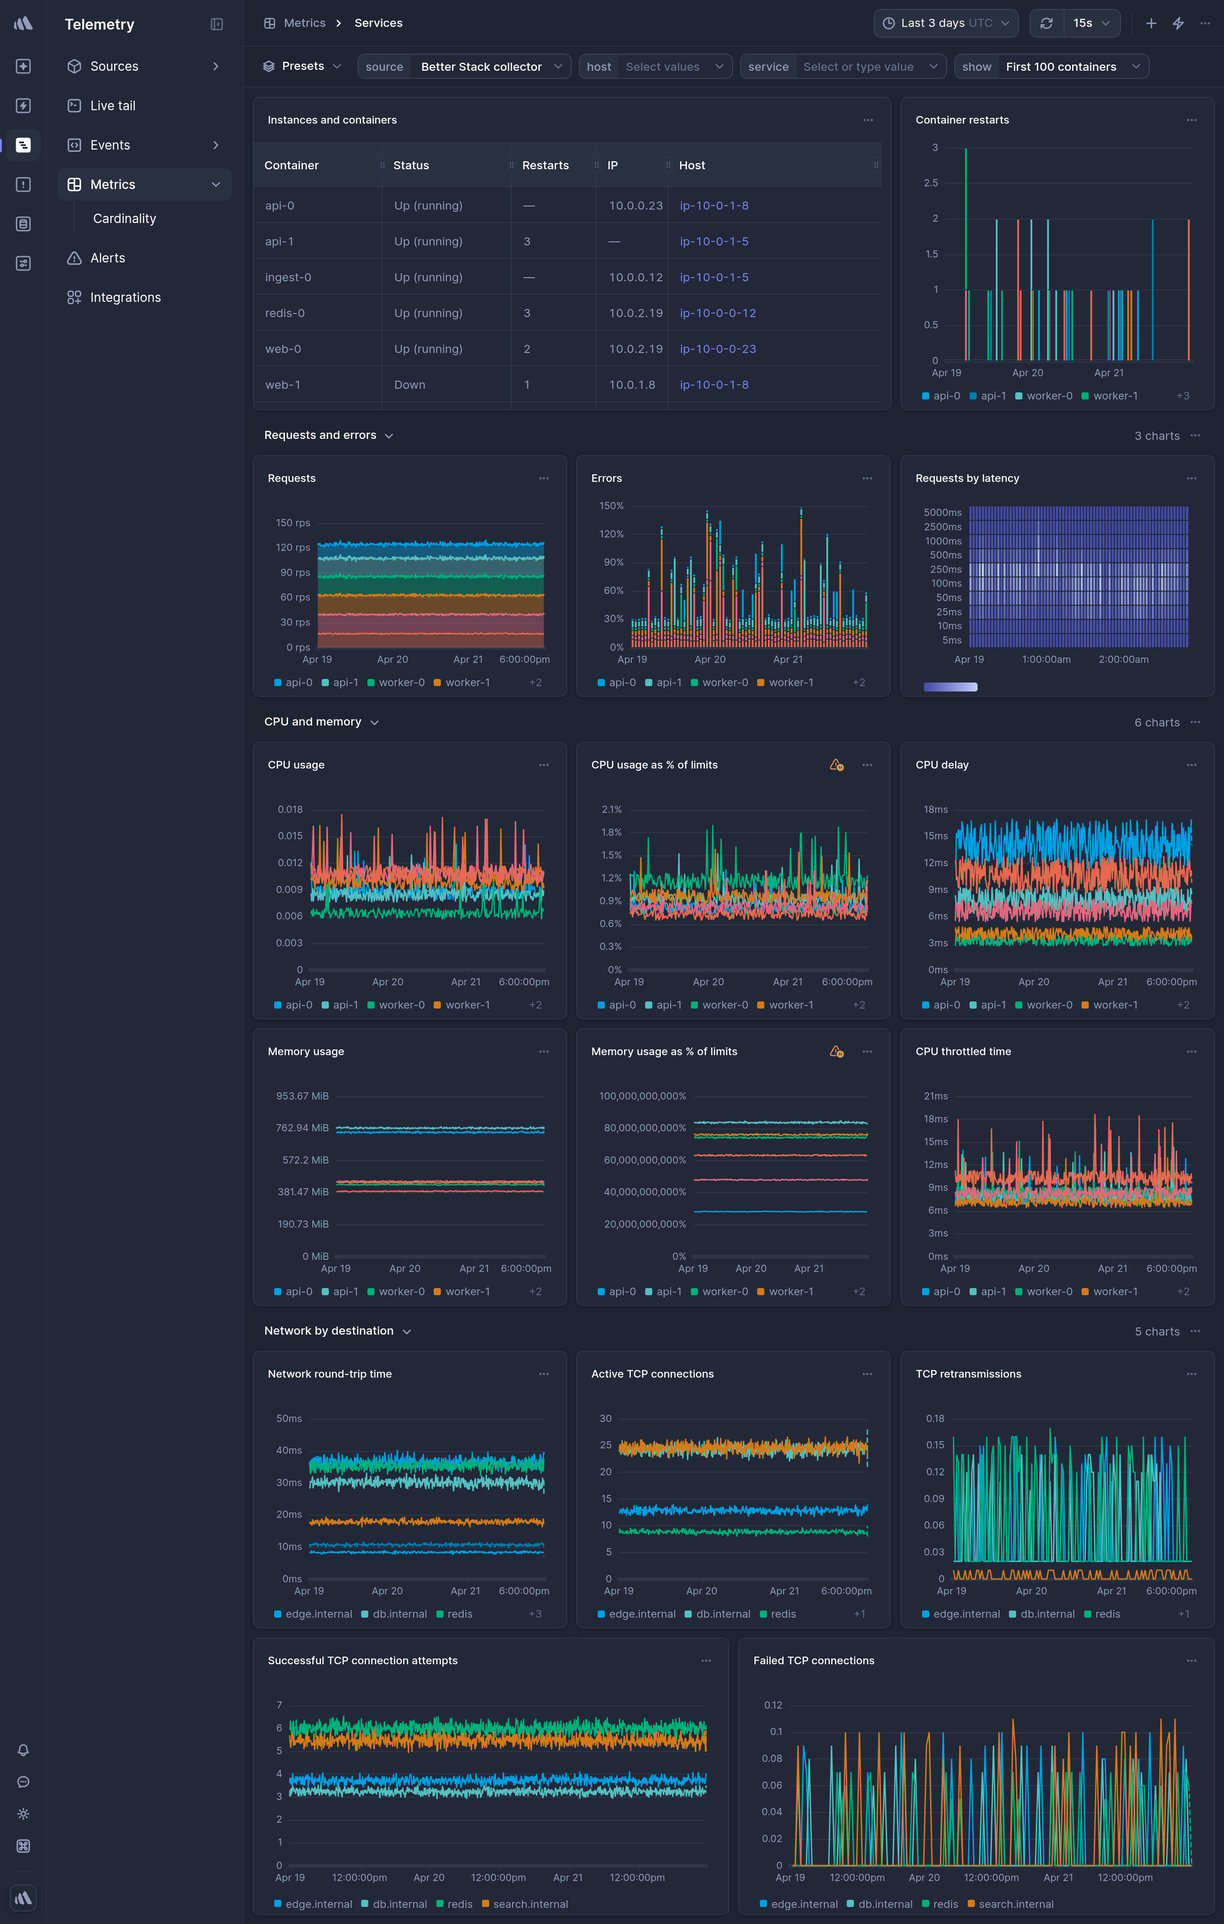
Data source
Service Metrics
* * *

Overview
--------
This is a ready-made Services Telemetry dashboard in Better Stack.
To get it, [sign up](https://betterstack.com/users/sign-up)
for Better Stack, [connect your log or metrics source](https://betterstack.com/docs/logs/logging-start/)
, and select one of the beautiful [pre-built dashboards](https://betterstack.com/dashboards)
you want to get.
### What charts are included
* Service uptime
* Response times
* Error rates
* Throughput
* And much more, explore on your own to see all the chart options.

### How to create a custom chart
Need a custom chart? You can create one by writing a regular SQL query.
Here is how to do it:
1. **Pick a chart type:** the most popular options include a line chart, bar chart, pie chart, a single number, and a live tail (a stream of the newest logs).
2. **Pick a source and timeframe:** we use [variables](https://betterstack.com/docs/logs/dashboards/variables/)
in the SQL queries, which makes it easy to edit and work with any query. The main variables are `source` and `timeframe`. Once you set those, as in the example above, you can use the timeframe switcher easily, and the dashboard will update automatically.
3. **Write your SQL query:** there is no need to use any specific querying language. Just write SQL like you’re used to.
**Learn more:** [How to build SQL queries in Better Stack](https://betterstack.com/docs/logs/dashboards/sql-queries/)

### How to create an alert for a metric
You can get easily alerted on irregularities before they become incidents.
Everything is fully integrated into dashboards, there is no need to set up complex workflows.
Here are the most popular alert types:
* **Threshold Alerts:** Perfect for scenarios where you need to be notified when a metric crosses a certain predefined threshold. For instance, if your application's response time exceeds a set limit, you’ll get an alert.
* **Relative Alerts:** Want to monitor changes in metrics relative to their historical data? Whether it's an unexpected drop in sales, a surge in new user signups, or any other relative metric anomaly, we've got you covered.
* **Anomaly detection:** Use this alerting method if you're unsure about what threshold to set. It will notify you about any significant deviation from the predicted value of the series. Think of this method as covering what you didn’t even know can occur.
**Learn more:** [How to use alerts in Better Stack](https://betterstack.com/docs/logs/dashboards/alerts/)

### How to receive notification about issues
Once you set up what metric irregularities you want to get alerted to, you can select a broad spectrum of notification options.
The most popular include Slack, Microsoft Teams, Phone calls, SMS, emails, webhooks, and more.
The best part is that notifications within Better Stack are unlimited. This way, you don’t have to worry about being charged extra in case of significant incidents.
**Learn more:** [How to use escalation policies in Better Stack](https://betterstack.com/docs/uptime/escalation-policies/)
### How to set up your Services dashboard
Once you’ve signed up for [Better Stack](https://betterstack.com/logs)
, you can collect logs and metrics from Services in just 2 minutes. Here is the official [documentation](https://betterstack.com/docs/logs/collector/)
on how to do it.
Are you already using another log forwarder that you’re used to? See the documentation for [Fluent Bit](https://betterstack.com/docs/logs/fluent-bit/)
, [Logstash](https://betterstack.com/docs/logs/logstash/)
, [Fluentd](https://betterstack.com/docs/logs/fluentd/)
, [Filebeat](https://betterstack.com/docs/logs/filebeat/)
, [Syslog](https://betterstack.com/docs/logs/syslog-setup/)
, and [others](https://betterstack.com/docs/logs/start/)
.
### Have any questions?
Please feel free to message us at [hello@betterstack.com](mailto:hello@betterstack.com?subject=Question%20about%20Better%20Stack&body=)
.
We'll get back to you as soon as we can, typically within a few hours. 🙏 Thank you!
* * *
#### You might also like
[\
\
### GCP Load Balancing\
\
Global and regional load balancing for HTTP(S) and TCP/UDP traffic.](https://betterstack.com/dashboards/gcp-load-balancing)
[\
\
### Host (Vector)\
\
Monitor your server with Vector metrics.](https://betterstack.com/dashboards/vector)

### Please accept cookies
We use cookies to authenticate users, improve the product user experience, and for [personalized ads](https://business.safety.google/privacy/)
. [Learn more.](https://betterstack.com/privacy)
Deny Accept required Accept all
---
# On-call and escalations | Demos
###### Explore documentation
* [Explore demos 👋](https://betterstack.com/demos/welcome/)
* [AI SRE & MCP server](https://betterstack.com/demos/ai-sre-and-mcp-server/)
* [Uptime](https://betterstack.com/demos/on-call/)
1. [Incidents](https://betterstack.com/demos/incident-management/)
2. [On-call and escalations](https://betterstack.com/demos/on-call/)
3. [Monitors](https://betterstack.com/demos/monitoring/)
4. [Heartbeats](https://betterstack.com/demos/uptime/heartbeats/)
5. [Status pages](https://betterstack.com/demos/status-page/)
6. [Integrations](https://betterstack.com/demos/uptime/integrations/)
7. [Reporting](https://betterstack.com/demos/reporting/)
8. [API and Terraform](https://betterstack.com/demos/uptime-api/)
* [Telemetry](https://betterstack.com/demos/on-call/)
1. [Sources](https://betterstack.com/demos/services/)
2. [Live tail](https://betterstack.com/demos/live-tail/)
3. [Events](https://betterstack.com/demos/logs/explore/)
4. [Metrics](https://betterstack.com/demos/metrics/)
5. [Alerts](https://betterstack.com/demos/logs/alerts/)
6. [AI SRE ↗](https://betterstack.com/demos/ai-sre-and-mcp-server/)
* [Errors](https://betterstack.com/demos/errors/)
1. [Error tracking](https://betterstack.com/demos/errors-intro/)
* [Warehouse](https://betterstack.com/demos/on-call/)
1. [Sources](https://betterstack.com/demos/warehouse-data/)
2. [Queries as APIs](https://betterstack.com/demos/warehouse-queries/)
3. [Ad-hoc SQL API](https://betterstack.com/demos/warehouse/ad-hoc-sql-api/)
* [Other](https://betterstack.com/demos/on-call/)
1. [Organization and teams](https://betterstack.com/demos/organisation-management/)
On-call and escalations
=======================
See how to create and manage the on-call rotations calendar.
Primary & secondary on-call
---------------------------
See how to create a common multiple on-call calendars setup.
Advanced escalation flows
-------------------------
See how to set up an advanced incident management workflow with multiple on-call schedules and escalation policies.
Escalation policies
-------------------
See how to manage alerting workflows and use time-based rules, to-do lists, integrations, metadata rules, and more.
Severities
----------
See how to manage the way you and your team get alerted.
Call routing
------------
See how to create a routing number that will connect you with the current on-call person and let you report incidents via phone.
Maintenance
-----------
See how to create maintenance for specific monitors as well as team-wide maintenance.
* * *
[Previous article\
\
Incident management](https://betterstack.com/demos/incident-management/)
[Next article\
\
Monitors](https://betterstack.com/demos/monitoring/)
###### On this page
* [Primary & secondary on-call](https://betterstack.com/demos/on-call/#primary-secondary-on-call)
* [Advanced escalation flows](https://betterstack.com/demos/on-call/#advanced-escalation-flows)
* [Escalation policies](https://betterstack.com/demos/on-call/#escalation-policies)
* [Severities](https://betterstack.com/demos/on-call/#severities)
* [Call routing](https://betterstack.com/demos/on-call/#call-routing)
* [Maintenance](https://betterstack.com/demos/on-call/#maintenance)
### Please accept cookies
We use cookies to authenticate users, improve the product user experience, and for [personalized ads](https://business.safety.google/privacy/)
. [Learn more.](https://betterstack.com/privacy)
Deny Accept required Accept all
---
# Slack | Better Stack Documentation
###### Explore documentation
* [Welcome to Errors 👋](https://betterstack.com/docs/errors/start/)
1. [JavaScript tag](https://betterstack.com/docs/errors/js-tag/start/)
* [Collecting errors](https://betterstack.com/docs/errors/integrations/slack/)
1. [Integrating using an AI prompt](https://betterstack.com/docs/errors/collecting-errors/ai-prompt/)
2. [Sentry SDK](https://betterstack.com/docs/errors/collecting-errors/sentry-sdk/)
* [Using the product](https://betterstack.com/docs/errors/integrations/slack/)
1. [Exception grouping](https://betterstack.com/docs/errors/using-the-product/exception-grouping/)
2. [Fix with AI](https://betterstack.com/docs/errors/using-the-product/fix-with-ai/)
3. [Releases](https://betterstack.com/docs/errors/using-the-product/releases/)
4. [Uploading source maps](https://betterstack.com/docs/errors/collecting-errors/upload-source-maps/)
* [Integrations](https://betterstack.com/docs/errors/integrations/slack/)
1. [Reporting incidents](https://betterstack.com/docs/errors/integrations/creating-incidents/)
2. [Slack](https://betterstack.com/docs/errors/integrations/slack/)
3. [Microsoft Teams](https://betterstack.com/docs/errors/integrations/ms-teams/)
4. [Linear](https://betterstack.com/docs/errors/integrations/linear/)
5. [Jira](https://betterstack.com/docs/errors/integrations/jira/)
6. [GitHub](https://betterstack.com/docs/errors/integrations/github/)
* [Errors API](https://betterstack.com/docs/errors/integrations/slack/)
1. [Getting an API token](https://betterstack.com/docs/errors/api/getting-api-token/)
2. [Applications API](https://betterstack.com/docs/errors/api/applications/list/)
3. [Application groups API](https://betterstack.com/docs/errors/api/applications-groups/list/)
Slack
=====
Integrate Better Stack with Slack to **receive error notifications and manage errors from Slack**.
Setting up the integration
--------------------------
1. Navigate to **Errors** -> [Integrations](https://errors.betterstack.com/team/0/integrations/)
.
2. Find the **Slack** integration and click **Add**.
3. Follow the authorization steps to connect your Slack workspace.
4. Configure the integration settings and click **Save changes**.

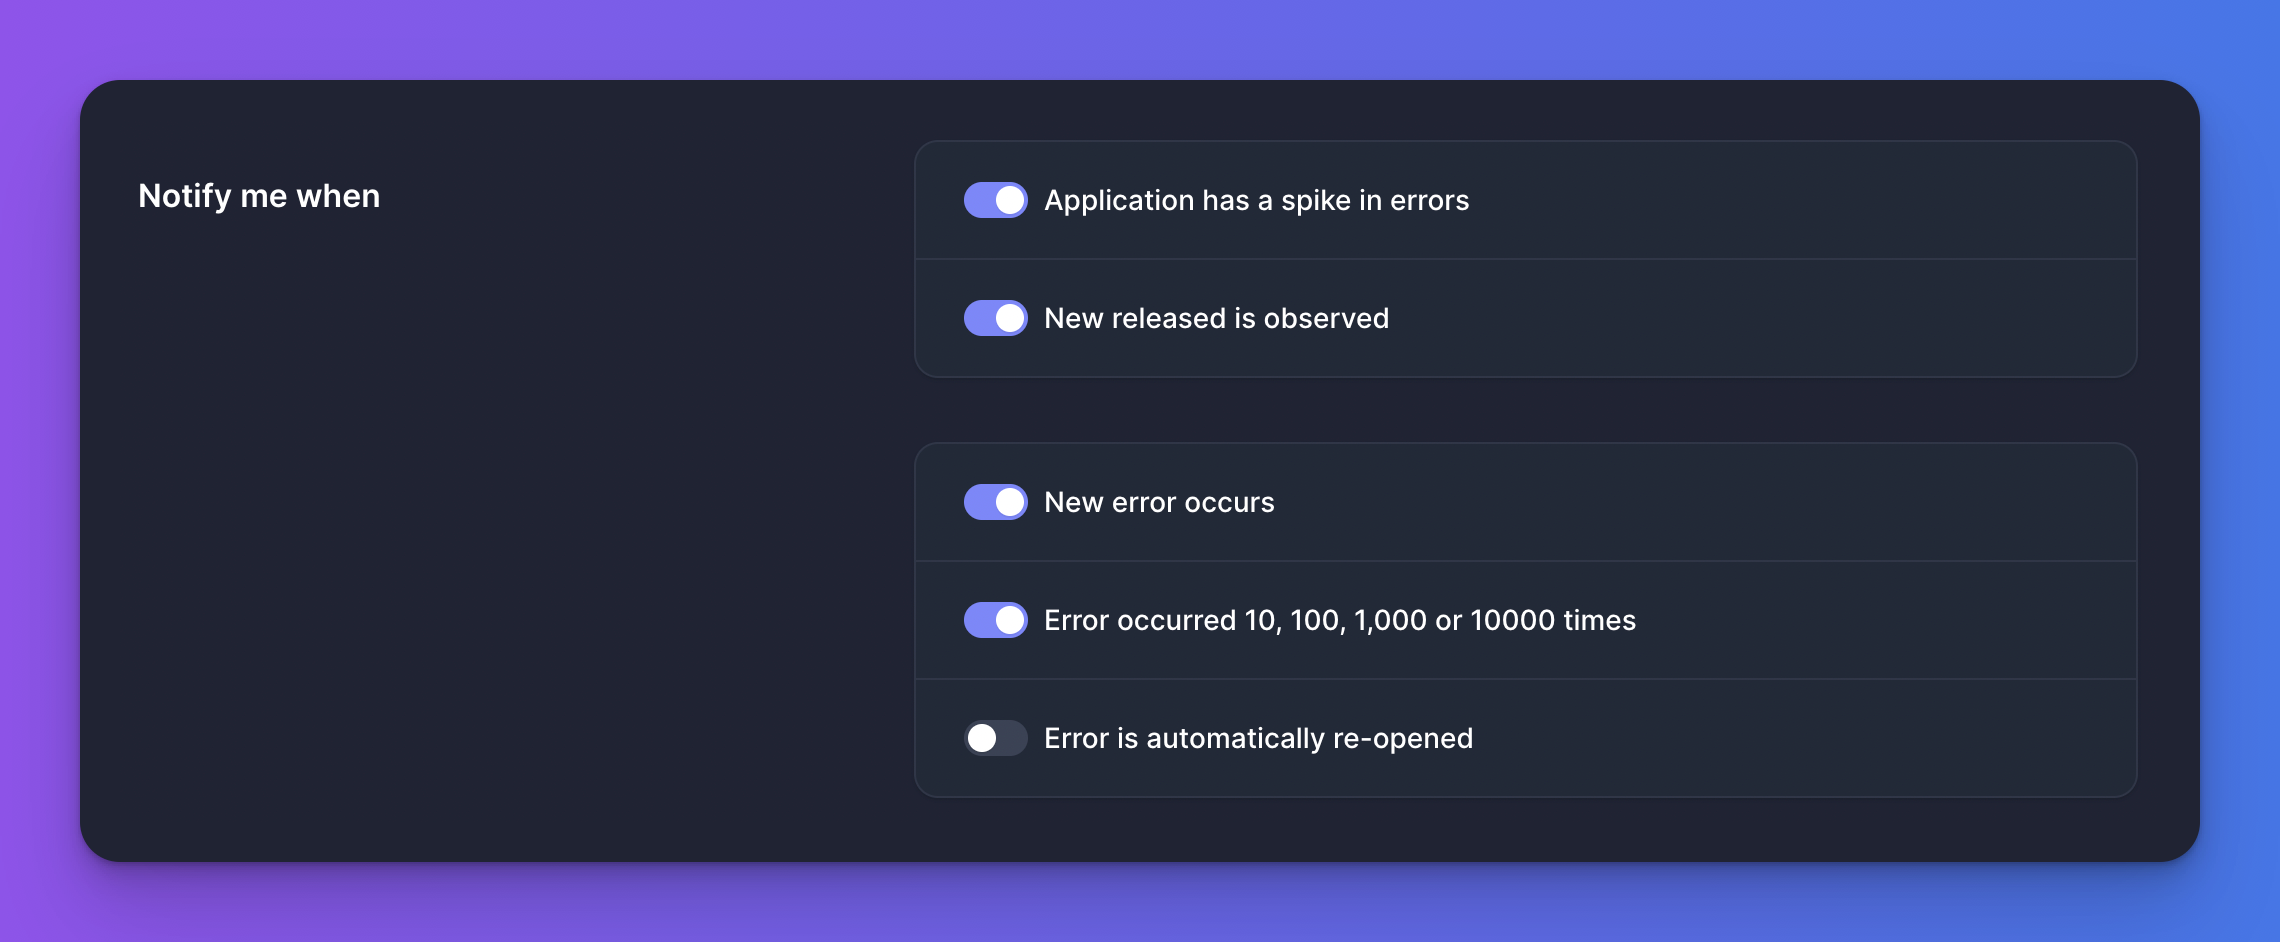
Customizing the notifications
-----------------------------
* Receive **automatic alerts in your designated Slack channels** with error details, stack traces, and affected users.
* Use **reaction buttons in Slack** to directly resolve or ignore an error.

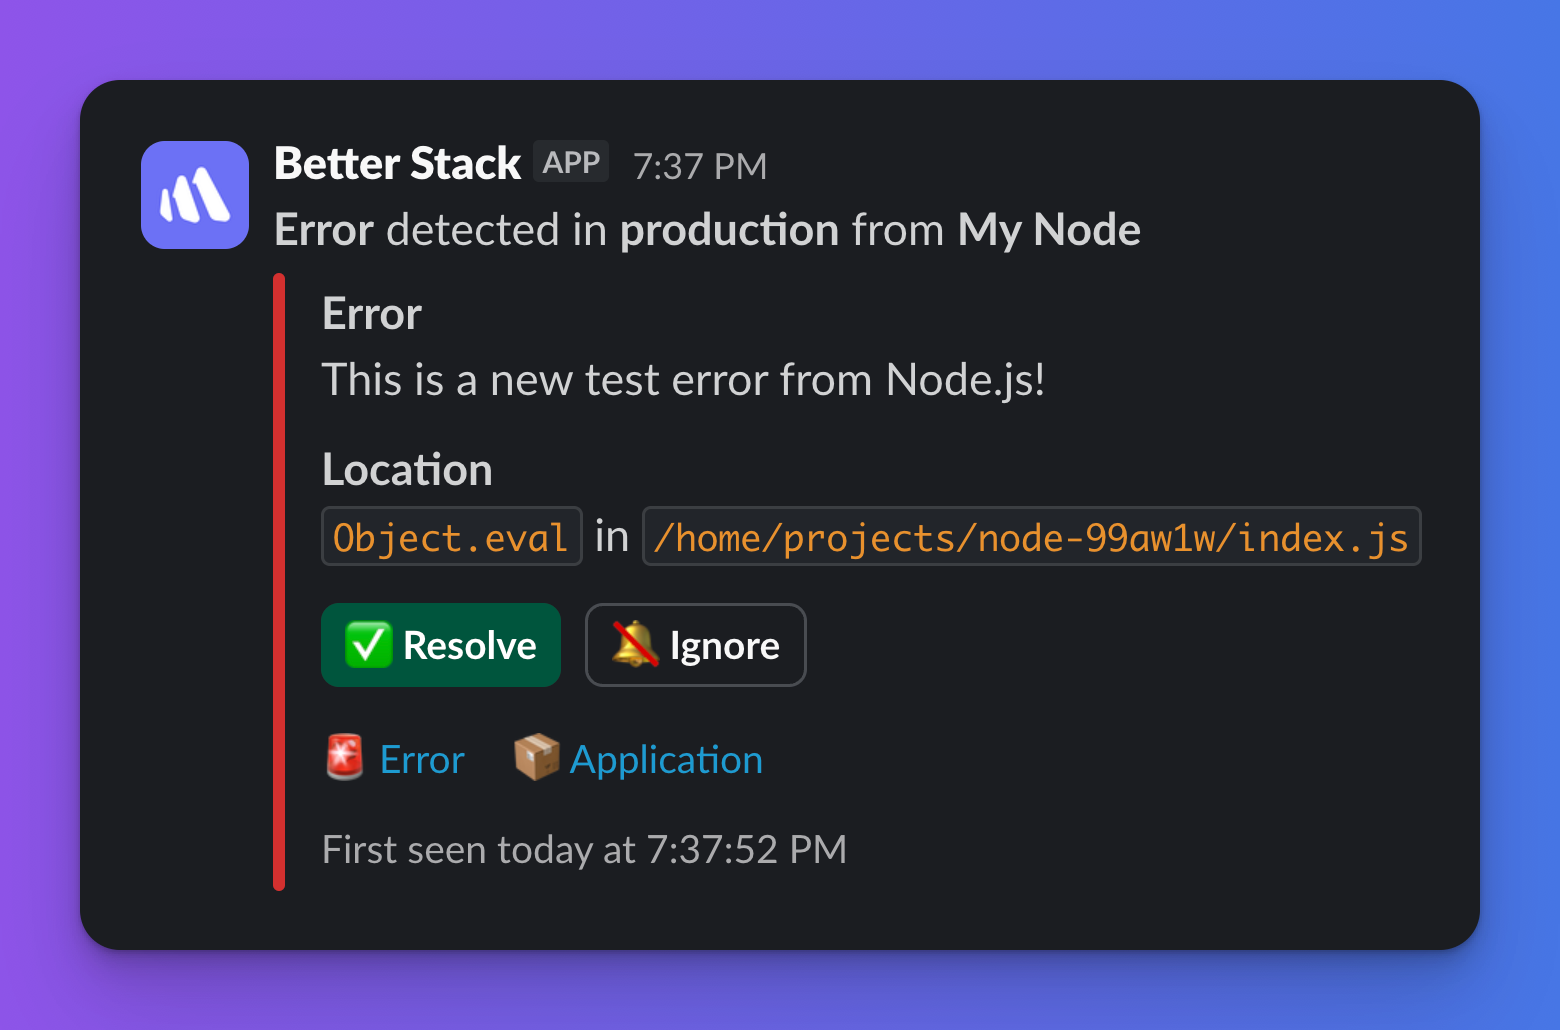
* * *
[Previous article\
\
Reporting incidents](https://betterstack.com/docs/errors/integrations/creating-incidents/)
[Next article\
\
Microsoft Teams](https://betterstack.com/docs/errors/integrations/ms-teams/)
###### On this page
* [Setting up the integration](https://betterstack.com/docs/errors/integrations/slack/#setting-up-the-integration)
* [Customizing the notifications](https://betterstack.com/docs/errors/integrations/slack/#customizing-the-notifications)
### Please accept cookies
We use cookies to authenticate users, improve the product user experience, and for [personalized ads](https://business.safety.google/privacy/)
. [Learn more.](https://betterstack.com/privacy)
Deny Accept required Accept all
---
# Microsoft Teams | Better Stack Documentation
###### Explore documentation
* [Welcome to Errors 👋](https://betterstack.com/docs/errors/start/)
1. [JavaScript tag](https://betterstack.com/docs/errors/js-tag/start/)
* [Collecting errors](https://betterstack.com/docs/errors/integrations/ms-teams/)
1. [Integrating using an AI prompt](https://betterstack.com/docs/errors/collecting-errors/ai-prompt/)
2. [Sentry SDK](https://betterstack.com/docs/errors/collecting-errors/sentry-sdk/)
* [Using the product](https://betterstack.com/docs/errors/integrations/ms-teams/)
1. [Exception grouping](https://betterstack.com/docs/errors/using-the-product/exception-grouping/)
2. [Fix with AI](https://betterstack.com/docs/errors/using-the-product/fix-with-ai/)
3. [Releases](https://betterstack.com/docs/errors/using-the-product/releases/)
4. [Uploading source maps](https://betterstack.com/docs/errors/collecting-errors/upload-source-maps/)
* [Integrations](https://betterstack.com/docs/errors/integrations/ms-teams/)
1. [Reporting incidents](https://betterstack.com/docs/errors/integrations/creating-incidents/)
2. [Slack](https://betterstack.com/docs/errors/integrations/slack/)
3. [Microsoft Teams](https://betterstack.com/docs/errors/integrations/ms-teams/)
4. [Linear](https://betterstack.com/docs/errors/integrations/linear/)
5. [Jira](https://betterstack.com/docs/errors/integrations/jira/)
6. [GitHub](https://betterstack.com/docs/errors/integrations/github/)
* [Errors API](https://betterstack.com/docs/errors/integrations/ms-teams/)
1. [Getting an API token](https://betterstack.com/docs/errors/api/getting-api-token/)
2. [Applications API](https://betterstack.com/docs/errors/api/applications/list/)
3. [Application groups API](https://betterstack.com/docs/errors/api/applications-groups/list/)
Microsoft Teams
===============
Integrate Better Stack with Microsoft Teams to **receive error notifications in Teams**.
Setting up the integration
--------------------------
1. Navigate to **Errors** -> [Integrations](https://errors.betterstack.com/team/0/integrations/)
.
2. Find the Microsoft Teams integration and click **Add**.
3. Follow the authorization steps to connect your Microsoft Teams account.
4. Configure the integration settings and click **Save changes**.

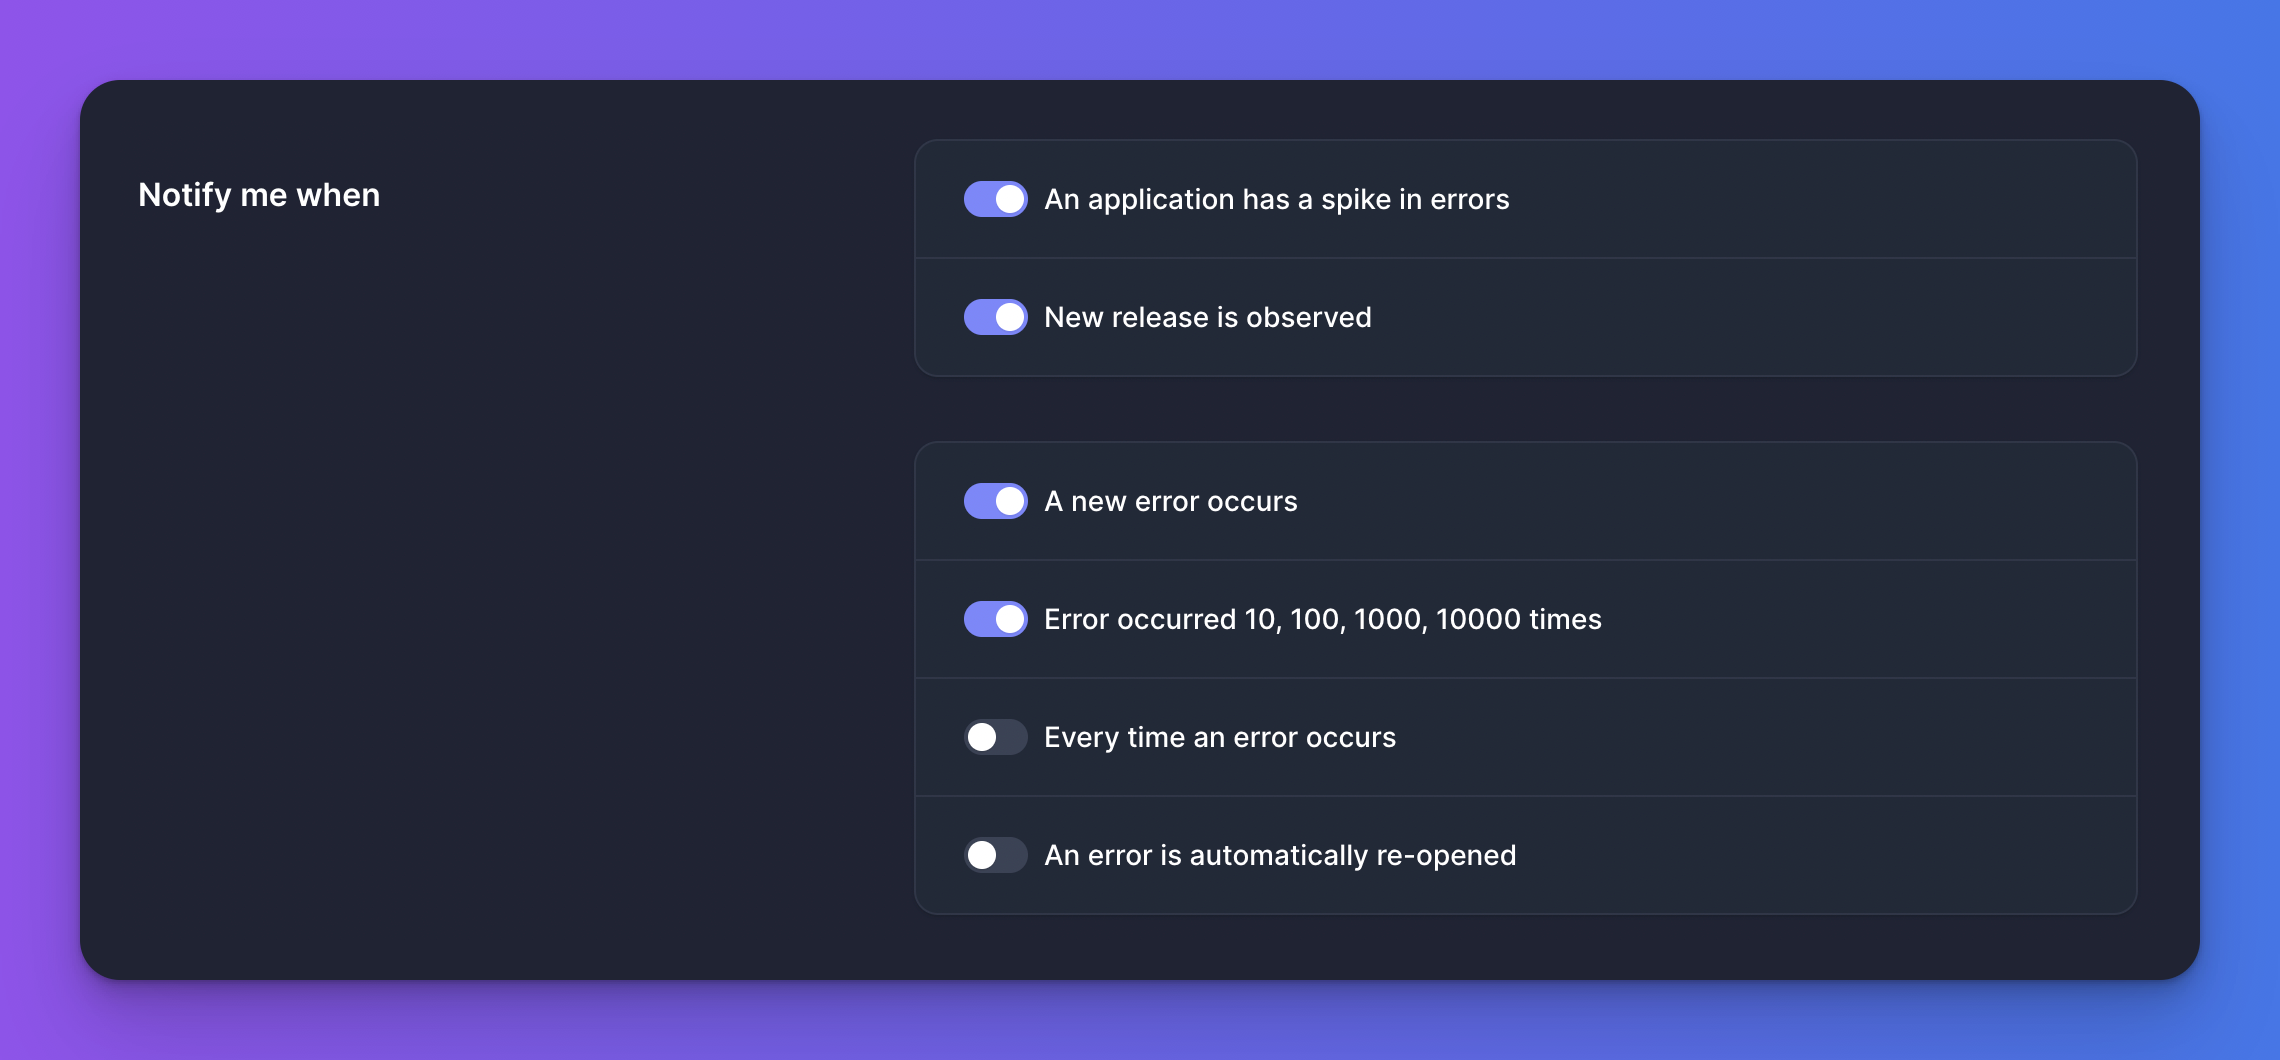
Customizing notifications
-------------------------
* Receive **automatic alerts in your designated Teams channels** with error details, stack traces, and affected users.
* Use interactive buttons in **Adaptive Cards within Teams to directly resolve or ignore** an error.
* * *
[Previous article\
\
Slack](https://betterstack.com/docs/errors/integrations/slack/)
[Next article\
\
Linear](https://betterstack.com/docs/errors/integrations/linear/)
###### On this page
* [Setting up the integration](https://betterstack.com/docs/errors/integrations/ms-teams/#setting-up-the-integration)
* [Customizing notifications](https://betterstack.com/docs/errors/integrations/ms-teams/#customizing-notifications)
### Please accept cookies
We use cookies to authenticate users, improve the product user experience, and for [personalized ads](https://business.safety.google/privacy/)
. [Learn more.](https://betterstack.com/privacy)
Deny Accept required Accept all
---
# Cache busting in monitoring | Better Stack Documentation
###### Explore documentation
* [Welcome to Uptime 👋](https://betterstack.com/docs/uptime/start/)
* [Frequently Asked Questions](https://betterstack.com/docs/uptime/frequently-asked-questions/)
* [On-call scheduling and alerting](https://betterstack.com/docs/uptime/cache-busting-in-monitoring/)
1. [Get started](https://betterstack.com/docs/uptime/getting-started-with-oncall-v2/)
2. [Slack and other integrations ↗](https://betterstack.com/docs/uptime/slack/)
3. [Connecting external calendars](https://betterstack.com/docs/uptime/connecting-external-calendars/)
4. [Advanced guide](https://betterstack.com/docs/uptime/escalation-policies/)
* [Incidents](https://betterstack.com/docs/uptime/cache-busting-in-monitoring/)
1. [Get started](https://betterstack.com/docs/uptime/working-with-incidents/)
2. [Advanced guide](https://betterstack.com/docs/uptime/post-mortems/)
3. [Reporting ↗](https://betterstack.com/docs/getting-started/team-and-account-management/reporting/)
* [Monitoring](https://betterstack.com/docs/uptime/cache-busting-in-monitoring/)
1. [Get started](https://betterstack.com/docs/uptime/monitoring-start/)
2. [Working with monitors](https://betterstack.com/docs/uptime/bulk-importing-monitors/)
3. [Customizing monitors](https://betterstack.com/docs/uptime/naming-monitors/)
1. [Naming monitors](https://betterstack.com/docs/uptime/naming-monitors/)
2. [Check frequency](https://betterstack.com/docs/uptime/check-frequency/)
3. [Request timeout](https://betterstack.com/docs/uptime/request-timeout/)
4. [Confirmation and recovery period](https://betterstack.com/docs/uptime/confirmation-and-recovery-period/)
5. [Domain expiration checks](https://betterstack.com/docs/uptime/domain-expiration-checks/)
6. [SSL certificate checks](https://betterstack.com/docs/uptime/ssl-certificate-checks/)
7. [Cache busting](https://betterstack.com/docs/uptime/cache-busting-in-monitoring/)
8. [Locations and regions](https://betterstack.com/docs/uptime/locations-and-regions/)
9. [Request parameters, headers and HTTP authentication](https://betterstack.com/docs/uptime/request-parameters-headers-and-http-authentication/)
10. [Github badge](https://betterstack.com/docs/uptime/github-badge/)
4. [Monitor types](https://betterstack.com/docs/uptime/uptime-monitor/)
* [Status pages](https://betterstack.com/docs/uptime/cache-busting-in-monitoring/)
1. [Get started](https://betterstack.com/docs/uptime/getting-started-with-status-pages/)
2. [Advanced guide](https://betterstack.com/docs/uptime/custom-subdomain/)
* [Uptime API](https://betterstack.com/docs/uptime/cache-busting-in-monitoring/)
1. [Getting an API token](https://betterstack.com/docs/uptime/api/getting-started-with-uptime-api/)
2. [Monitors](https://betterstack.com/docs/uptime/api/list-all-existing-monitors/)
3. [Heartbeats](https://betterstack.com/docs/uptime/api/list-all-existing-hearbeats/)
4. [On-call & incidents](https://betterstack.com/docs/uptime/api/on-call-calendar/)
5. [Status pages](https://betterstack.com/docs/uptime/api/list-all-existing-status-pages/)
6. [Metadata](https://betterstack.com/docs/uptime/api/metadata/)
7. [Integrations](https://betterstack.com/docs/uptime/api/list-all-new-relic-integrations/)
8. [Team members](https://betterstack.com/docs/uptime/api/team-members/list/)
Cache busting in monitoring
===========================
When setting up URL monitors, it's crucial to ensure that your monitoring service always receives the freshest content from your target endpoint, rather than a cached version. This is where **cache busting** comes into play. Cache busting techniques allow you to bypass intermediate caches and force the server to return a new response for each request.
Using a timestamp placeholder in the URL
----------------------------------------
A common and effective way to bust caches is by appending a unique, dynamic parameter to your URL. Our URL monitors support a `{timestamp}` placeholder which automatically inserts the current Unix timestamp into your request URL. This ensures that every check request is unique, prompting caches to fetch the latest content from the origin server.
### Example
Instead of monitoring `https://example.com/api/data`, you can configure your monitor's URL as: `https://example.com/api/data?v={timestamp}`
Each time the monitor runs, `{timestamp}` will be replaced with the current time, making the URL unique. E.g., `https://example.com/api/data?v=1678886400`.
Utilizing HTTP headers
----------------------
Another method involves sending specific HTTP headers with your request that instruct caching mechanisms not to return a cached response. The effectiveness of this method can vary depending on the caching provider and their configuration.
You can [configure custom HTTP headers in your monitors](https://betterstack.com/docs/uptime/request-parameters-headers-and-http-authentication/)
to achieve this. For instance, the `Cache-Control: no-cache` header explicitly tells all caching mechanisms that they must revalidate the cached response with the origin server before using it.
* * *
[Previous article\
\
SSL certificate checks](https://betterstack.com/docs/uptime/ssl-certificate-checks/)
[Next article\
\
Locations and regions](https://betterstack.com/docs/uptime/locations-and-regions/)
###### On this page
* [Using a timestamp placeholder in the URL](https://betterstack.com/docs/uptime/cache-busting-in-monitoring/#using-a-timestamp-placeholder-in-the-url)
* [Utilizing HTTP headers](https://betterstack.com/docs/uptime/cache-busting-in-monitoring/#utilizing-http-headers)
### Please accept cookies
We use cookies to authenticate users, improve the product user experience, and for [personalized ads](https://business.safety.google/privacy/)
. [Learn more.](https://betterstack.com/privacy)
Deny Accept required Accept all
---
# Shutting down Grafana | Better Stack Documentation
###### Explore documentation
* [Welcome to Telemetry 👋](https://betterstack.com/docs/logs/start/)
* [Quick start guide](https://betterstack.com/docs/logs/logging-start/)
* [Wide events vs. metrics](https://betterstack.com/docs/logs/wide-events-time-series/)
* [Ingesting data](https://betterstack.com/docs/logs/using-logtail/shutting-down-grafana/)
1. [Better Stack collector](https://betterstack.com/docs/logs/collector/)
2. [Vector](https://betterstack.com/docs/logs/vector/)
3. [OpenTelemetry](https://betterstack.com/docs/logs/open-telemetry/)
4. [Ingesting via HTTP API](https://betterstack.com/docs/logs/ingesting-data/http/logs/)
5. [Ingesting metrics](https://betterstack.com/docs/logs/ingesting-data/metrics/prometheus-scrape/)
6. [Ingesting logs](https://betterstack.com/docs/logs/ingesting-data/logs/docker-kubernetes/)
7. [Migrating to Better Stack](https://betterstack.com/docs/logs/datadog-agent/)
* [Using the product](https://betterstack.com/docs/logs/using-logtail/shutting-down-grafana/)
1. [AI SRE ↗](https://betterstack.com/demos/ai-sre/)
2. [MCP server ↗](https://betterstack.com/docs/getting-started/integrations/mcp/)
3. [Transforming ingested data](https://betterstack.com/docs/logs/using-logtail/transforming-ingested-data/logs-vrl/)
4. [Querying data](https://betterstack.com/docs/logs/using-logtail/live-tail-query-language/)
5. [Tracing](https://betterstack.com/docs/logs/tracing/)
6. [Alerts](https://betterstack.com/docs/logs/dashboards/alerts/)
* [Telemetry API](https://betterstack.com/docs/logs/using-logtail/shutting-down-grafana/)
1. [Getting an API token](https://betterstack.com/docs/logs/api/getting-started/)
2. [Sources & collectors](https://betterstack.com/docs/logs/api/list-all-existing-sources/)
3. [Dashboards](https://betterstack.com/docs/logs/api/dashboards/list/)
4. [Explorations](https://betterstack.com/docs/logs/api/explorations/list/)
5. [Alerts API](https://betterstack.com/docs/logs/api/alerts/list/)
6. [Connections API](https://betterstack.com/docs/logs/api/connections/list/)
7. [Query API ↗](https://betterstack.com/docs/logs/query-api/connect-remotely/)
* [Alternative to](https://betterstack.com/docs/logs/using-logtail/shutting-down-grafana/)
1. [Lightstep](https://betterstack.com/docs/logs/alternative-to/lightstep/)
Shutting down Grafana
=====================
After deprecating the built-in Grafana in September 2023, **we’ll be shutting it down in February 2024 in favor of the [new collaborative dashboards](https://betterstack.com/dashboards)
.**
**Your existing Grafana queries will be automatically migrated** to the new [Explore logs](https://betterstack.com/docs/logs/using-logtail/explore-logs/)
section.
We’ll also be deprecating the original Logtail alerts in favor of the more sophisticated Dashboard alerts.
Why are we doing this?
----------------------
Querying logs with Grafana allowed us to quickly prototype a ClickHouse-backed dashboarding experience in the early days of Better Stack. **As Better Stack matured, however, the Grafana interface proved extremely limiting in providing a cohesive user experience.** We wanted you to be able to easily switch between filtering logs and analyzing metrics and the only way to make it happen was to design a custom charting from the ground up: the new collaborative dashboards.
Moreover, creating dashboards directly on top of structured logs required us to parse structured JSON during query time. While flexible, this approach is extremely CPU-intensive and doesn’t scale to large datasets fast enough.
**Hence, we introduced [Logs-to-metrics](https://betterstack.com/docs/logs/dashboards/logs-to-metrics/)
a few months back**, a new, convenient way of automatically generating metrics out of your logs. Built on a brand new infrastructure, leveraging the ClickHouse -State & -Merge combinators, and backed by fast NVMe drives, **the new metrics infrastructure provides virtually limitless scaling and impressively fast querying speed while maintaining flexibility**.
Moving forward
--------------
Deprecating Grafana will allow us to further focus on building unbeatable dashboards for software engineers.
**The new dashboards already provide a superior experience to Grafana.** As an example, please give the built-in [anomaly detection](https://betterstack.com/docs/logs/dashboards/alerts/)
a shot if you haven’t tried it yet: we’re confident you’re going to love it.
Get to know the new dashboards
------------------------------
Please read our guide on [querying metrics](https://betterstack.com/docs/logs/dashboards/sql-queries/)
and [defining custom logs-to-metrics](https://betterstack.com/docs/logs/dashboards/logs-to-metrics/)
.
Need help?
-----------
Please let us know your thoughts at [hello@betterstack.com](mailto:hello@betterstack.com)
. We’re here to help!
Thank you for being our long-time customer. Your product feedback is invaluable, and it shapes Better Stack in moving forward.
* * *
###### On this page
* [Why are we doing this?](https://betterstack.com/docs/logs/using-logtail/shutting-down-grafana/#why-are-we-doing-this)
* [Moving forward](https://betterstack.com/docs/logs/using-logtail/shutting-down-grafana/#moving-forward)
* [Get to know the new dashboards](https://betterstack.com/docs/logs/using-logtail/shutting-down-grafana/#get-to-know-the-new-dashboards)
* [Need help?](https://betterstack.com/docs/logs/using-logtail/shutting-down-grafana/#need-help)
### Please accept cookies
We use cookies to authenticate users, improve the product user experience, and for [personalized ads](https://business.safety.google/privacy/)
. [Learn more.](https://betterstack.com/privacy)
Deny Accept required Accept all
---
# Linear | Better Stack Documentation
###### Explore documentation
* [Welcome to Errors 👋](https://betterstack.com/docs/errors/start/)
1. [JavaScript tag](https://betterstack.com/docs/errors/js-tag/start/)
* [Collecting errors](https://betterstack.com/docs/errors/integrations/linear/)
1. [Integrating using an AI prompt](https://betterstack.com/docs/errors/collecting-errors/ai-prompt/)
2. [Sentry SDK](https://betterstack.com/docs/errors/collecting-errors/sentry-sdk/)
* [Using the product](https://betterstack.com/docs/errors/integrations/linear/)
1. [Exception grouping](https://betterstack.com/docs/errors/using-the-product/exception-grouping/)
2. [Fix with AI](https://betterstack.com/docs/errors/using-the-product/fix-with-ai/)
3. [Releases](https://betterstack.com/docs/errors/using-the-product/releases/)
4. [Uploading source maps](https://betterstack.com/docs/errors/collecting-errors/upload-source-maps/)
* [Integrations](https://betterstack.com/docs/errors/integrations/linear/)
1. [Reporting incidents](https://betterstack.com/docs/errors/integrations/creating-incidents/)
2. [Slack](https://betterstack.com/docs/errors/integrations/slack/)
3. [Microsoft Teams](https://betterstack.com/docs/errors/integrations/ms-teams/)
4. [Linear](https://betterstack.com/docs/errors/integrations/linear/)
5. [Jira](https://betterstack.com/docs/errors/integrations/jira/)
6. [GitHub](https://betterstack.com/docs/errors/integrations/github/)
* [Errors API](https://betterstack.com/docs/errors/integrations/linear/)
1. [Getting an API token](https://betterstack.com/docs/errors/api/getting-api-token/)
2. [Applications API](https://betterstack.com/docs/errors/api/applications/list/)
3. [Application groups API](https://betterstack.com/docs/errors/api/applications-groups/list/)
Linear
======
Integrate Better Stack with Linear to **create and link issues directly from the error dashboard**.
Setting up the integration
--------------------------
1. Navigate to **Errors** -> [Integrations](https://errors.betterstack.com/team/0/integrations/)
.
2. Find the **Linear** integration and click **Add**.
3. Follow the authorization steps to connect your Linear account.
4. Customize the integration settings to your liking and click **Save changes**.

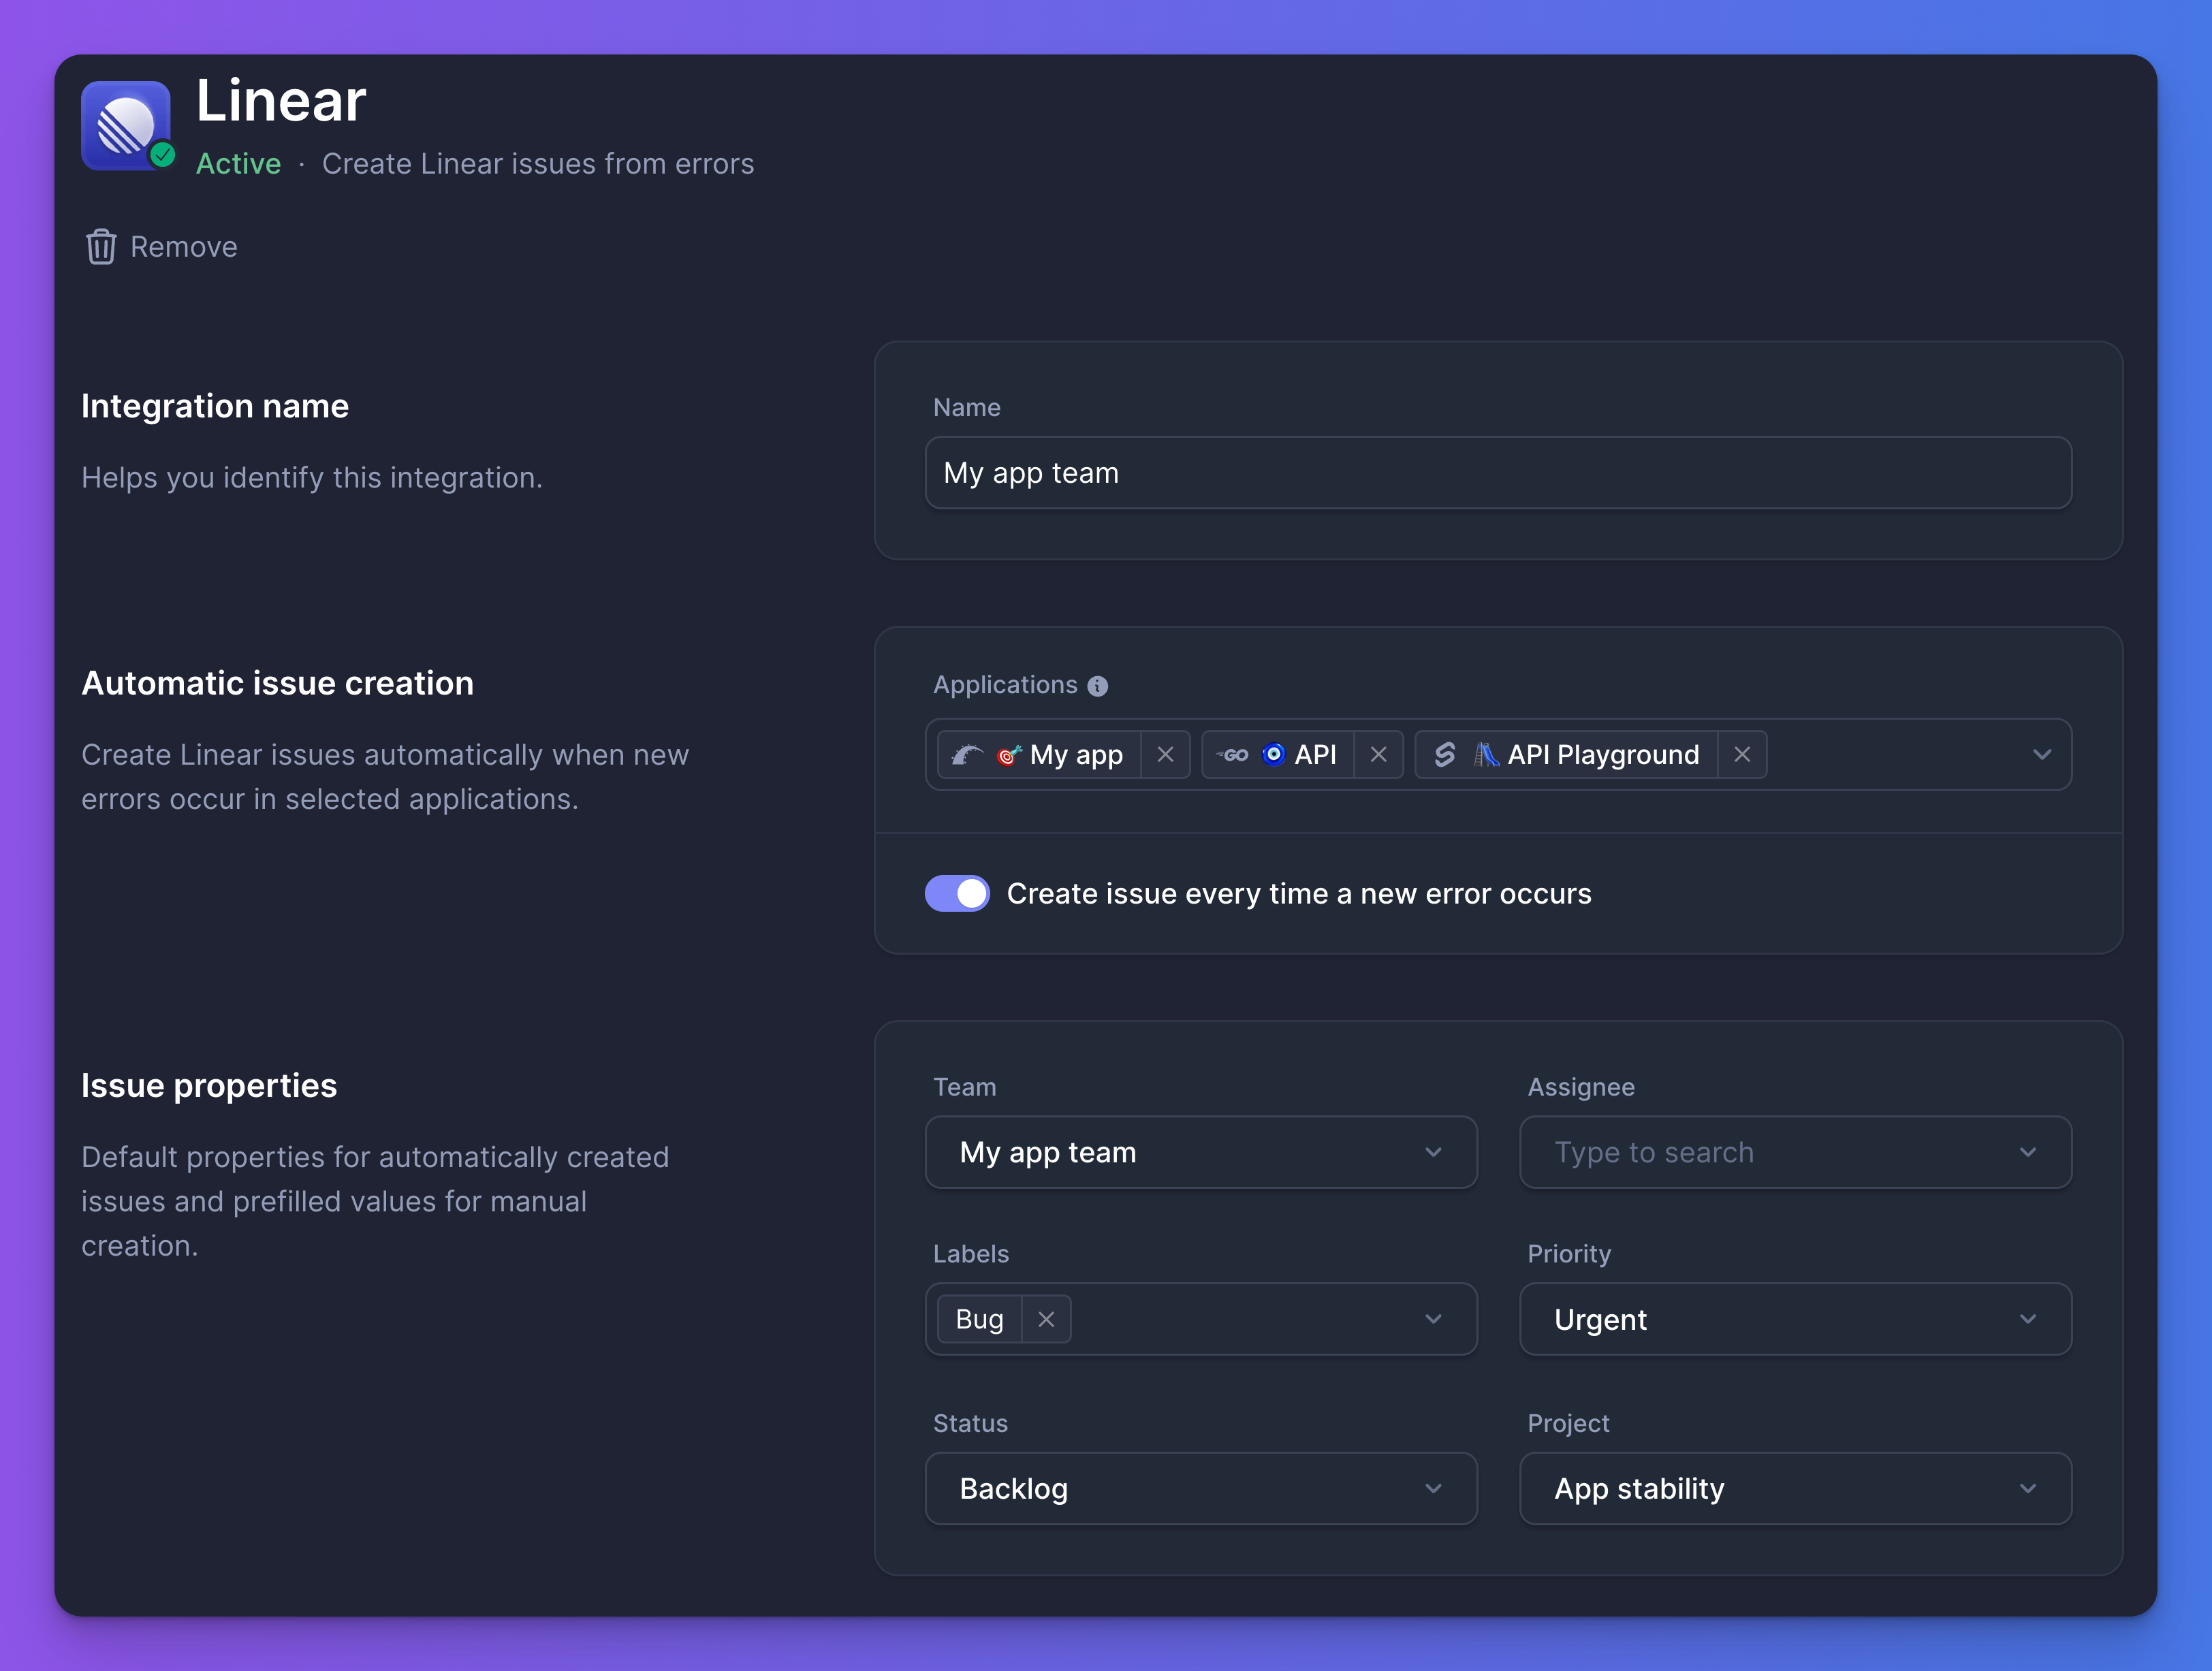
Simplify your workflow
----------------------
* Manually **create Linear issues from any error** with pre-filled details.
* **Automatically create Linear issues for all error groups** from selected applications.
* Link existing Linear issues to errors.
* View linked Linear issues directly within the error detail page.

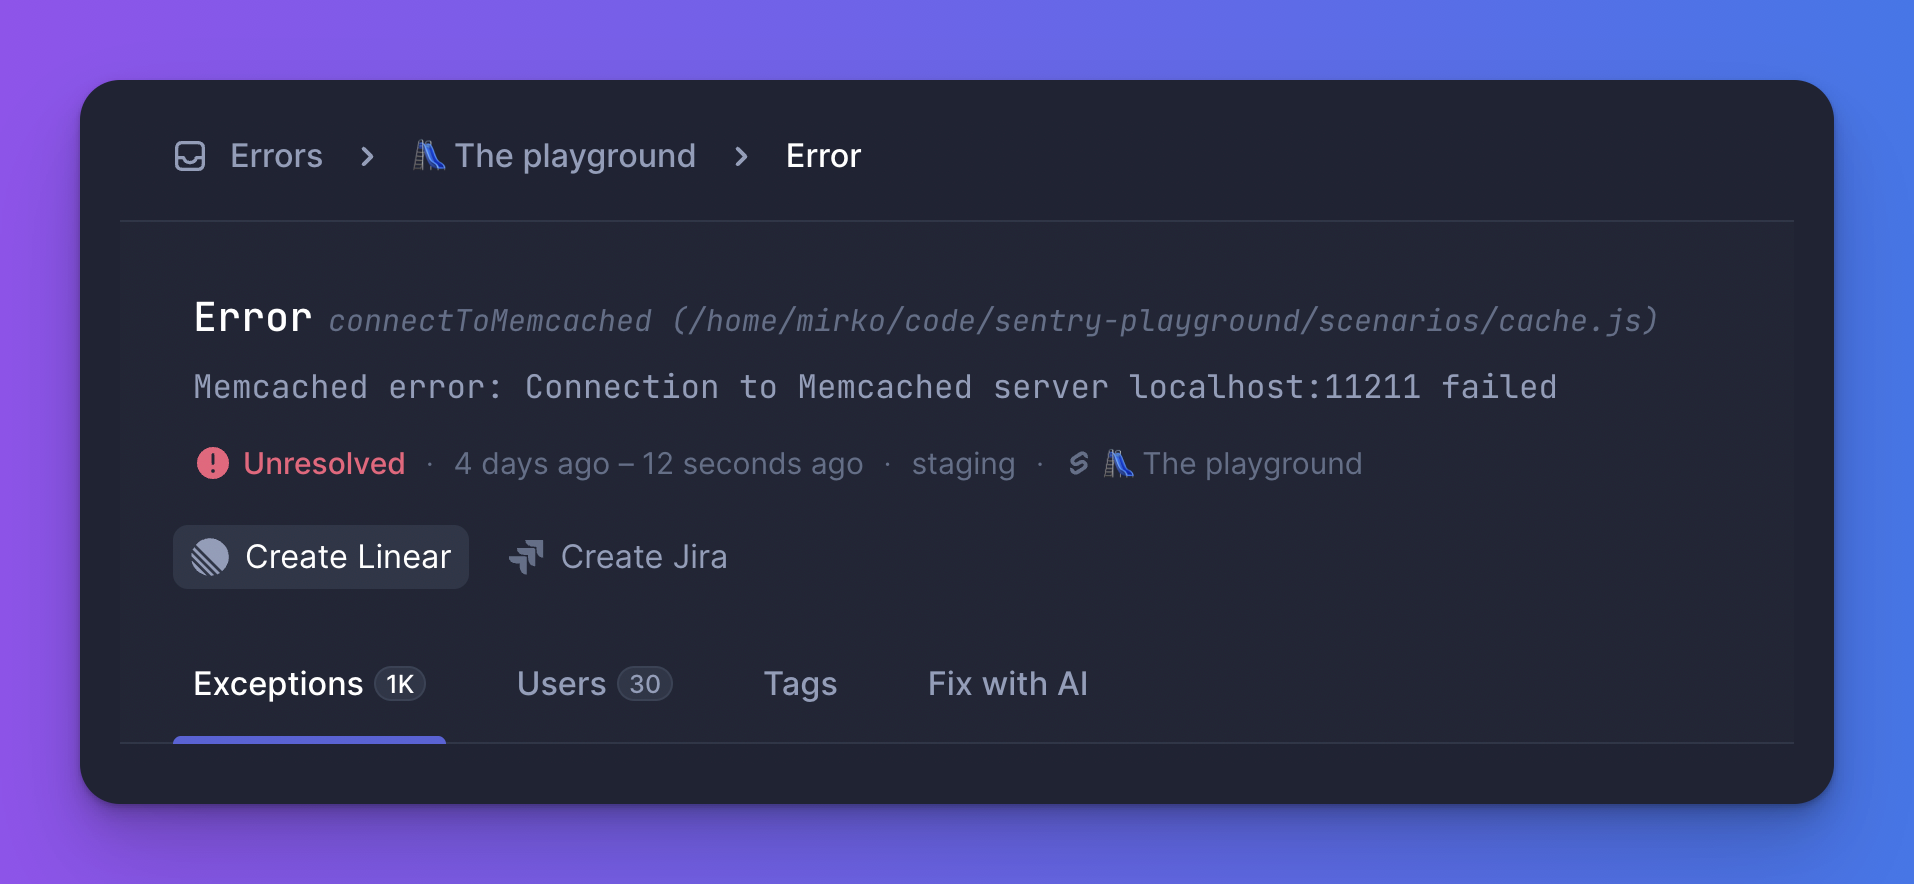
* * *
[Previous article\
\
Microsoft Teams](https://betterstack.com/docs/errors/integrations/ms-teams/)
[Next article\
\
Jira](https://betterstack.com/docs/errors/integrations/jira/)
###### On this page
* [Setting up the integration](https://betterstack.com/docs/errors/integrations/linear/#setting-up-the-integration)
* [Simplify your workflow](https://betterstack.com/docs/errors/integrations/linear/#simplify-your-workflow)
### Please accept cookies
We use cookies to authenticate users, improve the product user experience, and for [personalized ads](https://business.safety.google/privacy/)
. [Learn more.](https://betterstack.com/privacy)
Deny Accept required Accept all
---
# Uploading source maps | Better Stack Documentation
###### Explore documentation
* [Welcome to Errors 👋](https://betterstack.com/docs/errors/start/)
1. [JavaScript tag](https://betterstack.com/docs/errors/js-tag/start/)
* [Collecting errors](https://betterstack.com/docs/errors/collecting-errors/upload-source-maps/)
1. [Integrating using an AI prompt](https://betterstack.com/docs/errors/collecting-errors/ai-prompt/)
2. [Sentry SDK](https://betterstack.com/docs/errors/collecting-errors/sentry-sdk/)
* [Using the product](https://betterstack.com/docs/errors/collecting-errors/upload-source-maps/)
1. [Exception grouping](https://betterstack.com/docs/errors/using-the-product/exception-grouping/)
2. [Fix with AI](https://betterstack.com/docs/errors/using-the-product/fix-with-ai/)
3. [Releases](https://betterstack.com/docs/errors/using-the-product/releases/)
4. [Uploading source maps](https://betterstack.com/docs/errors/collecting-errors/upload-source-maps/)
* [Integrations](https://betterstack.com/docs/errors/collecting-errors/upload-source-maps/)
1. [Reporting incidents](https://betterstack.com/docs/errors/integrations/creating-incidents/)
2. [Slack](https://betterstack.com/docs/errors/integrations/slack/)
3. [Microsoft Teams](https://betterstack.com/docs/errors/integrations/ms-teams/)
4. [Linear](https://betterstack.com/docs/errors/integrations/linear/)
5. [Jira](https://betterstack.com/docs/errors/integrations/jira/)
6. [GitHub](https://betterstack.com/docs/errors/integrations/github/)
* [Errors API](https://betterstack.com/docs/errors/collecting-errors/upload-source-maps/)
1. [Getting an API token](https://betterstack.com/docs/errors/api/getting-api-token/)
2. [Applications API](https://betterstack.com/docs/errors/api/applications/list/)
3. [Application groups API](https://betterstack.com/docs/errors/api/applications-groups/list/)
Uploading source maps
=====================
Upload JavaScript or TypeScript source maps by integrating your existing [Sentry Source Map Upload](https://docs.sentry.io/platforms/javascript/sourcemaps/uploading/)
with Better Stack. All of the **Sentry-supported JavaScript build-system integrations and manual uploads should work as-is**.
### Browser JavaScript / TypeScript
* [Webpack](https://docs.sentry.io/platforms/javascript/sourcemaps/uploading/webpack/)
* [Ionic](https://docs.sentry.io/platforms/javascript/sourcemaps/uploading/ionic/)
* [Ionic Capacitor Build](https://docs.sentry.io/platforms/javascript/sourcemaps/uploading/ionic-capacitor/)
* [TypeScript (tsc)](https://docs.sentry.io/platforms/javascript/sourcemaps/uploading/typescript/)
* [Vite](https://docs.sentry.io/platforms/javascript/sourcemaps/uploading/vite/)
* [esbuild](https://docs.sentry.io/platforms/javascript/sourcemaps/uploading/esbuild/)
* [Rollup](https://docs.sentry.io/platforms/javascript/sourcemaps/uploading/rollup/)
* [Sentry CLI](https://docs.sentry.io/platforms/javascript/sourcemaps/uploading/cli/)
* [UglifyJS](https://docs.sentry.io/platforms/javascript/sourcemaps/uploading/uglifyjs/)
* [SystemJS](https://docs.sentry.io/platforms/javascript/sourcemaps/uploading/systemjs/)
### React Native
* [Expo](https://docs.sentry.io/platforms/react-native/sourcemaps/uploading/expo/)
* [Hermes](https://docs.sentry.io/platforms/react-native/sourcemaps/uploading/hermes/)
We do not currently support publicly-hosted source maps, and require you to upload them.
If you need public source maps, or have any issues uploading source maps for one of the above types, please get in touch at [hello@betterstack.com](mailto:hello@betterstack.com)
.
To configure your build process to upload source maps to Better Stack, follow the "Manual Setup" steps for any of the linked build processes above, and update the required configuration values or environment variables from the values in **Errors** -> [Applications](https://errors.betterstack.com/team/t0/applications/)
-> **Your Application** -> **Data ingestion**.
* `org` or `SENTRY_ORG` - A Better Stack ID representing your team.
* `project` or `SENTRY_PROJECT` - The Better Stack ID for your [application](https://errors.betterstack.com/team/t0/applications/)
.
* `url` or `SENTRY_URL` - The Better Stack endpoint source maps are uploaded to, for example `https://us-east-9-sourcemaps.betterstackdata.com`.
* `authToken` or `SENTRY_AUTH_TOKEN` - This is a [Telemetry API token](https://betterstack.com/settings/api-tokens/0)
.
Ensure you don't commit your BETTER\_STACK\_API\_TOKEN to source control, as it also gives access to your Telemetry account. Use an uncommited env file or CI secrets management instead.
Here are a few examples:
Webpack Vite .env file
Copied!
sentryWebpackPlugin({
org: $SENTRY_ORG,
project: $SENTRY_PROJECT,
url: $SENTRY_URL,
authToken: process.env.BETTER_STACK_API_TOKEN
})
sentryVitePlugin({
org: $SENTRY_ORG,
project: $SENTRY_PROJECT,
url: $SENTRY_URL,
authToken: process.env.BETTER_STACK_API_TOKEN
})
SENTRY_ORG=$SENTRY_ORG
SENTRY_PROJECT=$SENTRY_PROJECT
SENTRY_AUTH_TOKEN=$BETTER_STACK_API_TOKEN
SENTRY_URL=$SENTRY_URL
### See the expanded source maps in Better Stack
After uploading your source maps, any subsequent errors will have detailed stack frames in Better Stack Errors! 🚀
* * *
[Previous article\
\
Releases](https://betterstack.com/docs/errors/using-the-product/releases/)
[Next article\
\
Reporting incidents](https://betterstack.com/docs/errors/integrations/creating-incidents/)
### Please accept cookies
We use cookies to authenticate users, improve the product user experience, and for [personalized ads](https://business.safety.google/privacy/)
. [Learn more.](https://betterstack.com/privacy)
Deny Accept required Accept all
---
# Grouping and ordering monitors | Better Stack Documentation
###### Explore documentation
* [Welcome to Uptime 👋](https://betterstack.com/docs/uptime/start/)
* [Frequently Asked Questions](https://betterstack.com/docs/uptime/frequently-asked-questions/)
* [On-call scheduling and alerting](https://betterstack.com/docs/uptime/grouping-and-ordering-monitors/)
1. [Get started](https://betterstack.com/docs/uptime/getting-started-with-oncall-v2/)
2. [Slack and other integrations ↗](https://betterstack.com/docs/uptime/slack/)
3. [Connecting external calendars](https://betterstack.com/docs/uptime/connecting-external-calendars/)
4. [Advanced guide](https://betterstack.com/docs/uptime/escalation-policies/)
* [Incidents](https://betterstack.com/docs/uptime/grouping-and-ordering-monitors/)
1. [Get started](https://betterstack.com/docs/uptime/working-with-incidents/)
2. [Advanced guide](https://betterstack.com/docs/uptime/post-mortems/)
3. [Reporting ↗](https://betterstack.com/docs/getting-started/team-and-account-management/reporting/)
* [Monitoring](https://betterstack.com/docs/uptime/grouping-and-ordering-monitors/)
1. [Get started](https://betterstack.com/docs/uptime/monitoring-start/)
2. [Working with monitors](https://betterstack.com/docs/uptime/bulk-importing-monitors/)
1. [Bulk importing monitors](https://betterstack.com/docs/uptime/bulk-importing-monitors/)
2. [Grouping and ordering monitors](https://betterstack.com/docs/uptime/grouping-and-ordering-monitors/)
3. [Pausing monitors and maintenances](https://betterstack.com/docs/uptime/pausing-monitors-and-maintenances/)
4. [Removing monitors](https://betterstack.com/docs/uptime/removing-monitors/)
3. [Customizing monitors](https://betterstack.com/docs/uptime/naming-monitors/)
4. [Monitor types](https://betterstack.com/docs/uptime/uptime-monitor/)
* [Status pages](https://betterstack.com/docs/uptime/grouping-and-ordering-monitors/)
1. [Get started](https://betterstack.com/docs/uptime/getting-started-with-status-pages/)
2. [Advanced guide](https://betterstack.com/docs/uptime/custom-subdomain/)
* [Uptime API](https://betterstack.com/docs/uptime/grouping-and-ordering-monitors/)
1. [Getting an API token](https://betterstack.com/docs/uptime/api/getting-started-with-uptime-api/)
2. [Monitors](https://betterstack.com/docs/uptime/api/list-all-existing-monitors/)
3. [Heartbeats](https://betterstack.com/docs/uptime/api/list-all-existing-hearbeats/)
4. [On-call & incidents](https://betterstack.com/docs/uptime/api/on-call-calendar/)
5. [Status pages](https://betterstack.com/docs/uptime/api/list-all-existing-status-pages/)
6. [Metadata](https://betterstack.com/docs/uptime/api/metadata/)
7. [Integrations](https://betterstack.com/docs/uptime/api/list-all-new-relic-integrations/)
8. [Team members](https://betterstack.com/docs/uptime/api/team-members/list/)
Grouping and ordering monitors
==============================
Ordering monitors
-----------------
By default, the most recently created monitors are shown first.
To change the order:
* Go to [Monitors](https://uptime.betterstack.com/team/0/monitors)
.
* Hover over the monitor group and click the **Sort** button in the upper right corner.
* Choose how you want to sort your monitors.

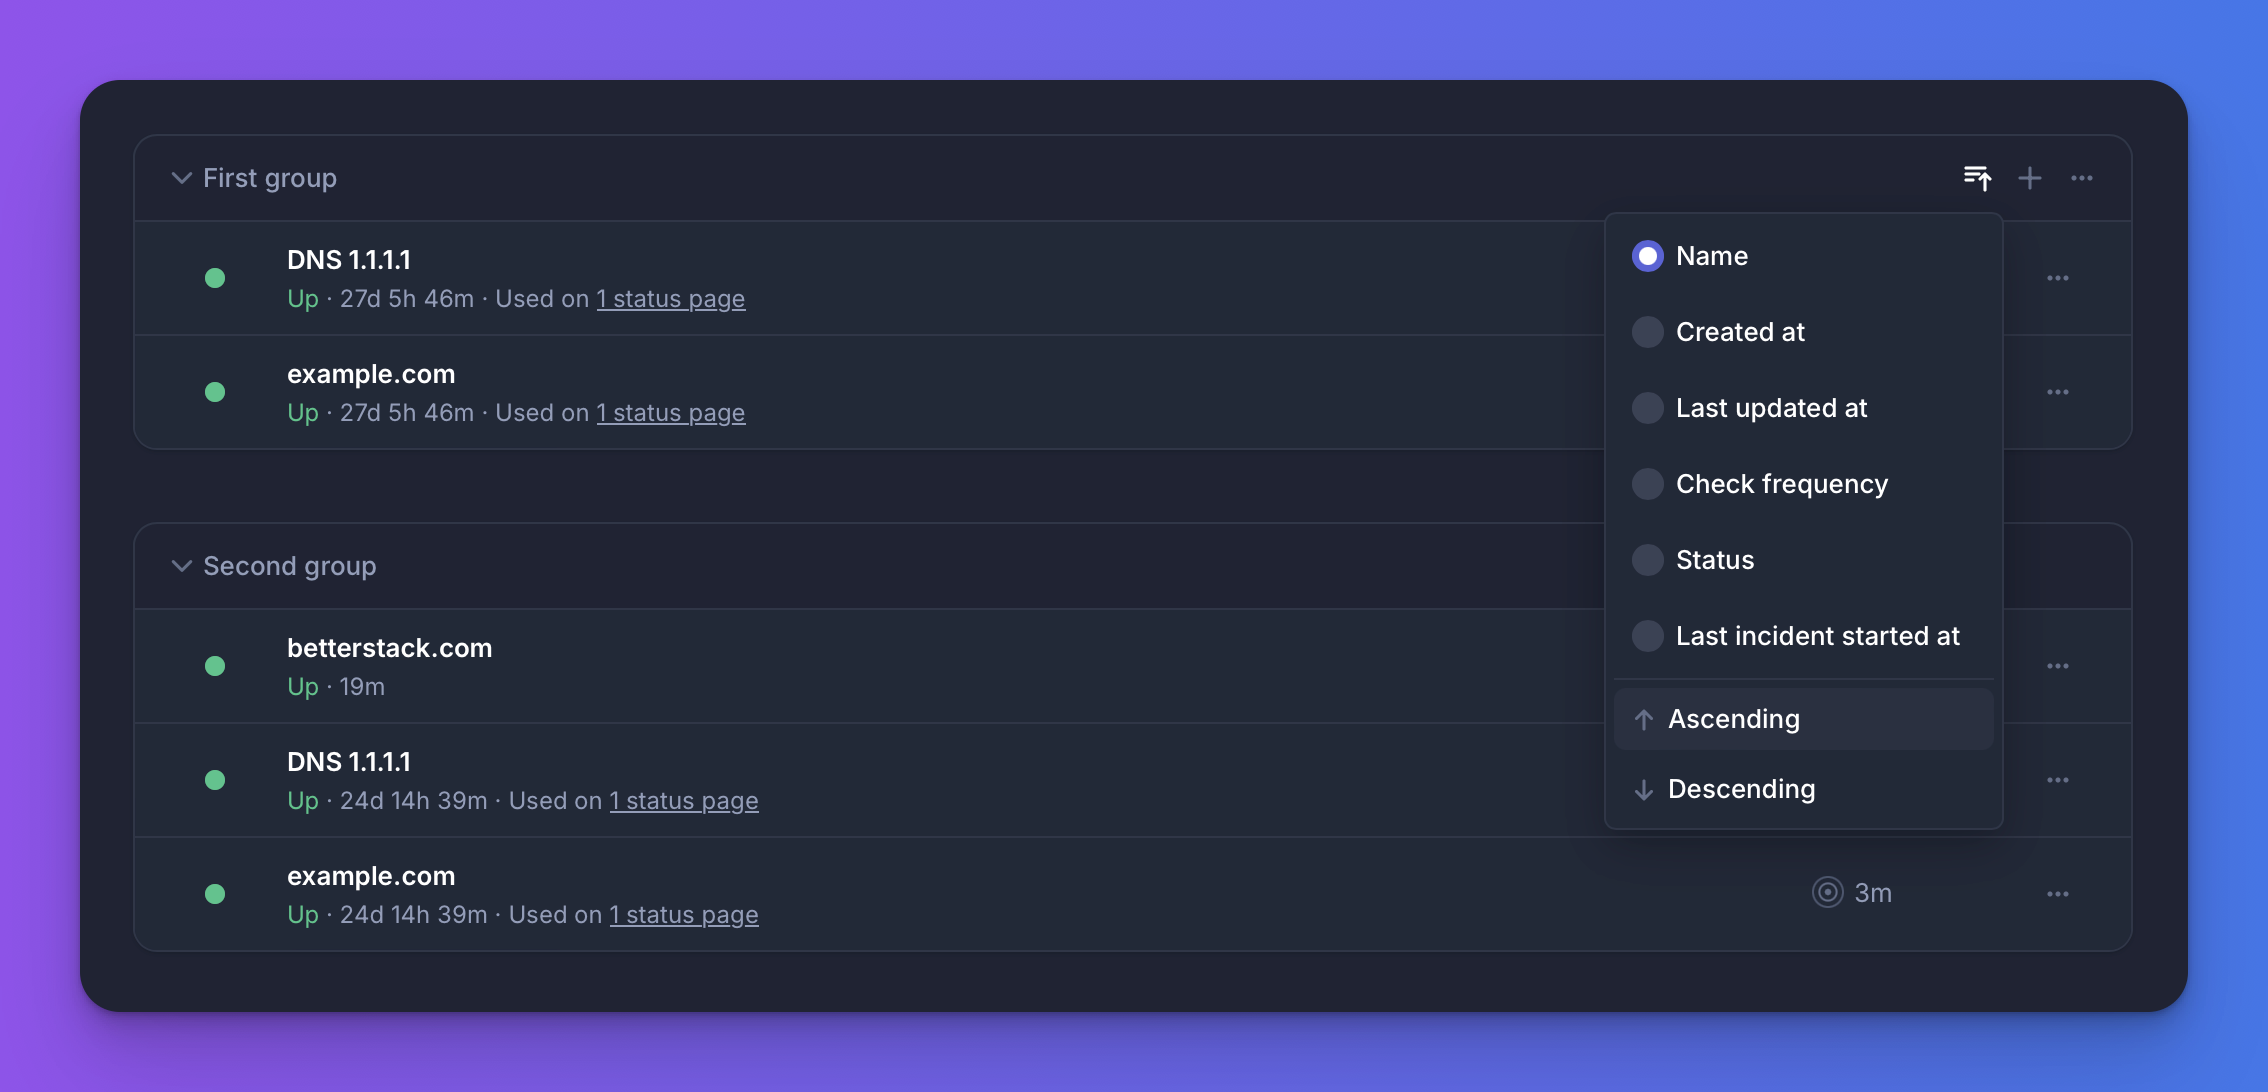
Grouping monitors
-----------------
To create a new group:
* Go to [Monitors](https://uptime.betterstack.com/team/0/monitors)
.
* On a monitor, click the `⋯` button on the right side.
* In the context menu, select **Create group** and name your new group.
* You can move more monitors in by using **Move to**, or create a monitor in the group directly by clicking the `+` in the group header menu.

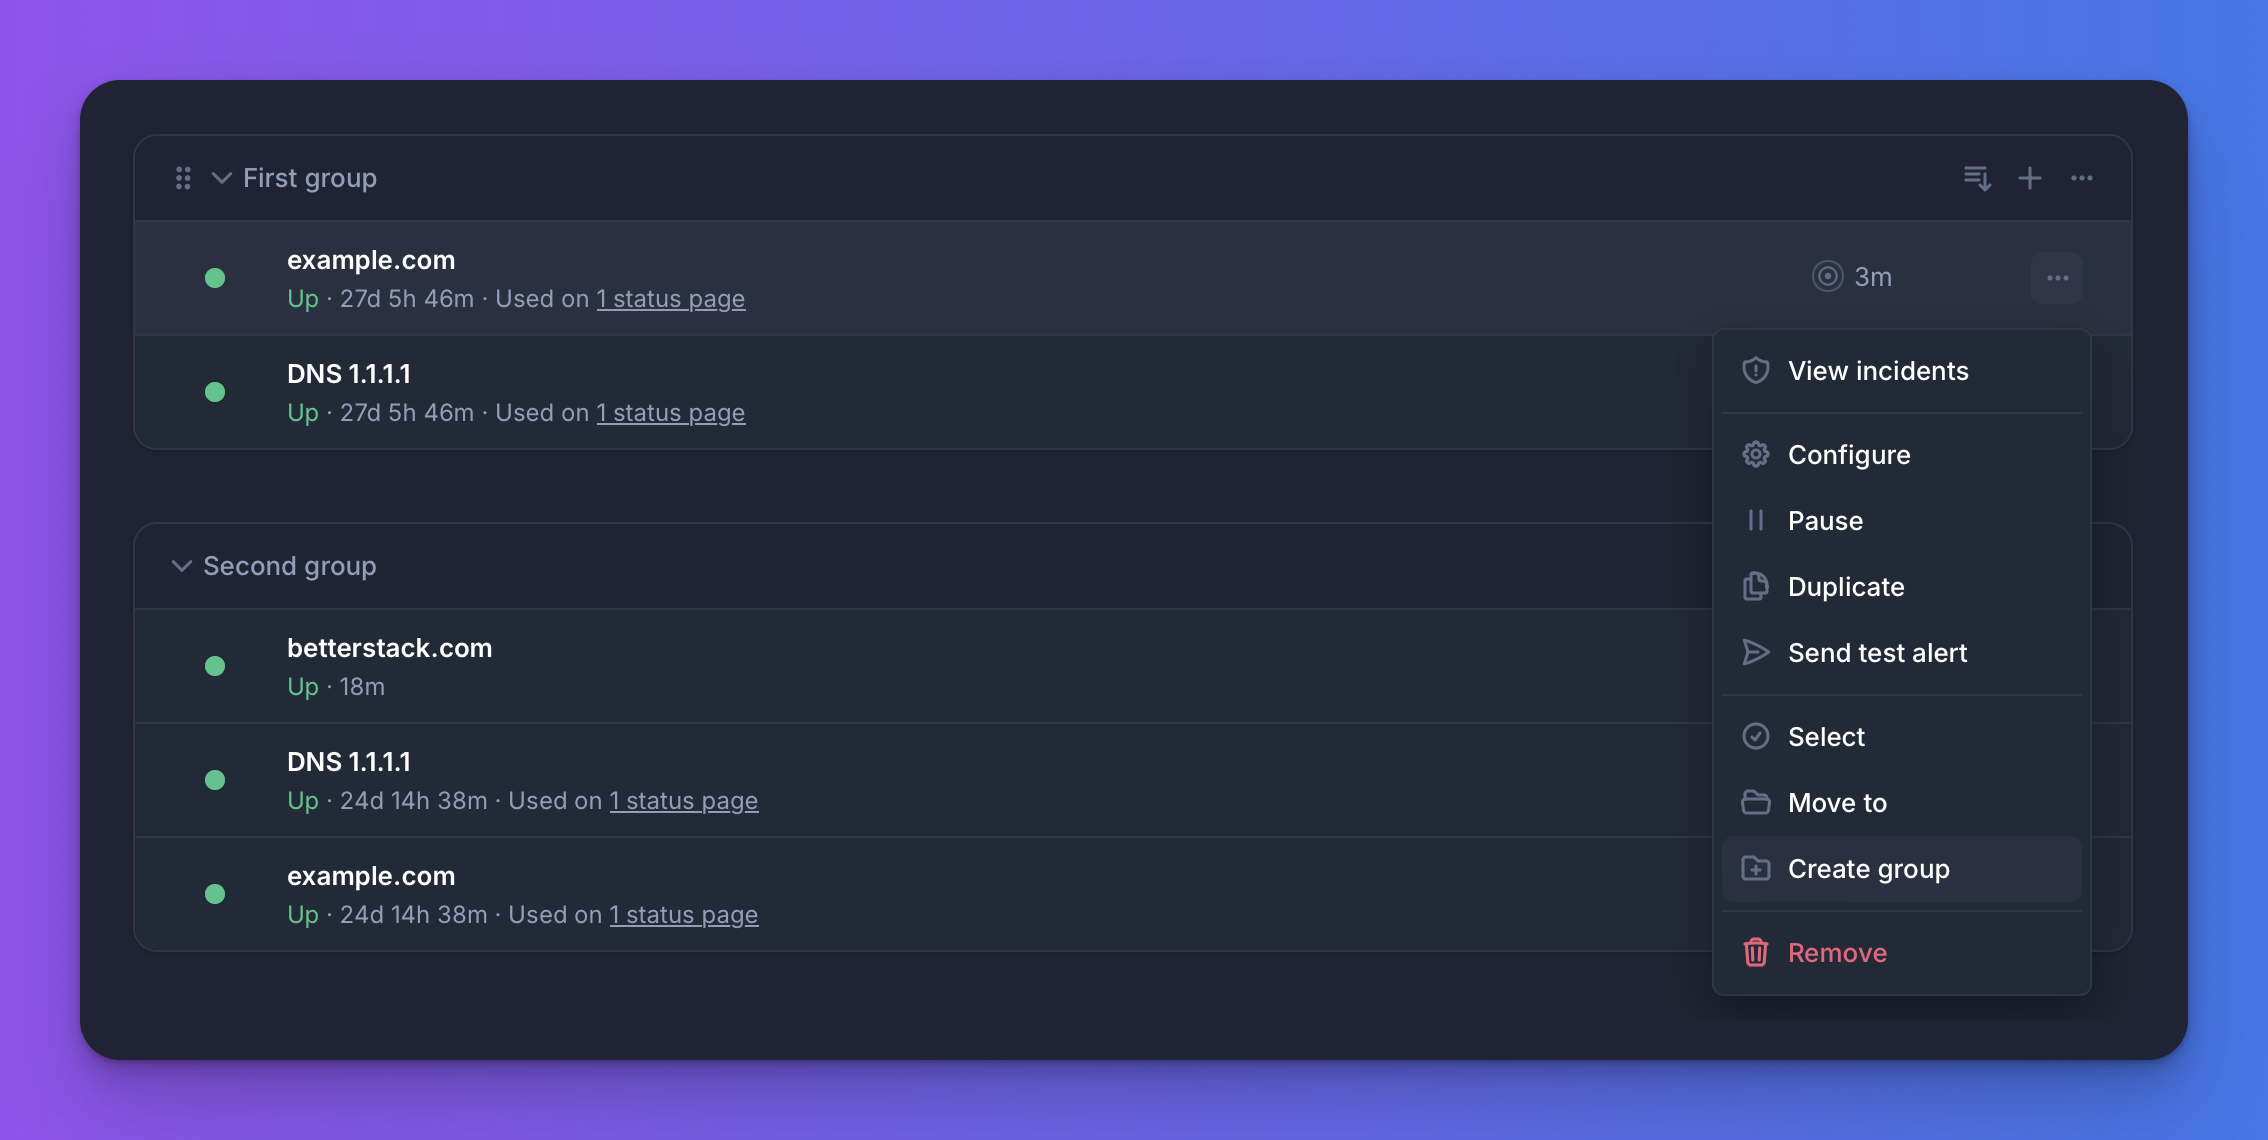
To bulk-edit large amounts of monitors, we'd recommend selecting multiple monitors at once and using bulk actions or giving [our Uptime API](https://betterstack.com/docs/uptime/api/getting-started-with-uptime-api/?utm_content=callout&utm_medium=docs-uptime&utm_source=community&utm_term=docs-grouping-and-ordering-monitors)
a try.
* * *
[Previous article\
\
Bulk importing monitors](https://betterstack.com/docs/uptime/bulk-importing-monitors/)
[Next article\
\
Pausing monitors and maintenances](https://betterstack.com/docs/uptime/pausing-monitors-and-maintenances/)
###### On this page
* [Ordering monitors](https://betterstack.com/docs/uptime/grouping-and-ordering-monitors/#ordering-monitors)
* [Grouping monitors](https://betterstack.com/docs/uptime/grouping-and-ordering-monitors/#grouping-monitors)
### Please accept cookies
We use cookies to authenticate users, improve the product user experience, and for [personalized ads](https://business.safety.google/privacy/)
. [Learn more.](https://betterstack.com/privacy)
Deny Accept required Accept all
---
# iOS & Android mobile apps | Better Stack Documentation
###### Explore documentation
* [Welcome 👋](https://betterstack.com/docs/getting-started/welcome/)
* [Product](https://betterstack.com/docs/uptime/ios-and-android-mobile-apps/)
1. [Tracing ↗](https://betterstack.com/docs/logs/tracing/)
2. [Incident management ↗](https://betterstack.com/docs/uptime/working-with-incidents/)
3. [Uptime monitoring ↗](https://betterstack.com/docs/uptime/monitoring-start/)
4. [Log management ↗](https://betterstack.com/docs/logs/logging-start/)
5. [Infrastructure monitoring ↗](https://betterstack.com/docs/logs/dashboards/getting-started/)
6. [Status page ↗](https://betterstack.com/docs/uptime/getting-started-with-status-pages/)
7. [Error tracking ↗](https://betterstack.com/docs/errors/start/)
8. [Warehouse ↗](https://betterstack.com/docs/warehouse/start/)
* [Integrations](https://betterstack.com/docs/uptime/ios-and-android-mobile-apps/)
1. [Integrating with Better Stack](https://betterstack.com/docs/uptime/slack/)
2. [iOS & Android](https://betterstack.com/docs/uptime/ios-and-android-mobile-apps/)
1. [Mobile apps](https://betterstack.com/docs/uptime/ios-and-android-mobile-apps/)
2. [Phone call alerts](https://betterstack.com/docs/uptime/ios-and-android-phone-call-alerts/)
3. [SSO providers](https://betterstack.com/docs/uptime/integrating-with-better-uptime/aws-sso/)
4. [Terraform](https://betterstack.com/docs/getting-started/integrations/terraform/)
5. [MCP server](https://betterstack.com/docs/getting-started/integrations/mcp/)
* [Team and account management](https://betterstack.com/docs/uptime/ios-and-android-mobile-apps/)
1. [Team management](https://betterstack.com/docs/uptime/creating-a-new-team/)
2. [Account settings](https://betterstack.com/docs/uptime/phone-number/)
3. [Reporting](https://betterstack.com/docs/getting-started/team-and-account-management/reporting/)
4. [Audit logs](https://betterstack.com/docs/uptime/audit-logs/)
* [Design](https://betterstack.com/docs/uptime/ios-and-android-mobile-apps/)
1. [Brand guidelines](https://betterstack.com/docs/brand/)
iOS & Android mobile apps
=========================


Using the app with Uptime
-------------------------
Get instant incident notifications on your mobile device with our iOS and Android apps.
Connecting the mobile apps
--------------------------
1. Go to **Better Stack** -> Settings → [Alerts](https://betterstack.com/settings/push-notifications)
and install the mobile app. Alternatively, download the apps directly from the [App Store](https://apps.apple.com/us/app/better-stack-on-call/id6739978181)
or [Google Play](https://play.google.com/store/apps/details?id=com.betteruptime.BetterStack)
.
2. Once downloaded, open the app and sign in with your work email or Single Sign-On.
Configuring push notifications
------------------------------
Get notified using push notifications and critical alerts for any of your monitors, heartbeats, or integrations.
1. Go to **Uptime** -> [Monitors](https://uptime.betterstack.com/team/0/monitors)
.
2. Click any monitor and select **Configure**.
3. Under **On-call escalation**, enable **Push notification** and **Critical alert**.
#### Using advanced escalation policies?
Customize how you get notified using [Severities](https://betterstack.com/docs/uptime/urgencies/?utm_content=callout&utm_medium=docs-getting-started&utm_source=community&utm_term=docs-ios-and-android-mobile-apps)
.
Configuring notifications in the app
------------------------------------
Open the app and tap **Settings** in the bottom menu. You can configure two main notification types:
* **Push notifications**: Receive regular alerts.
* **Critical alerts**: Receive high-priority alerts that can bypass silent mode and Do Not Disturb.
You can also customize:
* **Notification sound** and **Critical alert sound**: Choose from a library of alert sounds.
* **Bypass silent mode**: Allow critical alerts to play sound even when your phone is on silent or Do Not Disturb.
* **Override system volume**: Ensure critical alerts are loud enough to wake you up.
#### iOS critical alerts permission
When you enable critical alerts for the first time on iOS, the app will prompt you to allow them at the system level. You can also enable this manually in iOS **Settings** → **Apps** → **Better Stack** → **Notifications** → **Critical Alerts**.
Are you on Samsung's Android 14?
--------------------------------
To allow alerts to bypass Do Not Disturb, go to **Settings** -> **Apps** -> **3 dots** -> **Special Access** -> **Do not disturb permission** -> **Better Stack** and enable the override.
* * *
[Previous article\
\
Zapier & Better Stack integration](https://betterstack.com/docs/uptime/zapier/)
[Next article\
\
iOS & Android phone call alerts](https://betterstack.com/docs/uptime/ios-and-android-phone-call-alerts/)
###### On this page
* [Using the app with Uptime](https://betterstack.com/docs/uptime/ios-and-android-mobile-apps/#using-the-app-with-uptime)
* [Connecting the mobile apps](https://betterstack.com/docs/uptime/ios-and-android-mobile-apps/#connecting-the-mobile-apps)
* [Configuring push notifications](https://betterstack.com/docs/uptime/ios-and-android-mobile-apps/#configuring-push-notifications)
* [Configuring notifications in the app](https://betterstack.com/docs/uptime/ios-and-android-mobile-apps/#configuring-notifications-in-the-app)
### Please accept cookies
We use cookies to authenticate users, improve the product user experience, and for [personalized ads](https://business.safety.google/privacy/)
. [Learn more.](https://betterstack.com/privacy)
Deny Accept required Accept all
---
# Live tail | Better Stack Documentation
###### Explore documentation
* [Welcome to Telemetry 👋](https://betterstack.com/docs/logs/start/)
* [Quick start guide](https://betterstack.com/docs/logs/logging-start/)
* [Wide events vs. metrics](https://betterstack.com/docs/logs/wide-events-time-series/)
* [Ingesting data](https://betterstack.com/docs/logs/using-logtail/live-tail-query-language/)
1. [Better Stack collector](https://betterstack.com/docs/logs/collector/)
2. [Vector](https://betterstack.com/docs/logs/vector/)
3. [OpenTelemetry](https://betterstack.com/docs/logs/open-telemetry/)
4. [Ingesting via HTTP API](https://betterstack.com/docs/logs/ingesting-data/http/logs/)
5. [Ingesting metrics](https://betterstack.com/docs/logs/ingesting-data/metrics/prometheus-scrape/)
6. [Ingesting logs](https://betterstack.com/docs/logs/ingesting-data/logs/docker-kubernetes/)
7. [Migrating to Better Stack](https://betterstack.com/docs/logs/datadog-agent/)
* [Using the product](https://betterstack.com/docs/logs/using-logtail/live-tail-query-language/)
1. [AI SRE ↗](https://betterstack.com/demos/ai-sre/)
2. [MCP server ↗](https://betterstack.com/docs/getting-started/integrations/mcp/)
3. [Transforming ingested data](https://betterstack.com/docs/logs/using-logtail/transforming-ingested-data/logs-vrl/)
4. [Querying data](https://betterstack.com/docs/logs/using-logtail/live-tail-query-language/)
1. [Live tail](https://betterstack.com/docs/logs/using-logtail/live-tail-query-language/)
1. [Advanced guide](https://betterstack.com/docs/logs/using-logtail/formatting-logs/)
2. [Events](https://betterstack.com/docs/logs/using-logtail/explore-logs/)
3. [Dashboards](https://betterstack.com/docs/logs/dashboards/getting-started/)
4. [SQL API](https://betterstack.com/docs/logs/query-api/connect-remotely/)
5. [Query boost](https://betterstack.com/docs/logs/query-boost/)
6. [Faster queries](https://betterstack.com/docs/logs/faster-queries/)
7. [Host data in own bucket](https://betterstack.com/docs/logs/host-data-in-your-own-bucket/)
5. [Tracing](https://betterstack.com/docs/logs/tracing/)
6. [Alerts](https://betterstack.com/docs/logs/dashboards/alerts/)
* [Telemetry API](https://betterstack.com/docs/logs/using-logtail/live-tail-query-language/)
1. [Getting an API token](https://betterstack.com/docs/logs/api/getting-started/)
2. [Sources & collectors](https://betterstack.com/docs/logs/api/list-all-existing-sources/)
3. [Dashboards](https://betterstack.com/docs/logs/api/dashboards/list/)
4. [Explorations](https://betterstack.com/docs/logs/api/explorations/list/)
5. [Alerts API](https://betterstack.com/docs/logs/api/alerts/list/)
6. [Connections API](https://betterstack.com/docs/logs/api/connections/list/)
7. [Query API ↗](https://betterstack.com/docs/logs/query-api/connect-remotely/)
* [Alternative to](https://betterstack.com/docs/logs/using-logtail/live-tail-query-language/)
1. [Lightstep](https://betterstack.com/docs/logs/alternative-to/lightstep/)
Live tail
=========
The Live tail query language is what powers searching in Live tail. The query language is designed to be straightforward to use and powerful at the same time.
There are two main modes to use the query language in:
* [Simple](https://betterstack.com/docs/logs/using-logtail/live-tail-query-language/#simple-queries)
* [Compound](https://betterstack.com/docs/logs/using-logtail/live-tail-query-language/#compound-queries)
Simple queries
--------------
Simple queries are what you're used to from search engines - queries like these are all supported.
* "hello world"
* Started
* 404
* "`https://example.com/abcd`"
When you use a simple query, we search all columns that match the query type with a fulltext query, case insensitive. This means that if you search for `Hello`, we can find logs like
Matched log example
Copied!
{
message_string: "Hello world!",
}
and
Matched log example
Copied!
{
article_published_at: "2021-05-26T13:32:01Z",
article_title: "The band Hello announced a new tour!"
}
Compound queries
----------------
Compound queries follow a more rigid structure, and allow for chaining query clauses in a single search. Compound queries are composed of clauses optionally chained with a conjunction operator. You can also use parentheses to give preference to the queries.
Compound query - Match 4xx status codes
Copied!
vercel.proxy.status_code_integer>=400 AND vercel.proxy.status_code_integer<500
In the example query, there are two query clauses joined by an AND cojunction operator.
A compound query clause consists of a column, an operator, and a value. In the case of the previous query, the first clause has
* `vercel.proxy.status_code_integer` as the column,
* `>=` as the operator, and
* `400` as the value
### Query clause format
You can use any columns you sent us in a compound query clause.
This is the operator list currently supported:
* Operators applicable to all column types
* `=` equals
* `!=` not equals
* **String** operators
* `:` contains
* `!:` not contains
* `=~` matches regex
* `!~` doesn't match regex
* **Integer** and **Float** operators
* `>=` greater than or equal
* `<=` less than or equal
* `>` greater than
* `<` less than
The value of a query clause can be either a simple text, or a more complex text surrounded by quotes. Here are some examples:
* `hello`
* `"Hello World"`
* `500`
Note that query clause values don't support asterisks (`*`) or question marks (`?`) for regex matching. These queries are therefore not valid:
* `vercel.proxy.status_code_integer>=4??`
* `vercel.proxy.status_code_integer>=4*`
In most cases, you can achieve the expected result with query chaining, like
* `vercel.proxy.status_code_integer>=400 AND vercel.proxy.status_code_integer<500`
We support two conjunction operators: `AND` and `OR`. You can also query for compound queries without using either of those, in which case we assume the `AND` operator. This means that this query
Compound query - Match 4xx status codes
Copied!
vercel.proxy.status_code_integer>=400 AND vercel.proxy.status_code_integer<500
behaves the same as this one
Compound query - Implicit AND for 4xx status codes
Copied!
vercel.proxy.status_code_integer>=400 vercel.proxy.status_code_integer<500
Note that it's currently not possible to chain Simple and Compound queries - if you tried something like `vercel.proxy.status_code_integer>=400 AND "Hello World"`, we fallback to parsing this as a simple query, matching the entire query contents against your columns.
### Escaping dots in column names
When your log data contains keys with literal dots in their names, you need to escape them with backslashes and wrap the entire key in quotes to distinguish them from nested object notation.
Escaping dots in column names
Copied!
"resource.attributes.service\.name"=mysql
Without proper escaping, a query like `nested.key.with.dot=value` would be interpreted as accessing the `dot` property of the `with` object inside the `key` object of the `nested` object, rather than a single key literally named `nested.key.with.dot`.
### Fulltext column
Because chaining simple and compound queries is not supported, we have a special column to specify the fulltext search behavior present in simple queries: fulltext. The usage is the same as with other columns - the difference is that when we encounter this column, we search all columns in the same way as the simple queries do.
These queries are therefore equivalent:
* `Hello world`
* `fulltext:"Hello world"`
You can use `=`, `!=`, `:`, `!:`, `=~`, and `!~` operators with the `fulltext` column.
You can use the special `fullext` column to make wider searches while maintaining filters imposed by other clauses, for example
Example of using fulltext in compound query
Copied!
vercel.proxy.status_code_intetger>=400 AND \
vercel.proxy.status_code_intetger>=400 AND \
fulltext:"Record Not Found"
Regular expressions
-------------------
Query using regular expressions in Live tail to match more complex patterns within log entries.
There are three primary ways to use regex in your queries:
* **Fulltext search**: Applies the regex to the entire log message, searching across all columns (e.g., `/Started (GET|POST)/`).
* **Column search**: Applies the regex to specific columns using the `=~` and `!~` operators (e.g., `message=~/Failed (GET|POST)/`).
* **Case-insensitive matching**: Allows regex to ignore case sensitivity by appending an `i` after the expression, which requires slashes (e.g., `message=~/case insensitive/i`).
**Want to match a range of numbers?**
Regex is only supported for string-based columns. For numeric columns like `status_code`, use comparison operators such as `status_code>=400 AND status_code<500`.
### Fulltext search with regex
In a fulltext search, the regex is applied to the entire log message, searching across all columns.
Filter logs where the log message contains "Started GET" or "Started POST":
Fulltext search: Match GET or POST requests
Copied!
/Started (GET|POST)/
Find logs containing the word "error" followed by a 4xx or 5xx status code:
Fulltext search: Match error followed by 4xx or 5xx status codes
Copied!
/error (4\d{2}|5\d{2})/
Match logs that include "OK in \[some number\] ms," where the number can have one or more digits and a decimal point:
Fulltext search: Match OK response time
Copied!
/OK in \d+\.\d+ms/
Match logs containing user login messages in the format "User \[ID\] logged in," where `[ID]` is a combination of alphanumeric characters and hyphens:
Fulltext search: Match user login by ID
Copied!
/"User [\w\-]+ logged in"/
### Column search with regex
When using regex with specific columns, use the `=~` and `!~` operators, and wrap multiple-word patterns in quotes.
Filter logs where the `message` column contains "Failed GET" or "Failed POST":
Column search: Match failed GET or POST requests
Copied!
message=~/Failed (GET|POST)/
Find logs where the `user_agent` column includes either "Chrome" or "Firefox":
Column search: Match Chrome or Firefox user agents
Copied!
user_agent=~/Chrome|Firefox/
Match logs where the `url` column follows the pattern `/api/v[version]/items`, useful for tracking API version usage:
Column search: Match API version in URL path
Copied!
url=~/\/api\/v\d+\/items/
### Case-insensitive matching with regex
To perform case-insensitive matching, append `i` at the end of the regex expression, and use slashes around the pattern.
Perform a case-insensitive search for "Kubernetes" or "Docker" within the `platform` column:
Case-insensitive match: Match Kubernetes or Docker
Copied!
platform=~/Kubernetes|Docker/i
Find logs where the `user_agent` column includes either "Chrome" or "Firefox":
Case-insensitive match: Match Chrome or Firefox user agents
Copied!
user_agent=~/Chrome|Firefox/i
Pattern-based filtering
-----------------------
Every log entry in Live tail includes a special `_pattern` field that represents a normalized version of the message, with variable data like IDs, numbers, and timestamps removed. This helps group similar log entries and makes it easy to filter repetitive or noisy logs.
You can use the `_pattern` field in compound queries to include or exclude logs matching specific patterns.
To make this easier, just hover over a log in Live tail and click **Filter by similar pattern** or **Exclude this pattern**.

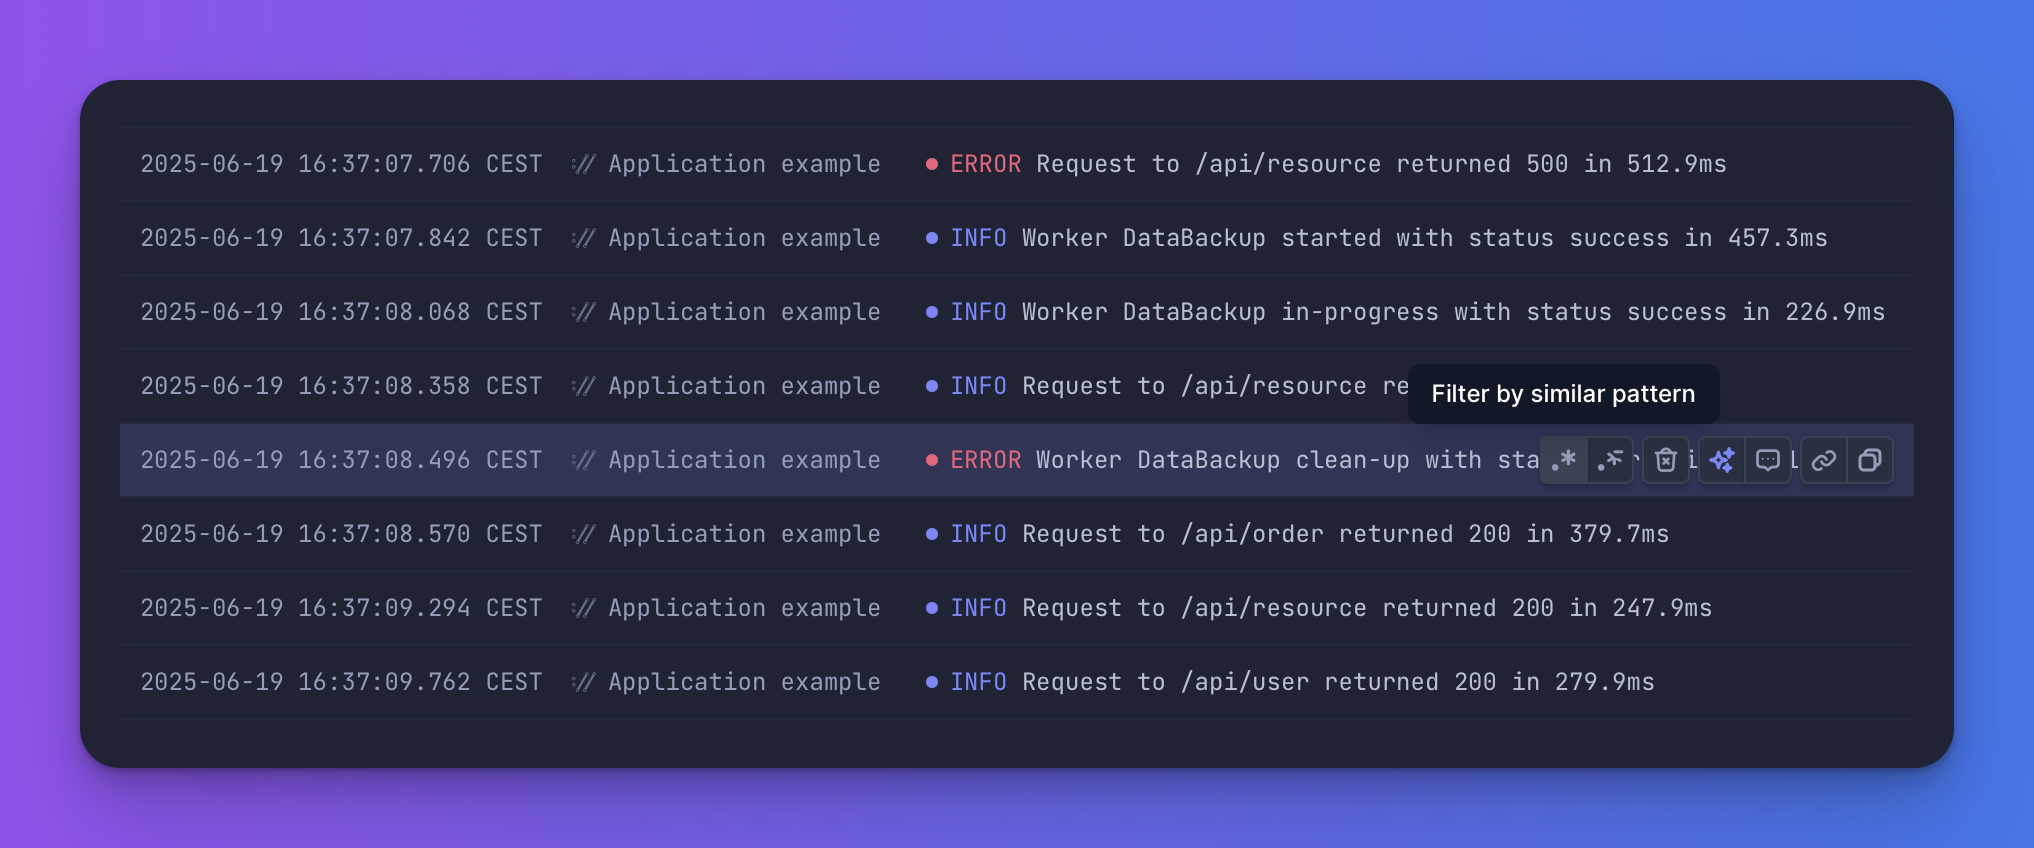
That will add a new filter into your current query, for example excluding entries that match a specific pattern:
Exclude known health check pattern
Copied!
_pattern!=6476bd6e601f1d12aa91e82371c88066
Learn more about [how log patterns work](https://betterstack.com/docs/logs/using-logtail/using-pattern-field/)
.
* * *
[Previous article\
\
How to manage high cardinality in metrics (legacy)](https://betterstack.com/docs/logs/how-to-manage-high-cardinality-in-metrics/)
[Next article\
\
Advanced Live tail guide](https://betterstack.com/docs/logs/using-logtail/formatting-logs/)
###### On this page
* [Simple queries](https://betterstack.com/docs/logs/using-logtail/live-tail-query-language/#simple-queries)
* [Compound queries](https://betterstack.com/docs/logs/using-logtail/live-tail-query-language/#compound-queries)
* [Regular expressions](https://betterstack.com/docs/logs/using-logtail/live-tail-query-language/#regular-expressions)
* [Pattern-based filtering](https://betterstack.com/docs/logs/using-logtail/live-tail-query-language/#pattern-based-filtering)
### Please accept cookies
We use cookies to authenticate users, improve the product user experience, and for [personalized ads](https://business.safety.google/privacy/)
. [Learn more.](https://betterstack.com/privacy)
Deny Accept required Accept all
---
# Update on-call schedule event | Better Stack Documentation
###### Explore documentation
* [Welcome to Uptime 👋](https://betterstack.com/docs/uptime/start/)
* [Frequently Asked Questions](https://betterstack.com/docs/uptime/frequently-asked-questions/)
* [On-call scheduling and alerting](https://betterstack.com/docs/uptime/api/update-on-call-calendar-event/)
1. [Get started](https://betterstack.com/docs/uptime/getting-started-with-oncall-v2/)
2. [Slack and other integrations ↗](https://betterstack.com/docs/uptime/slack/)
3. [Connecting external calendars](https://betterstack.com/docs/uptime/connecting-external-calendars/)
4. [Advanced guide](https://betterstack.com/docs/uptime/escalation-policies/)
* [Incidents](https://betterstack.com/docs/uptime/api/update-on-call-calendar-event/)
1. [Get started](https://betterstack.com/docs/uptime/working-with-incidents/)
2. [Advanced guide](https://betterstack.com/docs/uptime/post-mortems/)
3. [Reporting ↗](https://betterstack.com/docs/getting-started/team-and-account-management/reporting/)
* [Monitoring](https://betterstack.com/docs/uptime/api/update-on-call-calendar-event/)
1. [Get started](https://betterstack.com/docs/uptime/monitoring-start/)
2. [Working with monitors](https://betterstack.com/docs/uptime/bulk-importing-monitors/)
3. [Customizing monitors](https://betterstack.com/docs/uptime/naming-monitors/)
4. [Monitor types](https://betterstack.com/docs/uptime/uptime-monitor/)
* [Status pages](https://betterstack.com/docs/uptime/api/update-on-call-calendar-event/)
1. [Get started](https://betterstack.com/docs/uptime/getting-started-with-status-pages/)
2. [Advanced guide](https://betterstack.com/docs/uptime/custom-subdomain/)
* [Uptime API](https://betterstack.com/docs/uptime/api/update-on-call-calendar-event/)
1. [Getting an API token](https://betterstack.com/docs/uptime/api/getting-started-with-uptime-api/)
2. [Monitors](https://betterstack.com/docs/uptime/api/list-all-existing-monitors/)
3. [Heartbeats](https://betterstack.com/docs/uptime/api/list-all-existing-hearbeats/)
4. [On-call & incidents](https://betterstack.com/docs/uptime/api/on-call-calendar/)
1. [On-call schedule](https://betterstack.com/docs/uptime/api/list-all-existing-on-call-calendars/)
2. [On-call schedule events](https://betterstack.com/docs/uptime/api/list-on-call-calendar-events/)
1. [List on-call schedule events GET](https://betterstack.com/docs/uptime/api/list-on-call-calendar-events/)
2. [Get on-call schedule event GET](https://betterstack.com/docs/uptime/api/get-single-on-call-calendar-event/)
3. [Create on-call schedule event POST](https://betterstack.com/docs/uptime/api/create-on-call-calendar-event/)
4. [Update on-call schedule event PATCH](https://betterstack.com/docs/uptime/api/update-on-call-calendar-event/)
5. [Remove on-call schedule event DELETE](https://betterstack.com/docs/uptime/api/delete-on-call-calendar-event/)
6. [Bulk update on-call schedule events PUT](https://betterstack.com/docs/uptime/api/bulk-update-on-call-calendar-events/)
7. [Response attributes](https://betterstack.com/docs/uptime/api/on-call-calendar-events-api-response-params/)
3. [On-call schedule rotations](https://betterstack.com/docs/uptime/api/get-on-call-calendar-rotation/)
4. [Escalation policies](https://betterstack.com/docs/uptime/api/list-all-escalation-policies/)
5. [Escalation policy groups](https://betterstack.com/docs/uptime/api/list-all-existing-escalation-policy-groups/)
6. [Severities](https://betterstack.com/docs/uptime/api/list-all-severities/)
7. [Severity groups](https://betterstack.com/docs/uptime/api/list-all-existing-severity-groups/)
8. [Incidents](https://betterstack.com/docs/uptime/api/list-all-incidents/)
9. [Comments](https://betterstack.com/docs/uptime/api/list-all-comments/)
5. [Status pages](https://betterstack.com/docs/uptime/api/list-all-existing-status-pages/)
6. [Metadata](https://betterstack.com/docs/uptime/api/metadata/)
7. [Integrations](https://betterstack.com/docs/uptime/api/list-all-new-relic-integrations/)
8. [Team members](https://betterstack.com/docs/uptime/api/team-members/list/)
Update on-call schedule event
=============================
Update a single event in the given on-call schedule.
Events starting sooner than today at 0:00 UTC can't be updated.
PATCH https://uptime.betterstack.com/api/v2/on-calls/{schedule\_id}/events/{event\_id}
URL parameters
schedule\_id
required string
The ID of the on-call schedule that the event is part of. Use `default` to refer to the default on-call schedule for the team.
event\_id
required string
The ID of the event you want to update.
Headers
Authorization
required string
Bearer `$TOKEN`
Body parameters
starts\_at
date
Start time of the event. Must be today at 0:00 UTC or later.
ends\_at
date
End time of the event.
users
array
List of email addresses of the users that will be on-call during this event.
override
boolean
Whether this event is an override. Override events take precedence over regular scheduled events.
200
Event was updated
Response body
{
"id": 12345678,
"starts_at": "2025-01-01T09:45:00Z",
"ends_at": "2025-01-01T17:00:00",
"users": [\
"tomas@betterstack.com"\
],
"override": false
}
422
Event was not updated
Response body
{
"errors": {
"base": [\
"events ending before today at 00:00 UTC can't be updated or deleted"\
]
}
}
#### Example cURL
Example
Copied!
curl --request PATCH \
--url "https://uptime.betterstack.com/api/v2/on-calls/default/events/12345678" \
--header "Authorization: Bearer $TOKEN" \
--header "Content-Type: application/json" \
--data '{ "starts_at": "2025-01-01T09:45:00Z" }'
* * *
[Previous article\
\
Create an on-call schedule event](https://betterstack.com/docs/uptime/api/create-on-call-calendar-event/)
[Next article\
\
Remove on-call schedule event](https://betterstack.com/docs/uptime/api/delete-on-call-calendar-event/)
### Please accept cookies
We use cookies to authenticate users, improve the product user experience, and for [personalized ads](https://business.safety.google/privacy/)
. [Learn more.](https://betterstack.com/privacy)
Deny Accept required Accept all
---
# Monitors | Demos
###### Explore documentation
* [Explore demos 👋](https://betterstack.com/demos/welcome/)
* [AI SRE & MCP server](https://betterstack.com/demos/ai-sre-and-mcp-server/)
* [Uptime](https://betterstack.com/demos/monitoring/)
1. [Incidents](https://betterstack.com/demos/incident-management/)
2. [On-call and escalations](https://betterstack.com/demos/on-call/)
3. [Monitors](https://betterstack.com/demos/monitoring/)
4. [Heartbeats](https://betterstack.com/demos/uptime/heartbeats/)
5. [Status pages](https://betterstack.com/demos/status-page/)
6. [Integrations](https://betterstack.com/demos/uptime/integrations/)
7. [Reporting](https://betterstack.com/demos/reporting/)
8. [API and Terraform](https://betterstack.com/demos/uptime-api/)
* [Telemetry](https://betterstack.com/demos/monitoring/)
1. [Sources](https://betterstack.com/demos/services/)
2. [Live tail](https://betterstack.com/demos/live-tail/)
3. [Events](https://betterstack.com/demos/logs/explore/)
4. [Metrics](https://betterstack.com/demos/metrics/)
5. [Alerts](https://betterstack.com/demos/logs/alerts/)
6. [AI SRE ↗](https://betterstack.com/demos/ai-sre-and-mcp-server/)
* [Errors](https://betterstack.com/demos/errors/)
1. [Error tracking](https://betterstack.com/demos/errors-intro/)
* [Warehouse](https://betterstack.com/demos/monitoring/)
1. [Sources](https://betterstack.com/demos/warehouse-data/)
2. [Queries as APIs](https://betterstack.com/demos/warehouse-queries/)
3. [Ad-hoc SQL API](https://betterstack.com/demos/warehouse/ad-hoc-sql-api/)
* [Other](https://betterstack.com/demos/monitoring/)
1. [Organization and teams](https://betterstack.com/demos/organisation-management/)
Monitors
========
See how to set up and manage basic monitoring, configure simple escalations, and view response time and uptime charts.
### Related resources
* [Docs: Get started with monitoring](https://betterstack.com/docs/uptime/monitoring-start/)
Advanced monitor configuration
------------------------------
See how to set up recovery and confirmation periods, SSL and domain expiration checks, HTTP authentication, and more.
### Related resources
* [Docs: Customizing monitors](https://betterstack.com/docs/uptime/uptime-monitor/)
Migrating to Better Stack: import monitors in bulk
--------------------------------------------------
See how you can import monitors into Better Stack in bulk.
### Related resources
* [Docs: Bulk importing monitors](https://betterstack.com/docs/uptime/bulk-importing-monitors/)
Playwright monitoring
---------------------
See how to run transaction checks using Playwright.
### Related resources
* [Guides: Playwright Testing Essentials](https://betterstack.com/community/guides/testing/playwright-intro/)
Monitoring service health
-------------------------
See how to use keyword monitoring to check the health of your app.
### Related resources
* [Guides: Get Started with Server Health Checks](https://betterstack.com/community/guides/monitoring/health-checks/)
API monitoring
--------------
See how to set up monitoring to check the response body of an API.
### Related resources
* [Docs: API monitoring](https://betterstack.com/docs/uptime/api-monitor/)
* * *
[Previous article\
\
On-call and escalations](https://betterstack.com/demos/on-call/)
[Next article\
\
Heartbeats (Cron monitoring)](https://betterstack.com/demos/uptime/heartbeats/)
###### On this page
* [Advanced monitor configuration](https://betterstack.com/demos/monitoring/#advanced-monitor-configuration)
* [Migrating to Better Stack: import monitors in bulk](https://betterstack.com/demos/monitoring/#migrating-to-better-stack-import-monitors-in-bulk)
* [Playwright monitoring](https://betterstack.com/demos/monitoring/#playwright-monitoring)
* [Monitoring service health](https://betterstack.com/demos/monitoring/#monitoring-service-health)
* [API monitoring](https://betterstack.com/demos/monitoring/#api-monitoring)
### Please accept cookies
We use cookies to authenticate users, improve the product user experience, and for [personalized ads](https://business.safety.google/privacy/)
. [Learn more.](https://betterstack.com/privacy)
Deny Accept required Accept all
---
# Remove on-call schedule event | Better Stack Documentation
###### Explore documentation
* [Welcome to Uptime 👋](https://betterstack.com/docs/uptime/start/)
* [Frequently Asked Questions](https://betterstack.com/docs/uptime/frequently-asked-questions/)
* [On-call scheduling and alerting](https://betterstack.com/docs/uptime/api/delete-on-call-calendar-event/)
1. [Get started](https://betterstack.com/docs/uptime/getting-started-with-oncall-v2/)
2. [Slack and other integrations ↗](https://betterstack.com/docs/uptime/slack/)
3. [Connecting external calendars](https://betterstack.com/docs/uptime/connecting-external-calendars/)
4. [Advanced guide](https://betterstack.com/docs/uptime/escalation-policies/)
* [Incidents](https://betterstack.com/docs/uptime/api/delete-on-call-calendar-event/)
1. [Get started](https://betterstack.com/docs/uptime/working-with-incidents/)
2. [Advanced guide](https://betterstack.com/docs/uptime/post-mortems/)
3. [Reporting ↗](https://betterstack.com/docs/getting-started/team-and-account-management/reporting/)
* [Monitoring](https://betterstack.com/docs/uptime/api/delete-on-call-calendar-event/)
1. [Get started](https://betterstack.com/docs/uptime/monitoring-start/)
2. [Working with monitors](https://betterstack.com/docs/uptime/bulk-importing-monitors/)
3. [Customizing monitors](https://betterstack.com/docs/uptime/naming-monitors/)
4. [Monitor types](https://betterstack.com/docs/uptime/uptime-monitor/)
* [Status pages](https://betterstack.com/docs/uptime/api/delete-on-call-calendar-event/)
1. [Get started](https://betterstack.com/docs/uptime/getting-started-with-status-pages/)
2. [Advanced guide](https://betterstack.com/docs/uptime/custom-subdomain/)
* [Uptime API](https://betterstack.com/docs/uptime/api/delete-on-call-calendar-event/)
1. [Getting an API token](https://betterstack.com/docs/uptime/api/getting-started-with-uptime-api/)
2. [Monitors](https://betterstack.com/docs/uptime/api/list-all-existing-monitors/)
3. [Heartbeats](https://betterstack.com/docs/uptime/api/list-all-existing-hearbeats/)
4. [On-call & incidents](https://betterstack.com/docs/uptime/api/on-call-calendar/)
1. [On-call schedule](https://betterstack.com/docs/uptime/api/list-all-existing-on-call-calendars/)
2. [On-call schedule events](https://betterstack.com/docs/uptime/api/list-on-call-calendar-events/)
1. [List on-call schedule events GET](https://betterstack.com/docs/uptime/api/list-on-call-calendar-events/)
2. [Get on-call schedule event GET](https://betterstack.com/docs/uptime/api/get-single-on-call-calendar-event/)
3. [Create on-call schedule event POST](https://betterstack.com/docs/uptime/api/create-on-call-calendar-event/)
4. [Update on-call schedule event PATCH](https://betterstack.com/docs/uptime/api/update-on-call-calendar-event/)
5. [Remove on-call schedule event DELETE](https://betterstack.com/docs/uptime/api/delete-on-call-calendar-event/)
6. [Bulk update on-call schedule events PUT](https://betterstack.com/docs/uptime/api/bulk-update-on-call-calendar-events/)
7. [Response attributes](https://betterstack.com/docs/uptime/api/on-call-calendar-events-api-response-params/)
3. [On-call schedule rotations](https://betterstack.com/docs/uptime/api/get-on-call-calendar-rotation/)
4. [Escalation policies](https://betterstack.com/docs/uptime/api/list-all-escalation-policies/)
5. [Escalation policy groups](https://betterstack.com/docs/uptime/api/list-all-existing-escalation-policy-groups/)
6. [Severities](https://betterstack.com/docs/uptime/api/list-all-severities/)
7. [Severity groups](https://betterstack.com/docs/uptime/api/list-all-existing-severity-groups/)
8. [Incidents](https://betterstack.com/docs/uptime/api/list-all-incidents/)
9. [Comments](https://betterstack.com/docs/uptime/api/list-all-comments/)
5. [Status pages](https://betterstack.com/docs/uptime/api/list-all-existing-status-pages/)
6. [Metadata](https://betterstack.com/docs/uptime/api/metadata/)
7. [Integrations](https://betterstack.com/docs/uptime/api/list-all-new-relic-integrations/)
8. [Team members](https://betterstack.com/docs/uptime/api/team-members/list/)
Remove on-call schedule event
=============================
Delete a single event from an on-call schedule.
Events starting sooner than today at 0:00 UTC can't be deleted.
DELETE https://uptime.betterstack.com/api/v2/on-calls/{schedule\_id}/events/{event\_id}
URL parameters
schedule\_id
required string
The ID of the on-call schedule you want to get events for. Use `default` to refer to the default on-call schedule for the team.
event\_id
required string
The ID of the event to return
Headers
Authorization
required string
Bearer `$TOKEN`
204
Event was deleted
#### Example cURL
Example
Copied!
curl --request DELETE \
--url "https://uptime.betterstack.com/api/v2/on-calls/default/events/12345" \
--header "Authorization: Bearer $TOKEN"
* * *
[Previous article\
\
Update on-call schedule event](https://betterstack.com/docs/uptime/api/update-on-call-calendar-event/)
[Next article\
\
Bulk update on-call schedule events](https://betterstack.com/docs/uptime/api/bulk-update-on-call-calendar-events/)
### Please accept cookies
We use cookies to authenticate users, improve the product user experience, and for [personalized ads](https://business.safety.google/privacy/)
. [Learn more.](https://betterstack.com/privacy)
Deny Accept required Accept all
---
# Uptime integrations | Demos
###### Explore documentation
* [Explore demos 👋](https://betterstack.com/demos/welcome/)
* [AI SRE & MCP server](https://betterstack.com/demos/ai-sre-and-mcp-server/)
* [Uptime](https://betterstack.com/demos/uptime/integrations/)
1. [Incidents](https://betterstack.com/demos/incident-management/)
2. [On-call and escalations](https://betterstack.com/demos/on-call/)
3. [Monitors](https://betterstack.com/demos/monitoring/)
4. [Heartbeats](https://betterstack.com/demos/uptime/heartbeats/)
5. [Status pages](https://betterstack.com/demos/status-page/)
6. [Integrations](https://betterstack.com/demos/uptime/integrations/)
7. [Reporting](https://betterstack.com/demos/reporting/)
8. [API and Terraform](https://betterstack.com/demos/uptime-api/)
* [Telemetry](https://betterstack.com/demos/uptime/integrations/)
1. [Sources](https://betterstack.com/demos/services/)
2. [Live tail](https://betterstack.com/demos/live-tail/)
3. [Events](https://betterstack.com/demos/logs/explore/)
4. [Metrics](https://betterstack.com/demos/metrics/)
5. [Alerts](https://betterstack.com/demos/logs/alerts/)
6. [AI SRE ↗](https://betterstack.com/demos/ai-sre-and-mcp-server/)
* [Errors](https://betterstack.com/demos/errors/)
1. [Error tracking](https://betterstack.com/demos/errors-intro/)
* [Warehouse](https://betterstack.com/demos/uptime/integrations/)
1. [Sources](https://betterstack.com/demos/warehouse-data/)
2. [Queries as APIs](https://betterstack.com/demos/warehouse-queries/)
3. [Ad-hoc SQL API](https://betterstack.com/demos/warehouse/ad-hoc-sql-api/)
* [Other](https://betterstack.com/demos/uptime/integrations/)
1. [Organization and teams](https://betterstack.com/demos/organisation-management/)
Uptime integrations
===================
See how to enable push notifications in the Better Stack app and how to allowlist the Better Stack alerting number to call you even when in silent mode.
### On-call on iOS - [App Store](https://apps.apple.com/us/app/better-stack-on-call/id6739978181)
### On-call on Android - [Google Play](https://play.google.com/store/apps/details?id=com.betteruptime.BetterStack)
### Related resources
* [Better Stack: Connect the app via QR code](https://betterstack.com/settings/push-notifications)
* [Docs: Save the Better Stack alerting numbers](https://betterstack.com/docs/uptime/frequently-asked-questions/#what-phone-numbers-will-better-stack-call-me-from)
* [Docs: Silent mode override](https://betterstack.com/docs/uptime/ios-and-android-phone-call-alerts/#allowing-phone-call-alerts-in-silent-mode-on-iphone)
Create incidents via webhooks
-----------------------------
See how to programmatically create new incidents using webhooks.
Handling incidents from Prometheus Alertmanager
-----------------------------------------------
See how to automatically create incidents from Prometheus Alertmanager.
Handling incidents from Elastic
-------------------------------
See how to automatically create incidents from Elastic.
* * *
[Previous article\
\
Status pages](https://betterstack.com/demos/status-page/)
[Next article\
\
Uptime reporting](https://betterstack.com/demos/reporting/)
###### On this page
* [Create incidents via webhooks](https://betterstack.com/demos/uptime/integrations/#create-incidents-via-webhooks)
* [Handling incidents from Prometheus Alertmanager](https://betterstack.com/demos/uptime/integrations/#handling-incidents-from-prometheus-alertmanager)
* [Handling incidents from Elastic](https://betterstack.com/demos/uptime/integrations/#handling-incidents-from-elastic)
### Please accept cookies
We use cookies to authenticate users, improve the product user experience, and for [personalized ads](https://business.safety.google/privacy/)
. [Learn more.](https://betterstack.com/privacy)
Deny Accept required Accept all
---
# Update status page resource | Better Stack Documentation
###### Explore documentation
* [Welcome to Uptime 👋](https://betterstack.com/docs/uptime/start/)
* [Frequently Asked Questions](https://betterstack.com/docs/uptime/frequently-asked-questions/)
* [On-call scheduling and alerting](https://betterstack.com/docs/uptime/api/update-an-existing-status-page-resource/)
1. [Get started](https://betterstack.com/docs/uptime/getting-started-with-oncall-v2/)
2. [Slack and other integrations ↗](https://betterstack.com/docs/uptime/slack/)
3. [Connecting external calendars](https://betterstack.com/docs/uptime/connecting-external-calendars/)
4. [Advanced guide](https://betterstack.com/docs/uptime/escalation-policies/)
* [Incidents](https://betterstack.com/docs/uptime/api/update-an-existing-status-page-resource/)
1. [Get started](https://betterstack.com/docs/uptime/working-with-incidents/)
2. [Advanced guide](https://betterstack.com/docs/uptime/post-mortems/)
3. [Reporting ↗](https://betterstack.com/docs/getting-started/team-and-account-management/reporting/)
* [Monitoring](https://betterstack.com/docs/uptime/api/update-an-existing-status-page-resource/)
1. [Get started](https://betterstack.com/docs/uptime/monitoring-start/)
2. [Working with monitors](https://betterstack.com/docs/uptime/bulk-importing-monitors/)
3. [Customizing monitors](https://betterstack.com/docs/uptime/naming-monitors/)
4. [Monitor types](https://betterstack.com/docs/uptime/uptime-monitor/)
* [Status pages](https://betterstack.com/docs/uptime/api/update-an-existing-status-page-resource/)
1. [Get started](https://betterstack.com/docs/uptime/getting-started-with-status-pages/)
2. [Advanced guide](https://betterstack.com/docs/uptime/custom-subdomain/)
* [Uptime API](https://betterstack.com/docs/uptime/api/update-an-existing-status-page-resource/)
1. [Getting an API token](https://betterstack.com/docs/uptime/api/getting-started-with-uptime-api/)
2. [Monitors](https://betterstack.com/docs/uptime/api/list-all-existing-monitors/)
3. [Heartbeats](https://betterstack.com/docs/uptime/api/list-all-existing-hearbeats/)
4. [On-call & incidents](https://betterstack.com/docs/uptime/api/on-call-calendar/)
5. [Status pages](https://betterstack.com/docs/uptime/api/list-all-existing-status-pages/)
1. [Status pages API](https://betterstack.com/docs/uptime/api/list-all-existing-status-pages/)
2. [Status page groups](https://betterstack.com/docs/uptime/api/list-all-status-page-groups/)
3. [Status page sections](https://betterstack.com/docs/uptime/api/list-existing-sections-of-a-status-page/)
4. [Status page resources](https://betterstack.com/docs/uptime/api/list-existing-resources-of-a-status-page/)
1. [List status page resources GET](https://betterstack.com/docs/uptime/api/list-existing-resources-of-a-status-page/)
2. [Get status page resource GET](https://betterstack.com/docs/uptime/api/get-a-single-status-page-resource/)
3. [Create status page resource POST](https://betterstack.com/docs/uptime/api/create-a-new-status-page-resource/)
4. [Update status page resource PATCH](https://betterstack.com/docs/uptime/api/update-an-existing-status-page-resource/)
5. [Remove status page resource DELETE](https://betterstack.com/docs/uptime/api/delete-an-existing-status-page-resource/)
6. [Response attributes](https://betterstack.com/docs/uptime/api/status-page-resources-api-response-params/)
5. [Status page reports](https://betterstack.com/docs/uptime/api/list-existing-reports-on-a-status-page/)
6. [Status page report updates](https://betterstack.com/docs/uptime/api/list-all-existing-status-updates-for-a-status-page-report/)
6. [Metadata](https://betterstack.com/docs/uptime/api/metadata/)
7. [Integrations](https://betterstack.com/docs/uptime/api/list-all-new-relic-integrations/)
8. [Team members](https://betterstack.com/docs/uptime/api/team-members/list/)
Update status page resource
===========================
Update an existing status page resource. Send only the parameters you wish to change (e.g. `public_name`), and note that `resource_id` and `resource_type` should be sent together.
PATCH https://uptime.betterstack.com/api/v2/status-pages/{status\_page\_id}/resources/{resource\_id}
URL parameters
status\_page\_id
required string
The ID of your status page
resource\_id
required string
The resource you want to update
Headers
Authorization
required string
Bearer `$TOKEN`
Content\_Type
string
application/json
Body parameters
status\_page\_section\_id
integer
The ID of the section which should contain this resource. When omitted, defaults to the first section on the status page.
widget\_type
string
What widget to display for this resource. Available values:
* `plain` - Only display status.
* `history` - Display historical status.
* `intraday_history` - Display detailed historical status.
* `response_times` - Add a response times chart. Only for `Monitor` or `LogsChart`.
* `chart_only` - Shows just the chart. Only for `LogsChart`.
This takes preference over `history` when both parameters are present.
resource\_id
string
The ID of the resource you are adding. Omit or set to `null` when `resource_type` is `ManuallyTrackedItem`.
resource\_type
string
The type of the resource you are adding. Available values: `ManuallyTrackedItem`, `Monitor`, `MonitorGroup`, `Heartbeat`, `HeartbeatGroup`, `WebhookIntegration`, `EmailIntegration`, `IncomingWebhook`, `ResourceGroup`, `LogsChart`, `CatalogReference`
public\_name
string
The resource name displayed publicly on your status page.
explanation
string
A detailed text displayed as a help icon.
position
integer
The position of this resource on your status page, indexed from zero. If you don't specify a `position`, we add the resource to the end of the status page. When you specify a `position` of an existing resource, we add the resource to this position and shift resources below to accommodate.
mark\_as\_down\_for
string
How the resource status is affected when an incident occurs. Possible values: `any_incident`, `no_incident`, `incident_matching_metadata`. Defaults to `any_incident`.
mark\_as\_down\_metadata\_rule
object
A rule to match incident metadata. Required when `mark_as_down_for` is `incident_matching_metadata`. The rule is a JSON object with `key` and `values` fields. See the [metadata API response params](https://betterstack.com/docs/uptime/api/metadata-api-response-params/)
for details about metadata value attributes.
mark\_as\_degraded\_for
string
How the resource status is affected when an incident occurs. Possible values: `any_incident`, `no_incident`, `incident_matching_metadata`. Defaults to `no_incident`.
mark\_as\_degraded\_metadata\_rule
object
A rule to match incident metadata. Required when `mark_as_degraded_for` is `incident_matching_metadata`. The rule is a JSON object with `key` and `values` fields. See the [metadata API response params](https://betterstack.com/docs/uptime/api/metadata-api-response-params/)
for details about metadata value attributes.
fixed\_position
boolean
If set to `true`, position reorders will be prevented.
200
Response body
{
"data": {
"id": "12345",
"type": "status_page_resource",
"attributes": {
"status_page_section_id": 456789,
"resource_id": 112233,
"resource_type": "Monitor",
"history": true,
"widget_type": "history",
"public_name": "https://uptime.betterstack.com/",
"explanation": "",
"position": 0,
"mark_as_down_for": "incident_matching_metadata",
"mark_as_down_metadata_rule": {
"key": "Default escalation policy",
"values": [\
{\
"type": "Policy",\
"item_id": "102683",\
"name": "Primary policy"\
}\
]
},
"mark_as_degraded_for": "any_incident",
"availability": 0.99963,
"status": "operational",
"status_history": [\
{\
"day": "2022-01-01",\
"status": "operational",\
"downtime_duration": 0,\
"maintenance_duration": 0\
},\
{\
"day": "2022-01-02",\
"status": "downtime",\
"downtime_duration": 120.0,\
"maintenance_duration": 0\
}\
]
}
}
}
#### Example cURL
Example Metadata rules Metadata using email
Copied!
curl --request PATCH \
--url https://uptime.betterstack.com/api/v2/status-pages/123456789/resources/12345 \
--header "Authorization: Bearer $TOKEN" \
--header 'Content-Type: application/json' \
--data '{
"public_name": "My great monitor, updated"
}'
curl --request PATCH \
--url https://uptime.betterstack.com/api/v2/status-pages/123456789/resources/12345 \
--header "Authorization: Bearer $TOKEN" \
--header 'Content-Type: application/json' \
--data '{
"mark_as_down_for": "incident_matching_metadata",
"mark_as_down_metadata_rule": {
"key": "Severity",
"values": [{ "value": "high" }]
}
"mark_as_degraded_for": "all_incidents",
}'
curl --request PATCH \
--url https://uptime.betterstack.com/api/v2/status-pages/123456789/resources/12345 \
--header "Authorization: Bearer $TOKEN" \
--header 'Content-Type: application/json' \
--data '{
"mark_as_down_for": "incident_matching_metadata",
"mark_as_down_metadata_rule": {
"key": "Responsible team member",
"values": [{ "email": 12345, "type": "User" }]
}
}'
#### Looking for the details of a specific parameter?
Explore [the list of all status page resources API parameters](https://betterstack.com/docs/uptime/api/status-page-resources-api-response-params/?utm_content=callout&utm_medium=docs-uptime&utm_source=community&utm_term=docs-uptime-api-updating-status-page-resource)
* * *
[Previous article\
\
Create status page resource](https://betterstack.com/docs/uptime/api/create-a-new-status-page-resource/)
[Next article\
\
Remove status page resource](https://betterstack.com/docs/uptime/api/delete-an-existing-status-page-resource/)
### Please accept cookies
We use cookies to authenticate users, improve the product user experience, and for [personalized ads](https://business.safety.google/privacy/)
. [Learn more.](https://betterstack.com/privacy)
Deny Accept required Accept all
---
# Response attributes | Better Stack Documentation
###### Explore documentation
* [Welcome to Uptime 👋](https://betterstack.com/docs/uptime/start/)
* [Frequently Asked Questions](https://betterstack.com/docs/uptime/frequently-asked-questions/)
* [On-call scheduling and alerting](https://betterstack.com/docs/uptime/api/status-page-resources-api-response-params/)
1. [Get started](https://betterstack.com/docs/uptime/getting-started-with-oncall-v2/)
2. [Slack and other integrations ↗](https://betterstack.com/docs/uptime/slack/)
3. [Connecting external calendars](https://betterstack.com/docs/uptime/connecting-external-calendars/)
4. [Advanced guide](https://betterstack.com/docs/uptime/escalation-policies/)
* [Incidents](https://betterstack.com/docs/uptime/api/status-page-resources-api-response-params/)
1. [Get started](https://betterstack.com/docs/uptime/working-with-incidents/)
2. [Advanced guide](https://betterstack.com/docs/uptime/post-mortems/)
3. [Reporting ↗](https://betterstack.com/docs/getting-started/team-and-account-management/reporting/)
* [Monitoring](https://betterstack.com/docs/uptime/api/status-page-resources-api-response-params/)
1. [Get started](https://betterstack.com/docs/uptime/monitoring-start/)
2. [Working with monitors](https://betterstack.com/docs/uptime/bulk-importing-monitors/)
3. [Customizing monitors](https://betterstack.com/docs/uptime/naming-monitors/)
4. [Monitor types](https://betterstack.com/docs/uptime/uptime-monitor/)
* [Status pages](https://betterstack.com/docs/uptime/api/status-page-resources-api-response-params/)
1. [Get started](https://betterstack.com/docs/uptime/getting-started-with-status-pages/)
2. [Advanced guide](https://betterstack.com/docs/uptime/custom-subdomain/)
* [Uptime API](https://betterstack.com/docs/uptime/api/status-page-resources-api-response-params/)
1. [Getting an API token](https://betterstack.com/docs/uptime/api/getting-started-with-uptime-api/)
2. [Monitors](https://betterstack.com/docs/uptime/api/list-all-existing-monitors/)
3. [Heartbeats](https://betterstack.com/docs/uptime/api/list-all-existing-hearbeats/)
4. [On-call & incidents](https://betterstack.com/docs/uptime/api/on-call-calendar/)
5. [Status pages](https://betterstack.com/docs/uptime/api/list-all-existing-status-pages/)
1. [Status pages API](https://betterstack.com/docs/uptime/api/list-all-existing-status-pages/)
2. [Status page groups](https://betterstack.com/docs/uptime/api/list-all-status-page-groups/)
3. [Status page sections](https://betterstack.com/docs/uptime/api/list-existing-sections-of-a-status-page/)
4. [Status page resources](https://betterstack.com/docs/uptime/api/list-existing-resources-of-a-status-page/)
1. [List status page resources GET](https://betterstack.com/docs/uptime/api/list-existing-resources-of-a-status-page/)
2. [Get status page resource GET](https://betterstack.com/docs/uptime/api/get-a-single-status-page-resource/)
3. [Create status page resource POST](https://betterstack.com/docs/uptime/api/create-a-new-status-page-resource/)
4. [Update status page resource PATCH](https://betterstack.com/docs/uptime/api/update-an-existing-status-page-resource/)
5. [Remove status page resource DELETE](https://betterstack.com/docs/uptime/api/delete-an-existing-status-page-resource/)
6. [Response attributes](https://betterstack.com/docs/uptime/api/status-page-resources-api-response-params/)
5. [Status page reports](https://betterstack.com/docs/uptime/api/list-existing-reports-on-a-status-page/)
6. [Status page report updates](https://betterstack.com/docs/uptime/api/list-all-existing-status-updates-for-a-status-page-report/)
6. [Metadata](https://betterstack.com/docs/uptime/api/metadata/)
7. [Integrations](https://betterstack.com/docs/uptime/api/list-all-new-relic-integrations/)
8. [Team members](https://betterstack.com/docs/uptime/api/team-members/list/)
Response attributes
===================
Response parameters
-------------------
#### Namespace `data`
| Parameter | Type | Values |
| --- | --- | --- |
| `id` | String | ID of the status page resource. |
| `type` | String | `status_page_resource` |
| `attributes` | Object | Attributes object. See below. |
#### Attributes
| Parameter | Type | Values |
| --- | --- | --- |
| `status_page_section_id` | Integer | ID of the section this status page resource resides in. |
| `resource_id` | Integer | ID of the resource on which is the status page resource pointing. E.g.: the ID of the monitor. |
| `resource_type` | String | Type of the resource on which is the status page resource pointing (e.g.: Monitor) Available values: `ManuallyTrackedItem`, `Monitor`, `MonitorGroup`, `Heartbeat`, `HeartbeatGroup`, `WebhookIntegration`, `EmailIntegration`, `IncomingWebhook`, `ResourceGroup`, `LogsChart`, `CatalogReference`. |
| `public_name` | String | The resource name displayed publicly on your status page. |
| `explanation` | String | A detailed text displayed as a help icon. |
| `history` (deprecated) | Boolean | **DEPRECATED** Do you want to show the incident history for this item? Default: `true`. **Please use the `widget_type` for this setting.** |
| `widget_type` | String | What widget to display for this resource. Available values:
`plain` - Only display status.
`history` - Display historical status.
`intraday_history` - Display detailed historical status.
`response_times` - Add a response times chart. Only for `Monitor` or `LogsChart`.
`chart_only` - Shows just the chart. Only for `LogsChart`. |
| `position` | Integer | The position of this resource on your status page, indexed from zero. If you don't specify a `position`, we add the resource to the end of the status page. When you specify a `position` of an existing resource, we add the resource to this position and shift resources below to accommodate. |
| `mark_as_down_for` | String | How the resource status is affected when an incident occurs. Possible values: `any_incident`, `no_incident`, `incident_matching_metadata`. |
| `mark_as_down_metadata_rule` | Object | A rule to match incident metadata. Only present when `mark_as_down_for` is `incident_matching_metadata`. The rule is a JSON object with `key` and `values` fields. See the [metadata API response params](https://betterstack.com/docs/uptime/api/metadata-api-response-params/)
for details about metadata value attributes. |
| `mark_as_degraded_for` | String | How the resource status is affected when an incident occurs. Possible values: `any_incident`, `no_incident`, `incident_matching_metadata`. |
| `mark_as_degraded_metadata_rule` | Object | A rule to match incident metadata. Only present when `mark_as_degraded_for` is `incident_matching_metadata`. The rule is a JSON object with `key` and `values` fields. See the [metadata API response params](https://betterstack.com/docs/uptime/api/metadata-api-response-params/)
for details about metadata value attributes. |
| `availability` | Double (Decimal number) | Takes on a the percentage value of a resource's availability. |
| `status` | String | The current status of the resource. Can be one of `not_monitored` (when the underlying monitor is paused), `operational`, `maintenance`, `degraded`, or `downtime`. |
| `status_history.[]` | StatusHistory | Array of history objects. See the [StatusHistory](https://betterstack.com/docs/uptime/api/status-page-resources-api-response-params/#statushistory)
section below for attribute details. |
#### StatusHistory
| Parameter | Type | Values |
| --- | --- | --- |
| `day` | String | Single day. In `YYYY-MM-DD` format. |
| `status` | String | Status during this day. |
| `downtime_duration` | Integer | The duration of downtime in seconds. |
| `maintenance_duration` | Integer | The duration of maintenance in seconds. |
* * *
[Previous article\
\
Remove status page resource](https://betterstack.com/docs/uptime/api/delete-an-existing-status-page-resource/)
[Next article\
\
List status page reports](https://betterstack.com/docs/uptime/api/list-existing-reports-on-a-status-page/)
### Please accept cookies
We use cookies to authenticate users, improve the product user experience, and for [personalized ads](https://business.safety.google/privacy/)
. [Learn more.](https://betterstack.com/privacy)
Deny Accept required Accept all
---
# Pausing monitors and maintenances | Better Stack Documentation
###### Explore documentation
* [Welcome to Uptime 👋](https://betterstack.com/docs/uptime/start/)
* [Frequently Asked Questions](https://betterstack.com/docs/uptime/frequently-asked-questions/)
* [On-call scheduling and alerting](https://betterstack.com/docs/uptime/pausing-monitors-and-maintenances/)
1. [Get started](https://betterstack.com/docs/uptime/getting-started-with-oncall-v2/)
2. [Slack and other integrations ↗](https://betterstack.com/docs/uptime/slack/)
3. [Connecting external calendars](https://betterstack.com/docs/uptime/connecting-external-calendars/)
4. [Advanced guide](https://betterstack.com/docs/uptime/escalation-policies/)
* [Incidents](https://betterstack.com/docs/uptime/pausing-monitors-and-maintenances/)
1. [Get started](https://betterstack.com/docs/uptime/working-with-incidents/)
2. [Advanced guide](https://betterstack.com/docs/uptime/post-mortems/)
3. [Reporting ↗](https://betterstack.com/docs/getting-started/team-and-account-management/reporting/)
* [Monitoring](https://betterstack.com/docs/uptime/pausing-monitors-and-maintenances/)
1. [Get started](https://betterstack.com/docs/uptime/monitoring-start/)
2. [Working with monitors](https://betterstack.com/docs/uptime/bulk-importing-monitors/)
1. [Bulk importing monitors](https://betterstack.com/docs/uptime/bulk-importing-monitors/)
2. [Grouping and ordering monitors](https://betterstack.com/docs/uptime/grouping-and-ordering-monitors/)
3. [Pausing monitors and maintenances](https://betterstack.com/docs/uptime/pausing-monitors-and-maintenances/)
4. [Removing monitors](https://betterstack.com/docs/uptime/removing-monitors/)
3. [Customizing monitors](https://betterstack.com/docs/uptime/naming-monitors/)
4. [Monitor types](https://betterstack.com/docs/uptime/uptime-monitor/)
* [Status pages](https://betterstack.com/docs/uptime/pausing-monitors-and-maintenances/)
1. [Get started](https://betterstack.com/docs/uptime/getting-started-with-status-pages/)
2. [Advanced guide](https://betterstack.com/docs/uptime/custom-subdomain/)
* [Uptime API](https://betterstack.com/docs/uptime/pausing-monitors-and-maintenances/)
1. [Getting an API token](https://betterstack.com/docs/uptime/api/getting-started-with-uptime-api/)
2. [Monitors](https://betterstack.com/docs/uptime/api/list-all-existing-monitors/)
3. [Heartbeats](https://betterstack.com/docs/uptime/api/list-all-existing-hearbeats/)
4. [On-call & incidents](https://betterstack.com/docs/uptime/api/on-call-calendar/)
5. [Status pages](https://betterstack.com/docs/uptime/api/list-all-existing-status-pages/)
6. [Metadata](https://betterstack.com/docs/uptime/api/metadata/)
7. [Integrations](https://betterstack.com/docs/uptime/api/list-all-new-relic-integrations/)
8. [Team members](https://betterstack.com/docs/uptime/api/team-members/list/)
Pausing monitors and maintenances
=================================
Pausing monitors
----------------
### Pausing monitors from the UI
If you want to pause monitors (for example during setup or testing) and not receive downtime alerts:
* Go to **Monitors**.
* Pick the monitor you want to pause.
* Click **Pause this monitor** in the headline.
* We will not monitor the endpoint host now.
* If you want to start monitoring again, click **Unpause monitor**.
### Pausing monitors using API
You can also use our Monitors API, endpoint **[PATCH /monitors](https://betterstack.com/docs/uptime/api/update-an-existing-monitor/)
**, to pause your monitor using the REST API Call.
Request example:
Pause monitor Unpause monitor
Copied!
curl --request PATCH \
--url https://uptime.betterstack.com/api/v2/monitors/:monitor_id\
--header "Authorization: Bearer $TOKEN" \
--header 'Content-Type: application/json' \
--data '{"paused": true}'
curl --request PATCH \
--url https://uptime.betterstack.com/api/v2/monitors/:monitor_id\
--header "Authorization: Bearer $TOKEN" \
--header 'Content-Type: application/json' \
--data '{"paused": false}'
Scheduled maintenance window
----------------------------
### Schedule maintenance window from the UI
Scheduled maintenance windows are used for times when you're expecting downtime to occur, and don't want to be alerted. This could be for example when running maintenance scripts in your infrastructure or provisioning a new infrastructure.
To add a maintenance window:
* Go to **Monitors**.
* Pick the monitor you want to add a maintenance window to.
* Click **Configure** in the headline.
* Click **Advanced settings**.
* Enter your maintenance window time in the **Maintenance window between** section, and select the right time zone.
* Click **Save changes**.
### Schedule maintenance window using API
You can also use our Monitors API, endpoint **[PATCH /monitors](https://betterstack.com/docs/uptime/api/update-an-existing-monitor/)
**, to schedule a maintenance window using the REST API Call.
Request example:
Copied!
curl --request PATCH 'https://uptime.betterstack.com/api/v2/monitors/:monitor_id' \
--header 'Content-Type: application/json' \
--header "Authorization: Bearer $TOKEN" \
--data-raw '{
"maintenance_from": "01:00:00",
"maintenance_to": "03:00:00",
"maintenance_timezone": "Prague"
}'
**Want to pause all monitors, heartbeats, and integrations for the whole team?** Explore [the Team-wide maintenance](https://betterstack.com/docs/uptime/team-wide-maintenance/?utm_content=callout&utm_medium=docs-uptime&utm_source=community&utm_term=docs-pausing-monitors-and-maintenances)
instead.
**Want to only pause alerting for a single person?** Explore using [holiday mode](https://betterstack.com/docs/uptime/holiday-mode/?utm_content=callout&utm_medium=docs-uptime&utm_source=community&utm_term=docs-pausing-monitors-and-maintenances)
instead.
* * *
[Previous article\
\
Grouping and ordering monitors](https://betterstack.com/docs/uptime/grouping-and-ordering-monitors/)
[Next article\
\
Removing monitors](https://betterstack.com/docs/uptime/removing-monitors/)
###### On this page
* [Pausing monitors](https://betterstack.com/docs/uptime/pausing-monitors-and-maintenances/#pausing-monitors)
* [Scheduled maintenance window](https://betterstack.com/docs/uptime/pausing-monitors-and-maintenances/#scheduled-maintenance-window)
### Please accept cookies
We use cookies to authenticate users, improve the product user experience, and for [personalized ads](https://business.safety.google/privacy/)
. [Learn more.](https://betterstack.com/privacy)
Deny Accept required Accept all
---
# Remove a team member from team by ID | Better Stack Documentation
###### Explore documentation
* [Welcome to Uptime 👋](https://betterstack.com/docs/uptime/start/)
* [Frequently Asked Questions](https://betterstack.com/docs/uptime/frequently-asked-questions/)
* [On-call scheduling and alerting](https://betterstack.com/docs/uptime/api/team-members/delete/)
1. [Get started](https://betterstack.com/docs/uptime/getting-started-with-oncall-v2/)
2. [Slack and other integrations ↗](https://betterstack.com/docs/uptime/slack/)
3. [Connecting external calendars](https://betterstack.com/docs/uptime/connecting-external-calendars/)
4. [Advanced guide](https://betterstack.com/docs/uptime/escalation-policies/)
* [Incidents](https://betterstack.com/docs/uptime/api/team-members/delete/)
1. [Get started](https://betterstack.com/docs/uptime/working-with-incidents/)
2. [Advanced guide](https://betterstack.com/docs/uptime/post-mortems/)
3. [Reporting ↗](https://betterstack.com/docs/getting-started/team-and-account-management/reporting/)
* [Monitoring](https://betterstack.com/docs/uptime/api/team-members/delete/)
1. [Get started](https://betterstack.com/docs/uptime/monitoring-start/)
2. [Working with monitors](https://betterstack.com/docs/uptime/bulk-importing-monitors/)
3. [Customizing monitors](https://betterstack.com/docs/uptime/naming-monitors/)
4. [Monitor types](https://betterstack.com/docs/uptime/uptime-monitor/)
* [Status pages](https://betterstack.com/docs/uptime/api/team-members/delete/)
1. [Get started](https://betterstack.com/docs/uptime/getting-started-with-status-pages/)
2. [Advanced guide](https://betterstack.com/docs/uptime/custom-subdomain/)
* [Uptime API](https://betterstack.com/docs/uptime/api/team-members/delete/)
1. [Getting an API token](https://betterstack.com/docs/uptime/api/getting-started-with-uptime-api/)
2. [Monitors](https://betterstack.com/docs/uptime/api/list-all-existing-monitors/)
3. [Heartbeats](https://betterstack.com/docs/uptime/api/list-all-existing-hearbeats/)
4. [On-call & incidents](https://betterstack.com/docs/uptime/api/on-call-calendar/)
5. [Status pages](https://betterstack.com/docs/uptime/api/list-all-existing-status-pages/)
6. [Metadata](https://betterstack.com/docs/uptime/api/metadata/)
7. [Integrations](https://betterstack.com/docs/uptime/api/list-all-new-relic-integrations/)
8. [Team members](https://betterstack.com/docs/uptime/api/team-members/list/)
1. [List all team members GET](https://betterstack.com/docs/uptime/api/team-members/list/)
2. [Get a single team member GET](https://betterstack.com/docs/uptime/api/team-members/get/)
3. [Invite a team member POST](https://betterstack.com/docs/uptime/api/team-members/invite/)
4. [Remove a team member by ID DELETE](https://betterstack.com/docs/uptime/api/team-members/delete/)
5. [Remove a team member by e-mail DELETE](https://betterstack.com/docs/uptime/api/team-members/delete-by-email/)
Remove a team member from team by ID
====================================
Removes a member from the team by their ID. This action cannot be undone.
Removing a user with the `admin` role is not permitted via the API.
DELETE https://betterstack.com/api/v2/team-members/{id}
URL parameters
id
required string
The ID of the team member to remove.
Query parameters
team\_name
string
Required if using a [global API token](https://betterstack.com/docs/uptime/api/getting-started-with-uptime-api/#get-a-global-api-token)
to specify the team.
Headers
Authorization
required string
Bearer `$TOKEN`
204
The team member was successfully removed.
404
The team member with the specified ID was not found.
Response body
{
"errors": "Resource type user with id = 999 was not found"
}
403
Removing an admin is forbidden.
Response body
{
"errors": "Removing admins is not allowed via API"
}
#### Example cURL
Example
Copied!
curl --request DELETE \
--url "https://betterstack.com/api/v2/team-members/102" \
--header "Authorization: Bearer $TOKEN"
* * *
[Previous article\
\
Invite a team member](https://betterstack.com/docs/uptime/api/team-members/invite/)
[Next article\
\
Remove a team member from team by e-mail](https://betterstack.com/docs/uptime/api/team-members/delete-by-email/)
### Please accept cookies
We use cookies to authenticate users, improve the product user experience, and for [personalized ads](https://business.safety.google/privacy/)
. [Learn more.](https://betterstack.com/privacy)
Deny Accept required Accept all
---
# Alerts | Better Stack Documentation
###### Explore documentation
* [Welcome to Telemetry 👋](https://betterstack.com/docs/logs/start/)
* [Quick start guide](https://betterstack.com/docs/logs/logging-start/)
* [Wide events vs. metrics](https://betterstack.com/docs/logs/wide-events-time-series/)
* [Ingesting data](https://betterstack.com/docs/logs/dashboards/alerts/)
1. [Better Stack collector](https://betterstack.com/docs/logs/collector/)
2. [Vector](https://betterstack.com/docs/logs/vector/)
3. [OpenTelemetry](https://betterstack.com/docs/logs/open-telemetry/)
4. [Ingesting via HTTP API](https://betterstack.com/docs/logs/ingesting-data/http/logs/)
5. [Ingesting metrics](https://betterstack.com/docs/logs/ingesting-data/metrics/prometheus-scrape/)
6. [Ingesting logs](https://betterstack.com/docs/logs/ingesting-data/logs/docker-kubernetes/)
7. [Migrating to Better Stack](https://betterstack.com/docs/logs/datadog-agent/)
* [Using the product](https://betterstack.com/docs/logs/dashboards/alerts/)
1. [AI SRE ↗](https://betterstack.com/demos/ai-sre/)
2. [MCP server ↗](https://betterstack.com/docs/getting-started/integrations/mcp/)
3. [Transforming ingested data](https://betterstack.com/docs/logs/using-logtail/transforming-ingested-data/logs-vrl/)
4. [Querying data](https://betterstack.com/docs/logs/using-logtail/live-tail-query-language/)
5. [Tracing](https://betterstack.com/docs/logs/tracing/)
6. [Alerts](https://betterstack.com/docs/logs/dashboards/alerts/)
* [Telemetry API](https://betterstack.com/docs/logs/dashboards/alerts/)
1. [Getting an API token](https://betterstack.com/docs/logs/api/getting-started/)
2. [Sources & collectors](https://betterstack.com/docs/logs/api/list-all-existing-sources/)
3. [Dashboards](https://betterstack.com/docs/logs/api/dashboards/list/)
4. [Explorations](https://betterstack.com/docs/logs/api/explorations/list/)
5. [Alerts API](https://betterstack.com/docs/logs/api/alerts/list/)
6. [Connections API](https://betterstack.com/docs/logs/api/connections/list/)
7. [Query API ↗](https://betterstack.com/docs/logs/query-api/connect-remotely/)
* [Alternative to](https://betterstack.com/docs/logs/dashboards/alerts/)
1. [Lightstep](https://betterstack.com/docs/logs/alternative-to/lightstep/)
Alerts
======
Proactive monitoring is crucial. Detecting anomalies and responding quickly can prevent minor issues from escalating into major incidents. That's where our Alerting steps in.
Configurable Types of Alerts & Escalations
------------------------------------------
* **Threshold Alerts**: Perfect for scenarios where you need to be notified when a metric crosses a certain predefined threshold. For instance, if your application's response time goes beyond a set limit, it's time to get an alert.
* **Relative Alerts**: Want to monitor changes in metrics relative to their historical data? Whether it's an unexpected drop in sales, a surge in new user signups, or any other relative metric anomaly, we've got you covered.
* **Anomaly detection**: Use this alerting method if you're unsure about what threshold to set. It will notify you about any significant deviation from the predicted value of the series.
* **Escalation Targets**: Ensure that critical alerts reach the right teams or individuals. Whether it's your on-call engineer, a specific team, the escalation target guarantees your alerts land where they matter most.
Setting Up Alerts
-----------------
### Step 1: Create a Dashboard
* Go to **[Dashboards](https://telemetry.betterstack.com/team/0/dashboards)
** → click on **Create Dashboard**
### Step 2: Create a Chart

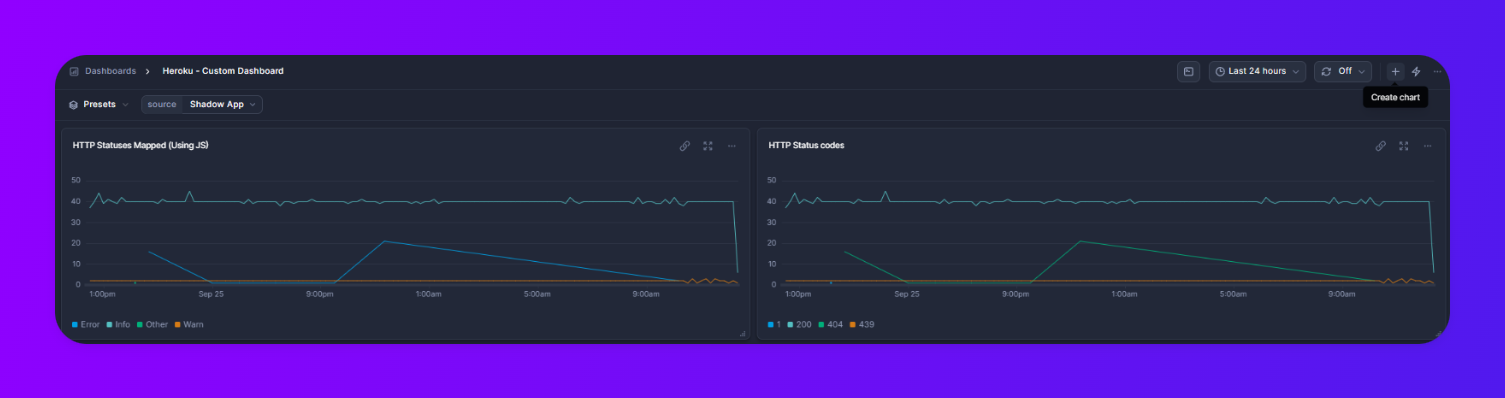
* In the top right corner, click on the **+** Button (Create Chart).
* Write a [Live Tail query](https://betterstack.com/docs/logs/using-logtail/live-tail-query-language/)
or an [SQL query](https://betterstack.com/docs/logs/dashboards/sql-queries/)
* Live Tail query only applies for the Live Tail chart type.
### Step 3: Create and Configure Alerts

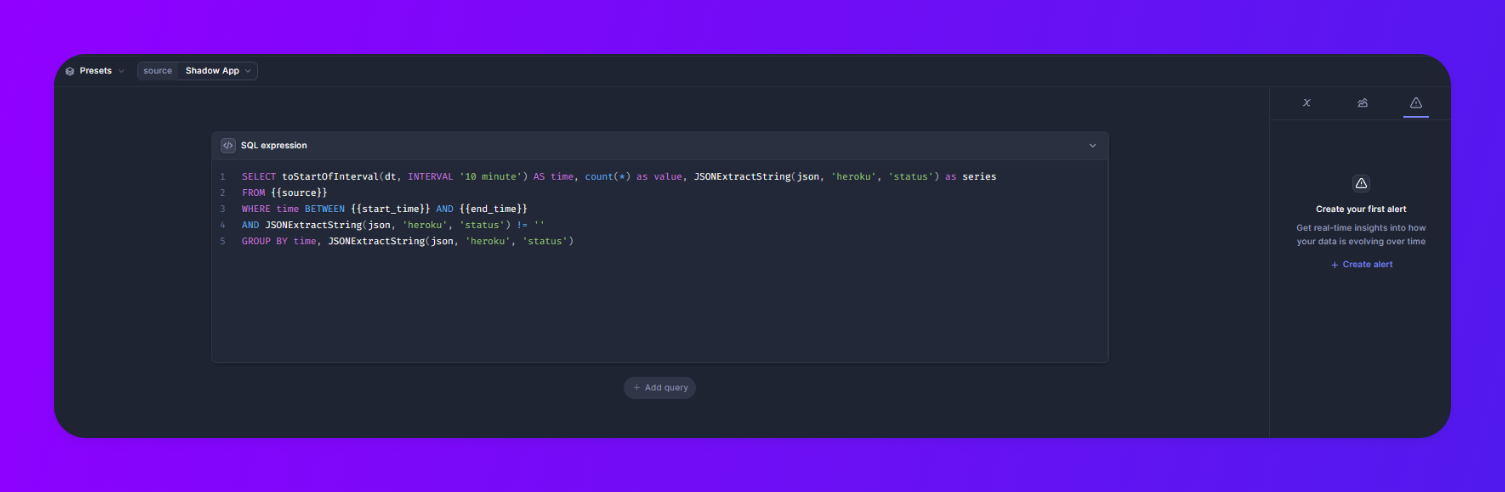
* On the right-side options, click on the **Triangle symbol** (Alerts).
* Choose **Threshold** or **Percentage** change.
* Define the alert condition.
### Step 4: Advanced Settings (Optional)
* Under **Advanced settings**, configure who should we alert.
* By default, an email will be sent.
* You can directly integrate [Better Stack Uptime](https://betterstack.com/uptime)
to enable Slack, MS Teams, or the Advanced escalation policies.
* Set the **Confirmation period**.
* By default, Confirmation period is set to “Immediate” and your alert is triggered immediately.
* Set the **Recovery period**.
* By default, Recovery period is set to “Immediate” and your alert is resolved immediately.
### Step 5: Save Chart
* Click on **Save chart**.
That's it! We will notify the team or escalate through the predefined channels whenever the conditions are met. 🎉
Managing Incidents
------------------
To provide a comprehensive solution, Better Stack Logs seamlessly integrates with [Better Stack Uptime](https://betterstack.com/uptime)
.
What are the main advantages?
1. **Automated Incident Creation**: No need to manually log incidents. Once an alert is triggered, an incident is automatically created in Better Stack Uptime, streamlining the issue-tracking process.
2. **Collaborative Problem Solving**: With all incident details available in one place, teams can collaborate more efficiently. They'll have immediate access to relevant data, logs, and timelines, aiding faster resolution.
3. **Integrated Communication Channels**: Ensure that all stakeholders, from developers to management, are kept in the loop. Better Stack Uptime's integrated communication tools keep everyone updated on incident status, reducing resolution time and enhancing transparency.
4. **Post-Incident Analysis**: After resolving an incident, use Uptime to conduct a thorough analysis and create a post-mortem. Understand root causes, identify areas for improvement, and ensure that similar issues are mitigated in the future.
* * *
[Previous article\
\
Distributed tracing with Better Stack](https://betterstack.com/docs/logs/tracing/)
[Next article\
\
Get started with Telemetry API](https://betterstack.com/docs/logs/api/getting-started/)
###### On this page
* [Configurable Types of Alerts & Escalations](https://betterstack.com/docs/logs/dashboards/alerts/#configurable-types-of-alerts-escalations)
* [Setting Up Alerts](https://betterstack.com/docs/logs/dashboards/alerts/#setting-up-alerts)
* [Managing Incidents](https://betterstack.com/docs/logs/dashboards/alerts/#managing-incidents)
### Please accept cookies
We use cookies to authenticate users, improve the product user experience, and for [personalized ads](https://business.safety.google/privacy/)
. [Learn more.](https://betterstack.com/privacy)
Deny Accept required Accept all
---
# Heartbeats (Cron monitoring) | Demos
###### Explore documentation
* [Explore demos 👋](https://betterstack.com/demos/welcome/)
* [AI SRE & MCP server](https://betterstack.com/demos/ai-sre-and-mcp-server/)
* [Uptime](https://betterstack.com/demos/uptime/heartbeats/)
1. [Incidents](https://betterstack.com/demos/incident-management/)
2. [On-call and escalations](https://betterstack.com/demos/on-call/)
3. [Monitors](https://betterstack.com/demos/monitoring/)
4. [Heartbeats](https://betterstack.com/demos/uptime/heartbeats/)
5. [Status pages](https://betterstack.com/demos/status-page/)
6. [Integrations](https://betterstack.com/demos/uptime/integrations/)
7. [Reporting](https://betterstack.com/demos/reporting/)
8. [API and Terraform](https://betterstack.com/demos/uptime-api/)
* [Telemetry](https://betterstack.com/demos/uptime/heartbeats/)
1. [Sources](https://betterstack.com/demos/services/)
2. [Live tail](https://betterstack.com/demos/live-tail/)
3. [Events](https://betterstack.com/demos/logs/explore/)
4. [Metrics](https://betterstack.com/demos/metrics/)
5. [Alerts](https://betterstack.com/demos/logs/alerts/)
6. [AI SRE ↗](https://betterstack.com/demos/ai-sre-and-mcp-server/)
* [Errors](https://betterstack.com/demos/errors/)
1. [Error tracking](https://betterstack.com/demos/errors-intro/)
* [Warehouse](https://betterstack.com/demos/uptime/heartbeats/)
1. [Sources](https://betterstack.com/demos/warehouse-data/)
2. [Queries as APIs](https://betterstack.com/demos/warehouse-queries/)
3. [Ad-hoc SQL API](https://betterstack.com/demos/warehouse/ad-hoc-sql-api/)
* [Other](https://betterstack.com/demos/uptime/heartbeats/)
1. [Organization and teams](https://betterstack.com/demos/organisation-management/)
Heartbeats (Cron monitoring)
============================
See how to monitor scheduled jobs such as database backups and get alerted when they don't run correctly.
### Related resources
* [Docs: Cron and heartbeat monitor](https://betterstack.com/docs/uptime/cron-and-heartbeat-monitor/)
* * *
[Previous article\
\
Monitors](https://betterstack.com/demos/monitoring/)
[Next article\
\
Status pages](https://betterstack.com/demos/status-page/)
### Please accept cookies
We use cookies to authenticate users, improve the product user experience, and for [personalized ads](https://business.safety.google/privacy/)
. [Learn more.](https://betterstack.com/privacy)
Deny Accept required Accept all
---
# Acknowledge an incident | Better Stack Documentation
###### Explore documentation
* [Welcome 👋](https://betterstack.com/docs/getting-started/welcome/)
* [Product](https://betterstack.com/docs/uptime/jira/better-uptime/acknowledge/)
1. [Tracing ↗](https://betterstack.com/docs/logs/tracing/)
2. [Incident management ↗](https://betterstack.com/docs/uptime/working-with-incidents/)
3. [Uptime monitoring ↗](https://betterstack.com/docs/uptime/monitoring-start/)
4. [Log management ↗](https://betterstack.com/docs/logs/logging-start/)
5. [Infrastructure monitoring ↗](https://betterstack.com/docs/logs/dashboards/getting-started/)
6. [Status page ↗](https://betterstack.com/docs/uptime/getting-started-with-status-pages/)
7. [Error tracking ↗](https://betterstack.com/docs/errors/start/)
8. [Warehouse ↗](https://betterstack.com/docs/warehouse/start/)
* [Integrations](https://betterstack.com/docs/uptime/jira/better-uptime/acknowledge/)
1. [Integrating with Better Stack](https://betterstack.com/docs/uptime/slack/)
1. [Slack](https://betterstack.com/docs/uptime/slack/)
2. [Microsoft Teams](https://betterstack.com/docs/uptime/microsoft-teams/)
3. [On-call routing number](https://betterstack.com/docs/uptime/on-call-routing-number/)
4. [Datadog](https://betterstack.com/docs/uptime/datadog/)
5. [New Relic](https://betterstack.com/docs/uptime/new-relic/)
6. [Prometheus](https://betterstack.com/docs/uptime/prometheus/)
7. [Grafana](https://betterstack.com/docs/uptime/grafana/)
8. [Zabbix](https://betterstack.com/docs/uptime/zabbix/)
9. [Intercom](https://betterstack.com/docs/uptime/integrations/integrating-with-better-uptime/intercom/)
10. [AWS CloudWatch](https://betterstack.com/docs/uptime/aws-cloudwatch/)
11. [Google Cloud](https://betterstack.com/docs/uptime/google-cloud/)
12. [Outgoing webhooks](https://betterstack.com/docs/uptime/webhooks/)
13. [Incoming webhooks](https://betterstack.com/docs/uptime/incoming-webhooks/)
14. [Incoming e-mails](https://betterstack.com/docs/uptime/integrating-with-better-uptime/incoming-emails/)
15. [Jira](https://betterstack.com/docs/uptime/jira/better-uptime-to-jira/)
1. [Jira to Better Stack](https://betterstack.com/docs/uptime/jira/better-uptime/create/)
1. [Create an incident](https://betterstack.com/docs/uptime/jira/better-uptime/create/)
2. [Acknowledge an incident](https://betterstack.com/docs/uptime/jira/better-uptime/acknowledge/)
3. [Resolve an incident](https://betterstack.com/docs/uptime/jira/better-uptime/resolve/)
2. [Better Stack to Jira](https://betterstack.com/docs/uptime/jira/better-uptime-to-jira/)
16. [Zapier](https://betterstack.com/docs/uptime/zapier/)
2. [iOS & Android](https://betterstack.com/docs/uptime/ios-and-android-mobile-apps/)
3. [SSO providers](https://betterstack.com/docs/uptime/integrating-with-better-uptime/aws-sso/)
4. [Terraform](https://betterstack.com/docs/getting-started/integrations/terraform/)
5. [MCP server](https://betterstack.com/docs/getting-started/integrations/mcp/)
* [Team and account management](https://betterstack.com/docs/uptime/jira/better-uptime/acknowledge/)
1. [Team management](https://betterstack.com/docs/uptime/creating-a-new-team/)
2. [Account settings](https://betterstack.com/docs/uptime/phone-number/)
3. [Reporting](https://betterstack.com/docs/getting-started/team-and-account-management/reporting/)
4. [Audit logs](https://betterstack.com/docs/uptime/audit-logs/)
* [Design](https://betterstack.com/docs/uptime/jira/better-uptime/acknowledge/)
1. [Brand guidelines](https://betterstack.com/docs/brand/)
Acknowledge an incident
=======================
Automatically acknowledge Uptime incidents created in Jira by using our [Incidents API](https://betterstack.com/docs/uptime/api/getting-started-with-uptime-api/)
and [Jira Automation](https://www.atlassian.com/software/jira/guides/expand-jira/automation)
.
Custom fields required in Jira
------------------------------
This integration requires the custom field `incident_id`. For details, see the [Create an incident in Uptime from Jira](https://betterstack.com/docs/uptime/jira/better-uptime/create/?utm_content=callout&utm_medium=docs-getting-started&utm_source=community&utm_term=docs-jira-to-better-uptime-acknowledge)
guide.
Setting up the Jira automation rule
-----------------------------------
1. In your Jira project, go to **Project Settings** → **Automation**.
To apply this to all your projects, go to **Global administration** and create a global rule.
2. Click **Create rule**.
3. Select the **Issue transitioned** trigger.
4. For **To status**, enter `In Progress`, then click **Save**.

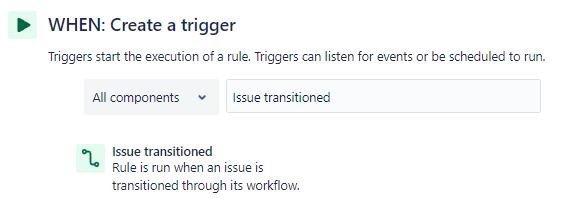

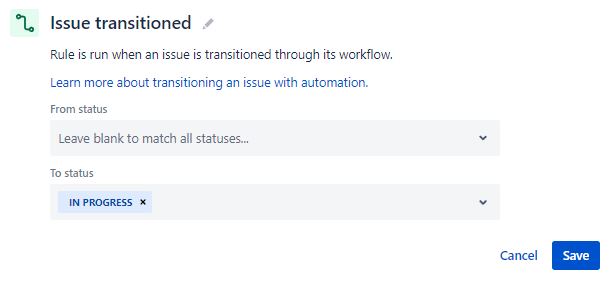
5. Add an `IF` condition. Choose the `incident_id` field and set the condition to `is not empty`. This ensures the rule only runs for tickets connected to Uptime incidents.
6. Add a `THEN` action and select **Send web request**.

7. Configure the web request:
**Web request URL**: `https://uptime.betterstack.com/api/v2/incidents/{{incident_id}}/acknowledge`
**Headers**: `Authorization: Bearer $TOKEN`
**HTTP method**: `POST`
**Web request body**: `Custom data`
**Custom data**: `{"acknowledged_by": "{{assignee.displayName}}"}`
### Don't have an API token yet?
See our guide on [obtaining an API token](https://betterstack.com/docs/uptime/api/getting-started-with-uptime-api/?utm_content=callout&utm_medium=docs-getting-started&utm_source=community&utm_term=docs-jira-to-better-uptime-acknowledge)
.

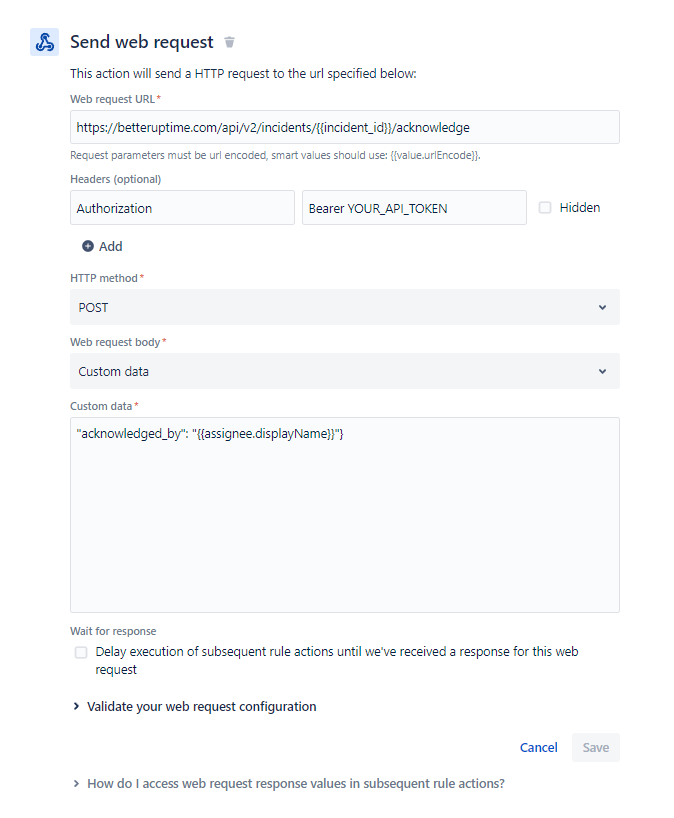
8. (Optional) Add another `THEN` action to **Comment on issue**. For example: `The incident has been acknowledged by {{assignee.displayName}}.`

That's all. 🎉
--------------
From now on, when a Jira issue is moved to "In Progress", the corresponding Uptime incident will be acknowledged.
### Need help with the Jira integration?
Please message us at **[hello@betterstack.com](mailto:hello@betterstack.com)
**. We will help you with all the necessary configurations.
* * *
[Previous article\
\
Create an incident](https://betterstack.com/docs/uptime/jira/better-uptime/create/)
[Next article\
\
Resolve an incident](https://betterstack.com/docs/uptime/jira/better-uptime/resolve/)
###### On this page
* [Setting up the Jira automation rule](https://betterstack.com/docs/uptime/jira/better-uptime/acknowledge/#setting-up-the-jira-automation-rule)
### Please accept cookies
We use cookies to authenticate users, improve the product user experience, and for [personalized ads](https://business.safety.google/privacy/)
. [Learn more.](https://betterstack.com/privacy)
Deny Accept required Accept all
---
# Remove an application | Better Stack Documentation
###### Explore documentation
* [Welcome to Errors 👋](https://betterstack.com/docs/errors/start/)
1. [JavaScript tag](https://betterstack.com/docs/errors/js-tag/start/)
* [Collecting errors](https://betterstack.com/docs/errors/api/applications/delete/)
1. [Integrating using an AI prompt](https://betterstack.com/docs/errors/collecting-errors/ai-prompt/)
2. [Sentry SDK](https://betterstack.com/docs/errors/collecting-errors/sentry-sdk/)
* [Using the product](https://betterstack.com/docs/errors/api/applications/delete/)
1. [Exception grouping](https://betterstack.com/docs/errors/using-the-product/exception-grouping/)
2. [Fix with AI](https://betterstack.com/docs/errors/using-the-product/fix-with-ai/)
3. [Releases](https://betterstack.com/docs/errors/using-the-product/releases/)
4. [Uploading source maps](https://betterstack.com/docs/errors/collecting-errors/upload-source-maps/)
* [Integrations](https://betterstack.com/docs/errors/api/applications/delete/)
1. [Reporting incidents](https://betterstack.com/docs/errors/integrations/creating-incidents/)
2. [Slack](https://betterstack.com/docs/errors/integrations/slack/)
3. [Microsoft Teams](https://betterstack.com/docs/errors/integrations/ms-teams/)
4. [Linear](https://betterstack.com/docs/errors/integrations/linear/)
5. [Jira](https://betterstack.com/docs/errors/integrations/jira/)
6. [GitHub](https://betterstack.com/docs/errors/integrations/github/)
* [Errors API](https://betterstack.com/docs/errors/api/applications/delete/)
1. [Getting an API token](https://betterstack.com/docs/errors/api/getting-api-token/)
2. [Applications API](https://betterstack.com/docs/errors/api/applications/list/)
1. [List all applications GET](https://betterstack.com/docs/errors/api/applications/list/)
2. [Get a single application GET](https://betterstack.com/docs/errors/api/applications/get/)
3. [Create an application POST](https://betterstack.com/docs/errors/api/applications/create/)
4. [Update an application PATCH](https://betterstack.com/docs/errors/api/applications/update/)
5. [Remove an application DELETE](https://betterstack.com/docs/errors/api/applications/delete/)
3. [Application groups API](https://betterstack.com/docs/errors/api/applications-groups/list/)
Remove an application
=====================
Deletes an existing error tracking application.
DELETE https://errors.betterstack.com/api/v1/applications/{id}
URL parameters
id
required string
The ID of the application to delete.
Headers
Authorization
required string
Bearer `$TOKEN`
204
No Content
401
Unauthorized
Response body
{
"errors": "Invalid authentication"
}
404
Not Found
Response body
{
"errors": "Resource with the provided ID was not found"
}
#### Example cURL
Example
Copied!
curl --request DELETE \
--url https://errors.betterstack.com/api/v1/applications/1234 \
--header "Authorization: Bearer $TOKEN"
* * *
[Previous article\
\
Update an application](https://betterstack.com/docs/errors/api/applications/update/)
[Next article\
\
List all groups](https://betterstack.com/docs/errors/api/applications-groups/list/)
### Please accept cookies
We use cookies to authenticate users, improve the product user experience, and for [personalized ads](https://business.safety.google/privacy/)
. [Learn more.](https://betterstack.com/privacy)
Deny Accept required Accept all
---
# Sentry SDK | Better Stack Documentation
###### Explore documentation
* [Welcome to Errors 👋](https://betterstack.com/docs/errors/start/)
1. [JavaScript tag](https://betterstack.com/docs/errors/js-tag/start/)
* [Collecting errors](https://betterstack.com/docs/errors/collecting-errors/sentry-sdk/)
1. [Integrating using an AI prompt](https://betterstack.com/docs/errors/collecting-errors/ai-prompt/)
2. [Sentry SDK](https://betterstack.com/docs/errors/collecting-errors/sentry-sdk/)
* [Using the product](https://betterstack.com/docs/errors/collecting-errors/sentry-sdk/)
1. [Exception grouping](https://betterstack.com/docs/errors/using-the-product/exception-grouping/)
2. [Fix with AI](https://betterstack.com/docs/errors/using-the-product/fix-with-ai/)
3. [Releases](https://betterstack.com/docs/errors/using-the-product/releases/)
4. [Uploading source maps](https://betterstack.com/docs/errors/collecting-errors/upload-source-maps/)
* [Integrations](https://betterstack.com/docs/errors/collecting-errors/sentry-sdk/)
1. [Reporting incidents](https://betterstack.com/docs/errors/integrations/creating-incidents/)
2. [Slack](https://betterstack.com/docs/errors/integrations/slack/)
3. [Microsoft Teams](https://betterstack.com/docs/errors/integrations/ms-teams/)
4. [Linear](https://betterstack.com/docs/errors/integrations/linear/)
5. [Jira](https://betterstack.com/docs/errors/integrations/jira/)
6. [GitHub](https://betterstack.com/docs/errors/integrations/github/)
* [Errors API](https://betterstack.com/docs/errors/collecting-errors/sentry-sdk/)
1. [Getting an API token](https://betterstack.com/docs/errors/api/getting-api-token/)
2. [Applications API](https://betterstack.com/docs/errors/api/applications/list/)
3. [Application groups API](https://betterstack.com/docs/errors/api/applications-groups/list/)
Sentry SDK
==========
You can collect errors by integrating your [Sentry SDK](https://docs.sentry.io/platforms/)
with Better Stack. This allows you to **leverage your existing Sentry setup** to send errors to our platform for centralized management and analysis.
#### Using Claude Code or similar agentic dev-tool?
The easiest way to integate is to use the [Integrate with AI](https://betterstack.com/docs/errors/collecting-errors/ai-prompt/?utm_content=callout&utm_medium=docs-errors&utm_source=community&utm_term=docs-errors-collecting-errors-sentry-sdk)
prompt.
To configure Sentry SDK integration:
1. Navigate to **Errors** -> [Applications](https://errors.betterstack.com/team/t0/applications/)
.
2. Select your application.
3. Go to the **Data ingestion** tab.
4. Copy **Application token** and **Ingesting host** to be used in Sentry SDK.
Using the Sentry SDK
--------------------
To send errors to Better Stack, configure your Sentry SDK according to the **Data ingestion** tab for your application:
Sentry DSN configuration
Copied!
https://$APPLICATION_TOKEN@$INGESTING_HOST/1
The project ID at the end of the DSN (`/1`) is required by Sentry SDKs but is ignored by our ingestion endpoint. You can use any number.
Here are a few examples for popular Sentry SDKs:
Python Node.js Browser (JS) Ruby PHP Go
Copied!
import sentry_sdk
sentry_sdk.init(
dsn="https://$APPLICATION_TOKEN@$INGESTING_HOST/1",
# Set traces_sample_rate to 1.0 to capture 100%
# of transactions for performance monitoring.
traces_sample_rate=1.0,
)
# Example of capturing an exception
try:
1 / 0
except ZeroDivisionError as e:
sentry_sdk.capture_exception(e)
const Sentry = require("@sentry/node");
// Or, for ES6+
// import * as Sentry from "@sentry/node";
Sentry.init({
dsn: "https://$APPLICATION_TOKEN@$INGESTING_HOST/1",
// Set tracesSampleRate to 1.0 to capture 100%
// of transactions for performance monitoring.
tracesSampleRate: 1.0,
});
// Example of capturing an exception
try {
throw new Error("This is a test error from Node.js!");
} catch (e) {
Sentry.captureException(e);
}
import * as Sentry from "@sentry/browser";
Sentry.init({
dsn: "https://$APPLICATION_TOKEN@$INGESTING_HOST/1",
// To capture performance monitoring data,
// you must set tracesSampleRate
tracesSampleRate: 1.0,
});
// Example of capturing an exception
try {
throw new Error("This is a test error from the browser!");
} catch (e) {
Sentry.captureException(e);
}
require 'sentry-ruby'
Sentry.init do |config|
config.dsn = 'https://$APPLICATION_TOKEN@$INGESTING_HOST/1'
config.breadcrumbs_logger = [:active_support_logger, :http_logger]
# To activate performance monitoring, set one of these options.
# We recommend adjusting the value in production:
config.traces_sample_rate = 1.0
end
# Example of capturing an exception
begin
1 / 0
rescue ZeroDivisionError => exception
Sentry.capture_exception(exception)
end
use function Sentry\init;
use function Sentry\captureException;
// Assumes you have the Sentry SDK installed via Composer
require 'vendor/autoload.php';
init(['dsn' => 'https://$APPLICATION_TOKEN@$INGESTING_HOST/1' ]);
// Example of capturing an exception
try {
throw new \Exception("This is a test error from PHP!");
} catch (\Exception $e) {
captureException($e);
}
package main
import (
"errors"
"log"
"time"
"github.com/getsentry/sentry-go"
)
func main() {
err := sentry.Init(sentry.ClientOptions{
Dsn: "https://$APPLICATION_TOKEN@$INGESTING_HOST/1",
// Set TracesSampleRate to 1.0 to capture 100%
// of transactions for performance monitoring.
TracesSampleRate: 1.0,
})
if err != nil {
log.Fatalf("sentry.Init: %s", err)
}
// Flush buffered events before the program terminates.
defer sentry.Flush(2 * time.Second)
// Example of capturing an exception
sentry.CaptureException(errors.New("This is a test error from Go!"))
}
Using a different platform?
---------------------------
* Read the [official Sentry SDK documentation](https://docs.sentry.io/)
.
* Make sure to **change the DSN** to send the data to Better Stack.
Supported Sentry SDK versions
-----------------------------
The Sentry SDK versions listed below are the minimum supported. If you're using an older version, please upgrade before sending data to Better Stack.
| Platform | Minimum Version |
| --- | --- |
| JavaScript | 7.0.0 |
| Python | 2.0.0 |
| Ruby | 4.0.0 |
| Java/Android | 3.0.0 |
| Cocoa (iOS/macOS) | 6.0.0 |
| .NET | 3.0.0 |
| PHP | 4.0.0 |
| Go | 0.1.0 |
| React Native | 3.0.0 |
See the error in Better Stack
-----------------------------
After running the script, you should see your first report in [Errors](https://errors.betterstack.com/0/errors)
🚀

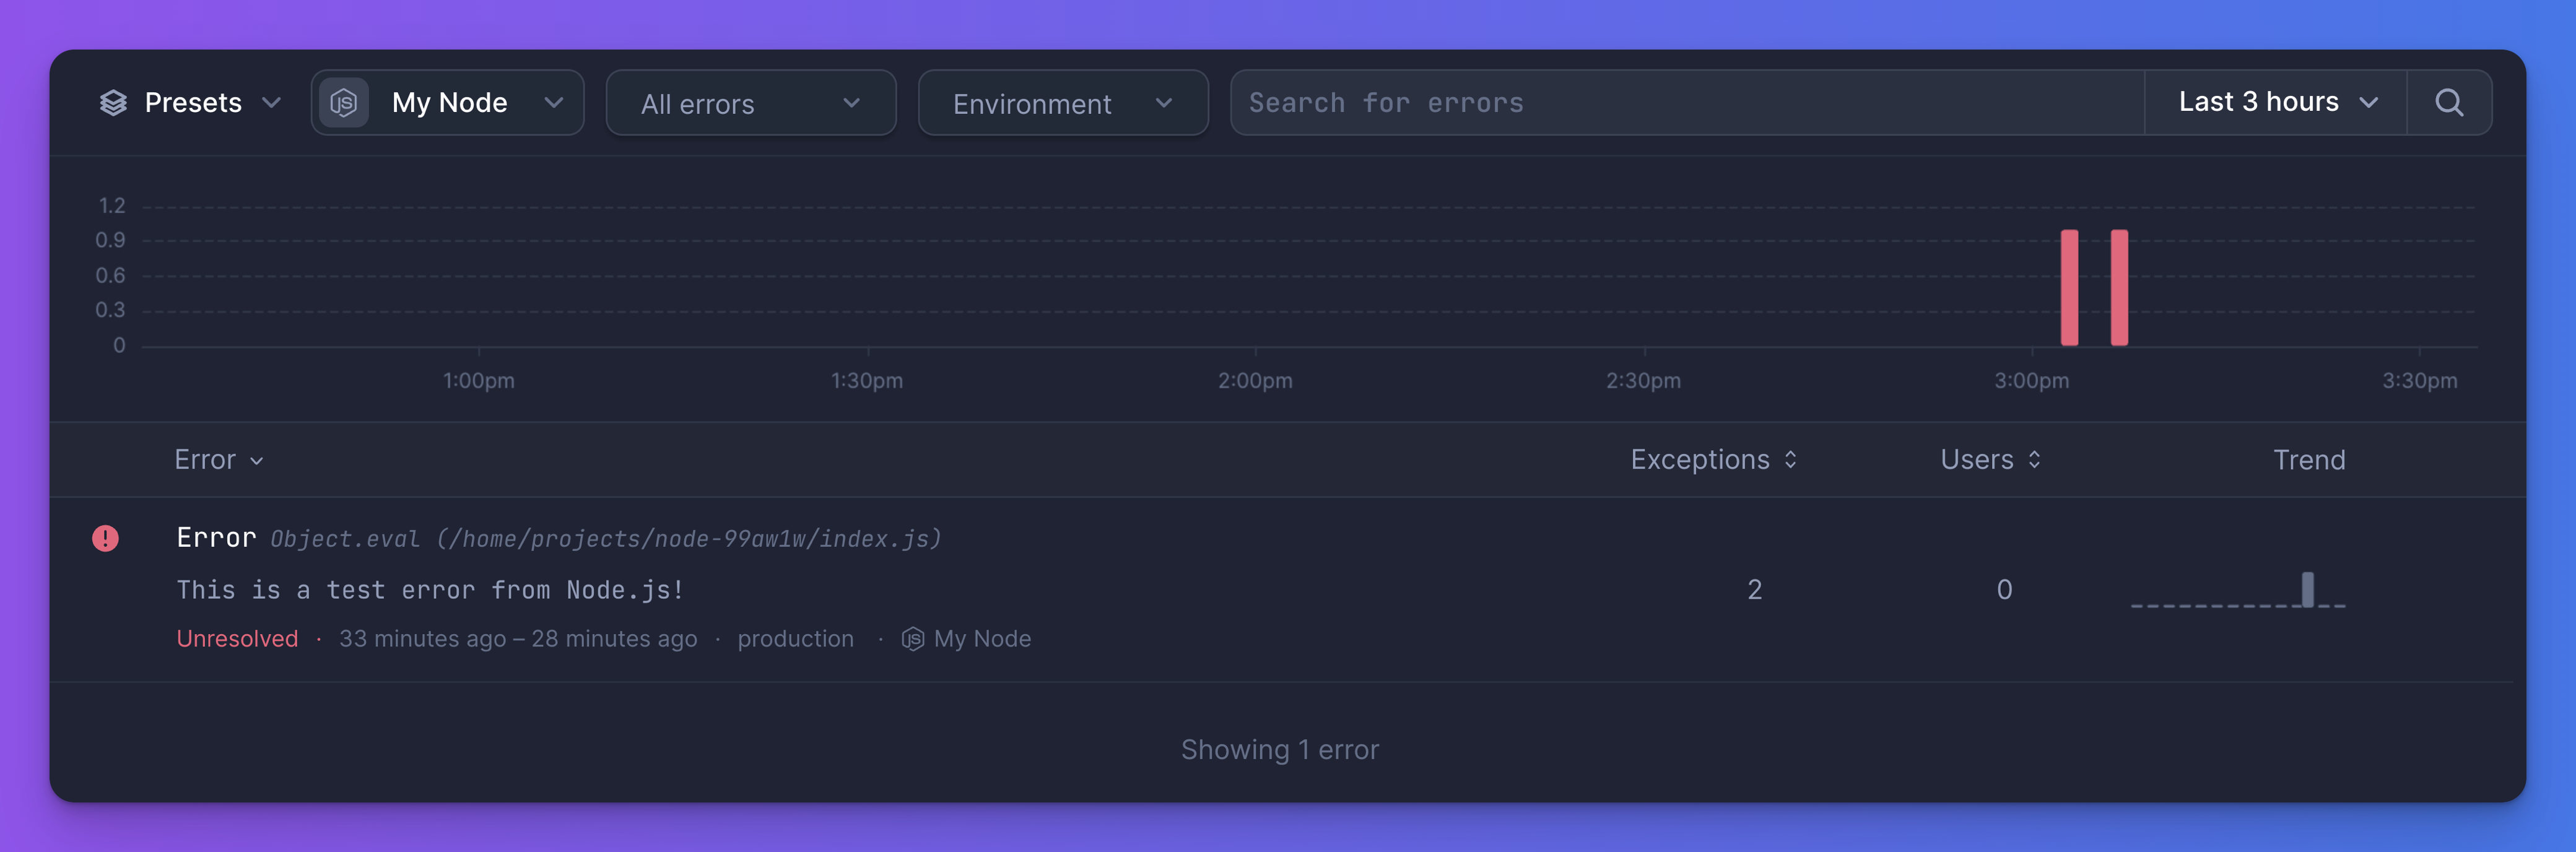
* * *
[Previous article\
\
Integrating using an AI prompt](https://betterstack.com/docs/errors/collecting-errors/ai-prompt/)
[Next article\
\
Exception grouping](https://betterstack.com/docs/errors/using-the-product/exception-grouping/)
###### On this page
* [Using the Sentry SDK](https://betterstack.com/docs/errors/collecting-errors/sentry-sdk/#using-the-sentry-sdk)
* [Using a different platform?](https://betterstack.com/docs/errors/collecting-errors/sentry-sdk/#using-a-different-platform)
* [Supported Sentry SDK versions](https://betterstack.com/docs/errors/collecting-errors/sentry-sdk/#supported-sentry-sdk-versions)
* [See the error in Better Stack](https://betterstack.com/docs/errors/collecting-errors/sentry-sdk/#see-the-error-in-better-stack)
### Please accept cookies
We use cookies to authenticate users, improve the product user experience, and for [personalized ads](https://business.safety.google/privacy/)
. [Learn more.](https://betterstack.com/privacy)
Deny Accept required Accept all
---
# Ready-made dashboards | Better Stack
Ready-made dashboards
=====================
Get a plug-and-play dashboard to visualize your logs and metrics.
/
[Apache](https://betterstack.com/dashboards/apache)
[AWS](https://betterstack.com/dashboards/aws-ec2)
[GCP](https://betterstack.com/dashboards/gcp-compute-engine)
[Cloudflare](https://betterstack.com/dashboards/cloudflare)
[Collector](https://betterstack.com/dashboards/collector)
[Datadog](https://betterstack.com/dashboards/datadog)
[Docker](https://betterstack.com/dashboards/docker)
[HAProxy](https://betterstack.com/dashboards/haproxy)
[Heroku](https://betterstack.com/dashboards/heroku)
[Kubernetes](https://betterstack.com/dashboards/kubernetes)
[Nginx](https://betterstack.com/dashboards/nginx)
[OpenTelemetry](https://betterstack.com/dashboards/tracing-open-telemetry)
[Prometheus](https://betterstack.com/dashboards/prometheus)
[Ruby](https://betterstack.com/dashboards/ruby)
[Vercel](https://betterstack.com/dashboards/vercel)
[Traefik](https://betterstack.com/dashboards/traefik)
[RabbitMQ](https://betterstack.com/dashboards/rabbitmq)
[Redis](https://betterstack.com/dashboards/redis)
[PostgreSQL](https://betterstack.com/dashboards/postgresql)
[MySQL](https://betterstack.com/dashboards/mysql)
[Elasticsearch](https://betterstack.com/dashboards/elasticsearch)
[Vector](https://betterstack.com/dashboards/vector)
[MinIO](https://betterstack.com/dashboards/minio)
[Host monitoring](https://betterstack.com/dashboards/host-overview)
[Kafka](https://betterstack.com/dashboards/kafka)
[Memcached](https://betterstack.com/dashboards/memcached)
[Service monitoring](https://betterstack.com/dashboards/services)
[Website analytics](https://betterstack.com/dashboards/website-analytics)
[Web vitals](https://betterstack.com/dashboards/web-vitals)
[\
\
### Apache\
\
Open-source HTTP server and load balancer.](https://betterstack.com/dashboards/apache)
[\
\
### AWS EC2\
\
Scalable virtual server instances in the AWS cloud.](https://betterstack.com/dashboards/aws-ec2)
[\
\
### AWS SNS & SQS\
\
Managed messaging and queuing services for decoupled architectures.](https://betterstack.com/dashboards/aws-sns-sqs)
[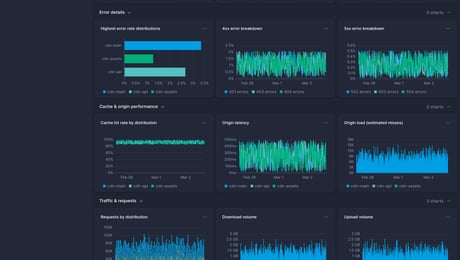\
\
### AWS CloudFront\
\
Content delivery network for low-latency global distribution.](https://betterstack.com/dashboards/aws-cloudfront)
[\
\
### AWS ElastiCache Memcached\
\
Managed in-memory Memcached-compatible caching service.](https://betterstack.com/dashboards/aws-elasticache-memcached)
[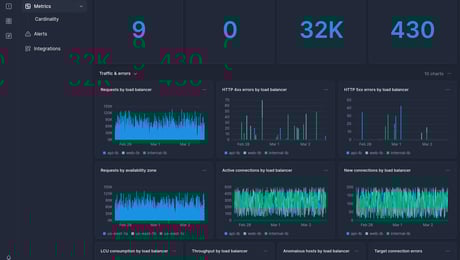\
\
### AWS ELB\
\
Managed load balancer for distributing traffic across targets.](https://betterstack.com/dashboards/aws-elb)
[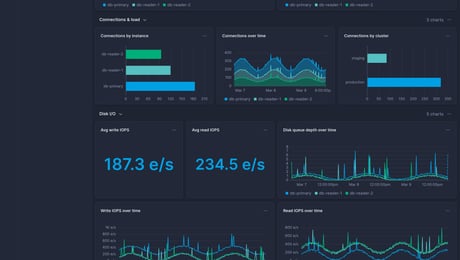\
\
### AWS RDS MySQL\
\
Managed MySQL-compatible relational database on AWS.](https://betterstack.com/dashboards/aws-rds-mysql)
[\
\
### AWS Lambda\
\
Serverless compute service that runs code in response to events.](https://betterstack.com/dashboards/aws-lambda)
[\
\
### AWS RDS PostgreSQL\
\
Managed PostgreSQL-compatible relational database on AWS.](https://betterstack.com/dashboards/aws-rds-postgresql)
[\
\
### AWS DynamoDB\
\
Fully managed NoSQL key-value and document database.](https://betterstack.com/dashboards/aws-dynamodb)
[\
\
### AWS ElastiCache Redis\
\
Managed in-memory Redis-compatible cache and data store.](https://betterstack.com/dashboards/aws-elasticache-redis)
[\
\
### AWS RDS Aurora PostgreSQL\
\
High-performance PostgreSQL-compatible database with Aurora engine.](https://betterstack.com/dashboards/aws-rds-aurora-postgresql)
[\
\
### AWS ECS\
\
Container orchestration service on AWS.](https://betterstack.com/dashboards/aws-ecs)
[\
\
### AWS S3\
\
Scalable object storage for data of any size.](https://betterstack.com/dashboards/aws-s3)
[\
\
### AWS RDS Enhanced Monitoring\
\
OS-level metrics for RDS instances at per-second granularity.](https://betterstack.com/dashboards/aws-rds-enhanced-monitoring)
[\
\
### GCP Compute Engine\
\
Scalable virtual machine instances on Google Cloud.](https://betterstack.com/dashboards/gcp-compute-engine)
[\
\
### GCP Cloud Run\
\
Fully managed serverless container platform on Google Cloud.](https://betterstack.com/dashboards/gcp-cloud-run)
[\
\
### GCP Cloud Functions\
\
Event-driven serverless functions for lightweight workloads.](https://betterstack.com/dashboards/gcp-cloud-functions)
[\
\
### GCP Cloud SQL\
\
Managed MySQL and PostgreSQL relational databases on Google Cloud.](https://betterstack.com/dashboards/gcp-cloud-sql)
[\
\
### GCP Cloud Storage\
\
Scalable object storage for data of any size.](https://betterstack.com/dashboards/gcp-cloud-storage)
[\
\
### GCP BigQuery\
\
Serverless data warehouse for analytics at any scale.](https://betterstack.com/dashboards/gcp-bigquery)
[\
\
### GCP Pub/Sub\
\
Managed messaging and event streaming for decoupled architectures.](https://betterstack.com/dashboards/gcp-pubsub)
[\
\
### GCP Load Balancing\
\
Global and regional load balancing for HTTP(S) and TCP/UDP traffic.](https://betterstack.com/dashboards/gcp-load-balancing)
[\
\
### GCP Cloud Spanner\
\
Globally distributed, horizontally scalable relational database.](https://betterstack.com/dashboards/gcp-cloud-spanner)
[\
\
### Cloudflare Worker Trace Events\
\
Serverless execution at Cloudflare's edge. Uses worker\_trace\_events Logpush dataset](https://betterstack.com/dashboards/cloudflare)
[\
\
### Cloudflare HTTP Requests\
\
HTTP requests processed by Cloudflare. Uses http\_requests Logpush dataset.](https://betterstack.com/dashboards/cloudflare-logpush-http-requests)
[\
\
### Cloudflare HTTP Requests\
\
Use custom Cloudflare Worker code to log HTTP requests.](https://betterstack.com/dashboards/cloudflare-worker)
[\
\
### Cloudflare Prometheus Exporter\
\
Monitor Cloudflare metrics exported via Prometheus exporter.](https://betterstack.com/dashboards/cloudflare-prometheus-exporter)
[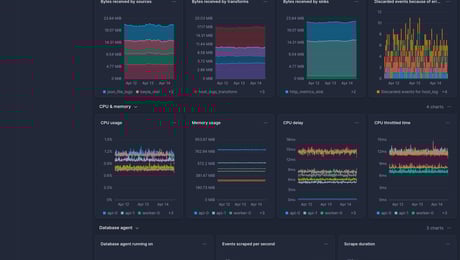\
\
### Better Stack Collector\
\
Monitor operations of the Better Stack collector.](https://betterstack.com/dashboards/collector)
[\
\
### Host (Datadog)\
\
Monitor your server with Datadog agent.](https://betterstack.com/dashboards/datadog)
[\
\
### Docker\
\
Platform for containerized applications.](https://betterstack.com/dashboards/docker)
[\
\
### HAProxy\
\
Load balancer for TCP and HTTP.](https://betterstack.com/dashboards/haproxy)
[\
\
### Heroku\
\
Cloud PaaS for easy app deployment.](https://betterstack.com/dashboards/heroku)
[\
\
### Kubernetes\
\
Container orchestration platform.](https://betterstack.com/dashboards/kubernetes)
[\
\
### Nginx\
\
Web server, reverse proxy, and load balancer.](https://betterstack.com/dashboards/nginx)
[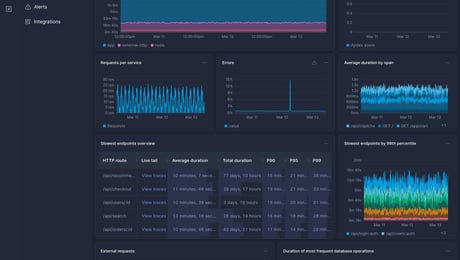\
\
### Tracing\
\
Monitor performance of your services based on OpenTelemetry traces.](https://betterstack.com/dashboards/tracing-open-telemetry)
[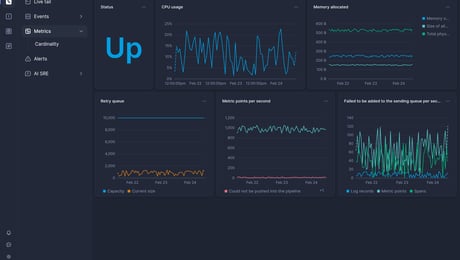\
\
### OpenTelemetry collector\
\
Monitor operations of OpenTelemetry collector.](https://betterstack.com/dashboards/open-telemetry)
[\
\
### Host (Prometheus)\
\
Monitor your server with Prometheus Node Exporter.](https://betterstack.com/dashboards/prometheus)
[\
\
### Ruby on Rails\
\
Ruby web application framework.](https://betterstack.com/dashboards/ruby)
[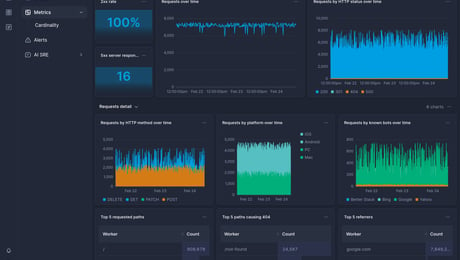\
\
### Vercel\
\
Jamstack hosting with Git integration.](https://betterstack.com/dashboards/vercel)
[\
\
### Traefik\
\
Open-source reverse proxy and load balancer for HTTP and TCP-based applications.](https://betterstack.com/dashboards/traefik)
[\
\
### RabbitMQ\
\
Open-source message broker for complex message routing between systems.](https://betterstack.com/dashboards/rabbitmq)
[\
\
### Redis\
\
Open-source in-memory key-value database and cache with durability.](https://betterstack.com/dashboards/redis)
[\
\
### PostgreSQL\
\
Relational database management system emphasizing extensibility and SQL compliance.](https://betterstack.com/dashboards/postgresql)
[\
\
### MySQL\
\
Open-source relational database management system.](https://betterstack.com/dashboards/mysql)
[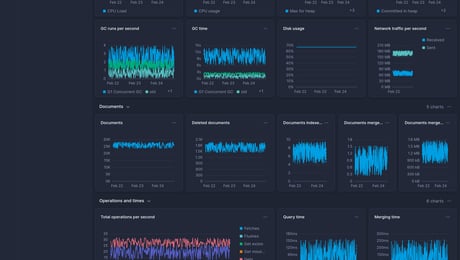\
\
### Elasticsearch\
\
Scalable, open-source search engine for fast data indexing and real-time analytics.](https://betterstack.com/dashboards/elasticsearch)
[\
\
### Host (Vector)\
\
Monitor your server with Vector metrics.](https://betterstack.com/dashboards/vector)
[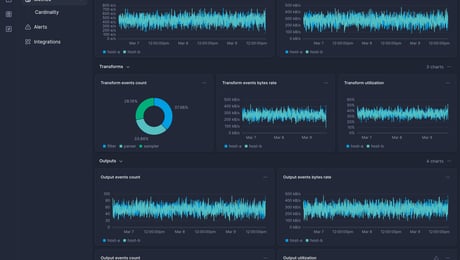\
\
### Vector\
\
Vector data pipeline input, transform, and output monitoring.](https://betterstack.com/dashboards/vector-pipeline)
[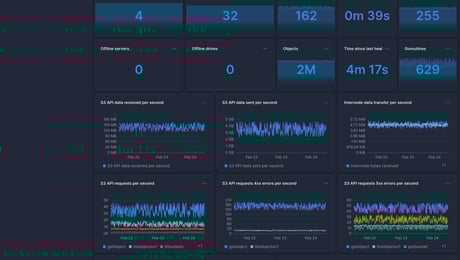\
\
### MinIO\
\
High-performance objectsStorage with S3 compatible API.](https://betterstack.com/dashboards/minio)
[\
\
### Host overview\
\
Monitor your server infrastructure with comprehensive host metrics.](https://betterstack.com/dashboards/host-overview)
[\
\
### Hosts\
\
Monitor multiple hosts and servers in your infrastructure.](https://betterstack.com/dashboards/hosts)
[\
\
### Kafka\
\
Monitor Apache Kafka message broker performance and throughput.](https://betterstack.com/dashboards/kafka)
[\
\
### Memcached\
\
Monitor Memcached caching server performance and hit rates.](https://betterstack.com/dashboards/memcached)
[\
\
### Services\
\
Monitor application services and their performance metrics.](https://betterstack.com/dashboards/services)
[\
\
### Website analytics\
\
Page views, unique visitors, attribution and engagement metrics for your website.](https://betterstack.com/dashboards/website-analytics)
[\
\
### Web vitals\
\
Get alerted when your Core Web Vitals decline.](https://betterstack.com/dashboards/web-vitals)
### Please accept cookies
We use cookies to authenticate users, improve the product user experience, and for [personalized ads](https://business.safety.google/privacy/)
. [Learn more.](https://betterstack.com/privacy)
Deny Accept required Accept all
---
# Get status page resource | Better Stack Documentation
###### Explore documentation
* [Welcome to Uptime 👋](https://betterstack.com/docs/uptime/start/)
* [Frequently Asked Questions](https://betterstack.com/docs/uptime/frequently-asked-questions/)
* [On-call scheduling and alerting](https://betterstack.com/docs/uptime/api/get-a-single-status-page-resource/)
1. [Get started](https://betterstack.com/docs/uptime/getting-started-with-oncall-v2/)
2. [Slack and other integrations ↗](https://betterstack.com/docs/uptime/slack/)
3. [Connecting external calendars](https://betterstack.com/docs/uptime/connecting-external-calendars/)
4. [Advanced guide](https://betterstack.com/docs/uptime/escalation-policies/)
* [Incidents](https://betterstack.com/docs/uptime/api/get-a-single-status-page-resource/)
1. [Get started](https://betterstack.com/docs/uptime/working-with-incidents/)
2. [Advanced guide](https://betterstack.com/docs/uptime/post-mortems/)
3. [Reporting ↗](https://betterstack.com/docs/getting-started/team-and-account-management/reporting/)
* [Monitoring](https://betterstack.com/docs/uptime/api/get-a-single-status-page-resource/)
1. [Get started](https://betterstack.com/docs/uptime/monitoring-start/)
2. [Working with monitors](https://betterstack.com/docs/uptime/bulk-importing-monitors/)
3. [Customizing monitors](https://betterstack.com/docs/uptime/naming-monitors/)
4. [Monitor types](https://betterstack.com/docs/uptime/uptime-monitor/)
* [Status pages](https://betterstack.com/docs/uptime/api/get-a-single-status-page-resource/)
1. [Get started](https://betterstack.com/docs/uptime/getting-started-with-status-pages/)
2. [Advanced guide](https://betterstack.com/docs/uptime/custom-subdomain/)
* [Uptime API](https://betterstack.com/docs/uptime/api/get-a-single-status-page-resource/)
1. [Getting an API token](https://betterstack.com/docs/uptime/api/getting-started-with-uptime-api/)
2. [Monitors](https://betterstack.com/docs/uptime/api/list-all-existing-monitors/)
3. [Heartbeats](https://betterstack.com/docs/uptime/api/list-all-existing-hearbeats/)
4. [On-call & incidents](https://betterstack.com/docs/uptime/api/on-call-calendar/)
5. [Status pages](https://betterstack.com/docs/uptime/api/list-all-existing-status-pages/)
1. [Status pages API](https://betterstack.com/docs/uptime/api/list-all-existing-status-pages/)
2. [Status page groups](https://betterstack.com/docs/uptime/api/list-all-status-page-groups/)
3. [Status page sections](https://betterstack.com/docs/uptime/api/list-existing-sections-of-a-status-page/)
4. [Status page resources](https://betterstack.com/docs/uptime/api/list-existing-resources-of-a-status-page/)
1. [List status page resources GET](https://betterstack.com/docs/uptime/api/list-existing-resources-of-a-status-page/)
2. [Get status page resource GET](https://betterstack.com/docs/uptime/api/get-a-single-status-page-resource/)
3. [Create status page resource POST](https://betterstack.com/docs/uptime/api/create-a-new-status-page-resource/)
4. [Update status page resource PATCH](https://betterstack.com/docs/uptime/api/update-an-existing-status-page-resource/)
5. [Remove status page resource DELETE](https://betterstack.com/docs/uptime/api/delete-an-existing-status-page-resource/)
6. [Response attributes](https://betterstack.com/docs/uptime/api/status-page-resources-api-response-params/)
5. [Status page reports](https://betterstack.com/docs/uptime/api/list-existing-reports-on-a-status-page/)
6. [Status page report updates](https://betterstack.com/docs/uptime/api/list-all-existing-status-updates-for-a-status-page-report/)
6. [Metadata](https://betterstack.com/docs/uptime/api/metadata/)
7. [Integrations](https://betterstack.com/docs/uptime/api/list-all-new-relic-integrations/)
8. [Team members](https://betterstack.com/docs/uptime/api/team-members/list/)
Get status page resource
========================
Returns a single status page resource.
GET https://uptime.betterstack.com/api/v2/status-pages/{status\_page\_id}/resources/{resource\_id}
URL parameters
status\_page\_id
required string
The ID of your status page
resource\_id
required string
The ID of the resource you want to get
Headers
Authorization
required string
Bearer `$TOKEN`
200
Returns a single status page resource
Response body
{
"data": {
"id": "12345",
"type": "status_page_resource",
"attributes": {
"status_page_section_id": 456789,
"resource_id": 112233,
"resource_type": "Monitor",
"history": true,
"widget_type": "history",
"public_name": "https://uptime.betterstack.com/",
"explanation": "",
"position": 0,
"mark_as_down_for": "incident_matching_metadata",
"mark_as_down_metadata_rule": {
"key": "Escalation policy",
"values": [\
{\
"type": "Policy",\
"item_id": "12345",\
"name": "Primary Policy"\
}\
]
},
"mark_as_degraded_for": "any_incident",
"availability": 0.99963,
"status": "operational",
"status_history": [\
{\
"day": "2022-01-01",\
"status": "operational",\
"downtime_duration": 0,\
"maintenance_duration": 0\
},\
{\
"day": "2022-01-02",\
"status": "downtime",\
"downtime_duration": 120.0,\
"maintenance_duration": 0\
}\
]
}
}
}
#### Example cURL
Example
Copied!
curl --request GET \
--url https://uptime.betterstack.com/api/v2/status-pages/123456789/resources/12345 \
--header "Authorization: Bearer $TOKEN"
#### Looking for the details of a specific parameter?
Explore [the list of all status page resources API parameters](https://betterstack.com/docs/uptime/api/status-page-resources-api-response-params/?utm_content=callout&utm_medium=docs-uptime&utm_source=community&utm_term=docs-uptime-api-getting-single-status-page-resource)
* * *
[Previous article\
\
List status page resources](https://betterstack.com/docs/uptime/api/list-existing-resources-of-a-status-page/)
[Next article\
\
Create status page resource](https://betterstack.com/docs/uptime/api/create-a-new-status-page-resource/)
### Please accept cookies
We use cookies to authenticate users, improve the product user experience, and for [personalized ads](https://business.safety.google/privacy/)
. [Learn more.](https://betterstack.com/privacy)
Deny Accept required Accept all
---
# Confirmation and recovery period | Better Stack Documentation
###### Explore documentation
* [Welcome to Uptime 👋](https://betterstack.com/docs/uptime/start/)
* [Frequently Asked Questions](https://betterstack.com/docs/uptime/frequently-asked-questions/)
* [On-call scheduling and alerting](https://betterstack.com/docs/uptime/confirmation-and-recovery-period/)
1. [Get started](https://betterstack.com/docs/uptime/getting-started-with-oncall-v2/)
2. [Slack and other integrations ↗](https://betterstack.com/docs/uptime/slack/)
3. [Connecting external calendars](https://betterstack.com/docs/uptime/connecting-external-calendars/)
4. [Advanced guide](https://betterstack.com/docs/uptime/escalation-policies/)
* [Incidents](https://betterstack.com/docs/uptime/confirmation-and-recovery-period/)
1. [Get started](https://betterstack.com/docs/uptime/working-with-incidents/)
2. [Advanced guide](https://betterstack.com/docs/uptime/post-mortems/)
3. [Reporting ↗](https://betterstack.com/docs/getting-started/team-and-account-management/reporting/)
* [Monitoring](https://betterstack.com/docs/uptime/confirmation-and-recovery-period/)
1. [Get started](https://betterstack.com/docs/uptime/monitoring-start/)
2. [Working with monitors](https://betterstack.com/docs/uptime/bulk-importing-monitors/)
3. [Customizing monitors](https://betterstack.com/docs/uptime/naming-monitors/)
1. [Naming monitors](https://betterstack.com/docs/uptime/naming-monitors/)
2. [Check frequency](https://betterstack.com/docs/uptime/check-frequency/)
3. [Request timeout](https://betterstack.com/docs/uptime/request-timeout/)
4. [Confirmation and recovery period](https://betterstack.com/docs/uptime/confirmation-and-recovery-period/)
5. [Domain expiration checks](https://betterstack.com/docs/uptime/domain-expiration-checks/)
6. [SSL certificate checks](https://betterstack.com/docs/uptime/ssl-certificate-checks/)
7. [Cache busting](https://betterstack.com/docs/uptime/cache-busting-in-monitoring/)
8. [Locations and regions](https://betterstack.com/docs/uptime/locations-and-regions/)
9. [Request parameters, headers and HTTP authentication](https://betterstack.com/docs/uptime/request-parameters-headers-and-http-authentication/)
10. [Github badge](https://betterstack.com/docs/uptime/github-badge/)
4. [Monitor types](https://betterstack.com/docs/uptime/uptime-monitor/)
* [Status pages](https://betterstack.com/docs/uptime/confirmation-and-recovery-period/)
1. [Get started](https://betterstack.com/docs/uptime/getting-started-with-status-pages/)
2. [Advanced guide](https://betterstack.com/docs/uptime/custom-subdomain/)
* [Uptime API](https://betterstack.com/docs/uptime/confirmation-and-recovery-period/)
1. [Getting an API token](https://betterstack.com/docs/uptime/api/getting-started-with-uptime-api/)
2. [Monitors](https://betterstack.com/docs/uptime/api/list-all-existing-monitors/)
3. [Heartbeats](https://betterstack.com/docs/uptime/api/list-all-existing-hearbeats/)
4. [On-call & incidents](https://betterstack.com/docs/uptime/api/on-call-calendar/)
5. [Status pages](https://betterstack.com/docs/uptime/api/list-all-existing-status-pages/)
6. [Metadata](https://betterstack.com/docs/uptime/api/metadata/)
7. [Integrations](https://betterstack.com/docs/uptime/api/list-all-new-relic-integrations/)
8. [Team members](https://betterstack.com/docs/uptime/api/team-members/list/)
Confirmation and recovery period
================================
**The confirmation period** states how long we wait after observing a failure before we start a new incident.
**The recovery period states** how long a monitor has to be up before we automatically mark it as recovered, and the related incident as resolved.
### Example
To better understand how this works, let's take a monitor with a 30-second check frequency, immediate confirmation period, and 1-minute recovery period.
When this monitor observers a downtime, it will create an incident immediately, as the confirmation period is set to an immediate start. If the next check that comes after 30 seconds shows the monitor as available (up and working), it will start the confirmation period countdown. This will take 60 seconds, during which 2 additional checks are performed, and both need to be valid in order for the incident to resolve automatically.
If any of the checks fails during the recovery period, the counter is reset and the monitor is waiting once more for a valid check to start the recovery period again.
To change the confirmation or recovery period, go to [Monitors](https://uptime.betterstack.com/team/0/monitors)
→ **Select a monitor** → **Configure** → **Advanced settings** and set the dropdown to your preferred period.
* * *
[Previous article\
\
Request timeout](https://betterstack.com/docs/uptime/request-timeout/)
[Next article\
\
Domain expiration checks](https://betterstack.com/docs/uptime/domain-expiration-checks/)
### Please accept cookies
We use cookies to authenticate users, improve the product user experience, and for [personalized ads](https://business.safety.google/privacy/)
. [Learn more.](https://betterstack.com/privacy)
Deny Accept required Accept all
---
# Update an exploration alert | Better Stack Documentation
###### Explore documentation
* [Welcome to Telemetry 👋](https://betterstack.com/docs/logs/start/)
* [Quick start guide](https://betterstack.com/docs/logs/logging-start/)
* [Wide events vs. metrics](https://betterstack.com/docs/logs/wide-events-time-series/)
* [Ingesting data](https://betterstack.com/docs/logs/api/exploration-alerts/update/)
1. [Better Stack collector](https://betterstack.com/docs/logs/collector/)
2. [Vector](https://betterstack.com/docs/logs/vector/)
3. [OpenTelemetry](https://betterstack.com/docs/logs/open-telemetry/)
4. [Ingesting via HTTP API](https://betterstack.com/docs/logs/ingesting-data/http/logs/)
5. [Ingesting metrics](https://betterstack.com/docs/logs/ingesting-data/metrics/prometheus-scrape/)
6. [Ingesting logs](https://betterstack.com/docs/logs/ingesting-data/logs/docker-kubernetes/)
7. [Migrating to Better Stack](https://betterstack.com/docs/logs/datadog-agent/)
* [Using the product](https://betterstack.com/docs/logs/api/exploration-alerts/update/)
1. [AI SRE ↗](https://betterstack.com/demos/ai-sre/)
2. [MCP server ↗](https://betterstack.com/docs/getting-started/integrations/mcp/)
3. [Transforming ingested data](https://betterstack.com/docs/logs/using-logtail/transforming-ingested-data/logs-vrl/)
4. [Querying data](https://betterstack.com/docs/logs/using-logtail/live-tail-query-language/)
5. [Tracing](https://betterstack.com/docs/logs/tracing/)
6. [Alerts](https://betterstack.com/docs/logs/dashboards/alerts/)
* [Telemetry API](https://betterstack.com/docs/logs/api/exploration-alerts/update/)
1. [Getting an API token](https://betterstack.com/docs/logs/api/getting-started/)
2. [Sources & collectors](https://betterstack.com/docs/logs/api/list-all-existing-sources/)
3. [Dashboards](https://betterstack.com/docs/logs/api/dashboards/list/)
4. [Explorations](https://betterstack.com/docs/logs/api/explorations/list/)
1. [Explorations API](https://betterstack.com/docs/logs/api/explorations/list/)
2. [Exploration alerts API](https://betterstack.com/docs/logs/api/exploration-alerts/list/)
1. [List exploration alerts GET](https://betterstack.com/docs/logs/api/exploration-alerts/list/)
2. [Get a single alert GET](https://betterstack.com/docs/logs/api/exploration-alerts/get/)
3. [Create an alert POST](https://betterstack.com/docs/logs/api/exploration-alerts/create/)
4. [Update an alert PATCH](https://betterstack.com/docs/logs/api/exploration-alerts/update/)
5. [Remove an alert DELETE](https://betterstack.com/docs/logs/api/exploration-alerts/delete/)
3. [Exploration groups API](https://betterstack.com/docs/logs/api/exploration-groups/list/)
5. [Alerts API](https://betterstack.com/docs/logs/api/alerts/list/)
6. [Connections API](https://betterstack.com/docs/logs/api/connections/list/)
7. [Query API ↗](https://betterstack.com/docs/logs/query-api/connect-remotely/)
* [Alternative to](https://betterstack.com/docs/logs/api/exploration-alerts/update/)
1. [Lightstep](https://betterstack.com/docs/logs/alternative-to/lightstep/)
Update an exploration alert
===========================
Updates an existing alert by its ID. You only need to provide the fields you want to change.
PATCH https://telemetry.betterstack.com/api/v2/explorations/{exploration\_id}/alerts/{id}
URL parameters
exploration\_id
required integer
The unique identifier of the exploration.
id
required integer
The unique identifier of the alert to update.
Headers
Authorization
required string
Bearer `$TOKEN`
Body parameters
name
string
A new name for the alert.
alert\_type
string
The type of alert. `threshold` for static values, `relative` for percentage changes, or `anomaly_rrcf` for ML-based anomaly detection. Cannot be changed after creation.
operator
string
The comparison operator. Required for `threshold` and `relative` alerts. For `threshold`: `equal`, `not_equal`, `higher_than`, `higher_than_or_equal`, `lower_than`, `lower_than_or_equal`. For `relative`: `increases_by`, `decreases_by`, `changes_by`. Not used for `anomaly_rrcf` alerts.
value
number
The numeric value for the alert condition. For `threshold` alerts, this is the static threshold. For `relative` alerts, this is the percentage change. Required for `threshold` and `relative` types unless `string_value` is set. A value of `0` is valid.
string\_value
string
An alternative to `value` for `threshold` alerts when matching an exact string. If `string_value` is set, `value` is not required. Only valid with `equal` or `not_equal` operators.
check\_period
integer
How often to evaluate the alert condition, in seconds. Required for `threshold` and `relative` alert types. Not used for `anomaly_rrcf` alerts.
query\_period
integer
The time window in seconds for the data being analyzed. If not provided, falls back to `aggregation_interval`, then `check_period`.
aggregation\_interval
integer
The size of data buckets in seconds for aggregating and evaluating the metric. If not provided, falls back to `query_period`, then `check_period`.
confirmation\_period
integer
The duration in seconds that a condition must be met before an alert is triggered. A value of `0` triggers the alert immediately.
recovery\_period
integer
The duration in seconds that a condition must be resolved before an incident is recovered.
anomaly\_sensitivity
number
The sensitivity of the anomaly detection model, from 0 to 100. Higher values result in more alerts. Only for `anomaly_rrcf` alerts.
anomaly\_trigger
string
Defines which anomalies trigger an alert: `any` (both higher and lower), `higher`, or `lower`. Only for `anomaly_rrcf` alerts.
series\_names
array
An array of strings to filter the alert to specific data series.
source\_variable
string
The variable name for the source selection. If not provided, derived automatically from the exploration preset's source variable.
source\_mode
string
The mode for source selection. Valid values: `source_variable`, `platforms_single_source`, `platforms_all_sources`.
source\_platforms
array
An array of platform names to filter the sources this alert runs on.
incident\_cause
string
A custom description template for the incident created by this alert. Supports `{{value}}` placeholder.
incident\_per\_series
boolean
Whether a separate incident will be created for each data series that triggers the alert.
escalation\_target
object
Defines where to send notifications. Defaults to `current_team`.
call
boolean
Enable phone call notifications. Only used if `escalation_target` is not a policy.
sms
boolean
Enable SMS notifications. Only used if `escalation_target` is not a policy.
email
boolean
Enable email notifications. Only used if `escalation_target` is not a policy.
push
boolean
Enable push notifications. Only used if `escalation_target` is not a policy.
critical\_alert
boolean
Enable critical push notifications that bypass Do Not Disturb. Only used if `escalation_target` is not a policy.
metadata
object
A key-value object for custom metadata to be included in incidents. Both keys and values must be strings. This will replace all existing metadata.
paused
boolean
Whether the alert should be paused or active.
200
The alert was updated successfully.
Response body
{
"data": {
"id": "789",
"type": "alert",
"attributes": {
"name": "High Error Rate Alert",
"alert_type": "threshold",
"operator": "higher_than",
"value": 150.0,
"query_period": 300,
"confirmation_period": 60,
"recovery_period": 300,
"escalation_target": {
"policy_id": 123,
"policy_name": "Critical Alerts Policy"
},
"paused": false,
"paused_reason": null,
"created_at": "2026-02-20T10:00:00Z",
"updated_at": "2026-02-24T15:00:00Z"
}
}
}
404
The specified exploration or alert was not found.
Updating the `metadata` object will replace the entire object, not merge it. Any keys not included in the update request will be removed.
Example request
---------------
cURL
Copied!
curl --request PATCH \
--url https://telemetry.betterstack.com/api/v2/explorations/123/alerts/789 \
--header "Authorization: Bearer $TOKEN" \
--header "Content-Type: application/json" \
--data '{
"value": 150.0,
"confirmation_period": 60
}'
* * *
[Previous article\
\
Create an exploration alert](https://betterstack.com/docs/logs/api/exploration-alerts/create/)
[Next article\
\
Remove an exploration alert](https://betterstack.com/docs/logs/api/exploration-alerts/delete/)
###### On this page
* [Example request](https://betterstack.com/docs/logs/api/exploration-alerts/update/#example-request)
### Please accept cookies
We use cookies to authenticate users, improve the product user experience, and for [personalized ads](https://business.safety.google/privacy/)
. [Learn more.](https://betterstack.com/privacy)
Deny Accept required Accept all
---
# Remove a group | Better Stack Documentation
###### Explore documentation
* [Welcome to Errors 👋](https://betterstack.com/docs/errors/start/)
1. [JavaScript tag](https://betterstack.com/docs/errors/js-tag/start/)
* [Collecting errors](https://betterstack.com/docs/errors/api/applications-groups/delete/)
1. [Integrating using an AI prompt](https://betterstack.com/docs/errors/collecting-errors/ai-prompt/)
2. [Sentry SDK](https://betterstack.com/docs/errors/collecting-errors/sentry-sdk/)
* [Using the product](https://betterstack.com/docs/errors/api/applications-groups/delete/)
1. [Exception grouping](https://betterstack.com/docs/errors/using-the-product/exception-grouping/)
2. [Fix with AI](https://betterstack.com/docs/errors/using-the-product/fix-with-ai/)
3. [Releases](https://betterstack.com/docs/errors/using-the-product/releases/)
4. [Uploading source maps](https://betterstack.com/docs/errors/collecting-errors/upload-source-maps/)
* [Integrations](https://betterstack.com/docs/errors/api/applications-groups/delete/)
1. [Reporting incidents](https://betterstack.com/docs/errors/integrations/creating-incidents/)
2. [Slack](https://betterstack.com/docs/errors/integrations/slack/)
3. [Microsoft Teams](https://betterstack.com/docs/errors/integrations/ms-teams/)
4. [Linear](https://betterstack.com/docs/errors/integrations/linear/)
5. [Jira](https://betterstack.com/docs/errors/integrations/jira/)
6. [GitHub](https://betterstack.com/docs/errors/integrations/github/)
* [Errors API](https://betterstack.com/docs/errors/api/applications-groups/delete/)
1. [Getting an API token](https://betterstack.com/docs/errors/api/getting-api-token/)
2. [Applications API](https://betterstack.com/docs/errors/api/applications/list/)
3. [Application groups API](https://betterstack.com/docs/errors/api/applications-groups/list/)
1. [List all groups GET](https://betterstack.com/docs/errors/api/applications-groups/list/)
2. [Get a single group GET](https://betterstack.com/docs/errors/api/applications-groups/get/)
3. [Create a group POST](https://betterstack.com/docs/errors/api/applications-groups/create/)
4. [Update a group PATCH](https://betterstack.com/docs/errors/api/applications-groups/update/)
5. [Remove a group DELETE](https://betterstack.com/docs/errors/api/applications-groups/delete/)
6. [List applications in a group GET](https://betterstack.com/docs/errors/api/applications-groups/list-applications/)
Remove a group
==============
Deletes an existing application group.
DELETE https://errors.betterstack.com/api/v1/application-groups/{id}
URL parameters
id
required string
The ID of the application group to delete.
Headers
Authorization
required string
Bearer `$TOKEN`
204
No Content
401
Unauthorized
Response body
{
"errors": "Invalid authentication"
}
404
Not Found
Response body
{
"errors": "Resource with the provided ID was not found"
}
#### Example cURL
Example
Copied!
curl --request DELETE \
--url https://errors.betterstack.com/api/v1/application-groups/5678 \
--header "Authorization: Bearer $TOKEN"
* * *
[Previous article\
\
Update a group](https://betterstack.com/docs/errors/api/applications-groups/update/)
[Next article\
\
List applications in a group](https://betterstack.com/docs/errors/api/applications-groups/list-applications/)
### Please accept cookies
We use cookies to authenticate users, improve the product user experience, and for [personalized ads](https://business.safety.google/privacy/)
. [Learn more.](https://betterstack.com/privacy)
Deny Accept required Accept all
---
# Getting started with Warehouse API | Better Stack Documentation
###### Explore documentation
* [Welcome to Warehouse 👋](https://betterstack.com/docs/warehouse/start/)
* [Ingesting data](https://betterstack.com/docs/warehouse/api/getting-api-token/)
1. [Ingesting events](https://betterstack.com/docs/warehouse/ingesting-data/intro/)
2. [S3 vs NVMe hosted data](https://betterstack.com/docs/warehouse/ingesting-data/s3-vs-nvme/)
3. [Host events in your S3 bucket](https://betterstack.com/docs/warehouse/ingesting-data/custom-s3-bucket/)
* [Querying data](https://betterstack.com/docs/warehouse/api/getting-api-token/)
1. [Querying events & time series](https://betterstack.com/docs/warehouse/querying-data/events-and-time-series/)
2. [Writing SQL queries](https://betterstack.com/docs/warehouse/querying-data/merge-and-state-aggregators/)
3. [Query speeds](https://betterstack.com/docs/warehouse/querying-data/query-speeds/)
4. [Ad-hoc SQL API](https://betterstack.com/docs/warehouse/querying-data/ad-hoc-sql-api/)
5. [Generate client-facing APIs](https://betterstack.com/docs/warehouse/querying-data/queries/)
6. [Visualizing data](https://betterstack.com/docs/warehouse/querying-data/visualizing-data/)
* [Vector embeddings](https://betterstack.com/docs/warehouse/api/getting-api-token/)
1. [Introduction to embeddings](https://betterstack.com/docs/warehouse/vector-embeddings/intro/)
2. [Using built-in embeddings](https://betterstack.com/docs/warehouse/vector-embeddings/built-in-embeddings/)
3. [Bringing your own embeddings](https://betterstack.com/docs/warehouse/vector-embeddings/bring-your-own/)
4. [Data structures and indices](https://betterstack.com/docs/warehouse/vector-embeddings/data-structures-and-indices/)
* [Use cases](https://betterstack.com/docs/warehouse/api/getting-api-token/)
1. [Retrieval Augmented Generation](https://betterstack.com/docs/warehouse/use-cases/building-rag/)
* [Management](https://betterstack.com/docs/warehouse/api/getting-api-token/)
1. [Controlling costs](https://betterstack.com/docs/warehouse/management/controlling-costs/)
* [Warehouse API](https://betterstack.com/docs/warehouse/api/getting-api-token/)
1. [Getting an API token](https://betterstack.com/docs/warehouse/api/getting-api-token/)
2. [Warehouse sources API](https://betterstack.com/docs/warehouse/api/sources/list/)
3. [Warehouse source groups API](https://betterstack.com/docs/warehouse/api/source-groups/list/)
4. [Time series API](https://betterstack.com/docs/warehouse/api/time-series/list/)
5. [Embeddings API](https://betterstack.com/docs/warehouse/api/embeddings/list/)
Getting started with Warehouse API
==================================

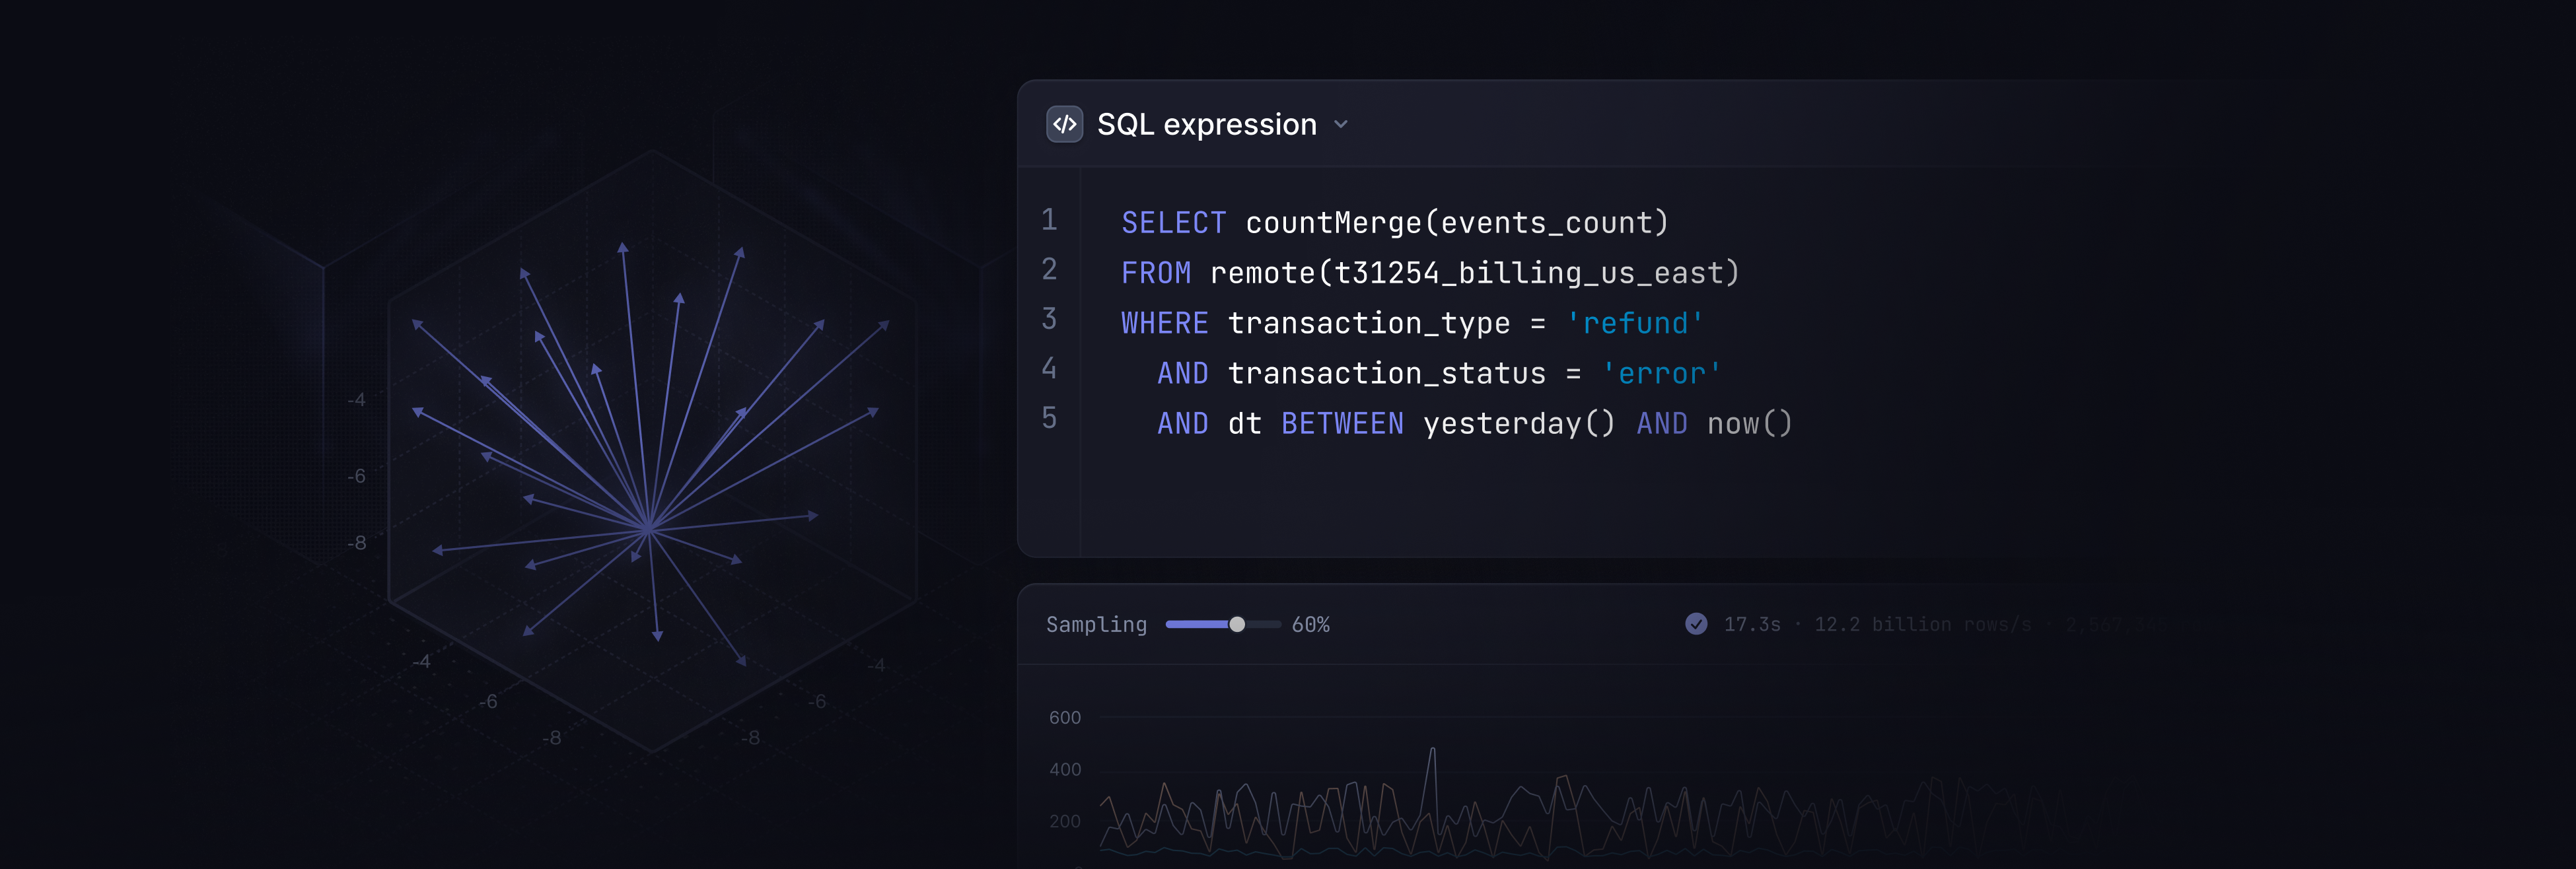
How Warehouse API works
-----------------------
Our API follows the [JSON:API](https://jsonapi.org/)
specification.
API requests made to Better Stack API are authorized using a [Bearer Authentication standard](https://swagger.io/docs/specification/authentication/bearer-authentication/)
. That means you'll only need to add a header with `Authorization: Bearer $TOKEN` to your requests. To access the Warehouse API, you need an API token. This token **authenticates your requests** and grants you access to manage your resources programmatically. The Warehouse API uses the same tokens as the Telemetry API.
You can use either a Global API token (for organization-wide management) or a Telemetry API token (scoped to a specific team).
### Get a global API token
A global API token is a token **valid across all your teams**, for managing anything within Better Stack.
* Go to [Better Stack → API tokens](https://betterstack.com/settings/global-api-tokens)
.
* Copy an existing token or create a new one in the **Global API tokens** section.

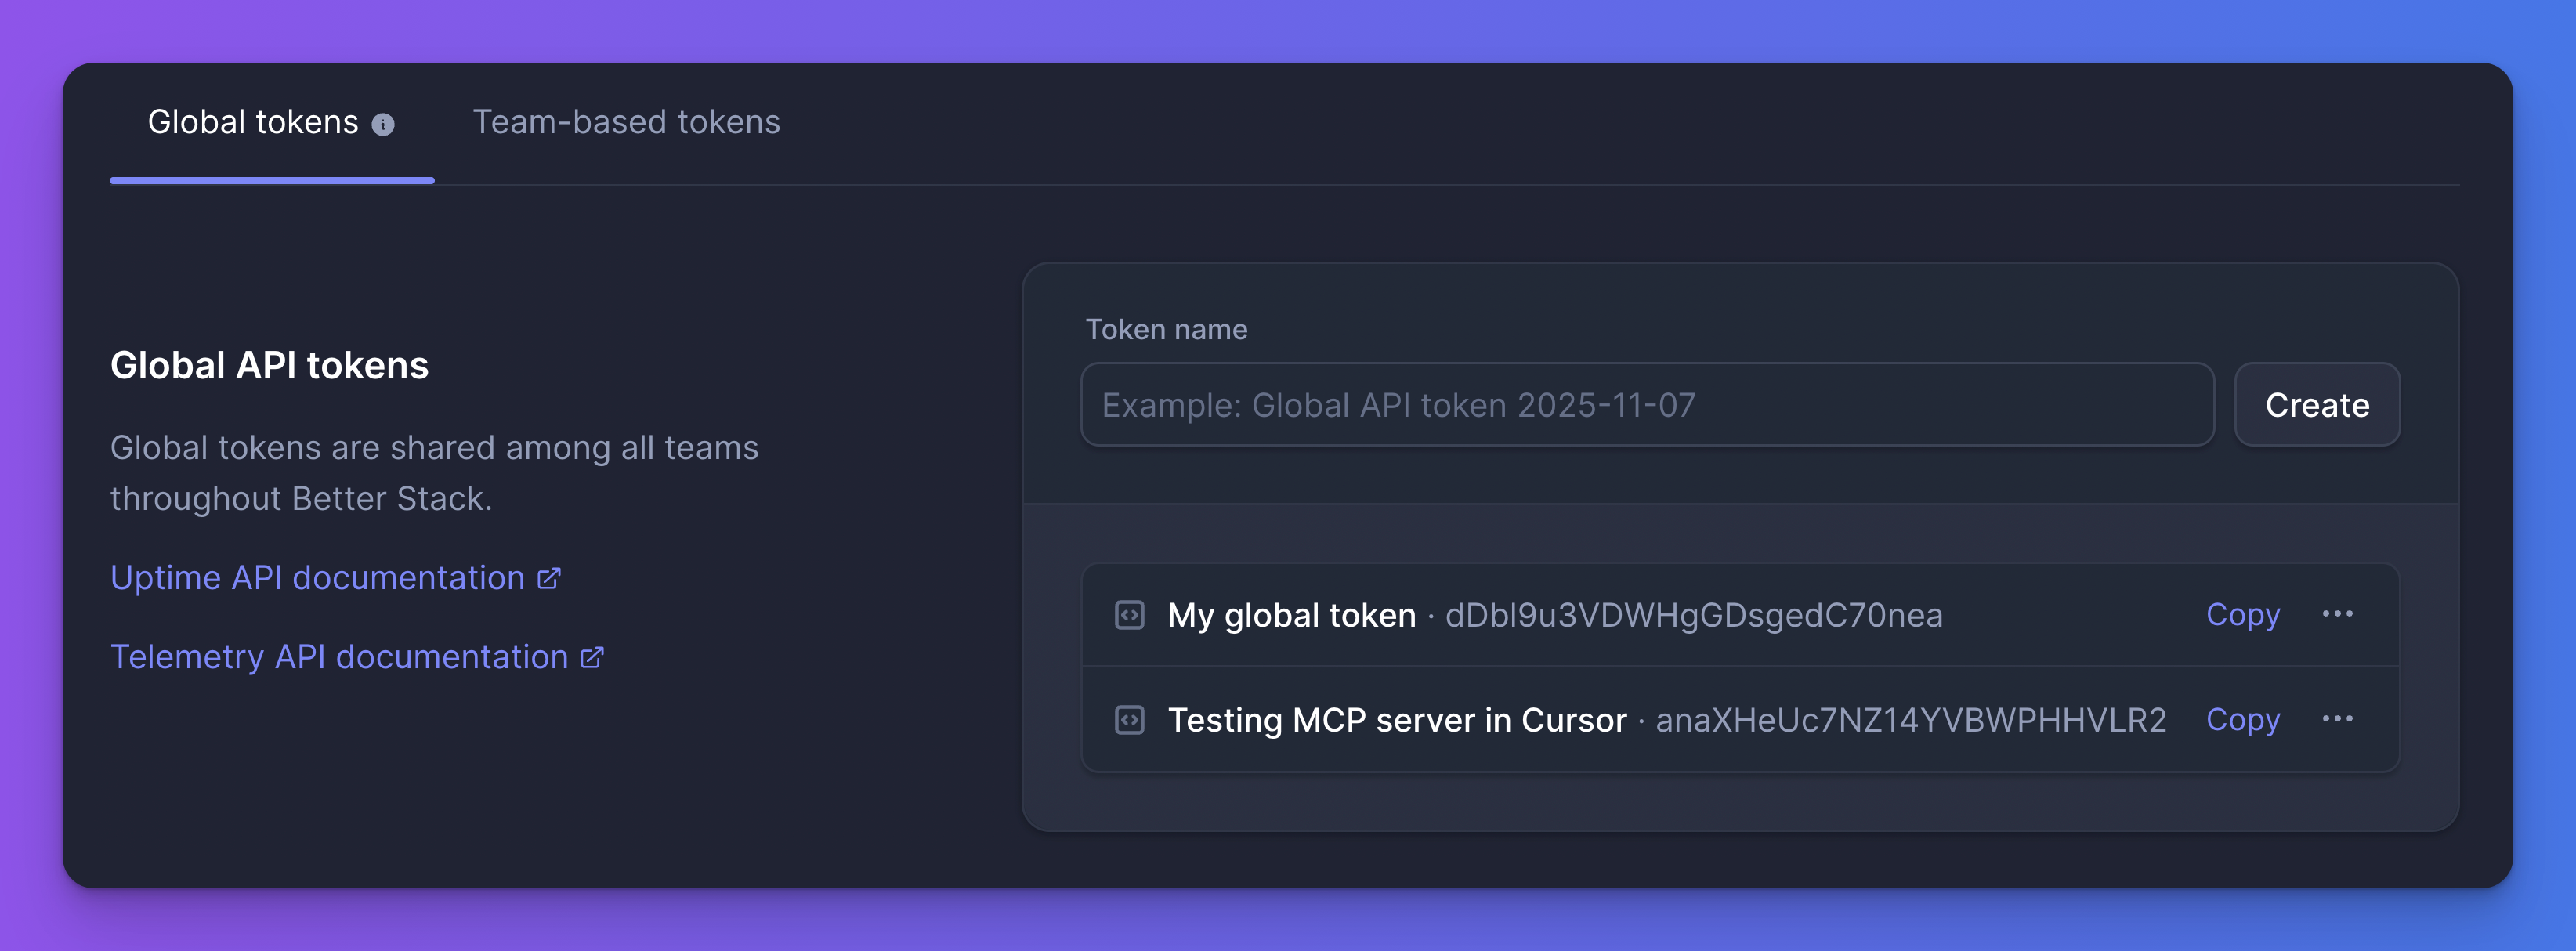
### Get a Telemetry API token
A Telemetry API token is a **team-scoped token** for managing your Telemetry resources, including Warehouse and Errors. You can get a separate API token for each of your teams.
* Go to [Better Stack → API tokens -> Team-based tokens](https://betterstack.com/settings/api-tokens/0)
.
* Select your team.
* Copy an existing token or create a new one in the **Telemetry API tokens** section.

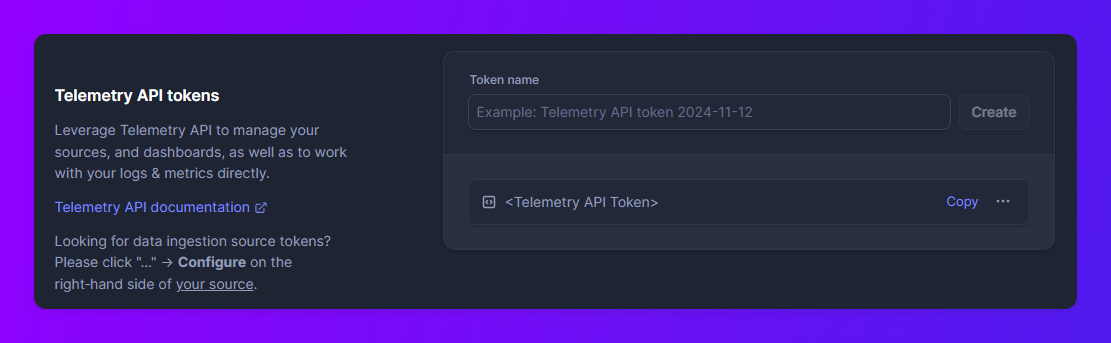
Have any questions?
-------------------
Please feel free to message us at [hello@betterstack.com](mailto:hello@betterstack.com)
.
We'll get back to you as soon as we can, typically within a few hours. 🙏
Thank you!
* * *
[Previous article\
\
Controlling costs](https://betterstack.com/docs/warehouse/management/controlling-costs/)
[Next article\
\
List all warehouse sources](https://betterstack.com/docs/warehouse/api/sources/list/)
###### On this page
* [How Warehouse API works](https://betterstack.com/docs/warehouse/api/getting-api-token/#how-warehouse-api-works)
* [Have any questions?](https://betterstack.com/docs/warehouse/api/getting-api-token/#have-any-questions)
### Please accept cookies
We use cookies to authenticate users, improve the product user experience, and for [personalized ads](https://business.safety.google/privacy/)
. [Learn more.](https://betterstack.com/privacy)
Deny Accept required Accept all
---
# Removing monitors | Better Stack Documentation
###### Explore documentation
* [Welcome to Uptime 👋](https://betterstack.com/docs/uptime/start/)
* [Frequently Asked Questions](https://betterstack.com/docs/uptime/frequently-asked-questions/)
* [On-call scheduling and alerting](https://betterstack.com/docs/uptime/removing-monitors/)
1. [Get started](https://betterstack.com/docs/uptime/getting-started-with-oncall-v2/)
2. [Slack and other integrations ↗](https://betterstack.com/docs/uptime/slack/)
3. [Connecting external calendars](https://betterstack.com/docs/uptime/connecting-external-calendars/)
4. [Advanced guide](https://betterstack.com/docs/uptime/escalation-policies/)
* [Incidents](https://betterstack.com/docs/uptime/removing-monitors/)
1. [Get started](https://betterstack.com/docs/uptime/working-with-incidents/)
2. [Advanced guide](https://betterstack.com/docs/uptime/post-mortems/)
3. [Reporting ↗](https://betterstack.com/docs/getting-started/team-and-account-management/reporting/)
* [Monitoring](https://betterstack.com/docs/uptime/removing-monitors/)
1. [Get started](https://betterstack.com/docs/uptime/monitoring-start/)
2. [Working with monitors](https://betterstack.com/docs/uptime/bulk-importing-monitors/)
1. [Bulk importing monitors](https://betterstack.com/docs/uptime/bulk-importing-monitors/)
2. [Grouping and ordering monitors](https://betterstack.com/docs/uptime/grouping-and-ordering-monitors/)
3. [Pausing monitors and maintenances](https://betterstack.com/docs/uptime/pausing-monitors-and-maintenances/)
4. [Removing monitors](https://betterstack.com/docs/uptime/removing-monitors/)
3. [Customizing monitors](https://betterstack.com/docs/uptime/naming-monitors/)
4. [Monitor types](https://betterstack.com/docs/uptime/uptime-monitor/)
* [Status pages](https://betterstack.com/docs/uptime/removing-monitors/)
1. [Get started](https://betterstack.com/docs/uptime/getting-started-with-status-pages/)
2. [Advanced guide](https://betterstack.com/docs/uptime/custom-subdomain/)
* [Uptime API](https://betterstack.com/docs/uptime/removing-monitors/)
1. [Getting an API token](https://betterstack.com/docs/uptime/api/getting-started-with-uptime-api/)
2. [Monitors](https://betterstack.com/docs/uptime/api/list-all-existing-monitors/)
3. [Heartbeats](https://betterstack.com/docs/uptime/api/list-all-existing-hearbeats/)
4. [On-call & incidents](https://betterstack.com/docs/uptime/api/on-call-calendar/)
5. [Status pages](https://betterstack.com/docs/uptime/api/list-all-existing-status-pages/)
6. [Metadata](https://betterstack.com/docs/uptime/api/metadata/)
7. [Integrations](https://betterstack.com/docs/uptime/api/list-all-new-relic-integrations/)
8. [Team members](https://betterstack.com/docs/uptime/api/team-members/list/)
Removing monitors
=================
If you no longer need a particular monitor:
* Go to **Monitors**.
* Pick the monitor you want to remove.
* Click **Configure** in the headline.
* Click **Remove** in the headline and confirm.
* * *
[Previous article\
\
Pausing monitors and maintenances](https://betterstack.com/docs/uptime/pausing-monitors-and-maintenances/)
[Next article\
\
Naming monitors](https://betterstack.com/docs/uptime/naming-monitors/)
### Please accept cookies
We use cookies to authenticate users, improve the product user experience, and for [personalized ads](https://business.safety.google/privacy/)
. [Learn more.](https://betterstack.com/privacy)
Deny Accept required Accept all
---
# Vercel Better Stack integration | Better Stack Documentation
###### Explore documentation
* [Welcome to Telemetry 👋](https://betterstack.com/docs/logs/start/)
* [Quick start guide](https://betterstack.com/docs/logs/logging-start/)
* [Wide events vs. metrics](https://betterstack.com/docs/logs/wide-events-time-series/)
* [Ingesting data](https://betterstack.com/docs/logs/vercel/automatic-integration/)
1. [Better Stack collector](https://betterstack.com/docs/logs/collector/)
2. [Vector](https://betterstack.com/docs/logs/vector/)
3. [OpenTelemetry](https://betterstack.com/docs/logs/open-telemetry/)
4. [Ingesting via HTTP API](https://betterstack.com/docs/logs/ingesting-data/http/logs/)
5. [Ingesting metrics](https://betterstack.com/docs/logs/ingesting-data/metrics/prometheus-scrape/)
6. [Ingesting logs](https://betterstack.com/docs/logs/ingesting-data/logs/docker-kubernetes/)
1. [Docker & Kubernetes](https://betterstack.com/docs/logs/docker/)
2. [Operating systems](https://betterstack.com/docs/logs/ubuntu/)
3. [Log forwarders](https://betterstack.com/docs/logs/metrics/vector/)
4. [Programming languages](https://betterstack.com/docs/logs/javascript/)
5. [Cloud platforms](https://betterstack.com/docs/logs/aws/)
1. [AWS](https://betterstack.com/docs/logs/aws/)
2. [Azure](https://betterstack.com/docs/logs/azure-logs/)
3. [Cloudflare](https://betterstack.com/docs/logs/cloudflare/)
4. [Google](https://betterstack.com/docs/logs/google-cloud-pubsub/)
5. [Digital Ocean](https://betterstack.com/docs/logs/digital-ocean-apps/)
6. [Heroku](https://betterstack.com/docs/logs/heroku/)
7. [Vercel](https://betterstack.com/docs/logs/vercel/automatic-integration/)
1. [Quick start guide](https://betterstack.com/docs/logs/vercel/automatic-integration/)
2. [Advanced guide](https://betterstack.com/docs/logs/vercel/log-drain/)
8. [Render](https://betterstack.com/docs/logs/render/)
9. [Fly.io](https://betterstack.com/docs/logs/fly-io/)
10. [Supabase](https://betterstack.com/docs/logs/supabase/)
6. [Web servers & Load balancers](https://betterstack.com/docs/logs/nginx/)
7. [Databases & queues](https://betterstack.com/docs/logs/postgresql/)
8. [Storage](https://betterstack.com/docs/logs/minio/)
7. [Migrating to Better Stack](https://betterstack.com/docs/logs/datadog-agent/)
* [Using the product](https://betterstack.com/docs/logs/vercel/automatic-integration/)
1. [AI SRE ↗](https://betterstack.com/demos/ai-sre/)
2. [MCP server ↗](https://betterstack.com/docs/getting-started/integrations/mcp/)
3. [Transforming ingested data](https://betterstack.com/docs/logs/using-logtail/transforming-ingested-data/logs-vrl/)
4. [Querying data](https://betterstack.com/docs/logs/using-logtail/live-tail-query-language/)
5. [Tracing](https://betterstack.com/docs/logs/tracing/)
6. [Alerts](https://betterstack.com/docs/logs/dashboards/alerts/)
* [Telemetry API](https://betterstack.com/docs/logs/vercel/automatic-integration/)
1. [Getting an API token](https://betterstack.com/docs/logs/api/getting-started/)
2. [Sources & collectors](https://betterstack.com/docs/logs/api/list-all-existing-sources/)
3. [Dashboards](https://betterstack.com/docs/logs/api/dashboards/list/)
4. [Explorations](https://betterstack.com/docs/logs/api/explorations/list/)
5. [Alerts API](https://betterstack.com/docs/logs/api/alerts/list/)
6. [Connections API](https://betterstack.com/docs/logs/api/connections/list/)
7. [Query API ↗](https://betterstack.com/docs/logs/query-api/connect-remotely/)
* [Alternative to](https://betterstack.com/docs/logs/vercel/automatic-integration/)
1. [Lightstep](https://betterstack.com/docs/logs/alternative-to/lightstep/)
Vercel Better Stack integration
===============================
Start logging in 2 minutes
--------------------------
Automatically collect logs from your Vercel projects:
1. Go to [Vercel Better Stack integration](https://vercel.com/integrations/betterstack)
.
2. Click `Add integration` and follow the simple steps there.
3. You should see your logs in [Better Stack → Live tail](https://telemetry.betterstack.com/team/0/tail)
.
4. Check out your metrics in the [Vercel dashboard](https://telemetry.betterstack.com/team/0/dashboards/platform/vercel_integration)
.
**Vercel Pro or Enterprise plan is required**
Optional structured logging
---------------------------
Take advantage of **full-stack structured logging** in 3 steps.
### 1\. Install
Install Better Stack Next.js NPM package:
Install Logtail Next
Copied!
npm install @logtail/next
### 2\. Setup
Set up Better Stack Next.js client in `next.config.js`:
Wrap Next.js config with Logtail
Copied!
const { withLogtail } = require('@logtail/next');
module.exports = withLogtail({
// Your existing config
});
Import Better Stack Next.js logger:
Import Logtail logger
Copied!
const { log } = require('@logtail/next');
### 3\. Start logging 🎉
Use structured logging in client, edge, or server-side files:
Send logs to Logtail
Copied!
log.error("Something bad happened.");
log.info("Log message with structured logging.", {
item: "Orange Soda",
price: 100.00
});
You should see your logs in [Better Stack → Live tail](https://telemetry.betterstack.com/team/0/tail)
.
**Next.js version 12.1.4 or higher is required.**
Need help?
----------
Please let us know at [hello@betterstack.com](mailto:hello@betterstack.com)
.
We're happy to help! 🙏
Need to customize which logs to send?
-------------------------------------
Set up a [Vercel Log drain](https://betterstack.com/docs/logs/vercel/log-drain/)
instead!
Advanced usage
--------------
### Web Vitals
Forward [Web Vitals metrics](https://vercel.com/docs/concepts/analytics/web-vitals)
provided by Vercel to Better Stack.
Set up metrics reporting in `pages/_app.js`:
Report Web Vitals
Copied!
export { reportWebVitals } from '@logtail/next';
### Handlers
Get logger with **automatic log flushing** and built-in **exception logging**.
Wrap your Next.js route handlers with Better Stack:
Logging in handlers
Copied!
const { withLogtail, LogtailAPIRequest } = require('@logtail/next');
async function handler(req: LogtailAPIRequest, res: NextApiResponse) {
req.log.info("Hello Logtail!");
res.status(200).text("OK");
}
export default withLogtail(handler);
### Log levels
Better Stack Next.js client provides four log levels: `debug`, `info`, `warn`, and `error`.
Stop sending `debug` logs to Better Stack:
Don't send debug logs
Copied!
export LOGTAIL_LOG_LEVEL=info
### Server-side props
Take advantage of **automatic log flushing** and built-in **exception logging**.
Wrap your server-side props with Better Stack:
Server-side props
Copied!
const { withLogtailGetServerSideProps } = require('@logtail/next');
export const getServerSideProps = withLogtailGetServerSideProps(
async ({ req, log }) => {
log.info("Hello Logtail!");
return {
props: {
},
}
}
);
* * *
[Previous article\
\
Heroku integration](https://betterstack.com/docs/logs/heroku/)
[Next article\
\
Set up Vercel Log drain](https://betterstack.com/docs/logs/vercel/log-drain/)
###### On this page
* [Start logging in 2 minutes](https://betterstack.com/docs/logs/vercel/automatic-integration/#start-logging-in-2-minutes)
* [Optional structured logging](https://betterstack.com/docs/logs/vercel/automatic-integration/#optional-structured-logging)
* [Need help?](https://betterstack.com/docs/logs/vercel/automatic-integration/#need-help)
* [Need to customize which logs to send?](https://betterstack.com/docs/logs/vercel/automatic-integration/#need-to-customize-which-logs-to-send)
* [Advanced usage](https://betterstack.com/docs/logs/vercel/automatic-integration/#advanced-usage)
### Please accept cookies
We use cookies to authenticate users, improve the product user experience, and for [personalized ads](https://business.safety.google/privacy/)
. [Learn more.](https://betterstack.com/privacy)
Deny Accept required Accept all
---
# Explore demos | Demos
###### Explore documentation
* [Explore demos 👋](https://betterstack.com/demos/welcome/)
* [AI SRE & MCP server](https://betterstack.com/demos/ai-sre-and-mcp-server/)
* [Uptime](https://betterstack.com/demos/welcome/)
1. [Incidents](https://betterstack.com/demos/incident-management/)
2. [On-call and escalations](https://betterstack.com/demos/on-call/)
3. [Monitors](https://betterstack.com/demos/monitoring/)
4. [Heartbeats](https://betterstack.com/demos/uptime/heartbeats/)
5. [Status pages](https://betterstack.com/demos/status-page/)
6. [Integrations](https://betterstack.com/demos/uptime/integrations/)
7. [Reporting](https://betterstack.com/demos/reporting/)
8. [API and Terraform](https://betterstack.com/demos/uptime-api/)
* [Telemetry](https://betterstack.com/demos/welcome/)
1. [Sources](https://betterstack.com/demos/services/)
2. [Live tail](https://betterstack.com/demos/live-tail/)
3. [Events](https://betterstack.com/demos/logs/explore/)
4. [Metrics](https://betterstack.com/demos/metrics/)
5. [Alerts](https://betterstack.com/demos/logs/alerts/)
6. [AI SRE ↗](https://betterstack.com/demos/ai-sre-and-mcp-server/)
* [Errors](https://betterstack.com/demos/errors/)
1. [Error tracking](https://betterstack.com/demos/errors-intro/)
* [Warehouse](https://betterstack.com/demos/welcome/)
1. [Sources](https://betterstack.com/demos/warehouse-data/)
2. [Queries as APIs](https://betterstack.com/demos/warehouse-queries/)
3. [Ad-hoc SQL API](https://betterstack.com/demos/warehouse/ad-hoc-sql-api/)
* [Other](https://betterstack.com/demos/welcome/)
1. [Organization and teams](https://betterstack.com/demos/organisation-management/)
Explore demos
=============

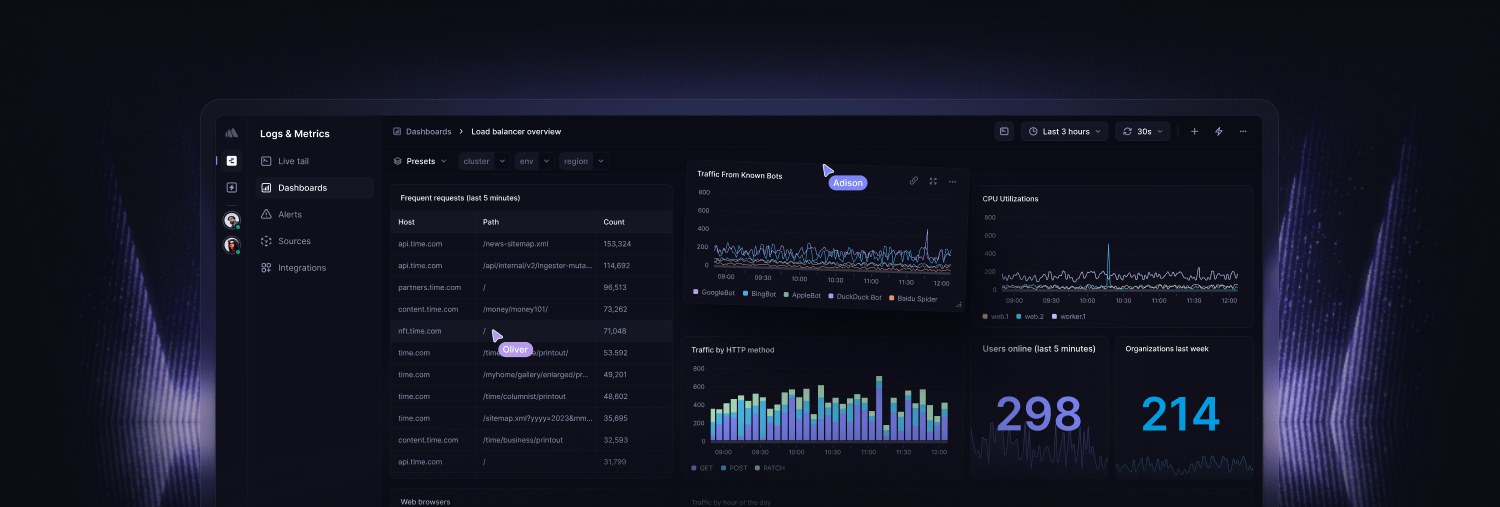
Watch at your own pace
----------------------
Explore the advanced capabilities of Better Stack with demos:
* [Uptime](https://betterstack.com/demos/uptime/)
* [Telemetry](https://betterstack.com/demos/logs/)
* [Errors](https://betterstack.com/demos/errors/)
* [Warehouse](https://betterstack.com/demos/warehouse/)
Looking for docs?
-----------------
Please see our [documentation](https://betterstack.com/docs/uptime/start/)
for more detailed explanations and installation guides.
Have any questions?
-------------------
Please feel free to message us at [hello@betterstack.com](mailto:hello@betterstack.com)
. We'll get back to you as soon as we can, typically within a few hours. 🙏 Thank you!
* * *
[Next article\
\
AI SRE & MCP server](https://betterstack.com/demos/ai-sre-and-mcp-server/)
###### On this page
* [Watch at your own pace](https://betterstack.com/demos/welcome/#watch-at-your-own-pace)
* [Looking for docs?](https://betterstack.com/demos/welcome/#looking-for-docs)
* [Have any questions?](https://betterstack.com/demos/welcome/#have-any-questions)
### Please accept cookies
We use cookies to authenticate users, improve the product user experience, and for [personalized ads](https://business.safety.google/privacy/)
. [Learn more.](https://betterstack.com/privacy)
Deny Accept required Accept all
---
# Get a single group | Better Stack Documentation
###### Explore documentation
* [Welcome to Errors 👋](https://betterstack.com/docs/errors/start/)
1. [JavaScript tag](https://betterstack.com/docs/errors/js-tag/start/)
* [Collecting errors](https://betterstack.com/docs/errors/api/applications-groups/get/)
1. [Integrating using an AI prompt](https://betterstack.com/docs/errors/collecting-errors/ai-prompt/)
2. [Sentry SDK](https://betterstack.com/docs/errors/collecting-errors/sentry-sdk/)
* [Using the product](https://betterstack.com/docs/errors/api/applications-groups/get/)
1. [Exception grouping](https://betterstack.com/docs/errors/using-the-product/exception-grouping/)
2. [Fix with AI](https://betterstack.com/docs/errors/using-the-product/fix-with-ai/)
3. [Releases](https://betterstack.com/docs/errors/using-the-product/releases/)
4. [Uploading source maps](https://betterstack.com/docs/errors/collecting-errors/upload-source-maps/)
* [Integrations](https://betterstack.com/docs/errors/api/applications-groups/get/)
1. [Reporting incidents](https://betterstack.com/docs/errors/integrations/creating-incidents/)
2. [Slack](https://betterstack.com/docs/errors/integrations/slack/)
3. [Microsoft Teams](https://betterstack.com/docs/errors/integrations/ms-teams/)
4. [Linear](https://betterstack.com/docs/errors/integrations/linear/)
5. [Jira](https://betterstack.com/docs/errors/integrations/jira/)
6. [GitHub](https://betterstack.com/docs/errors/integrations/github/)
* [Errors API](https://betterstack.com/docs/errors/api/applications-groups/get/)
1. [Getting an API token](https://betterstack.com/docs/errors/api/getting-api-token/)
2. [Applications API](https://betterstack.com/docs/errors/api/applications/list/)
3. [Application groups API](https://betterstack.com/docs/errors/api/applications-groups/list/)
1. [List all groups GET](https://betterstack.com/docs/errors/api/applications-groups/list/)
2. [Get a single group GET](https://betterstack.com/docs/errors/api/applications-groups/get/)
3. [Create a group POST](https://betterstack.com/docs/errors/api/applications-groups/create/)
4. [Update a group PATCH](https://betterstack.com/docs/errors/api/applications-groups/update/)
5. [Remove a group DELETE](https://betterstack.com/docs/errors/api/applications-groups/delete/)
6. [List applications in a group GET](https://betterstack.com/docs/errors/api/applications-groups/list-applications/)
Get a single group
==================
Retrieves a specific application group by its ID.
GET https://errors.betterstack.com/api/v1/application-groups/{id}
URL parameters
id
required string
The ID of the application group to retrieve.
Headers
Authorization
required string
Bearer `$TOKEN`
200
Returns the requested application group.
Response body
{
"data": {
"id": "5678",
"type": "application_group",
"attributes": {
"name": "production-apps",
"created_at": "2025-01-15T10:25:00.000Z",
"updated_at": "2025-01-15T10:25:00.000Z",
"sort_index": null,
"team_name": "example-team"
}
}
}
401
Unauthorized
Response body
{
"errors": "Invalid authentication"
}
404
Not Found
Response body
{
"errors": "Resource with the provided ID was not found"
}
#### Example cURL
Example
Copied!
curl --request GET \
--url https://errors.betterstack.com/api/v1/application-groups/5678 \
--header "Authorization: Bearer $TOKEN"
* * *
[Previous article\
\
List all groups](https://betterstack.com/docs/errors/api/applications-groups/list/)
[Next article\
\
Create a group](https://betterstack.com/docs/errors/api/applications-groups/create/)
### Please accept cookies
We use cookies to authenticate users, improve the product user experience, and for [personalized ads](https://business.safety.google/privacy/)
. [Learn more.](https://betterstack.com/privacy)
Deny Accept required Accept all
---
# AI SRE & MCP server | Demos
###### Explore documentation
* [Explore demos 👋](https://betterstack.com/demos/welcome/)
* [AI SRE & MCP server](https://betterstack.com/demos/ai-sre-and-mcp-server/)
* [Uptime](https://betterstack.com/demos/ai-sre-and-mcp-server/)
1. [Incidents](https://betterstack.com/demos/incident-management/)
2. [On-call and escalations](https://betterstack.com/demos/on-call/)
3. [Monitors](https://betterstack.com/demos/monitoring/)
4. [Heartbeats](https://betterstack.com/demos/uptime/heartbeats/)
5. [Status pages](https://betterstack.com/demos/status-page/)
6. [Integrations](https://betterstack.com/demos/uptime/integrations/)
7. [Reporting](https://betterstack.com/demos/reporting/)
8. [API and Terraform](https://betterstack.com/demos/uptime-api/)
* [Telemetry](https://betterstack.com/demos/ai-sre-and-mcp-server/)
1. [Sources](https://betterstack.com/demos/services/)
2. [Live tail](https://betterstack.com/demos/live-tail/)
3. [Events](https://betterstack.com/demos/logs/explore/)
4. [Metrics](https://betterstack.com/demos/metrics/)
5. [Alerts](https://betterstack.com/demos/logs/alerts/)
6. [AI SRE ↗](https://betterstack.com/demos/ai-sre-and-mcp-server/)
* [Errors](https://betterstack.com/demos/errors/)
1. [Error tracking](https://betterstack.com/demos/errors-intro/)
* [Warehouse](https://betterstack.com/demos/ai-sre-and-mcp-server/)
1. [Sources](https://betterstack.com/demos/warehouse-data/)
2. [Queries as APIs](https://betterstack.com/demos/warehouse-queries/)
3. [Ad-hoc SQL API](https://betterstack.com/demos/warehouse/ad-hoc-sql-api/)
* [Other](https://betterstack.com/demos/ai-sre-and-mcp-server/)
1. [Organization and teams](https://betterstack.com/demos/organisation-management/)
AI SRE & MCP server
===================
See how you can investigate, debug, and resolve incidents using AI SRE in Better Stack.
MCP Server
----------
Connect AI assistants to your Uptime and Telemetry data through the Model Context Protocol.
* * *
[Previous article\
\
Explore demos](https://betterstack.com/demos/welcome/)
[Next article\
\
Incident management](https://betterstack.com/demos/incident-management/)
###### On this page
* [MCP Server](https://betterstack.com/demos/ai-sre-and-mcp-server/#mcp-server)
### Please accept cookies
We use cookies to authenticate users, improve the product user experience, and for [personalized ads](https://business.safety.google/privacy/)
. [Learn more.](https://betterstack.com/privacy)
Deny Accept required Accept all
---
# Create comment | Better Stack Documentation
###### Explore documentation
* [Welcome to Uptime 👋](https://betterstack.com/docs/uptime/start/)
* [Frequently Asked Questions](https://betterstack.com/docs/uptime/frequently-asked-questions/)
* [On-call scheduling and alerting](https://betterstack.com/docs/uptime/api/create-a-new-comment/)
1. [Get started](https://betterstack.com/docs/uptime/getting-started-with-oncall-v2/)
2. [Slack and other integrations ↗](https://betterstack.com/docs/uptime/slack/)
3. [Connecting external calendars](https://betterstack.com/docs/uptime/connecting-external-calendars/)
4. [Advanced guide](https://betterstack.com/docs/uptime/escalation-policies/)
* [Incidents](https://betterstack.com/docs/uptime/api/create-a-new-comment/)
1. [Get started](https://betterstack.com/docs/uptime/working-with-incidents/)
2. [Advanced guide](https://betterstack.com/docs/uptime/post-mortems/)
3. [Reporting ↗](https://betterstack.com/docs/getting-started/team-and-account-management/reporting/)
* [Monitoring](https://betterstack.com/docs/uptime/api/create-a-new-comment/)
1. [Get started](https://betterstack.com/docs/uptime/monitoring-start/)
2. [Working with monitors](https://betterstack.com/docs/uptime/bulk-importing-monitors/)
3. [Customizing monitors](https://betterstack.com/docs/uptime/naming-monitors/)
4. [Monitor types](https://betterstack.com/docs/uptime/uptime-monitor/)
* [Status pages](https://betterstack.com/docs/uptime/api/create-a-new-comment/)
1. [Get started](https://betterstack.com/docs/uptime/getting-started-with-status-pages/)
2. [Advanced guide](https://betterstack.com/docs/uptime/custom-subdomain/)
* [Uptime API](https://betterstack.com/docs/uptime/api/create-a-new-comment/)
1. [Getting an API token](https://betterstack.com/docs/uptime/api/getting-started-with-uptime-api/)
2. [Monitors](https://betterstack.com/docs/uptime/api/list-all-existing-monitors/)
3. [Heartbeats](https://betterstack.com/docs/uptime/api/list-all-existing-hearbeats/)
4. [On-call & incidents](https://betterstack.com/docs/uptime/api/on-call-calendar/)
1. [On-call schedule](https://betterstack.com/docs/uptime/api/list-all-existing-on-call-calendars/)
2. [On-call schedule events](https://betterstack.com/docs/uptime/api/list-on-call-calendar-events/)
3. [On-call schedule rotations](https://betterstack.com/docs/uptime/api/get-on-call-calendar-rotation/)
4. [Escalation policies](https://betterstack.com/docs/uptime/api/list-all-escalation-policies/)
5. [Escalation policy groups](https://betterstack.com/docs/uptime/api/list-all-existing-escalation-policy-groups/)
6. [Severities](https://betterstack.com/docs/uptime/api/list-all-severities/)
7. [Severity groups](https://betterstack.com/docs/uptime/api/list-all-existing-severity-groups/)
8. [Incidents](https://betterstack.com/docs/uptime/api/list-all-incidents/)
9. [Comments](https://betterstack.com/docs/uptime/api/list-all-comments/)
1. [List comments GET](https://betterstack.com/docs/uptime/api/list-all-comments/)
2. [Get comment GET](https://betterstack.com/docs/uptime/api/list-a-single-comment/)
3. [Create comment POST](https://betterstack.com/docs/uptime/api/create-a-new-comment/)
4. [Update comment PATCH](https://betterstack.com/docs/uptime/api/update-a-comment/)
5. [Remove comment DELETE](https://betterstack.com/docs/uptime/api/delete-an-existing-comment/)
5. [Status pages](https://betterstack.com/docs/uptime/api/list-all-existing-status-pages/)
6. [Metadata](https://betterstack.com/docs/uptime/api/metadata/)
7. [Integrations](https://betterstack.com/docs/uptime/api/list-all-new-relic-integrations/)
8. [Team members](https://betterstack.com/docs/uptime/api/team-members/list/)
Create comment
==============
This will create a new comment.
POST https://uptime.betterstack.com/api/v2/incidents/{incident\_id}/comments
URL parameters
incident\_id
required string
The ID of the incident
Headers
Authorization
required string
Bearer `$TOKEN`
Content\_Type
string
application/json
Body parameters
content
required string
The content of the comment. [Markdown](https://www.markdownguide.org/basic-syntax/)
is supported for formatting.
201
The comment was successfully created
Response body
{
"data": {
"id": "123",
"type": "incident_comment",
"attributes": {
"id": 123,
"content": "posted from API",
"created_at": "2025-06-03T12:10:28.357Z",
"updated_at": "2025-06-03T12:10:28.357Z"
}
}
}
403
Authentication failed
#### Example cURL
Simple text Rich-formatted comment
Copied!
curl --request POST \
--url https://uptime.betterstack.com/api/v2/incidents/1/comments \
--header "Authorization: Bearer $TOKEN" \
--header 'Content-Type: application/json' \
--data '{"content": "Posted from API"}'
curl --request POST \
--url https://uptime.betterstack.com/api/v2/incidents/1/comments \
--header "Authorization: Bearer $TOKEN" \
--header 'Content-Type: application/json' \
--data '{
"content": "# 🚨 Incident Update\n\nHere is the current system status:\n\n| Component | Status |\n|-----------|--------------|\n| API | ✅ Operational |\n| Database | 🔄 Restarting |\n| Cache | ❌ Down |\n\n_Updated automatically via API._"
}'
* * *
[Previous article\
\
Get comment](https://betterstack.com/docs/uptime/api/list-a-single-comment/)
[Next article\
\
Update comment](https://betterstack.com/docs/uptime/api/update-a-comment/)
### Please accept cookies
We use cookies to authenticate users, improve the product user experience, and for [personalized ads](https://business.safety.google/privacy/)
. [Learn more.](https://betterstack.com/privacy)
Deny Accept required Accept all
---
# SSL certificate checks | Better Stack Documentation
###### Explore documentation
* [Welcome to Uptime 👋](https://betterstack.com/docs/uptime/start/)
* [Frequently Asked Questions](https://betterstack.com/docs/uptime/frequently-asked-questions/)
* [On-call scheduling and alerting](https://betterstack.com/docs/uptime/ssl-certificate-checks/)
1. [Get started](https://betterstack.com/docs/uptime/getting-started-with-oncall-v2/)
2. [Slack and other integrations ↗](https://betterstack.com/docs/uptime/slack/)
3. [Connecting external calendars](https://betterstack.com/docs/uptime/connecting-external-calendars/)
4. [Advanced guide](https://betterstack.com/docs/uptime/escalation-policies/)
* [Incidents](https://betterstack.com/docs/uptime/ssl-certificate-checks/)
1. [Get started](https://betterstack.com/docs/uptime/working-with-incidents/)
2. [Advanced guide](https://betterstack.com/docs/uptime/post-mortems/)
3. [Reporting ↗](https://betterstack.com/docs/getting-started/team-and-account-management/reporting/)
* [Monitoring](https://betterstack.com/docs/uptime/ssl-certificate-checks/)
1. [Get started](https://betterstack.com/docs/uptime/monitoring-start/)
2. [Working with monitors](https://betterstack.com/docs/uptime/bulk-importing-monitors/)
3. [Customizing monitors](https://betterstack.com/docs/uptime/naming-monitors/)
1. [Naming monitors](https://betterstack.com/docs/uptime/naming-monitors/)
2. [Check frequency](https://betterstack.com/docs/uptime/check-frequency/)
3. [Request timeout](https://betterstack.com/docs/uptime/request-timeout/)
4. [Confirmation and recovery period](https://betterstack.com/docs/uptime/confirmation-and-recovery-period/)
5. [Domain expiration checks](https://betterstack.com/docs/uptime/domain-expiration-checks/)
6. [SSL certificate checks](https://betterstack.com/docs/uptime/ssl-certificate-checks/)
7. [Cache busting](https://betterstack.com/docs/uptime/cache-busting-in-monitoring/)
8. [Locations and regions](https://betterstack.com/docs/uptime/locations-and-regions/)
9. [Request parameters, headers and HTTP authentication](https://betterstack.com/docs/uptime/request-parameters-headers-and-http-authentication/)
10. [Github badge](https://betterstack.com/docs/uptime/github-badge/)
4. [Monitor types](https://betterstack.com/docs/uptime/uptime-monitor/)
* [Status pages](https://betterstack.com/docs/uptime/ssl-certificate-checks/)
1. [Get started](https://betterstack.com/docs/uptime/getting-started-with-status-pages/)
2. [Advanced guide](https://betterstack.com/docs/uptime/custom-subdomain/)
* [Uptime API](https://betterstack.com/docs/uptime/ssl-certificate-checks/)
1. [Getting an API token](https://betterstack.com/docs/uptime/api/getting-started-with-uptime-api/)
2. [Monitors](https://betterstack.com/docs/uptime/api/list-all-existing-monitors/)
3. [Heartbeats](https://betterstack.com/docs/uptime/api/list-all-existing-hearbeats/)
4. [On-call & incidents](https://betterstack.com/docs/uptime/api/on-call-calendar/)
5. [Status pages](https://betterstack.com/docs/uptime/api/list-all-existing-status-pages/)
6. [Metadata](https://betterstack.com/docs/uptime/api/metadata/)
7. [Integrations](https://betterstack.com/docs/uptime/api/list-all-new-relic-integrations/)
8. [Team members](https://betterstack.com/docs/uptime/api/team-members/list/)
SSL certificate checks
======================
The SSL certificate checks allow you to monitor both the current validity of the SSL/TLS certificate and the expiration date of the certificate.
To change the settings monitor's SSL certificate checks, go to [Monitors](https://uptime.betterstack.com/team/0/monitors)
→ **Select a monitor** → **Configure** → **Advanced settings**:
* To check the security certificates of the monitored URL, set the **SSL/TLS verification** dropdown to `On`.
The SSL/TLS verification is done together with the main check. The frequency is therefore the same as the monitor's check frequency settings.
* To change the certificate expiry monitoring, select your preferred monitoring timeframe.
Bear in mind that changing the settings for the SSL expiration will automatically update the SSL expiration settings for all monitors with this domain in your team.
The SSL expiration is checked every hour, so it can take up to an hour for the SSL expiration incident to auto-resolve.
* * *
[Previous article\
\
Domain expiration checks](https://betterstack.com/docs/uptime/domain-expiration-checks/)
[Next article\
\
Cache busting in monitoring](https://betterstack.com/docs/uptime/cache-busting-in-monitoring/)
### Please accept cookies
We use cookies to authenticate users, improve the product user experience, and for [personalized ads](https://business.safety.google/privacy/)
. [Learn more.](https://betterstack.com/privacy)
Deny Accept required Accept all
---
# Github badge | Better Stack Documentation
###### Explore documentation
* [Welcome to Uptime 👋](https://betterstack.com/docs/uptime/start/)
* [Frequently Asked Questions](https://betterstack.com/docs/uptime/frequently-asked-questions/)
* [On-call scheduling and alerting](https://betterstack.com/docs/uptime/github-badge/)
1. [Get started](https://betterstack.com/docs/uptime/getting-started-with-oncall-v2/)
2. [Slack and other integrations ↗](https://betterstack.com/docs/uptime/slack/)
3. [Connecting external calendars](https://betterstack.com/docs/uptime/connecting-external-calendars/)
4. [Advanced guide](https://betterstack.com/docs/uptime/escalation-policies/)
* [Incidents](https://betterstack.com/docs/uptime/github-badge/)
1. [Get started](https://betterstack.com/docs/uptime/working-with-incidents/)
2. [Advanced guide](https://betterstack.com/docs/uptime/post-mortems/)
3. [Reporting ↗](https://betterstack.com/docs/getting-started/team-and-account-management/reporting/)
* [Monitoring](https://betterstack.com/docs/uptime/github-badge/)
1. [Get started](https://betterstack.com/docs/uptime/monitoring-start/)
2. [Working with monitors](https://betterstack.com/docs/uptime/bulk-importing-monitors/)
3. [Customizing monitors](https://betterstack.com/docs/uptime/naming-monitors/)
1. [Naming monitors](https://betterstack.com/docs/uptime/naming-monitors/)
2. [Check frequency](https://betterstack.com/docs/uptime/check-frequency/)
3. [Request timeout](https://betterstack.com/docs/uptime/request-timeout/)
4. [Confirmation and recovery period](https://betterstack.com/docs/uptime/confirmation-and-recovery-period/)
5. [Domain expiration checks](https://betterstack.com/docs/uptime/domain-expiration-checks/)
6. [SSL certificate checks](https://betterstack.com/docs/uptime/ssl-certificate-checks/)
7. [Cache busting](https://betterstack.com/docs/uptime/cache-busting-in-monitoring/)
8. [Locations and regions](https://betterstack.com/docs/uptime/locations-and-regions/)
9. [Request parameters, headers and HTTP authentication](https://betterstack.com/docs/uptime/request-parameters-headers-and-http-authentication/)
10. [Github badge](https://betterstack.com/docs/uptime/github-badge/)
4. [Monitor types](https://betterstack.com/docs/uptime/uptime-monitor/)
* [Status pages](https://betterstack.com/docs/uptime/github-badge/)
1. [Get started](https://betterstack.com/docs/uptime/getting-started-with-status-pages/)
2. [Advanced guide](https://betterstack.com/docs/uptime/custom-subdomain/)
* [Uptime API](https://betterstack.com/docs/uptime/github-badge/)
1. [Getting an API token](https://betterstack.com/docs/uptime/api/getting-started-with-uptime-api/)
2. [Monitors](https://betterstack.com/docs/uptime/api/list-all-existing-monitors/)
3. [Heartbeats](https://betterstack.com/docs/uptime/api/list-all-existing-hearbeats/)
4. [On-call & incidents](https://betterstack.com/docs/uptime/api/on-call-calendar/)
5. [Status pages](https://betterstack.com/docs/uptime/api/list-all-existing-status-pages/)
6. [Metadata](https://betterstack.com/docs/uptime/api/metadata/)
7. [Integrations](https://betterstack.com/docs/uptime/api/list-all-new-relic-integrations/)
8. [Team members](https://betterstack.com/docs/uptime/api/team-members/list/)
Github badge
============
This badge will automatically show the status of the monitor (up or down) directly in your README.md on GitHub.
To find your GitHub badge code, go to [Monitors](https://uptime.betterstack.com/team/0/monitors)
→ **Select a monitor** → **Configure** → **Advanced settings**. To add it, copy the markdown code in your monitor's advanced settings and paste it to the top of your README.md file.
The badge code can be used anywhere, not just on GitHub, so feel free to get creative. 🎨
* * *
[Previous article\
\
Request parameters, headers and HTTP authentication](https://betterstack.com/docs/uptime/request-parameters-headers-and-http-authentication/)
[Next article\
\
Uptime monitor](https://betterstack.com/docs/uptime/uptime-monitor/)
### Please accept cookies
We use cookies to authenticate users, improve the product user experience, and for [personalized ads](https://business.safety.google/privacy/)
. [Learn more.](https://betterstack.com/privacy)
Deny Accept required Accept all
---
# Create a group | Better Stack Documentation
###### Explore documentation
* [Welcome to Errors 👋](https://betterstack.com/docs/errors/start/)
1. [JavaScript tag](https://betterstack.com/docs/errors/js-tag/start/)
* [Collecting errors](https://betterstack.com/docs/errors/api/applications-groups/create/)
1. [Integrating using an AI prompt](https://betterstack.com/docs/errors/collecting-errors/ai-prompt/)
2. [Sentry SDK](https://betterstack.com/docs/errors/collecting-errors/sentry-sdk/)
* [Using the product](https://betterstack.com/docs/errors/api/applications-groups/create/)
1. [Exception grouping](https://betterstack.com/docs/errors/using-the-product/exception-grouping/)
2. [Fix with AI](https://betterstack.com/docs/errors/using-the-product/fix-with-ai/)
3. [Releases](https://betterstack.com/docs/errors/using-the-product/releases/)
4. [Uploading source maps](https://betterstack.com/docs/errors/collecting-errors/upload-source-maps/)
* [Integrations](https://betterstack.com/docs/errors/api/applications-groups/create/)
1. [Reporting incidents](https://betterstack.com/docs/errors/integrations/creating-incidents/)
2. [Slack](https://betterstack.com/docs/errors/integrations/slack/)
3. [Microsoft Teams](https://betterstack.com/docs/errors/integrations/ms-teams/)
4. [Linear](https://betterstack.com/docs/errors/integrations/linear/)
5. [Jira](https://betterstack.com/docs/errors/integrations/jira/)
6. [GitHub](https://betterstack.com/docs/errors/integrations/github/)
* [Errors API](https://betterstack.com/docs/errors/api/applications-groups/create/)
1. [Getting an API token](https://betterstack.com/docs/errors/api/getting-api-token/)
2. [Applications API](https://betterstack.com/docs/errors/api/applications/list/)
3. [Application groups API](https://betterstack.com/docs/errors/api/applications-groups/list/)
1. [List all groups GET](https://betterstack.com/docs/errors/api/applications-groups/list/)
2. [Get a single group GET](https://betterstack.com/docs/errors/api/applications-groups/get/)
3. [Create a group POST](https://betterstack.com/docs/errors/api/applications-groups/create/)
4. [Update a group PATCH](https://betterstack.com/docs/errors/api/applications-groups/update/)
5. [Remove a group DELETE](https://betterstack.com/docs/errors/api/applications-groups/delete/)
6. [List applications in a group GET](https://betterstack.com/docs/errors/api/applications-groups/list-applications/)
Create a group
==============
Creates a new application group.
POST https://errors.betterstack.com/api/v1/application-groups
Headers
Authorization
required string
Bearer `$TOKEN`
Content-Type
required string
application/json
Body parameters
name
required string
Application group name. Must be unique within your team.
platform
string
Platform type for the application group. Automatically set to `errors`.
201
Returns the newly created application group.
Response body
{
"data": {
"id": "5678",
"type": "application_group",
"attributes": {
"name": "new-production-group",
"created_at": "2025-01-15T10:25:00.000Z",
"updated_at": "2025-01-15T10:25:00.000Z",
"sort_index": null,
"team_name": "example-team"
}
}
}
401
Unauthorized
Response body
{
"errors": "Invalid authentication"
}
400
Bad Request - Missing Required Attributes
Response body
{
"errors": "Sorry, you are missing some required attributes",
"required_attributes": [\
"name"\
]
}
422
Unprocessable Entity - Validation Errors
Response body
{
"errors": "Validation errors",
"invalid_attributes": {
"name": [\
"can't be blank"\
]
}
}
#### Example cURL
Example
Copied!
curl --request POST \
--url https://errors.betterstack.com/api/v1/application-groups \
--header "Authorization: Bearer $TOKEN" \
--header 'Content-Type: application/json' \
--data '{
"name": "new-production-group"
}'
* * *
[Previous article\
\
Get a single group](https://betterstack.com/docs/errors/api/applications-groups/get/)
[Next article\
\
Update a group](https://betterstack.com/docs/errors/api/applications-groups/update/)
### Please accept cookies
We use cookies to authenticate users, improve the product user experience, and for [personalized ads](https://business.safety.google/privacy/)
. [Learn more.](https://betterstack.com/privacy)
Deny Accept required Accept all
---
# Hosting data in your own bucket | Better Stack Documentation
###### Explore documentation
* [Welcome to Telemetry 👋](https://betterstack.com/docs/logs/start/)
* [Quick start guide](https://betterstack.com/docs/logs/logging-start/)
* [Wide events vs. metrics](https://betterstack.com/docs/logs/wide-events-time-series/)
* [Ingesting data](https://betterstack.com/docs/logs/host-data-in-your-own-bucket/)
1. [Better Stack collector](https://betterstack.com/docs/logs/collector/)
2. [Vector](https://betterstack.com/docs/logs/vector/)
3. [OpenTelemetry](https://betterstack.com/docs/logs/open-telemetry/)
4. [Ingesting via HTTP API](https://betterstack.com/docs/logs/ingesting-data/http/logs/)
5. [Ingesting metrics](https://betterstack.com/docs/logs/ingesting-data/metrics/prometheus-scrape/)
6. [Ingesting logs](https://betterstack.com/docs/logs/ingesting-data/logs/docker-kubernetes/)
7. [Migrating to Better Stack](https://betterstack.com/docs/logs/datadog-agent/)
* [Using the product](https://betterstack.com/docs/logs/host-data-in-your-own-bucket/)
1. [AI SRE ↗](https://betterstack.com/demos/ai-sre/)
2. [MCP server ↗](https://betterstack.com/docs/getting-started/integrations/mcp/)
3. [Transforming ingested data](https://betterstack.com/docs/logs/using-logtail/transforming-ingested-data/logs-vrl/)
4. [Querying data](https://betterstack.com/docs/logs/using-logtail/live-tail-query-language/)
1. [Live tail](https://betterstack.com/docs/logs/using-logtail/live-tail-query-language/)
2. [Events](https://betterstack.com/docs/logs/using-logtail/explore-logs/)
3. [Dashboards](https://betterstack.com/docs/logs/dashboards/getting-started/)
4. [SQL API](https://betterstack.com/docs/logs/query-api/connect-remotely/)
5. [Query boost](https://betterstack.com/docs/logs/query-boost/)
6. [Faster queries](https://betterstack.com/docs/logs/faster-queries/)
7. [Host data in own bucket](https://betterstack.com/docs/logs/host-data-in-your-own-bucket/)
5. [Tracing](https://betterstack.com/docs/logs/tracing/)
6. [Alerts](https://betterstack.com/docs/logs/dashboards/alerts/)
* [Telemetry API](https://betterstack.com/docs/logs/host-data-in-your-own-bucket/)
1. [Getting an API token](https://betterstack.com/docs/logs/api/getting-started/)
2. [Sources & collectors](https://betterstack.com/docs/logs/api/list-all-existing-sources/)
3. [Dashboards](https://betterstack.com/docs/logs/api/dashboards/list/)
4. [Explorations](https://betterstack.com/docs/logs/api/explorations/list/)
5. [Alerts API](https://betterstack.com/docs/logs/api/alerts/list/)
6. [Connections API](https://betterstack.com/docs/logs/api/connections/list/)
7. [Query API ↗](https://betterstack.com/docs/logs/query-api/connect-remotely/)
* [Alternative to](https://betterstack.com/docs/logs/host-data-in-your-own-bucket/)
1. [Lightstep](https://betterstack.com/docs/logs/alternative-to/lightstep/)
Hosting data in your own bucket
===============================
You can store your telemetry data in a bucket you control. This is useful for:
* Keeping a long-term archive of your data.
* Having tight control over storing sensitive data.
* Retaining data beyond the standard retention period.
This feature is available for any **S3-compatible service**, such as AWS S3, CloudFlare R2, DigitalOcean Spaces, etc. We recommend using [Cloudflare R2](https://www.cloudflare.com/products/r2/)
since it doesn't charge for egress fees.
This is a [billable feature](https://betterstack.com/pricing?utm_content=callout&utm_medium=docs-logs&utm_source=community&utm_term=docs-logs-source-custom-bucket#logs)
that **cannot be changed** after a source is created.
Set up your source
------------------
1. Go to Telemetry -> Sources -> [Connect source](https://telemetry.betterstack.com/team/0/sources/new)
.
2. After configuring basic information, **scroll down to Advanced settings**.
3. Choose your provider and **fill in the bucket access details**.
4. Create your source, and start sending your data 🚀

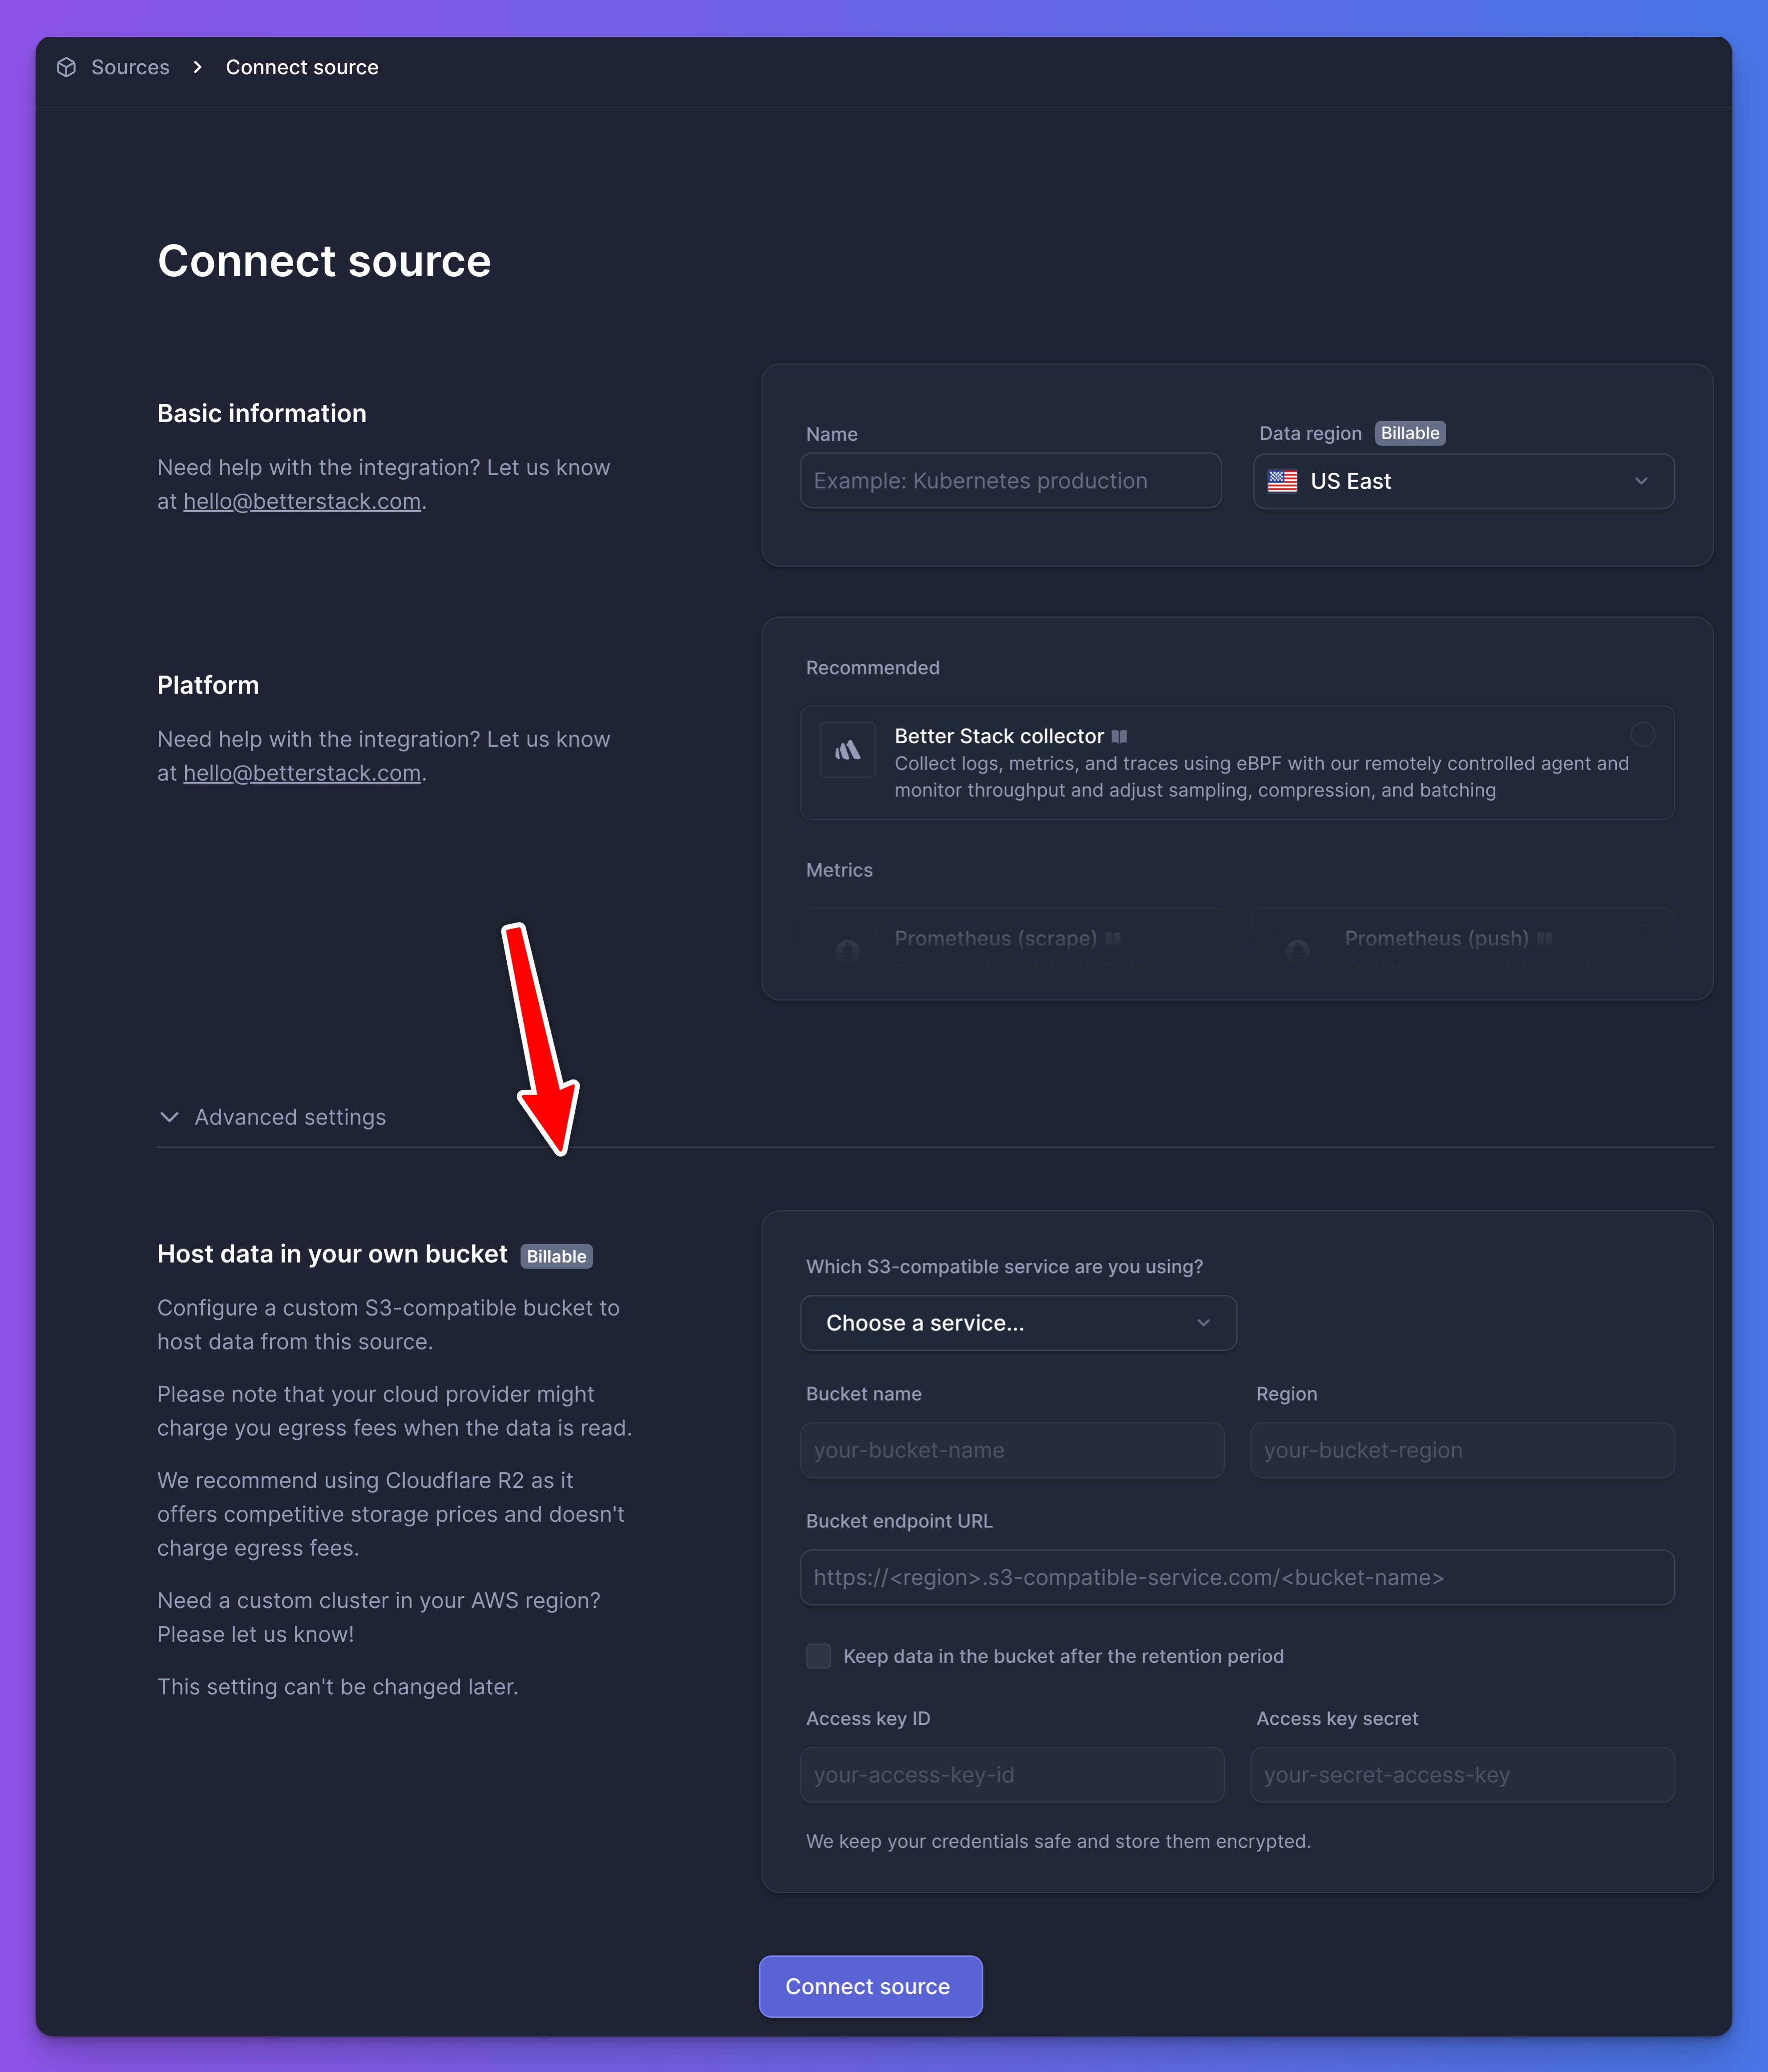
#### Unsure about how to configure your storage or need a custom setup?
Please let us know at [hello@betterstack.com](mailto:hello@betterstack.com)
. We're happy to help! 🙏
Data retention
--------------
By default, the data will be automatically removed from your bucket after the logs data retention.
You can choose to keep the data in the bucket after your retention period ends. This ensures **you keep a permanent copy**, even if logs are no longer accessible in Better Stack.
While creating your source, enable the **Keep data after retention** option.

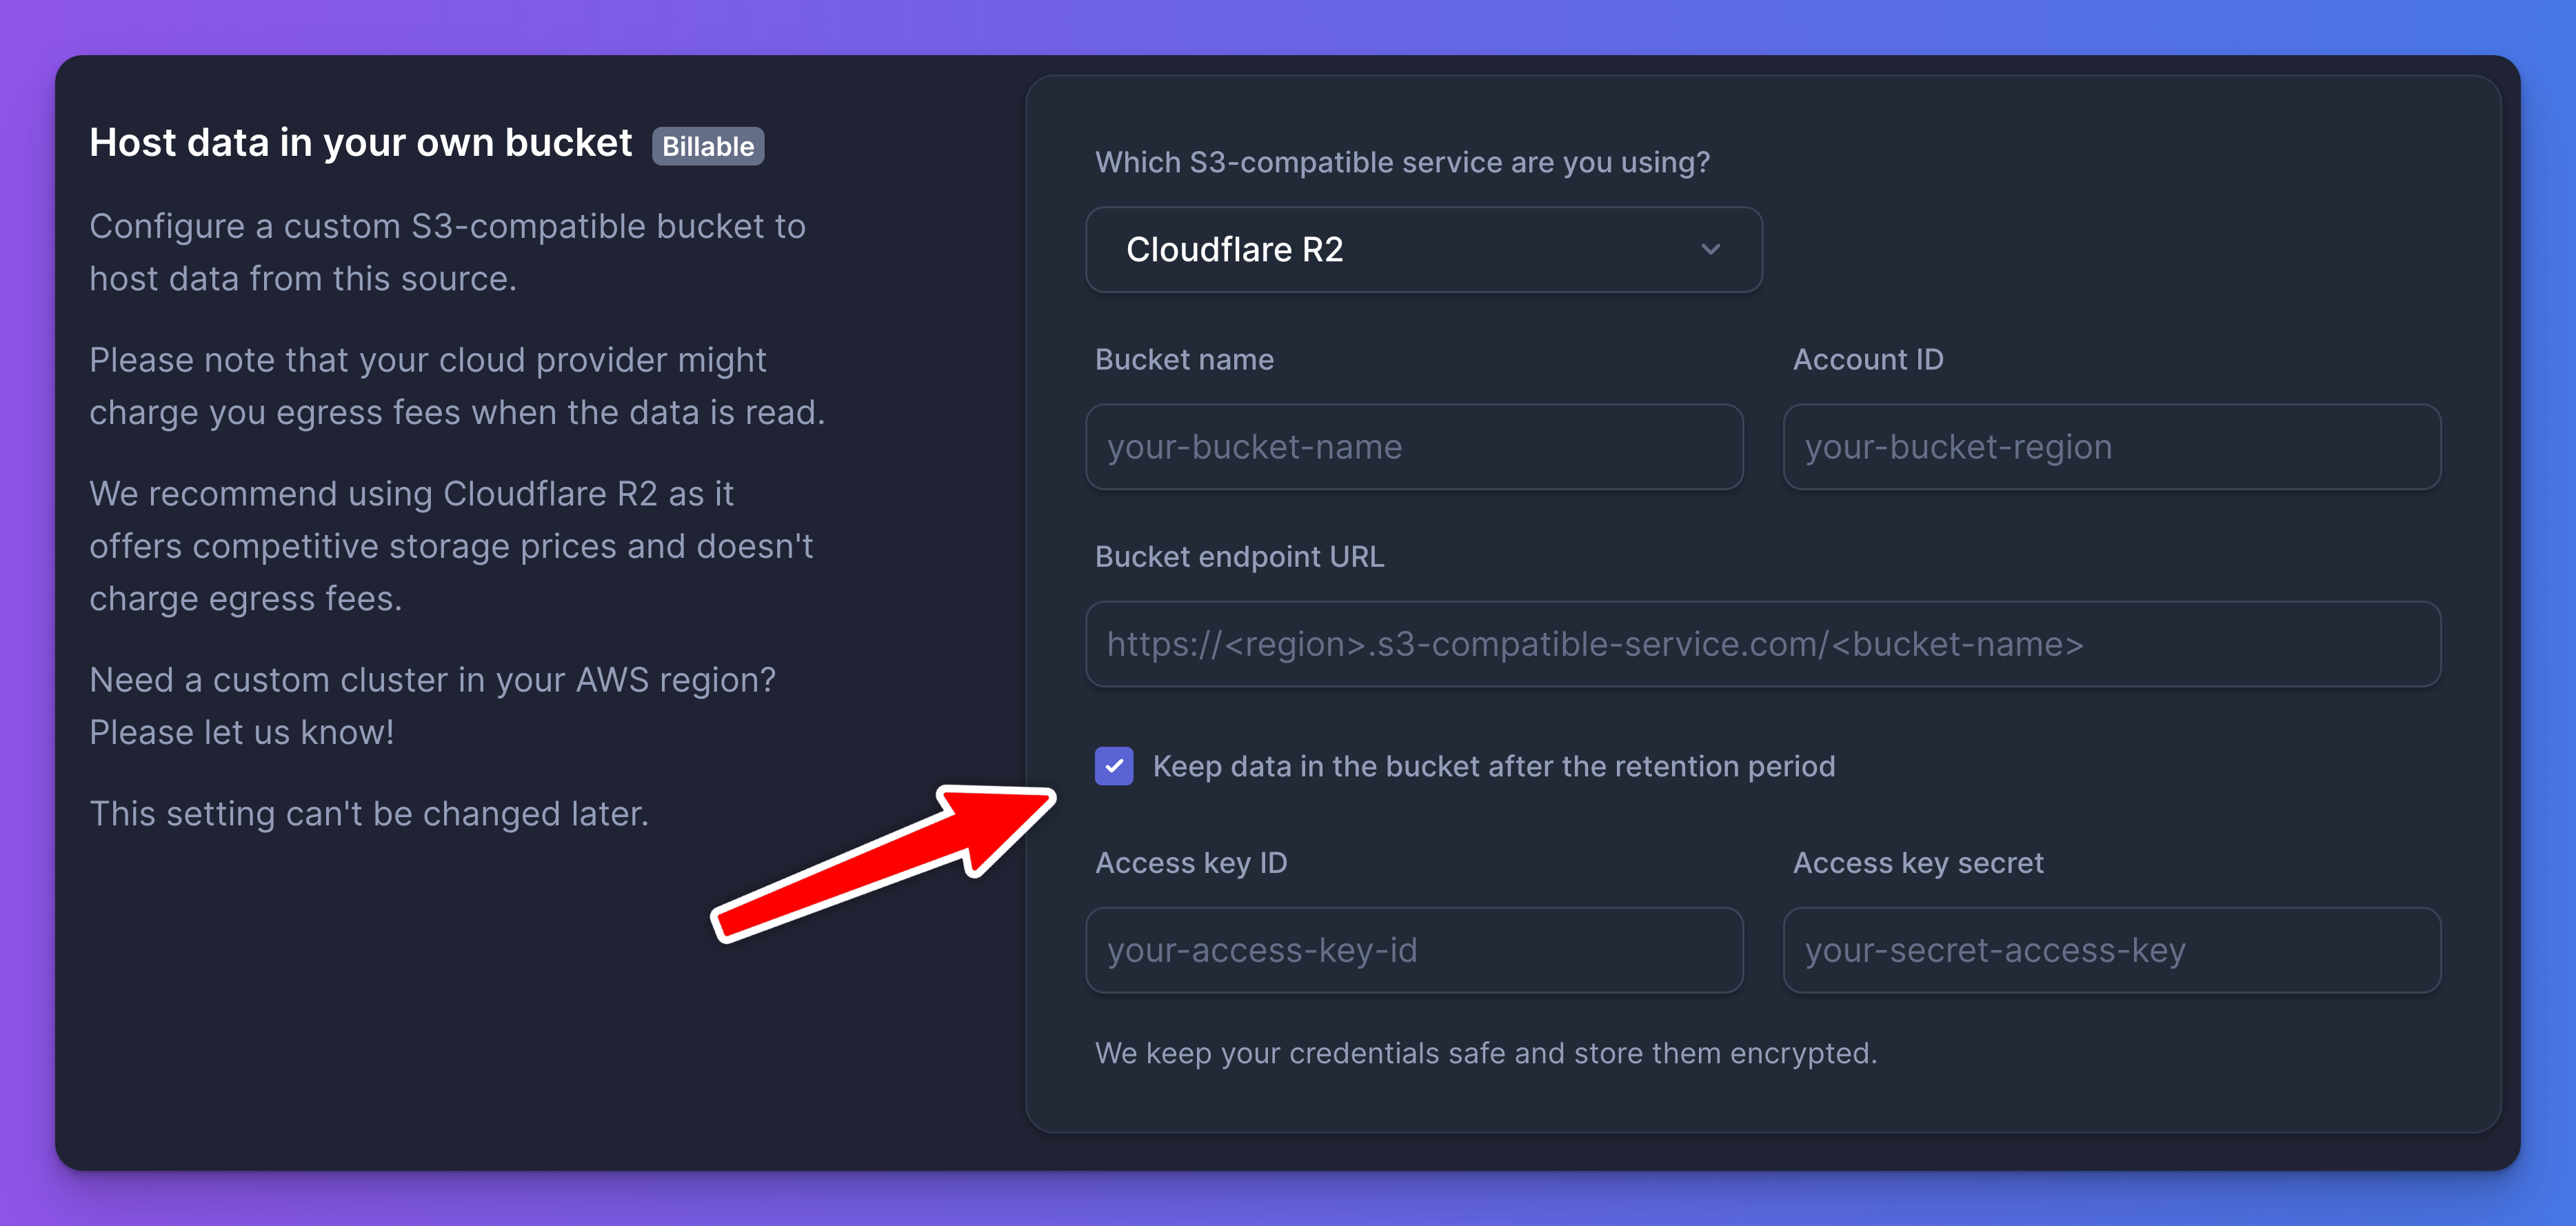
File format
-----------
The log files stored in your bucket are in the [ClickHouse Native format](https://clickhouse.com/docs/interfaces/formats/Native)
. This enables highly efficient storage and querying.
You can inspect and query the files using the [clickhouse-local](https://clickhouse.com/docs/en/operations/utilities/clickhouse-local)
tool.
### Querying log files with ClickHouse
To query your log files directly from S3:
1. [Install clickhouse-local](https://clickhouse.com/docs/operations/utilities/clickhouse-local#download-clickhouse-local)
for your OS.
2. Use the [ClickHouse s3 table function](https://clickhouse.com/docs/sql-reference/table-functions/s3)
to query your files.
Query logs from S3 directly
Copied!
./clickhouse local \
-q "SELECT dt, raw
FROM s3(
'https://.s3-compatible-service.com///',
'',
''
)
ORDER BY dt DESC
LIMIT 500"
To find out the structure of the data in any file:
Find out the structure of data in any file
Copied!
./clickhouse local \
-q "DESCRIBE s3(
'https://.s3-compatible-service.com///',
'',
''
)"
### Downloading log files for local analysis (Optional)
If you prefer to download and analyze your logs locally:
1. Download any file from your bucket. No need to decompress the file - the native format is handled directly.
2. Run `./clickhouse local` with your query, replacing `FROM s3(...)` with `FROM file(...)`:
Query downloaded logs using SQL
Copied!
./clickhouse local \
-q "SELECT dt, raw
FROM file('')
ORDER BY dt DESC
LIMIT 500"
### Search your logs
You can use ClickHouse SQL as you would in [Explore](https://betterstack.com/docs/logs/using-logtail/explore-logs/)
.
Search logs containing "search term"
Copied!
./clickhouse local \
-q "SELECT dt, raw
FROM s3(
'https://.s3-compatible-service.com///',
'',
''
)
WHERE raw ILIKE '%search term%'
ORDER BY dt DESC
LIMIT 500"
#### Export to CSV, JSON, etc
You can use any ClickHouse-supported format with `--output-format`.
Export to ND-JSON
Copied!
./clickhouse local \
--output-format=JSONEachRow \
-q "SELECT dt, raw
FROM s3(
'https://.s3-compatible-service.com///',
'',
''
)"
Read more about [output formats in our Connection API](https://betterstack.com/docs/logs/query-api/connect-remotely/#output-formats)
docs.
* * *
[Previous article\
\
Faster queries](https://betterstack.com/docs/logs/faster-queries/)
[Next article\
\
Distributed tracing with Better Stack](https://betterstack.com/docs/logs/tracing/)
###### On this page
* [Set up your source](https://betterstack.com/docs/logs/host-data-in-your-own-bucket/#set-up-your-source)
* [Data retention](https://betterstack.com/docs/logs/host-data-in-your-own-bucket/#data-retention)
* [File format](https://betterstack.com/docs/logs/host-data-in-your-own-bucket/#file-format)
### Please accept cookies
We use cookies to authenticate users, improve the product user experience, and for [personalized ads](https://business.safety.google/privacy/)
. [Learn more.](https://betterstack.com/privacy)
Deny Accept required Accept all
---
# Response attributes | Better Stack Documentation
###### Explore documentation
* [Welcome to Uptime 👋](https://betterstack.com/docs/uptime/start/)
* [Frequently Asked Questions](https://betterstack.com/docs/uptime/frequently-asked-questions/)
* [On-call scheduling and alerting](https://betterstack.com/docs/uptime/api/metadata-api-response-params/)
1. [Get started](https://betterstack.com/docs/uptime/getting-started-with-oncall-v2/)
2. [Slack and other integrations ↗](https://betterstack.com/docs/uptime/slack/)
3. [Connecting external calendars](https://betterstack.com/docs/uptime/connecting-external-calendars/)
4. [Advanced guide](https://betterstack.com/docs/uptime/escalation-policies/)
* [Incidents](https://betterstack.com/docs/uptime/api/metadata-api-response-params/)
1. [Get started](https://betterstack.com/docs/uptime/working-with-incidents/)
2. [Advanced guide](https://betterstack.com/docs/uptime/post-mortems/)
3. [Reporting ↗](https://betterstack.com/docs/getting-started/team-and-account-management/reporting/)
* [Monitoring](https://betterstack.com/docs/uptime/api/metadata-api-response-params/)
1. [Get started](https://betterstack.com/docs/uptime/monitoring-start/)
2. [Working with monitors](https://betterstack.com/docs/uptime/bulk-importing-monitors/)
3. [Customizing monitors](https://betterstack.com/docs/uptime/naming-monitors/)
4. [Monitor types](https://betterstack.com/docs/uptime/uptime-monitor/)
* [Status pages](https://betterstack.com/docs/uptime/api/metadata-api-response-params/)
1. [Get started](https://betterstack.com/docs/uptime/getting-started-with-status-pages/)
2. [Advanced guide](https://betterstack.com/docs/uptime/custom-subdomain/)
* [Uptime API](https://betterstack.com/docs/uptime/api/metadata-api-response-params/)
1. [Getting an API token](https://betterstack.com/docs/uptime/api/getting-started-with-uptime-api/)
2. [Monitors](https://betterstack.com/docs/uptime/api/list-all-existing-monitors/)
3. [Heartbeats](https://betterstack.com/docs/uptime/api/list-all-existing-hearbeats/)
4. [On-call & incidents](https://betterstack.com/docs/uptime/api/on-call-calendar/)
5. [Status pages](https://betterstack.com/docs/uptime/api/list-all-existing-status-pages/)
6. [Metadata](https://betterstack.com/docs/uptime/api/metadata/)
1. [Metadata API](https://betterstack.com/docs/uptime/api/list-all-existing-metadata/)
1. [List metadata GET](https://betterstack.com/docs/uptime/api/list-all-existing-metadata/)
2. [Update metadata POST](https://betterstack.com/docs/uptime/api/update-an-existing-metadata-record/)
3. [Response attributes](https://betterstack.com/docs/uptime/api/metadata-api-response-params/)
7. [Integrations](https://betterstack.com/docs/uptime/api/list-all-new-relic-integrations/)
8. [Team members](https://betterstack.com/docs/uptime/api/team-members/list/)
Response attributes
===================
Response parameters
-------------------
#### Namespace `data`
| Parameter | Type | Values |
| --- | --- | --- |
| `id` | String | ID of the metadata record. |
| `type` | String | `metadata` |
| `attributes` | Object | Attributes object. See below. |
| `attributes.key` | String | Key of the key-value pair. |
| `attributes.values.[]` | MetadataValue | An array of metadata values. See the [MetadataValue section](https://betterstack.com/docs/uptime/api/metadata-api-response-params/#metadatavalue)
below for attribute details. |
| `attributes.team_name` | String | The team this metadata belongs to. |
| `attributes.owner_id` | String | ID of the owner. |
| `attributes.owner_type` | String | Type of the owner, possible values are `Monitor`, `Heartbeat`, `Incident`, `WebhookIntegration`, `EmailIntegration`, `IncomingWebhook`, or `CallRouting`. |
### MetadataValue
| Parameter | Type | Values |
| --- | --- | --- |
| `type` | String | Type of the metadata value, possible values are `String`, `User`, `Team`, `Policy`, `Schedule`, `SlackIntegration`, `LinearIntegration`, `JiraIntegration`, `MicrosoftTeamsWebhook`, `ZapierWebhook`, `NativeWebhook`, or `PagerDutyWebhook`. Default: `String`. |
| `value` | String | String value of the metadata value object. Used only if `type` is `String`. |
| `item_id` | String | ID of the item referenced by the metadata value. Used with all types except `String`. A `name` or an `email` attribute (see below) can be used instead when creating or updating metadata values. |
| `name` | String | Name of the referenced item. Used with all types except `String`. |
| `email` | String | Email of the user referenced by the metadata value. Used with `User` type. |
* * *
[Previous article\
\
Update metadata](https://betterstack.com/docs/uptime/api/update-an-existing-metadata-record/)
[Next article\
\
List New Relic integrations](https://betterstack.com/docs/uptime/api/list-all-new-relic-integrations/)
### Please accept cookies
We use cookies to authenticate users, improve the product user experience, and for [personalized ads](https://business.safety.google/privacy/)
. [Learn more.](https://betterstack.com/privacy)
Deny Accept required Accept all
---
# Remove a connection | Better Stack Documentation
###### Explore documentation
* [Welcome to Telemetry 👋](https://betterstack.com/docs/logs/start/)
* [Quick start guide](https://betterstack.com/docs/logs/logging-start/)
* [Wide events vs. metrics](https://betterstack.com/docs/logs/wide-events-time-series/)
* [Ingesting data](https://betterstack.com/docs/logs/api/connections/delete/)
1. [Better Stack collector](https://betterstack.com/docs/logs/collector/)
2. [Vector](https://betterstack.com/docs/logs/vector/)
3. [OpenTelemetry](https://betterstack.com/docs/logs/open-telemetry/)
4. [Ingesting via HTTP API](https://betterstack.com/docs/logs/ingesting-data/http/logs/)
5. [Ingesting metrics](https://betterstack.com/docs/logs/ingesting-data/metrics/prometheus-scrape/)
6. [Ingesting logs](https://betterstack.com/docs/logs/ingesting-data/logs/docker-kubernetes/)
7. [Migrating to Better Stack](https://betterstack.com/docs/logs/datadog-agent/)
* [Using the product](https://betterstack.com/docs/logs/api/connections/delete/)
1. [AI SRE ↗](https://betterstack.com/demos/ai-sre/)
2. [MCP server ↗](https://betterstack.com/docs/getting-started/integrations/mcp/)
3. [Transforming ingested data](https://betterstack.com/docs/logs/using-logtail/transforming-ingested-data/logs-vrl/)
4. [Querying data](https://betterstack.com/docs/logs/using-logtail/live-tail-query-language/)
5. [Tracing](https://betterstack.com/docs/logs/tracing/)
6. [Alerts](https://betterstack.com/docs/logs/dashboards/alerts/)
* [Telemetry API](https://betterstack.com/docs/logs/api/connections/delete/)
1. [Getting an API token](https://betterstack.com/docs/logs/api/getting-started/)
2. [Sources & collectors](https://betterstack.com/docs/logs/api/list-all-existing-sources/)
3. [Dashboards](https://betterstack.com/docs/logs/api/dashboards/list/)
4. [Explorations](https://betterstack.com/docs/logs/api/explorations/list/)
5. [Alerts API](https://betterstack.com/docs/logs/api/alerts/list/)
6. [Connections API](https://betterstack.com/docs/logs/api/connections/list/)
1. [List all connections GET](https://betterstack.com/docs/logs/api/connections/list/)
2. [Get a single connection GET](https://betterstack.com/docs/logs/api/connections/get/)
3. [Create a connection POST](https://betterstack.com/docs/logs/api/connections/create/)
4. [Remove a connection DELETE](https://betterstack.com/docs/logs/api/connections/delete/)
7. [Query API ↗](https://betterstack.com/docs/logs/query-api/connect-remotely/)
* [Alternative to](https://betterstack.com/docs/logs/api/connections/delete/)
1. [Lightstep](https://betterstack.com/docs/logs/alternative-to/lightstep/)
Remove a connection
===================
Deletes an existing ClickHouse connection.
DELETE https://telemetry.betterstack.com/api/v1/connections/{id}
URL parameters
id
required string
The ID of the connection to delete.
Headers
Authorization
required string
Bearer `$TOKEN`
204
No Content on successful deletion.
404
Resource with the provided ID was not found.
Response body
{
"errors": "Resource with the provided ID was not found"
}
This API requires a [global API token](https://betterstack.com/docs/logs/api/getting-started/?utm_content=callout&utm_medium=docs-logs&utm_source=community&utm_term=docs-connection-api-delete-connection#get-a-global-api-token)
for authentication, not a team-specific token. Include the token in the `Authorization` header.
#### Example cURL
Example
Copied!
curl --request DELETE \
--url https://telemetry.betterstack.com/api/v1/connections/123 \
--header "Authorization: Bearer $TOKEN"
* * *
[Previous article\
\
Create a connection](https://betterstack.com/docs/logs/api/connections/create/)
[Next article\
\
OpenTelemetry-native Lightstep alternative](https://betterstack.com/docs/logs/alternative-to/lightstep/)
### Please accept cookies
We use cookies to authenticate users, improve the product user experience, and for [personalized ads](https://business.safety.google/privacy/)
. [Learn more.](https://betterstack.com/privacy)
Deny Accept required Accept all
---
# Locations and regions | Better Stack Documentation
###### Explore documentation
* [Welcome to Uptime 👋](https://betterstack.com/docs/uptime/start/)
* [Frequently Asked Questions](https://betterstack.com/docs/uptime/frequently-asked-questions/)
* [On-call scheduling and alerting](https://betterstack.com/docs/uptime/locations-and-regions/)
1. [Get started](https://betterstack.com/docs/uptime/getting-started-with-oncall-v2/)
2. [Slack and other integrations ↗](https://betterstack.com/docs/uptime/slack/)
3. [Connecting external calendars](https://betterstack.com/docs/uptime/connecting-external-calendars/)
4. [Advanced guide](https://betterstack.com/docs/uptime/escalation-policies/)
* [Incidents](https://betterstack.com/docs/uptime/locations-and-regions/)
1. [Get started](https://betterstack.com/docs/uptime/working-with-incidents/)
2. [Advanced guide](https://betterstack.com/docs/uptime/post-mortems/)
3. [Reporting ↗](https://betterstack.com/docs/getting-started/team-and-account-management/reporting/)
* [Monitoring](https://betterstack.com/docs/uptime/locations-and-regions/)
1. [Get started](https://betterstack.com/docs/uptime/monitoring-start/)
2. [Working with monitors](https://betterstack.com/docs/uptime/bulk-importing-monitors/)
3. [Customizing monitors](https://betterstack.com/docs/uptime/naming-monitors/)
1. [Naming monitors](https://betterstack.com/docs/uptime/naming-monitors/)
2. [Check frequency](https://betterstack.com/docs/uptime/check-frequency/)
3. [Request timeout](https://betterstack.com/docs/uptime/request-timeout/)
4. [Confirmation and recovery period](https://betterstack.com/docs/uptime/confirmation-and-recovery-period/)
5. [Domain expiration checks](https://betterstack.com/docs/uptime/domain-expiration-checks/)
6. [SSL certificate checks](https://betterstack.com/docs/uptime/ssl-certificate-checks/)
7. [Cache busting](https://betterstack.com/docs/uptime/cache-busting-in-monitoring/)
8. [Locations and regions](https://betterstack.com/docs/uptime/locations-and-regions/)
9. [Request parameters, headers and HTTP authentication](https://betterstack.com/docs/uptime/request-parameters-headers-and-http-authentication/)
10. [Github badge](https://betterstack.com/docs/uptime/github-badge/)
4. [Monitor types](https://betterstack.com/docs/uptime/uptime-monitor/)
* [Status pages](https://betterstack.com/docs/uptime/locations-and-regions/)
1. [Get started](https://betterstack.com/docs/uptime/getting-started-with-status-pages/)
2. [Advanced guide](https://betterstack.com/docs/uptime/custom-subdomain/)
* [Uptime API](https://betterstack.com/docs/uptime/locations-and-regions/)
1. [Getting an API token](https://betterstack.com/docs/uptime/api/getting-started-with-uptime-api/)
2. [Monitors](https://betterstack.com/docs/uptime/api/list-all-existing-monitors/)
3. [Heartbeats](https://betterstack.com/docs/uptime/api/list-all-existing-hearbeats/)
4. [On-call & incidents](https://betterstack.com/docs/uptime/api/on-call-calendar/)
5. [Status pages](https://betterstack.com/docs/uptime/api/list-all-existing-status-pages/)
6. [Metadata](https://betterstack.com/docs/uptime/api/metadata/)
7. [Integrations](https://betterstack.com/docs/uptime/api/list-all-new-relic-integrations/)
8. [Team members](https://betterstack.com/docs/uptime/api/team-members/list/)
Locations and regions
=====================
Regions define from which locations we check the monitored URL. By default, every monitor is checked from at least 4 different locations. To prevent false positives, an incident is created only after a check fails from at least 3 locations.
To configure monitoring locations, go to [Monitors](https://uptime.betterstack.com/team/0/monitors)
→ **Select a monitor** → **Configure** → **Advanced settings**.
Bear in mind that removing locations from a monitor's configuration might increase the number of false positives as well as increasing the number of incidents.
### Uptime IP addresses and User-Agent
You can find the list of Uptime's IP addresses, as well as our User-Agent, in our [FAQs](https://uptime.betterstack.com/faq?utm_content=callout&utm_medium=docs-uptime&utm_source=community&utm_term=docs-locations-and-regions)
.
* * *
[Previous article\
\
Cache busting in monitoring](https://betterstack.com/docs/uptime/cache-busting-in-monitoring/)
[Next article\
\
Request parameters, headers and HTTP authentication](https://betterstack.com/docs/uptime/request-parameters-headers-and-http-authentication/)
### Please accept cookies
We use cookies to authenticate users, improve the product user experience, and for [personalized ads](https://business.safety.google/privacy/)
. [Learn more.](https://betterstack.com/privacy)
Deny Accept required Accept all
---
# Create a backup on-call schedule | Better Stack Documentation
###### Explore documentation
* [Welcome to Uptime 👋](https://betterstack.com/docs/uptime/start/)
* [Frequently Asked Questions](https://betterstack.com/docs/uptime/frequently-asked-questions/)
* [On-call scheduling and alerting](https://betterstack.com/docs/uptime/creating-a-backup-oncall-schedule/)
1. [Get started](https://betterstack.com/docs/uptime/getting-started-with-oncall-v2/)
2. [Slack and other integrations ↗](https://betterstack.com/docs/uptime/slack/)
3. [Connecting external calendars](https://betterstack.com/docs/uptime/connecting-external-calendars/)
4. [Advanced guide](https://betterstack.com/docs/uptime/escalation-policies/)
1. [Escalation policies](https://betterstack.com/docs/uptime/escalation-policies/)
2. [Severities](https://betterstack.com/docs/uptime/severities/)
3. [Backup on-call schedule](https://betterstack.com/docs/uptime/creating-a-backup-oncall-schedule/)
4. [Runbooks](https://betterstack.com/docs/uptime/runbooks/)
5. [Zoom integration](https://betterstack.com/docs/uptime/integrations/zoom/)
* [Incidents](https://betterstack.com/docs/uptime/creating-a-backup-oncall-schedule/)
1. [Get started](https://betterstack.com/docs/uptime/working-with-incidents/)
2. [Advanced guide](https://betterstack.com/docs/uptime/post-mortems/)
3. [Reporting ↗](https://betterstack.com/docs/getting-started/team-and-account-management/reporting/)
* [Monitoring](https://betterstack.com/docs/uptime/creating-a-backup-oncall-schedule/)
1. [Get started](https://betterstack.com/docs/uptime/monitoring-start/)
2. [Working with monitors](https://betterstack.com/docs/uptime/bulk-importing-monitors/)
3. [Customizing monitors](https://betterstack.com/docs/uptime/naming-monitors/)
4. [Monitor types](https://betterstack.com/docs/uptime/uptime-monitor/)
* [Status pages](https://betterstack.com/docs/uptime/creating-a-backup-oncall-schedule/)
1. [Get started](https://betterstack.com/docs/uptime/getting-started-with-status-pages/)
2. [Advanced guide](https://betterstack.com/docs/uptime/custom-subdomain/)
* [Uptime API](https://betterstack.com/docs/uptime/creating-a-backup-oncall-schedule/)
1. [Getting an API token](https://betterstack.com/docs/uptime/api/getting-started-with-uptime-api/)
2. [Monitors](https://betterstack.com/docs/uptime/api/list-all-existing-monitors/)
3. [Heartbeats](https://betterstack.com/docs/uptime/api/list-all-existing-hearbeats/)
4. [On-call & incidents](https://betterstack.com/docs/uptime/api/on-call-calendar/)
5. [Status pages](https://betterstack.com/docs/uptime/api/list-all-existing-status-pages/)
6. [Metadata](https://betterstack.com/docs/uptime/api/metadata/)
7. [Integrations](https://betterstack.com/docs/uptime/api/list-all-new-relic-integrations/)
8. [Team members](https://betterstack.com/docs/uptime/api/team-members/list/)
Create a backup on-call schedule
================================
To set up a secondary schedule, head over to the **Who’s on-call** tab and click on **Add on-call schedule**
Adding additional (secondary) schedule can be useful if you’d like to have various people on-call at the same time and do not wish to include them all in one single schedule.
This would also prove super useful when setting up advanced escalation policies on the Business plan as you can choose to contact the on-call person from each schedule you have set up.
For example:
**step 1** - alert person from **primary on-call schedule**
**step 2** - alert person from **secondary on-call schedule**
* * *
[Previous article\
\
Severities](https://betterstack.com/docs/uptime/severities/)
[Next article\
\
Managing runbooks](https://betterstack.com/docs/uptime/runbooks/)
### Please accept cookies
We use cookies to authenticate users, improve the product user experience, and for [personalized ads](https://business.safety.google/privacy/)
. [Learn more.](https://betterstack.com/privacy)
Deny Accept required Accept all
---
# Create a warehouse source group | Better Stack Documentation
###### Explore documentation
* [Welcome to Warehouse 👋](https://betterstack.com/docs/warehouse/start/)
* [Ingesting data](https://betterstack.com/docs/warehouse/api/source-groups/create/)
1. [Ingesting events](https://betterstack.com/docs/warehouse/ingesting-data/intro/)
2. [S3 vs NVMe hosted data](https://betterstack.com/docs/warehouse/ingesting-data/s3-vs-nvme/)
3. [Host events in your S3 bucket](https://betterstack.com/docs/warehouse/ingesting-data/custom-s3-bucket/)
* [Querying data](https://betterstack.com/docs/warehouse/api/source-groups/create/)
1. [Querying events & time series](https://betterstack.com/docs/warehouse/querying-data/events-and-time-series/)
2. [Writing SQL queries](https://betterstack.com/docs/warehouse/querying-data/merge-and-state-aggregators/)
3. [Query speeds](https://betterstack.com/docs/warehouse/querying-data/query-speeds/)
4. [Ad-hoc SQL API](https://betterstack.com/docs/warehouse/querying-data/ad-hoc-sql-api/)
5. [Generate client-facing APIs](https://betterstack.com/docs/warehouse/querying-data/queries/)
6. [Visualizing data](https://betterstack.com/docs/warehouse/querying-data/visualizing-data/)
* [Vector embeddings](https://betterstack.com/docs/warehouse/api/source-groups/create/)
1. [Introduction to embeddings](https://betterstack.com/docs/warehouse/vector-embeddings/intro/)
2. [Using built-in embeddings](https://betterstack.com/docs/warehouse/vector-embeddings/built-in-embeddings/)
3. [Bringing your own embeddings](https://betterstack.com/docs/warehouse/vector-embeddings/bring-your-own/)
4. [Data structures and indices](https://betterstack.com/docs/warehouse/vector-embeddings/data-structures-and-indices/)
* [Use cases](https://betterstack.com/docs/warehouse/api/source-groups/create/)
1. [Retrieval Augmented Generation](https://betterstack.com/docs/warehouse/use-cases/building-rag/)
* [Management](https://betterstack.com/docs/warehouse/api/source-groups/create/)
1. [Controlling costs](https://betterstack.com/docs/warehouse/management/controlling-costs/)
* [Warehouse API](https://betterstack.com/docs/warehouse/api/source-groups/create/)
1. [Getting an API token](https://betterstack.com/docs/warehouse/api/getting-api-token/)
2. [Warehouse sources API](https://betterstack.com/docs/warehouse/api/sources/list/)
3. [Warehouse source groups API](https://betterstack.com/docs/warehouse/api/source-groups/list/)
1. [List all groups GET](https://betterstack.com/docs/warehouse/api/source-groups/list/)
2. [Get a single group GET](https://betterstack.com/docs/warehouse/api/source-groups/get/)
3. [Create a group POST](https://betterstack.com/docs/warehouse/api/source-groups/create/)
4. [Update a group PUT](https://betterstack.com/docs/warehouse/api/source-groups/update/)
5. [Remove a group DELETE](https://betterstack.com/docs/warehouse/api/source-groups/delete/)
6. [List sources in a group GET](https://betterstack.com/docs/warehouse/api/source-groups/list-sources/)
4. [Time series API](https://betterstack.com/docs/warehouse/api/time-series/list/)
5. [Embeddings API](https://betterstack.com/docs/warehouse/api/embeddings/list/)
Create a warehouse source group
===============================
Updates an existing Warehouse source group. Only provided parameters will be changed.
PUT https://warehouse.betterstack.com/api/v1/source-groups/{id}
URL parameters
id
required string
The ID of the Warehouse source group to update.
Headers
Authorization
required string
Bearer `$TOKEN`
Content-Type
required string
application/json
Body parameters
name
string
The new name for the source group. Can contain letters, numbers, spaces, and special characters.
200
The updated Warehouse source group.
Response body
{
"data": {
"id": "1234",
"type": "warehouse_source_group",
"attributes": {
"name": "Analytics Updated",
"created_at": "2025-11-13T10:00:00Z",
"updated_at": "2025-11-25T20:44:50Z",
"sort_index": null,
"team_name": "example-team"
}
}
}
401
Unauthorized
Response body
{
"errors": "Invalid Team API token. How to find your Team API token: https://betterstack.com/docs/logs/api/getting-started/#obtaining-a-logtail-api-token"
}
404
Not Found
Response body
{
"errors": "Resource with the provided ID was not found"
}
422
Unprocessable Entity - Validation Errors
Response body
{
"errors": "Sorry, you are missing some required attributes",
"required_attributes": [\
"name"\
]
}
#### Example cURL
Example
Copied!
curl --request PUT \
--url https://warehouse.betterstack.com/api/v1/source-groups/1234 \
--header "Authorization: Bearer $TOKEN" \
--header 'Content-Type: application/json' \
--data '{
"name": "Analytics Updated"
}'
* * *
[Previous article\
\
Get a single warehouse source group](https://betterstack.com/docs/warehouse/api/source-groups/get/)
[Next article\
\
Update a warehouse source group](https://betterstack.com/docs/warehouse/api/source-groups/update/)
### Please accept cookies
We use cookies to authenticate users, improve the product user experience, and for [personalized ads](https://business.safety.google/privacy/)
. [Learn more.](https://betterstack.com/privacy)
Deny Accept required Accept all
---
# Pagination of API lists | Better Stack Documentation
###### Explore documentation
* [Welcome to Uptime 👋](https://betterstack.com/docs/uptime/start/)
* [Frequently Asked Questions](https://betterstack.com/docs/uptime/frequently-asked-questions/)
* [On-call scheduling and alerting](https://betterstack.com/docs/uptime/api/pagination/)
1. [Get started](https://betterstack.com/docs/uptime/getting-started-with-oncall-v2/)
2. [Slack and other integrations ↗](https://betterstack.com/docs/uptime/slack/)
3. [Connecting external calendars](https://betterstack.com/docs/uptime/connecting-external-calendars/)
4. [Advanced guide](https://betterstack.com/docs/uptime/escalation-policies/)
* [Incidents](https://betterstack.com/docs/uptime/api/pagination/)
1. [Get started](https://betterstack.com/docs/uptime/working-with-incidents/)
2. [Advanced guide](https://betterstack.com/docs/uptime/post-mortems/)
3. [Reporting ↗](https://betterstack.com/docs/getting-started/team-and-account-management/reporting/)
* [Monitoring](https://betterstack.com/docs/uptime/api/pagination/)
1. [Get started](https://betterstack.com/docs/uptime/monitoring-start/)
2. [Working with monitors](https://betterstack.com/docs/uptime/bulk-importing-monitors/)
3. [Customizing monitors](https://betterstack.com/docs/uptime/naming-monitors/)
4. [Monitor types](https://betterstack.com/docs/uptime/uptime-monitor/)
* [Status pages](https://betterstack.com/docs/uptime/api/pagination/)
1. [Get started](https://betterstack.com/docs/uptime/getting-started-with-status-pages/)
2. [Advanced guide](https://betterstack.com/docs/uptime/custom-subdomain/)
* [Uptime API](https://betterstack.com/docs/uptime/api/pagination/)
1. [Getting an API token](https://betterstack.com/docs/uptime/api/getting-started-with-uptime-api/)
1. [Pagination of API lists](https://betterstack.com/docs/uptime/api/pagination/)
2. [Monitors](https://betterstack.com/docs/uptime/api/list-all-existing-monitors/)
3. [Heartbeats](https://betterstack.com/docs/uptime/api/list-all-existing-hearbeats/)
4. [On-call & incidents](https://betterstack.com/docs/uptime/api/on-call-calendar/)
5. [Status pages](https://betterstack.com/docs/uptime/api/list-all-existing-status-pages/)
6. [Metadata](https://betterstack.com/docs/uptime/api/metadata/)
7. [Integrations](https://betterstack.com/docs/uptime/api/list-all-new-relic-integrations/)
8. [Team members](https://betterstack.com/docs/uptime/api/team-members/list/)
Pagination of API lists
=======================
API endpoints returning lists of resources usually support pagination, for example [List all monitors](https://betterstack.com/docs/uptime/api/list-all-existing-monitors/)
.
Query parameters
----------------
Control pagination with following query parameters:
| Parameter | Type | Value |
| --- | --- | --- |
| `per_page` | Integer | Number of resources per page. The default value is `50` and maximum value is `250` if not specified otherwise. |
| `page` | Integer | The page number you want to return. Starts with `1`. |
See the `pagination` object in the API list response body to find other pages:
| Parameter | Type | Values |
| --- | --- | --- |
| `pagination.first` | String | The URL of the first page of results. |
| `pagination.last` | String | The URL of the last page of results. |
| `pagination.prev` | String or `null` | The URL of the previous page of results. Is `null` when viewing the first page. |
| `pagination.next` | String or `null` | The URL of the next page of results. Is `null` when viewing the last page. |
Examples
--------
Example cURL to list monitors
Copied!
curl --request GET \
--url "https://uptime.betterstack.com/api/v2/monitors?per_page=20&page=3" \
--header "Authorization: Bearer $TOKEN"
Example response body listing monitors
Copied!
{
"data": [\
{\
"id": "41",\
"type": "monitor",\
"attributes": {\
monitor's attributes omitted...\
}\
},\
{\
"id": "42",\
"type": "monitor",\
"attributes": {\
monitor's attributes omitted...\
}\
}\
],
"pagination": {
"first": "https://uptime.betterstack.com/api/v2/monitors?per_page=20&page=1",
"last": "https://uptime.betterstack.com/api/v2/monitors?per_page=20&page=3",
"prev": "https://uptime.betterstack.com/api/v2/monitors?per_page=20&page=2",
"next": null
}
}
* * *
[Previous article\
\
Get started with Uptime API](https://betterstack.com/docs/uptime/api/getting-started-with-uptime-api/)
[Next article\
\
List monitors](https://betterstack.com/docs/uptime/api/list-all-existing-monitors/)
###### On this page
* [Query parameters](https://betterstack.com/docs/uptime/api/pagination/#query-parameters)
* [Examples](https://betterstack.com/docs/uptime/api/pagination/#examples)
### Please accept cookies
We use cookies to authenticate users, improve the product user experience, and for [personalized ads](https://business.safety.google/privacy/)
. [Learn more.](https://betterstack.com/privacy)
Deny Accept required Accept all
---
# Remove a time series | Better Stack Documentation
###### Explore documentation
* [Welcome to Warehouse 👋](https://betterstack.com/docs/warehouse/start/)
* [Ingesting data](https://betterstack.com/docs/warehouse/api/time-series/delete/)
1. [Ingesting events](https://betterstack.com/docs/warehouse/ingesting-data/intro/)
2. [S3 vs NVMe hosted data](https://betterstack.com/docs/warehouse/ingesting-data/s3-vs-nvme/)
3. [Host events in your S3 bucket](https://betterstack.com/docs/warehouse/ingesting-data/custom-s3-bucket/)
* [Querying data](https://betterstack.com/docs/warehouse/api/time-series/delete/)
1. [Querying events & time series](https://betterstack.com/docs/warehouse/querying-data/events-and-time-series/)
2. [Writing SQL queries](https://betterstack.com/docs/warehouse/querying-data/merge-and-state-aggregators/)
3. [Query speeds](https://betterstack.com/docs/warehouse/querying-data/query-speeds/)
4. [Ad-hoc SQL API](https://betterstack.com/docs/warehouse/querying-data/ad-hoc-sql-api/)
5. [Generate client-facing APIs](https://betterstack.com/docs/warehouse/querying-data/queries/)
6. [Visualizing data](https://betterstack.com/docs/warehouse/querying-data/visualizing-data/)
* [Vector embeddings](https://betterstack.com/docs/warehouse/api/time-series/delete/)
1. [Introduction to embeddings](https://betterstack.com/docs/warehouse/vector-embeddings/intro/)
2. [Using built-in embeddings](https://betterstack.com/docs/warehouse/vector-embeddings/built-in-embeddings/)
3. [Bringing your own embeddings](https://betterstack.com/docs/warehouse/vector-embeddings/bring-your-own/)
4. [Data structures and indices](https://betterstack.com/docs/warehouse/vector-embeddings/data-structures-and-indices/)
* [Use cases](https://betterstack.com/docs/warehouse/api/time-series/delete/)
1. [Retrieval Augmented Generation](https://betterstack.com/docs/warehouse/use-cases/building-rag/)
* [Management](https://betterstack.com/docs/warehouse/api/time-series/delete/)
1. [Controlling costs](https://betterstack.com/docs/warehouse/management/controlling-costs/)
* [Warehouse API](https://betterstack.com/docs/warehouse/api/time-series/delete/)
1. [Getting an API token](https://betterstack.com/docs/warehouse/api/getting-api-token/)
2. [Warehouse sources API](https://betterstack.com/docs/warehouse/api/sources/list/)
3. [Warehouse source groups API](https://betterstack.com/docs/warehouse/api/source-groups/list/)
4. [Time series API](https://betterstack.com/docs/warehouse/api/time-series/list/)
1. [List all time series GET](https://betterstack.com/docs/warehouse/api/time-series/list/)
2. [Create a time series POST](https://betterstack.com/docs/warehouse/api/time-series/create/)
3. [Remove a time series DELETE](https://betterstack.com/docs/warehouse/api/time-series/delete/)
5. [Embeddings API](https://betterstack.com/docs/warehouse/api/embeddings/list/)
Remove a time series
====================
Deletes an existing time series configuration from a Warehouse source.
DELETE https://warehouse.betterstack.com/api/v1/sources/{source\_id}/time\_series/{id}
URL parameters
source\_id
required string
The ID of the Warehouse source containing the time series configuration.
id
required string
The ID of the time series configuration to delete.
Headers
Authorization
required string
Bearer `$TOKEN`
204
No Content
401
Unauthorized
Response body
{
"errors": "Invalid authentication"
}
404
Not Found
Response body
{
"errors": "Source or time series configuration with the provided ID was not found"
}
#### Example cURL
Example
Copied!
curl --request DELETE \
--url https://warehouse.betterstack.com/api/v1/sources/12345/time_series/56789 \
--header "Authorization: Bearer $TOKEN"
* * *
[Previous article\
\
Create a time series](https://betterstack.com/docs/warehouse/api/time-series/create/)
[Next article\
\
List all embeddings](https://betterstack.com/docs/warehouse/api/embeddings/list/)
### Please accept cookies
We use cookies to authenticate users, improve the product user experience, and for [personalized ads](https://business.safety.google/privacy/)
. [Learn more.](https://betterstack.com/privacy)
Deny Accept required Accept all
---
# Reporting | Better Stack Documentation
###### Explore documentation
* [Welcome 👋](https://betterstack.com/docs/getting-started/welcome/)
* [Product](https://betterstack.com/docs/getting-started/team-and-account-management/reporting/)
1. [Tracing ↗](https://betterstack.com/docs/logs/tracing/)
2. [Incident management ↗](https://betterstack.com/docs/uptime/working-with-incidents/)
3. [Uptime monitoring ↗](https://betterstack.com/docs/uptime/monitoring-start/)
4. [Log management ↗](https://betterstack.com/docs/logs/logging-start/)
5. [Infrastructure monitoring ↗](https://betterstack.com/docs/logs/dashboards/getting-started/)
6. [Status page ↗](https://betterstack.com/docs/uptime/getting-started-with-status-pages/)
7. [Error tracking ↗](https://betterstack.com/docs/errors/start/)
8. [Warehouse ↗](https://betterstack.com/docs/warehouse/start/)
* [Integrations](https://betterstack.com/docs/getting-started/team-and-account-management/reporting/)
1. [Integrating with Better Stack](https://betterstack.com/docs/uptime/slack/)
2. [iOS & Android](https://betterstack.com/docs/uptime/ios-and-android-mobile-apps/)
3. [SSO providers](https://betterstack.com/docs/uptime/integrating-with-better-uptime/aws-sso/)
4. [Terraform](https://betterstack.com/docs/getting-started/integrations/terraform/)
5. [MCP server](https://betterstack.com/docs/getting-started/integrations/mcp/)
* [Team and account management](https://betterstack.com/docs/getting-started/team-and-account-management/reporting/)
1. [Team management](https://betterstack.com/docs/uptime/creating-a-new-team/)
2. [Account settings](https://betterstack.com/docs/uptime/phone-number/)
3. [Reporting](https://betterstack.com/docs/getting-started/team-and-account-management/reporting/)
1. [Custom reports](https://betterstack.com/docs/getting-started/team-and-account-management/reporting/custom-reports/)
4. [Audit logs](https://betterstack.com/docs/uptime/audit-logs/)
* [Design](https://betterstack.com/docs/getting-started/team-and-account-management/reporting/)
1. [Brand guidelines](https://betterstack.com/docs/brand/)
Reporting
=========
Our reporting provides comprehensive analytics and insights, helping you understand trends, identify bottlenecks, and **optimize your incident response**.
You can see the data directly in UI, or create powerful custom reports with **live data exports** to be processed elsewhere, e.g. in Google Sheets.
Go to **Uptime** → [Reporting](https://uptime.betterstack.com/team/0/reporting/incidents-overview)
to see the overview, or navigate to a specific report in the left submenu.
Key features
------------
Reporting allows you to analyze various aspects of your system's performance and your team's incident response. You can filter data by numerous criteria and visualize it through different chart types.
**Key features include**
* **Report categories:** Access a wide array of reports across different domains.
* **Filtering:** Apply over 10 filter types, including monitors, integrations, escalation policies, users, causes, business hours, and metadata.
* **Date ranges:** Select data resolution and absolute or relative date range.
* **Reusable URL:** Changes to filters and ranges immediately change your URL, allowing you to copy it for later use or quick collaboration.
* **Updated in real-time:** All your reporting data is always up to date.
* **CSV export:** Export data in real-time streaming CSV format.
* **Business hours:** Customize what hours and days count as business time for relevant reports.

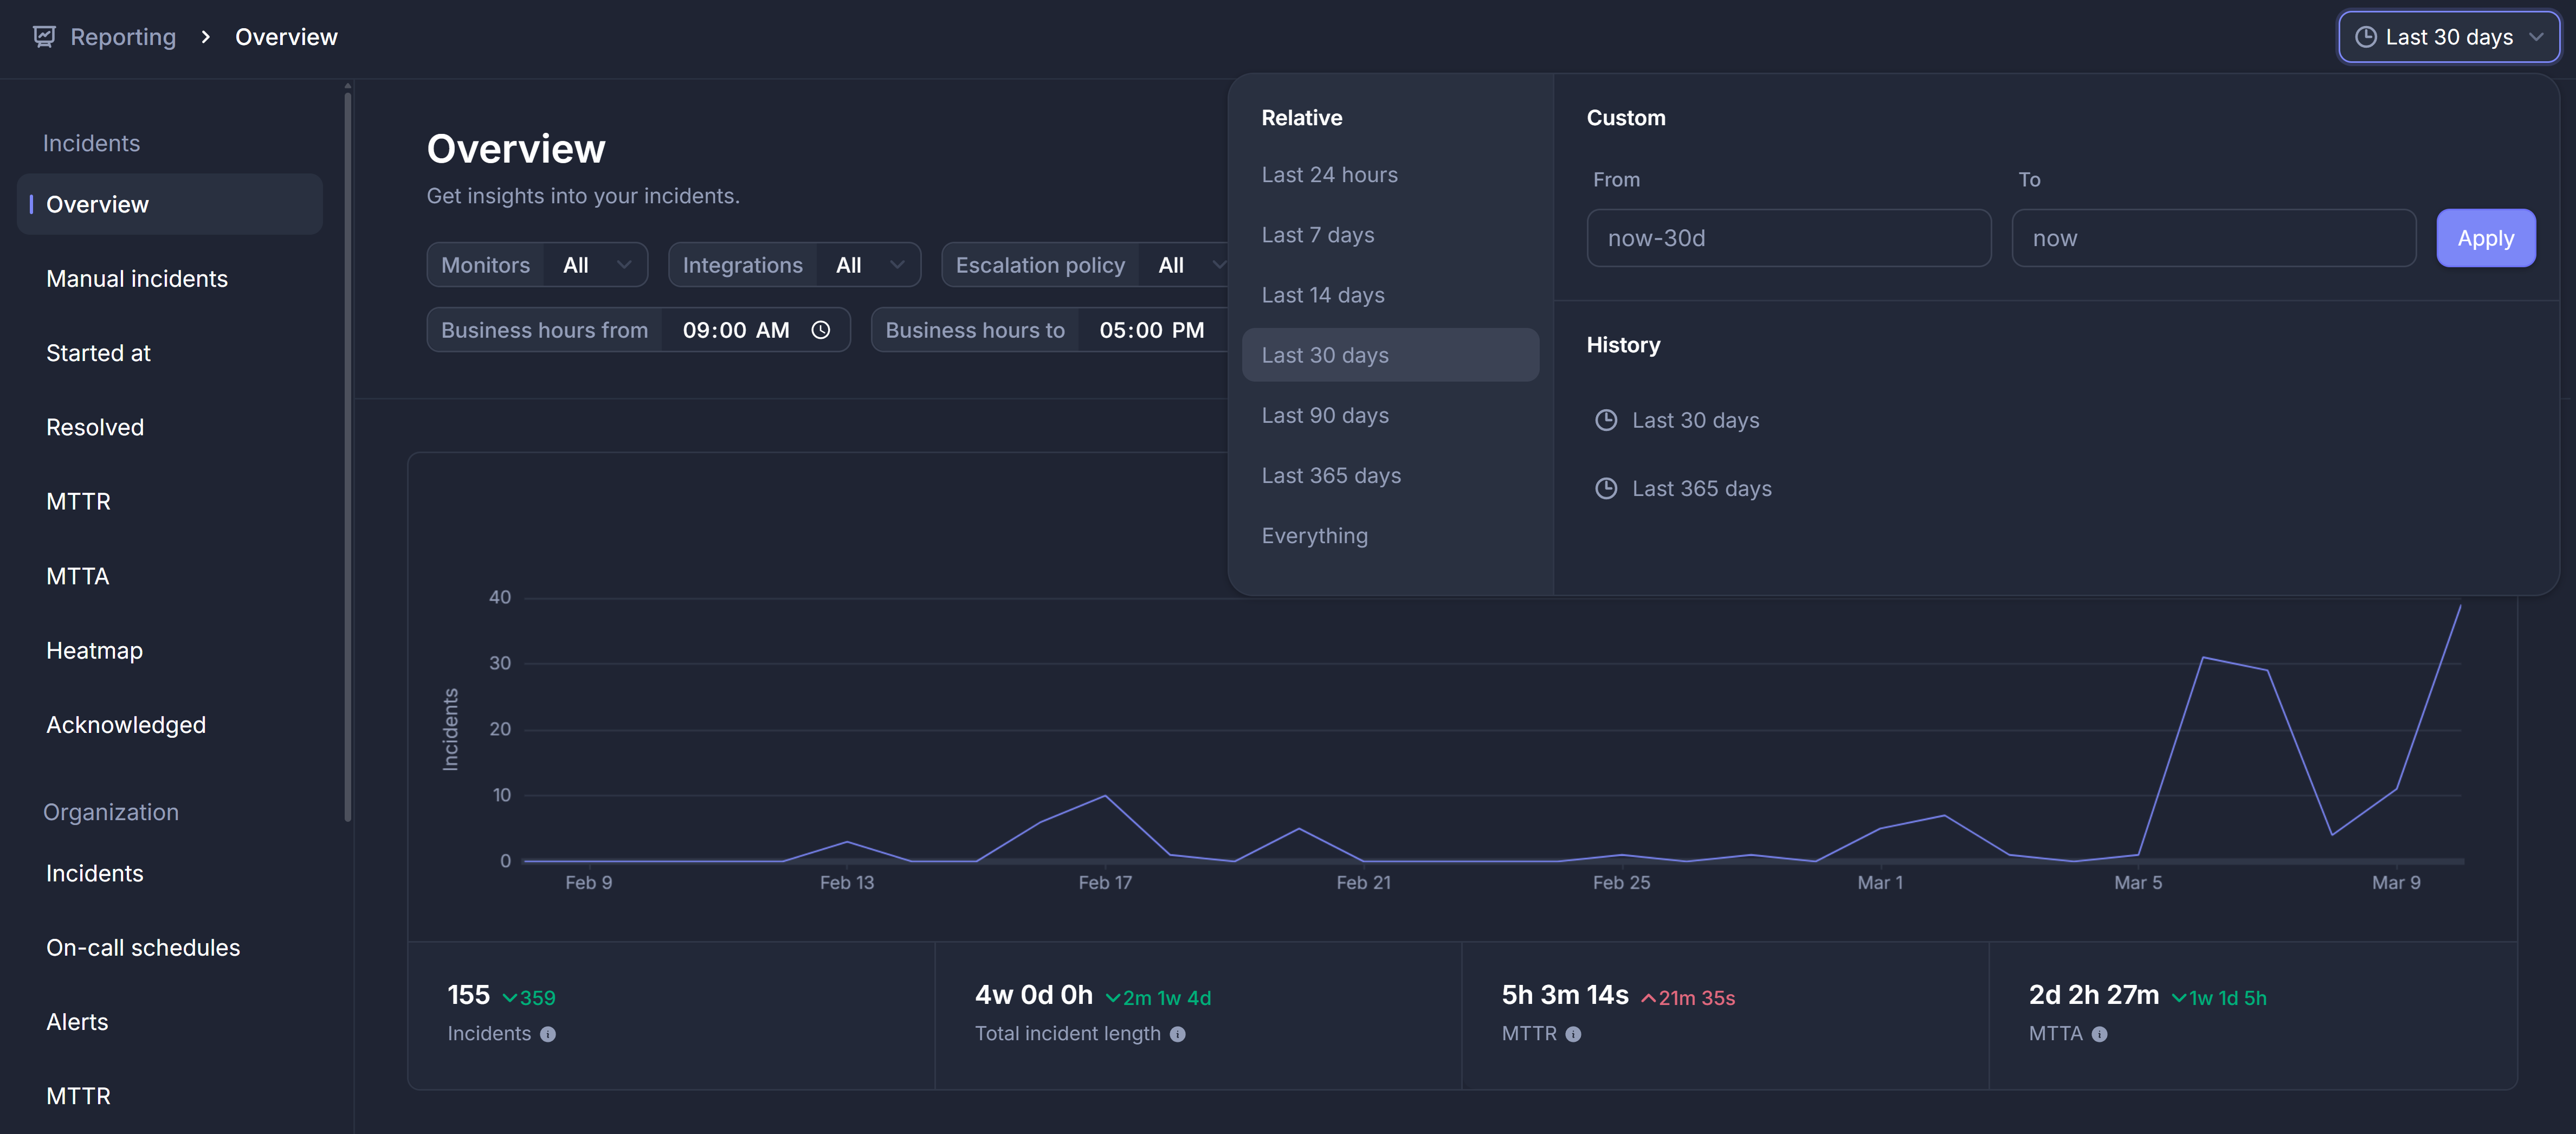
Understanding the three views
-----------------------------
Each report presents your data in three complementary views:
### Chart view
Visualize trends over time with multiple chart formats:
* **Line charts**: Show trends for metrics like incident volume and uptime
* **Bar charts**: Compare values across categories like teams and monitors
* **Heatmaps**: Display activity patterns across time periods
* **Donut charts**: Show distribution breakdowns
Hover over chart elements to see detailed values. Click legend items to show or hide specific data series.
### KPI view
Key Performance Indicators show critical metrics at a glance:
* Current value for your selected date range
* Comparison with the previous period
* Trend indicator showing improvement or decline
* Color coding for good and bad trends
The KPI view helps you quickly assess performance without diving into detailed charts. Look for green upward trends on positive metrics like uptime, and green downward trends on negative metrics like MTTR.
### Table view
Browse detailed data with pagination. Each report includes relevant columns based on the report type.
Click column headers to sort by that column. Use the pagination controls to navigate through all rows. The table view shows raw data that feeds into the charts and KPIs.
Individual reports
------------------
Reports are organized into the following categories:
### Incidents reports
Access incident overview, manual incidents, started-at and resolved-time reports, MTTR, MTTA, heatmaps, and acknowledged-incident insights.
**Available reports**
* **Incidents overview**: Get insights into incidents
* **Incidents activity**: Track incident lifecycle activity
* **Incidents acknowledged**: See how incidents get acknowledged most often
* **Incidents resolved**: Track incident resolutions
* **Incidents start**: Track when incidents start
* **Incidents MTTA**: Mean Time To Acknowledge per incident
* **Incidents MTTR**: Mean Time To Resolve per incident
* **Manual incidents overview**: Manual incident tracking
### Organization reports
View organization-wide metrics, including cross-team incident volume, alert metrics, MTTR, and on-call schedule visibility.
**Available reports**
* **Organization incidents**: Organization-wide incident overview
* **Organization alerts**: Organization alerts
* **Organization MTTR**: Organization MTTR
* **Organization on-call schedules**: Organization-wide on-call schedules
### Teams reports
Explore team-level reports such as response effort, MTTR, MTTA, incidents, team alerts, on-calls, and detailed on-call metrics.
**Available reports**
* **Teams incidents**: Track how many incidents each team member acknowledged and resolved
* **Teams MTTA**: Team MTTA metrics
* **Teams MTTR**: Team MTTR metrics
* **Teams response effort**: Team response effort tracking
* **Team alerts**: Team alerts overview
* **On-calls overview**: Team member on-call activity overview
* **On-calls detailed**: Detailed on-call analytics
### Status page reports
Monitor status page activity through status updates and subscriber metrics.
**Available reports**
* **Status page subscriber overview**: Subscriber activity metrics
* **Status page update activity**: Status update activity tracking
### Monitors reports
Track compound SLA, average SLA, monitor performance, incident volume, and per-monitor MTTA/MTTR.
**Available reports**
* **Monitors SLA**: Track compound availability of selected monitors
* **Monitors incident volume**: Track incident volume per monitor
* **Monitors MTTA**: Mean Time To Acknowledge by monitor
* **Monitors MTTR**: Mean Time To Resolve by monitor
* **Monitors average SLA**: Average SLA across monitors
* **Monitor performance**: Monitor performance metrics
Advanced filtering
------------------
Refine your reports with powerful filtering options. Available filters depend on the report type.
### Common filters
* **Monitors**: Select specific monitors or heartbeats, grouped by resource groups
* **Integrations**: Filter by integration types
* **Escalation policies**: Filter by escalation policies
* **Incident cause**: Filter by incident cause
* **Acknowledged by**: Filter by who acknowledged incidents
* **Resolved by**: Filter by who resolved incidents
* **Silenced incidents**: Include or exclude silenced incidents
### Advanced filters
* **Business hours**: Configure business hours start and end times
* **Weekdays**: Filter by specific weekdays
* **On-call person**: Filter by on-call person
* **Schedule**: Filter by schedule
* **Status page**: Filter by status page
* **Teams**: Filter by teams for organization-level reports
* **Metadata**: Advanced filtering using [incident metadata](https://betterstack.com/docs/uptime/incident-metadata/)
### Filtering with metadata
Use metadata to create advanced filters with custom key-value pairs. The metadata filter supports complex query syntax for precise filtering.
Simple filters Multiple conditions Combined filters
Copied!
environment=production
severity=critical OR severity=high
region="us-east" service=api
Multiple conditions are combined with `AND` by default. Use `OR` to match any condition. Quote values containing spaces.
**Example use cases**
* `team=backend environment=production`: Filter incidents from backend team in production
* `severity=critical OR severity=high`: Show only high-priority incidents
* `customer="Acme Corp"`: Filter incidents affecting a specific customer
Learn more about configuring and using metadata in our [incident metadata documentation](https://betterstack.com/docs/uptime/incident-metadata/)
.
### Saving filter presets
Save frequently used filter combinations as presets. Your saved presets appear in the filter dropdown for quick access. This is useful for:
* Regular compliance reports requiring specific filters
* Team-specific views filtering by metadata
* Business hours reports for different regions
### Automatic resolution adjustment
Better Stack automatically adjusts the time resolution based on your selected date range:
* **14 days or less**: Hourly resolution
* **14 to 60 days**: Daily resolution
* **2 to 6 months**: Weekly resolution
* **More than 6 months**: Monthly resolution
This ensures your charts remain readable while showing appropriate granularity. You can manually override the resolution if needed.
* * *
[Previous article\
\
Delete my account](https://betterstack.com/docs/uptime/delete-my-account/)
[Next article\
\
Custom reports](https://betterstack.com/docs/getting-started/team-and-account-management/reporting/custom-reports/)
###### On this page
* [Key features](https://betterstack.com/docs/getting-started/team-and-account-management/reporting/#key-features)
* [Understanding the three views](https://betterstack.com/docs/getting-started/team-and-account-management/reporting/#understanding-the-three-views)
* [Chart view](https://betterstack.com/docs/getting-started/team-and-account-management/reporting/#chart-view)
* [KPI view](https://betterstack.com/docs/getting-started/team-and-account-management/reporting/#kpi-view)
* [Table view](https://betterstack.com/docs/getting-started/team-and-account-management/reporting/#table-view)
* [Individual reports](https://betterstack.com/docs/getting-started/team-and-account-management/reporting/#individual-reports)
* [Incidents reports](https://betterstack.com/docs/getting-started/team-and-account-management/reporting/#incidents-reports)
* [Organization reports](https://betterstack.com/docs/getting-started/team-and-account-management/reporting/#organization-reports)
* [Teams reports](https://betterstack.com/docs/getting-started/team-and-account-management/reporting/#teams-reports)
* [Status page reports](https://betterstack.com/docs/getting-started/team-and-account-management/reporting/#status-page-reports)
* [Monitors reports](https://betterstack.com/docs/getting-started/team-and-account-management/reporting/#monitors-reports)
* [Advanced filtering](https://betterstack.com/docs/getting-started/team-and-account-management/reporting/#advanced-filtering)
* [Common filters](https://betterstack.com/docs/getting-started/team-and-account-management/reporting/#common-filters)
* [Advanced filters](https://betterstack.com/docs/getting-started/team-and-account-management/reporting/#advanced-filters)
* [Filtering with metadata](https://betterstack.com/docs/getting-started/team-and-account-management/reporting/#filtering-with-metadata)
* [Saving filter presets](https://betterstack.com/docs/getting-started/team-and-account-management/reporting/#saving-filter-presets)
* [Automatic resolution adjustment](https://betterstack.com/docs/getting-started/team-and-account-management/reporting/#automatic-resolution-adjustment)
### Please accept cookies
We use cookies to authenticate users, improve the product user experience, and for [personalized ads](https://business.safety.google/privacy/)
. [Learn more.](https://betterstack.com/privacy)
Deny Accept required Accept all
---
# Getting started | Better Stack Documentation
###### Explore documentation
* [Welcome 👋](https://betterstack.com/docs/getting-started/welcome/)
* [Product](https://betterstack.com/docs/getting-started/welcome/)
1. [Tracing ↗](https://betterstack.com/docs/logs/tracing/)
2. [Incident management ↗](https://betterstack.com/docs/uptime/working-with-incidents/)
3. [Uptime monitoring ↗](https://betterstack.com/docs/uptime/monitoring-start/)
4. [Log management ↗](https://betterstack.com/docs/logs/logging-start/)
5. [Infrastructure monitoring ↗](https://betterstack.com/docs/logs/dashboards/getting-started/)
6. [Status page ↗](https://betterstack.com/docs/uptime/getting-started-with-status-pages/)
7. [Error tracking ↗](https://betterstack.com/docs/errors/start/)
8. [Warehouse ↗](https://betterstack.com/docs/warehouse/start/)
* [Integrations](https://betterstack.com/docs/getting-started/welcome/)
1. [Integrating with Better Stack](https://betterstack.com/docs/uptime/slack/)
2. [iOS & Android](https://betterstack.com/docs/uptime/ios-and-android-mobile-apps/)
3. [SSO providers](https://betterstack.com/docs/uptime/integrating-with-better-uptime/aws-sso/)
4. [Terraform](https://betterstack.com/docs/getting-started/integrations/terraform/)
5. [MCP server](https://betterstack.com/docs/getting-started/integrations/mcp/)
* [Team and account management](https://betterstack.com/docs/getting-started/welcome/)
1. [Team management](https://betterstack.com/docs/uptime/creating-a-new-team/)
2. [Account settings](https://betterstack.com/docs/uptime/phone-number/)
3. [Reporting](https://betterstack.com/docs/getting-started/team-and-account-management/reporting/)
4. [Audit logs](https://betterstack.com/docs/uptime/audit-logs/)
* [Design](https://betterstack.com/docs/getting-started/welcome/)
1. [Brand guidelines](https://betterstack.com/docs/brand/)
Getting started
===============

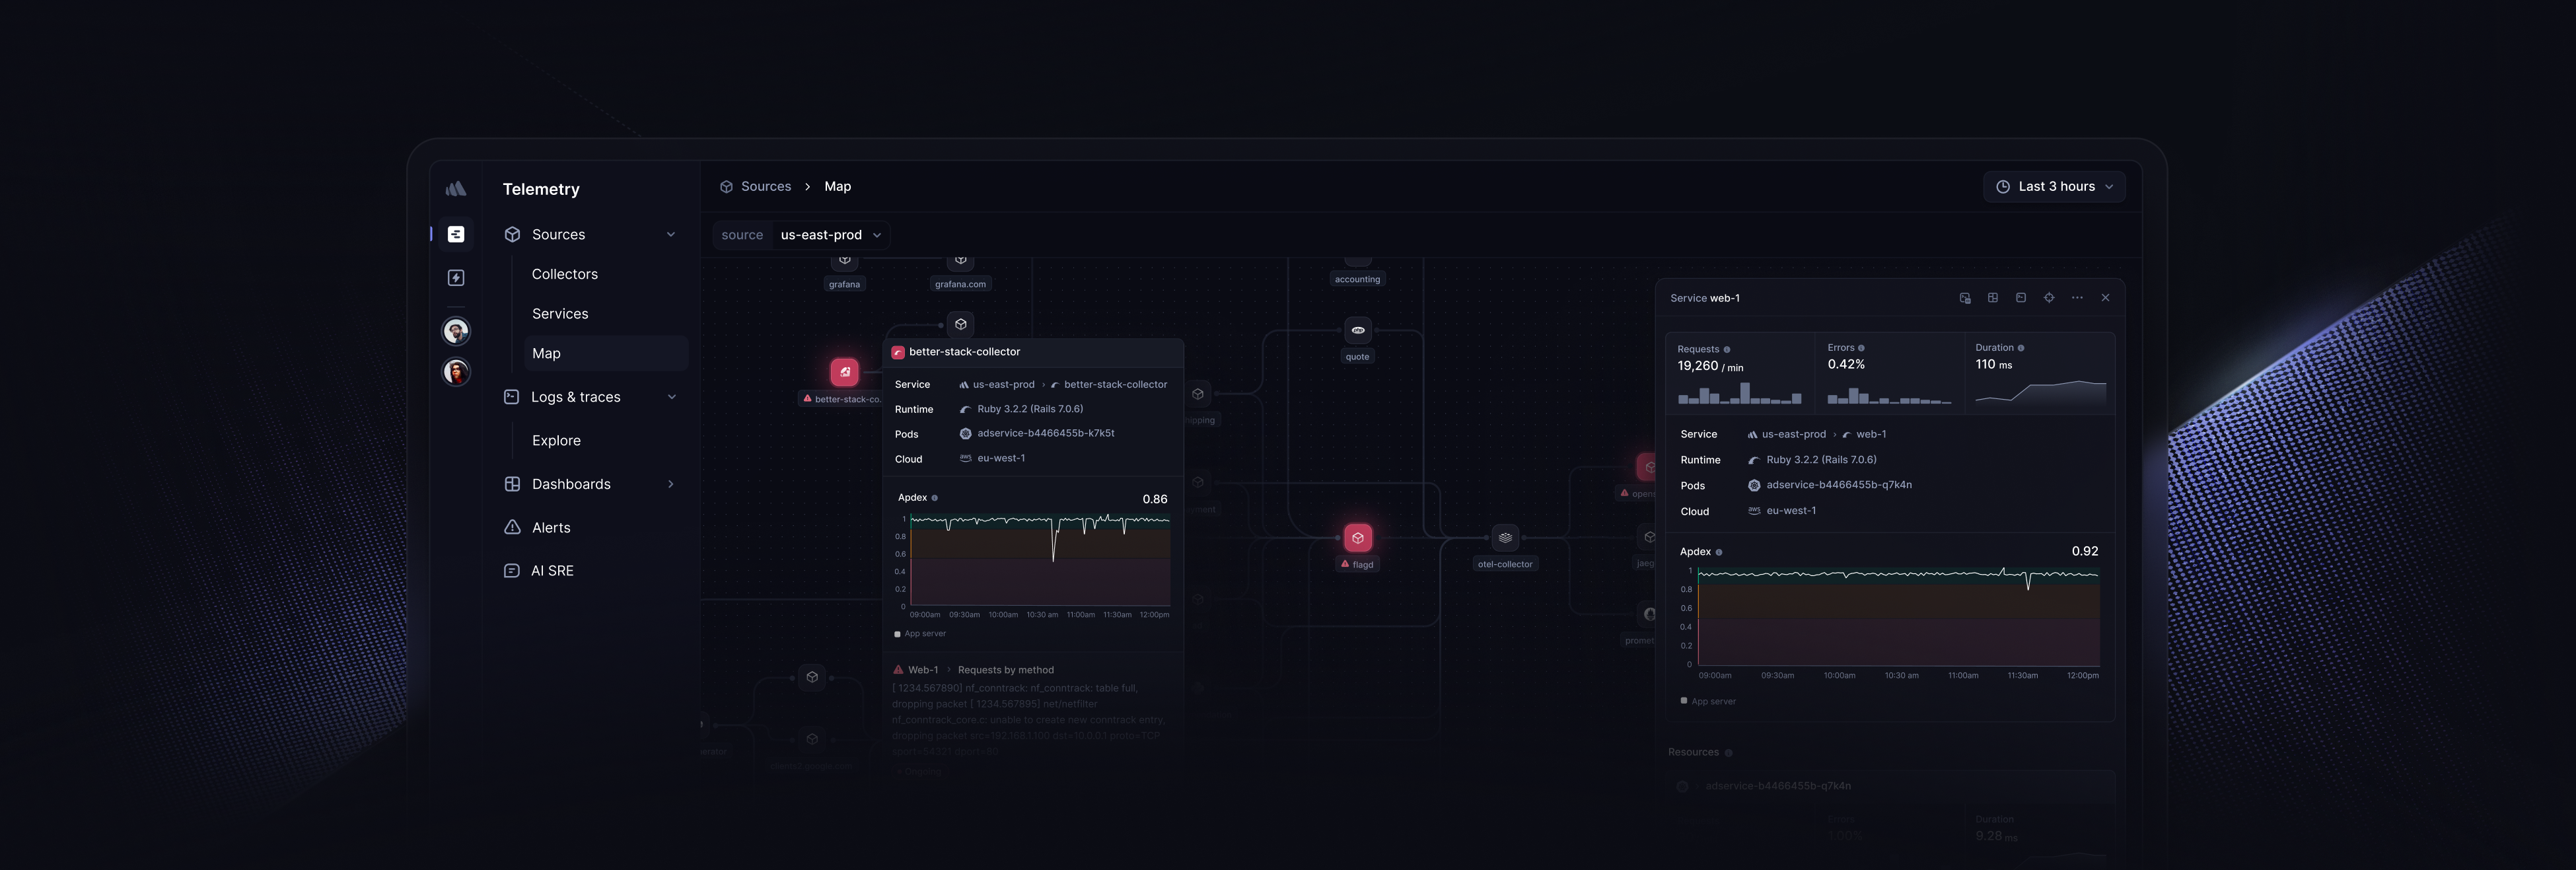
Better Stack is an AI-native platform for [on-call](https://betterstack.com/docs/uptime/getting-started-with-oncall/)
and [incident response](https://betterstack.com/docs/uptime/working-with-incidents/)
with effortless [monitoring](https://betterstack.com/docs/monitoring/)
, [status pages](https://betterstack.com/docs/uptime/getting-started-with-status-pages/)
, [infrastructure monitoring](https://betterstack.com/demos/dashboards/)
, [log management](https://betterstack.com/docs/logs/logging-start/)
, and [distributed tracing](https://betterstack.com/docs/logs/tracing/)
.
Looking for our APIs?
---------------------
Automate your workflows and integrate Better Stack with your existing tools using our APIs and protocols.
* [MCP server](https://betterstack.com/docs/getting-started/integrations/mcp/)
* [Terraform](https://betterstack.com/docs/getting-started/integrations/terraform/)
* [Uptime & On-call API](https://betterstack.com/docs/uptime/api/getting-started-with-uptime-api/)
* [Logs & Metrics API](https://betterstack.com/docs/logs/api/getting-started/)
Exploring Better Stack?
-----------------------
Check out our quick [video demos](https://betterstack.com/demos/welcome/)
.
* * *
[Next article\
\
Slack & Better Stack integration](https://betterstack.com/docs/uptime/slack/)
###### On this page
* [Looking for our APIs?](https://betterstack.com/docs/getting-started/welcome/#looking-for-our-apis)
* [Exploring Better Stack?](https://betterstack.com/docs/getting-started/welcome/#exploring-better-stack)
### Please accept cookies
We use cookies to authenticate users, improve the product user experience, and for [personalized ads](https://business.safety.google/privacy/)
. [Learn more.](https://betterstack.com/privacy)
Deny Accept required Accept all
---
# List escalation policies | Better Stack Documentation
###### Explore documentation
* [Welcome to Uptime 👋](https://betterstack.com/docs/uptime/start/)
* [Frequently Asked Questions](https://betterstack.com/docs/uptime/frequently-asked-questions/)
* [On-call scheduling and alerting](https://betterstack.com/docs/uptime/api/list-all-escalation-policies/)
1. [Get started](https://betterstack.com/docs/uptime/getting-started-with-oncall-v2/)
2. [Slack and other integrations ↗](https://betterstack.com/docs/uptime/slack/)
3. [Connecting external calendars](https://betterstack.com/docs/uptime/connecting-external-calendars/)
4. [Advanced guide](https://betterstack.com/docs/uptime/escalation-policies/)
* [Incidents](https://betterstack.com/docs/uptime/api/list-all-escalation-policies/)
1. [Get started](https://betterstack.com/docs/uptime/working-with-incidents/)
2. [Advanced guide](https://betterstack.com/docs/uptime/post-mortems/)
3. [Reporting ↗](https://betterstack.com/docs/getting-started/team-and-account-management/reporting/)
* [Monitoring](https://betterstack.com/docs/uptime/api/list-all-escalation-policies/)
1. [Get started](https://betterstack.com/docs/uptime/monitoring-start/)
2. [Working with monitors](https://betterstack.com/docs/uptime/bulk-importing-monitors/)
3. [Customizing monitors](https://betterstack.com/docs/uptime/naming-monitors/)
4. [Monitor types](https://betterstack.com/docs/uptime/uptime-monitor/)
* [Status pages](https://betterstack.com/docs/uptime/api/list-all-escalation-policies/)
1. [Get started](https://betterstack.com/docs/uptime/getting-started-with-status-pages/)
2. [Advanced guide](https://betterstack.com/docs/uptime/custom-subdomain/)
* [Uptime API](https://betterstack.com/docs/uptime/api/list-all-escalation-policies/)
1. [Getting an API token](https://betterstack.com/docs/uptime/api/getting-started-with-uptime-api/)
2. [Monitors](https://betterstack.com/docs/uptime/api/list-all-existing-monitors/)
3. [Heartbeats](https://betterstack.com/docs/uptime/api/list-all-existing-hearbeats/)
4. [On-call & incidents](https://betterstack.com/docs/uptime/api/on-call-calendar/)
1. [On-call schedule](https://betterstack.com/docs/uptime/api/list-all-existing-on-call-calendars/)
2. [On-call schedule events](https://betterstack.com/docs/uptime/api/list-on-call-calendar-events/)
3. [On-call schedule rotations](https://betterstack.com/docs/uptime/api/get-on-call-calendar-rotation/)
4. [Escalation policies](https://betterstack.com/docs/uptime/api/list-all-escalation-policies/)
1. [List escalation policies GET](https://betterstack.com/docs/uptime/api/list-all-escalation-policies/)
2. [Get escalation policy GET](https://betterstack.com/docs/uptime/api/get-a-single-escalation-policy/)
3. [Create escalation policy POST](https://betterstack.com/docs/uptime/api/create-escalation-policy/)
4. [Update escalation policy PATCH](https://betterstack.com/docs/uptime/api/update-escalation-policy/)
5. [Remove escalation policy DELETE](https://betterstack.com/docs/uptime/api/delete-escalation-policy/)
6. [Response attributes](https://betterstack.com/docs/uptime/api/escalation-policies-api-response-params/)
5. [Escalation policy groups](https://betterstack.com/docs/uptime/api/list-all-existing-escalation-policy-groups/)
6. [Severities](https://betterstack.com/docs/uptime/api/list-all-severities/)
7. [Severity groups](https://betterstack.com/docs/uptime/api/list-all-existing-severity-groups/)
8. [Incidents](https://betterstack.com/docs/uptime/api/list-all-incidents/)
9. [Comments](https://betterstack.com/docs/uptime/api/list-all-comments/)
5. [Status pages](https://betterstack.com/docs/uptime/api/list-all-existing-status-pages/)
6. [Metadata](https://betterstack.com/docs/uptime/api/metadata/)
7. [Integrations](https://betterstack.com/docs/uptime/api/list-all-new-relic-integrations/)
8. [Team members](https://betterstack.com/docs/uptime/api/team-members/list/)
List escalation policies
========================
Returns a list of existing escalation policies. This endpoint [supports pagination](https://betterstack.com/docs/uptime/api/pagination/)
.
GET https://uptime.betterstack.com/api/v3/policies
Query parameters
team\_name
string
Filter policies belonging to a specified team when using [global API token](https://betterstack.com/docs/uptime/api/getting-started-with-uptime-api/#get-a-global-api-token)
.
Headers
Authorization
required string
Bearer `$TOKEN`
200
Paginated list of escalation policies
Response body
{
"data": [\
{\
"id": "123",\
"type": "policy",\
"attributes": {\
"name": "Policy - Branching",\
"repeat_count": 3,\
"repeat_delay": 60,\
"incident_token": "vZpYuaRYvLa6t2yqRqHTmEVKu",\
"policy_group_id": null,\
"team_name": "Test team",\
"steps": [\
{\
"type": "time_branching",\
"wait_before": 0,\
"timezone": "Prague",\
"days": ["mon", "tue", "wed", "thu", "fri"],\
"time_from": "00:00",\
"time_to": "00:00",\
"policy_id": 456\
},\
{\
"type": "time_branching",\
"wait_before": 0,\
"timezone": "Prague",\
"days": ["sat", "sun"],\
"time_from": "00:00",\
"time_to": "00:00",\
"policy_metadata_key": "Weekend-policy"\
}\
]\
}\
},\
{\
"id": "456",\
"type": "policy",\
"attributes": {\
"name": "Policy A",\
"repeat_count": 5,\
"repeat_delay": 0,\
"incident_token": "8nEiLj2gfqjfQRK6vzkFuGC25"\
"policy_group_id": null,\
"team_name": "Test team",\
"steps": [\
{\
"type": "escalation",\
"wait_before": 0,\
"urgency_id": 12345,\
"step_members": [\
{ "type": "all_slack_integrations" },\
{ "type": "current_on_call" }\
]\
}\
]\
}\
}\
],
"pagination": {
"first": "https://uptime.betterstack.com/api/v3/policies?page=1",
"last": "https://uptime.betterstack.com/api/v3/policies?page=1",
"prev": null,
"next": null
}
}
#### Example cURL
Example
Copied!
curl --request GET \
--url https://uptime.betterstack.com/api/v3/policies \
--header "Authorization: Bearer $TOKEN"
#### Looking for the details of a specific parameter?
Explore [the list of all escalation policies API parameters](https://betterstack.com/docs/uptime/api/escalation-policies-api-response-params/?utm_content=callout&utm_medium=docs-uptime&utm_source=community&utm_term=docs-uptime-api-list-all-escalation-policies)
.
* * *
[Previous article\
\
Remove an on-call schedule rotation](https://betterstack.com/docs/uptime/api/remove-on-call-calendar-rotation/)
[Next article\
\
Get escalation policy](https://betterstack.com/docs/uptime/api/get-a-single-escalation-policy/)
### Please accept cookies
We use cookies to authenticate users, improve the product user experience, and for [personalized ads](https://business.safety.google/privacy/)
. [Learn more.](https://betterstack.com/privacy)
Deny Accept required Accept all
---
# Resolving an incident | Better Stack Documentation
###### Explore documentation
* [Welcome to Uptime 👋](https://betterstack.com/docs/uptime/start/)
* [Frequently Asked Questions](https://betterstack.com/docs/uptime/frequently-asked-questions/)
* [On-call scheduling and alerting](https://betterstack.com/docs/uptime/resolving-an-incident/)
1. [Get started](https://betterstack.com/docs/uptime/getting-started-with-oncall-v2/)
2. [Slack and other integrations ↗](https://betterstack.com/docs/uptime/slack/)
3. [Connecting external calendars](https://betterstack.com/docs/uptime/connecting-external-calendars/)
4. [Advanced guide](https://betterstack.com/docs/uptime/escalation-policies/)
* [Incidents](https://betterstack.com/docs/uptime/resolving-an-incident/)
1. [Get started](https://betterstack.com/docs/uptime/working-with-incidents/)
1. [Acknowledging an incident](https://betterstack.com/docs/uptime/acknowledging-an-incident/)
2. [Resolving an incident](https://betterstack.com/docs/uptime/resolving-an-incident/)
3. [Incident details](https://betterstack.com/docs/uptime/incident-details/)
4. [Commenting on incidents](https://betterstack.com/docs/uptime/commenting-on-incidents/)
5. [Incident grouping](https://betterstack.com/docs/uptime/incident-grouping/)
6. [Create incidents manually](https://betterstack.com/docs/uptime/creating-incidents-manually/)
2. [Advanced guide](https://betterstack.com/docs/uptime/post-mortems/)
3. [Reporting ↗](https://betterstack.com/docs/getting-started/team-and-account-management/reporting/)
* [Monitoring](https://betterstack.com/docs/uptime/resolving-an-incident/)
1. [Get started](https://betterstack.com/docs/uptime/monitoring-start/)
2. [Working with monitors](https://betterstack.com/docs/uptime/bulk-importing-monitors/)
3. [Customizing monitors](https://betterstack.com/docs/uptime/naming-monitors/)
4. [Monitor types](https://betterstack.com/docs/uptime/uptime-monitor/)
* [Status pages](https://betterstack.com/docs/uptime/resolving-an-incident/)
1. [Get started](https://betterstack.com/docs/uptime/getting-started-with-status-pages/)
2. [Advanced guide](https://betterstack.com/docs/uptime/custom-subdomain/)
* [Uptime API](https://betterstack.com/docs/uptime/resolving-an-incident/)
1. [Getting an API token](https://betterstack.com/docs/uptime/api/getting-started-with-uptime-api/)
2. [Monitors](https://betterstack.com/docs/uptime/api/list-all-existing-monitors/)
3. [Heartbeats](https://betterstack.com/docs/uptime/api/list-all-existing-hearbeats/)
4. [On-call & incidents](https://betterstack.com/docs/uptime/api/on-call-calendar/)
5. [Status pages](https://betterstack.com/docs/uptime/api/list-all-existing-status-pages/)
6. [Metadata](https://betterstack.com/docs/uptime/api/metadata/)
7. [Integrations](https://betterstack.com/docs/uptime/api/list-all-new-relic-integrations/)
8. [Team members](https://betterstack.com/docs/uptime/api/team-members/list/)
Resolving an incident
=====================
You can manually resolve an incident by clicking **Resolve** in the upper-right corner of the incident detail page. The alternative would be to wait until the incident has resolved automatically.
Incidents are automatically resolved once the endpoint becomes available again.
* * *
[Previous article\
\
Acknowledging an incident](https://betterstack.com/docs/uptime/acknowledging-an-incident/)
[Next article\
\
Incident details](https://betterstack.com/docs/uptime/incident-details/)
### Please accept cookies
We use cookies to authenticate users, improve the product user experience, and for [personalized ads](https://business.safety.google/privacy/)
. [Learn more.](https://betterstack.com/privacy)
Deny Accept required Accept all
---
# Acknowledging an incident | Better Stack Documentation
###### Explore documentation
* [Welcome to Uptime 👋](https://betterstack.com/docs/uptime/start/)
* [Frequently Asked Questions](https://betterstack.com/docs/uptime/frequently-asked-questions/)
* [On-call scheduling and alerting](https://betterstack.com/docs/uptime/acknowledging-an-incident/)
1. [Get started](https://betterstack.com/docs/uptime/getting-started-with-oncall-v2/)
2. [Slack and other integrations ↗](https://betterstack.com/docs/uptime/slack/)
3. [Connecting external calendars](https://betterstack.com/docs/uptime/connecting-external-calendars/)
4. [Advanced guide](https://betterstack.com/docs/uptime/escalation-policies/)
* [Incidents](https://betterstack.com/docs/uptime/acknowledging-an-incident/)
1. [Get started](https://betterstack.com/docs/uptime/working-with-incidents/)
1. [Acknowledging an incident](https://betterstack.com/docs/uptime/acknowledging-an-incident/)
2. [Resolving an incident](https://betterstack.com/docs/uptime/resolving-an-incident/)
3. [Incident details](https://betterstack.com/docs/uptime/incident-details/)
4. [Commenting on incidents](https://betterstack.com/docs/uptime/commenting-on-incidents/)
5. [Incident grouping](https://betterstack.com/docs/uptime/incident-grouping/)
6. [Create incidents manually](https://betterstack.com/docs/uptime/creating-incidents-manually/)
2. [Advanced guide](https://betterstack.com/docs/uptime/post-mortems/)
3. [Reporting ↗](https://betterstack.com/docs/getting-started/team-and-account-management/reporting/)
* [Monitoring](https://betterstack.com/docs/uptime/acknowledging-an-incident/)
1. [Get started](https://betterstack.com/docs/uptime/monitoring-start/)
2. [Working with monitors](https://betterstack.com/docs/uptime/bulk-importing-monitors/)
3. [Customizing monitors](https://betterstack.com/docs/uptime/naming-monitors/)
4. [Monitor types](https://betterstack.com/docs/uptime/uptime-monitor/)
* [Status pages](https://betterstack.com/docs/uptime/acknowledging-an-incident/)
1. [Get started](https://betterstack.com/docs/uptime/getting-started-with-status-pages/)
2. [Advanced guide](https://betterstack.com/docs/uptime/custom-subdomain/)
* [Uptime API](https://betterstack.com/docs/uptime/acknowledging-an-incident/)
1. [Getting an API token](https://betterstack.com/docs/uptime/api/getting-started-with-uptime-api/)
2. [Monitors](https://betterstack.com/docs/uptime/api/list-all-existing-monitors/)
3. [Heartbeats](https://betterstack.com/docs/uptime/api/list-all-existing-hearbeats/)
4. [On-call & incidents](https://betterstack.com/docs/uptime/api/on-call-calendar/)
5. [Status pages](https://betterstack.com/docs/uptime/api/list-all-existing-status-pages/)
6. [Metadata](https://betterstack.com/docs/uptime/api/metadata/)
7. [Integrations](https://betterstack.com/docs/uptime/api/list-all-new-relic-integrations/)
8. [Team members](https://betterstack.com/docs/uptime/api/team-members/list/)
Acknowledging an incident
=========================
After you have acknowledged an incident, no other team members get alerted anymore.
### Acknowledging incidents in the dashboard
You can manually acknowledge an incident by going to **Incidents**, and then clicking **Acknowledge** in the upper-right corner of an individual incident's detail page.
### Acknowledging via phone call
When Uptime calls you, you are prompted to press 1 to acknowledge the incident. If you don't want to acknowledge the incident (you may, for example, not have your computer on you, and can't start resolving the problem right away), simply hang up, and other team members will get alerted.
### Acknowledging via email
To acknowledge an incident, click the **Acknowledge** incident button in the e-mail you receive when a new incident is started.
* * *
[Previous article\
\
Get started with incidents](https://betterstack.com/docs/uptime/working-with-incidents/)
[Next article\
\
Resolving an incident](https://betterstack.com/docs/uptime/resolving-an-incident/)
### Please accept cookies
We use cookies to authenticate users, improve the product user experience, and for [personalized ads](https://business.safety.google/privacy/)
. [Learn more.](https://betterstack.com/privacy)
Deny Accept required Accept all
---
# Get a single warehouse source | Better Stack Documentation
###### Explore documentation
* [Welcome to Warehouse 👋](https://betterstack.com/docs/warehouse/start/)
* [Ingesting data](https://betterstack.com/docs/warehouse/api/sources/get/)
1. [Ingesting events](https://betterstack.com/docs/warehouse/ingesting-data/intro/)
2. [S3 vs NVMe hosted data](https://betterstack.com/docs/warehouse/ingesting-data/s3-vs-nvme/)
3. [Host events in your S3 bucket](https://betterstack.com/docs/warehouse/ingesting-data/custom-s3-bucket/)
* [Querying data](https://betterstack.com/docs/warehouse/api/sources/get/)
1. [Querying events & time series](https://betterstack.com/docs/warehouse/querying-data/events-and-time-series/)
2. [Writing SQL queries](https://betterstack.com/docs/warehouse/querying-data/merge-and-state-aggregators/)
3. [Query speeds](https://betterstack.com/docs/warehouse/querying-data/query-speeds/)
4. [Ad-hoc SQL API](https://betterstack.com/docs/warehouse/querying-data/ad-hoc-sql-api/)
5. [Generate client-facing APIs](https://betterstack.com/docs/warehouse/querying-data/queries/)
6. [Visualizing data](https://betterstack.com/docs/warehouse/querying-data/visualizing-data/)
* [Vector embeddings](https://betterstack.com/docs/warehouse/api/sources/get/)
1. [Introduction to embeddings](https://betterstack.com/docs/warehouse/vector-embeddings/intro/)
2. [Using built-in embeddings](https://betterstack.com/docs/warehouse/vector-embeddings/built-in-embeddings/)
3. [Bringing your own embeddings](https://betterstack.com/docs/warehouse/vector-embeddings/bring-your-own/)
4. [Data structures and indices](https://betterstack.com/docs/warehouse/vector-embeddings/data-structures-and-indices/)
* [Use cases](https://betterstack.com/docs/warehouse/api/sources/get/)
1. [Retrieval Augmented Generation](https://betterstack.com/docs/warehouse/use-cases/building-rag/)
* [Management](https://betterstack.com/docs/warehouse/api/sources/get/)
1. [Controlling costs](https://betterstack.com/docs/warehouse/management/controlling-costs/)
* [Warehouse API](https://betterstack.com/docs/warehouse/api/sources/get/)
1. [Getting an API token](https://betterstack.com/docs/warehouse/api/getting-api-token/)
2. [Warehouse sources API](https://betterstack.com/docs/warehouse/api/sources/list/)
1. [List all sources GET](https://betterstack.com/docs/warehouse/api/sources/list/)
2. [Get a single source GET](https://betterstack.com/docs/warehouse/api/sources/get/)
3. [Create a source POST](https://betterstack.com/docs/warehouse/api/sources/create/)
4. [Update a source PUT](https://betterstack.com/docs/warehouse/api/sources/update/)
5. [Remove a source DELETE](https://betterstack.com/docs/warehouse/api/sources/delete/)
3. [Warehouse source groups API](https://betterstack.com/docs/warehouse/api/source-groups/list/)
4. [Time series API](https://betterstack.com/docs/warehouse/api/time-series/list/)
5. [Embeddings API](https://betterstack.com/docs/warehouse/api/embeddings/list/)
Get a single warehouse source
=============================
Returns a specific Warehouse source by its ID.
GET https://warehouse.betterstack.com/api/v1/sources/{id}
URL parameters
id
required string
The ID of the Warehouse source to retrieve.
Headers
Authorization
required string
Bearer `$TOKEN`
200
The requested Warehouse source.
Response body
{
"data": {
"id": "5678",
"type": "warehouse_source",
"attributes": {
"warehouse_source_group_id": 1234,
"team_id": 123456,
"team_name": "example-team",
"name": "Warehouse test",
"table_name": "warehouse_test",
"token": "abc123def456ghi789jkl012",
"ingesting_paused": false,
"ingesting_host": "s5678.us-east-9.betterstackdata.com",
"created_at": "2025-10-06T09:24:10.776Z",
"updated_at": "2025-10-21T16:38:50.712Z",
"events_retention": 90,
"time_series_retention": 180,
"live_tail_pattern": "{status} {message}",
"data_region": "us-east-9",
"custom_bucket": null,
"vrl_transformation": ""
}
}
}
401
Unauthorized
Response body
{
"errors": "Invalid Team API token. How to find your Team API token: https://betterstack.com/docs/logs/api/getting-started/#obtaining-a-logtail-api-token"
}
404
Not Found
Response body
{
"errors": "Resource with the provided ID was not found"
}
#### Example cURL
Example
Copied!
curl --request GET \
--url https://warehouse.betterstack.com/api/v1/sources/5678 \
--header "Authorization: Bearer $TOKEN"
* * *
[Previous article\
\
List all warehouse sources](https://betterstack.com/docs/warehouse/api/sources/list/)
[Next article\
\
Create a warehouse source](https://betterstack.com/docs/warehouse/api/sources/create/)
### Please accept cookies
We use cookies to authenticate users, improve the product user experience, and for [personalized ads](https://business.safety.google/privacy/)
. [Learn more.](https://betterstack.com/privacy)
Deny Accept required Accept all
---
# Create a time series | Better Stack Documentation
###### Explore documentation
* [Welcome to Warehouse 👋](https://betterstack.com/docs/warehouse/start/)
* [Ingesting data](https://betterstack.com/docs/warehouse/api/time-series/create/)
1. [Ingesting events](https://betterstack.com/docs/warehouse/ingesting-data/intro/)
2. [S3 vs NVMe hosted data](https://betterstack.com/docs/warehouse/ingesting-data/s3-vs-nvme/)
3. [Host events in your S3 bucket](https://betterstack.com/docs/warehouse/ingesting-data/custom-s3-bucket/)
* [Querying data](https://betterstack.com/docs/warehouse/api/time-series/create/)
1. [Querying events & time series](https://betterstack.com/docs/warehouse/querying-data/events-and-time-series/)
2. [Writing SQL queries](https://betterstack.com/docs/warehouse/querying-data/merge-and-state-aggregators/)
3. [Query speeds](https://betterstack.com/docs/warehouse/querying-data/query-speeds/)
4. [Ad-hoc SQL API](https://betterstack.com/docs/warehouse/querying-data/ad-hoc-sql-api/)
5. [Generate client-facing APIs](https://betterstack.com/docs/warehouse/querying-data/queries/)
6. [Visualizing data](https://betterstack.com/docs/warehouse/querying-data/visualizing-data/)
* [Vector embeddings](https://betterstack.com/docs/warehouse/api/time-series/create/)
1. [Introduction to embeddings](https://betterstack.com/docs/warehouse/vector-embeddings/intro/)
2. [Using built-in embeddings](https://betterstack.com/docs/warehouse/vector-embeddings/built-in-embeddings/)
3. [Bringing your own embeddings](https://betterstack.com/docs/warehouse/vector-embeddings/bring-your-own/)
4. [Data structures and indices](https://betterstack.com/docs/warehouse/vector-embeddings/data-structures-and-indices/)
* [Use cases](https://betterstack.com/docs/warehouse/api/time-series/create/)
1. [Retrieval Augmented Generation](https://betterstack.com/docs/warehouse/use-cases/building-rag/)
* [Management](https://betterstack.com/docs/warehouse/api/time-series/create/)
1. [Controlling costs](https://betterstack.com/docs/warehouse/management/controlling-costs/)
* [Warehouse API](https://betterstack.com/docs/warehouse/api/time-series/create/)
1. [Getting an API token](https://betterstack.com/docs/warehouse/api/getting-api-token/)
2. [Warehouse sources API](https://betterstack.com/docs/warehouse/api/sources/list/)
3. [Warehouse source groups API](https://betterstack.com/docs/warehouse/api/source-groups/list/)
4. [Time series API](https://betterstack.com/docs/warehouse/api/time-series/list/)
1. [List all time series GET](https://betterstack.com/docs/warehouse/api/time-series/list/)
2. [Create a time series POST](https://betterstack.com/docs/warehouse/api/time-series/create/)
3. [Remove a time series DELETE](https://betterstack.com/docs/warehouse/api/time-series/delete/)
5. [Embeddings API](https://betterstack.com/docs/warehouse/api/embeddings/list/)
Create a time series
====================
Creates a new computed time series for a Warehouse source.
POST https://warehouse.betterstack.com/api/v1/sources/{source\_id}/time\_series
URL parameters
source\_id
required string
The ID of the Warehouse source to create the time series for.
Headers
Authorization
required string
Bearer `$TOKEN`
Content-Type
required string
application/json
Body parameters
name
required string
The name of the time series. Must contain only letters, numbers, and underscores.
type
required string
The data type of the time series. Valid types are: `string`, `string_low_cardinality`, `int64_delta`, `int64`, `uint64_delta`, `uint64`, `float64_delta`, `datetime64_delta`, `boolean`, `array_bfloat16`, `array_float32`.
sql\_expression
required string
The SQL expression used to compute the time series. For example `JSONExtract(raw, 'response_time', 'Nullable(Float64)')`.
aggregations
array
An array of aggregation functions (e.g., `avg`, `min`, `max`). If omitted, no aggregations are applied.
expression\_index
string
The type of vector index to apply (e.g., `vector_similarity`). Only applicable for vector types (`array_bfloat16`, `array_float32`).
vector\_dimension
integer
The vector dimension if `expression_index` is `vector_similarity` (e.g., `512`). Supported values: 256, 384, 512, 768, 1024, 1536, 3072, 4096, 10752.
vector\_distance\_function
string
The distance function to use for vector similarity (e.g., `cosine`, `l2`).
201
The newly created time series configuration.
Response body
{
"data": {
"id": "5215107",
"type": "time_series",
"attributes": {
"name": "level",
"sql_expression": "JSONExtract(raw, 'level', 'Nullable(String)')",
"aggregations": [],
"type": "string_low_cardinality",
"expression_index": null
}
}
}
401
Unauthorized
Response body
{
"errors": "Invalid authentication"
}
404
Not Found
Response body
{
"errors": "Source with the provided ID was not found"
}
422
Unprocessable Entity - Validation Errors
Response body
{
"errors": "Validation errors",
"invalid_values": {
"name": [\
"name must only contain letters, numbers, and underscores"\
],
"type": [\
"type must be one of string, string_low_cardinality, int64_delta, int64, uint64_delta, uint64, float64_delta, datetime64_delta, boolean, array_bfloat16, array_float32"\
],
"sql_expression": [\
"sql_expression is invalid"\
]
}
}
#### Example cURL
Example
Copied!
curl --request POST \
--url https://warehouse.betterstack.com/api/v1/sources/12345/time_series \
--header "Authorization: Bearer $TOKEN" \
--header 'Content-Type: application/json' \
--data '{
"name": "response_time_avg",
"type": "float64_delta",
"sql_expression": "JSONExtract(raw, 'response_time', 'Nullable(Float64)')",
"aggregations": ["avg", "min", "max"]
}'
* * *
[Previous article\
\
List all time series](https://betterstack.com/docs/warehouse/api/time-series/list/)
[Next article\
\
Remove a time series](https://betterstack.com/docs/warehouse/api/time-series/delete/)
### Please accept cookies
We use cookies to authenticate users, improve the product user experience, and for [personalized ads](https://business.safety.google/privacy/)
. [Learn more.](https://betterstack.com/privacy)
Deny Accept required Accept all
---
# Get comment | Better Stack Documentation
###### Explore documentation
* [Welcome to Uptime 👋](https://betterstack.com/docs/uptime/start/)
* [Frequently Asked Questions](https://betterstack.com/docs/uptime/frequently-asked-questions/)
* [On-call scheduling and alerting](https://betterstack.com/docs/uptime/api/list-a-single-comment/)
1. [Get started](https://betterstack.com/docs/uptime/getting-started-with-oncall-v2/)
2. [Slack and other integrations ↗](https://betterstack.com/docs/uptime/slack/)
3. [Connecting external calendars](https://betterstack.com/docs/uptime/connecting-external-calendars/)
4. [Advanced guide](https://betterstack.com/docs/uptime/escalation-policies/)
* [Incidents](https://betterstack.com/docs/uptime/api/list-a-single-comment/)
1. [Get started](https://betterstack.com/docs/uptime/working-with-incidents/)
2. [Advanced guide](https://betterstack.com/docs/uptime/post-mortems/)
3. [Reporting ↗](https://betterstack.com/docs/getting-started/team-and-account-management/reporting/)
* [Monitoring](https://betterstack.com/docs/uptime/api/list-a-single-comment/)
1. [Get started](https://betterstack.com/docs/uptime/monitoring-start/)
2. [Working with monitors](https://betterstack.com/docs/uptime/bulk-importing-monitors/)
3. [Customizing monitors](https://betterstack.com/docs/uptime/naming-monitors/)
4. [Monitor types](https://betterstack.com/docs/uptime/uptime-monitor/)
* [Status pages](https://betterstack.com/docs/uptime/api/list-a-single-comment/)
1. [Get started](https://betterstack.com/docs/uptime/getting-started-with-status-pages/)
2. [Advanced guide](https://betterstack.com/docs/uptime/custom-subdomain/)
* [Uptime API](https://betterstack.com/docs/uptime/api/list-a-single-comment/)
1. [Getting an API token](https://betterstack.com/docs/uptime/api/getting-started-with-uptime-api/)
2. [Monitors](https://betterstack.com/docs/uptime/api/list-all-existing-monitors/)
3. [Heartbeats](https://betterstack.com/docs/uptime/api/list-all-existing-hearbeats/)
4. [On-call & incidents](https://betterstack.com/docs/uptime/api/on-call-calendar/)
1. [On-call schedule](https://betterstack.com/docs/uptime/api/list-all-existing-on-call-calendars/)
2. [On-call schedule events](https://betterstack.com/docs/uptime/api/list-on-call-calendar-events/)
3. [On-call schedule rotations](https://betterstack.com/docs/uptime/api/get-on-call-calendar-rotation/)
4. [Escalation policies](https://betterstack.com/docs/uptime/api/list-all-escalation-policies/)
5. [Escalation policy groups](https://betterstack.com/docs/uptime/api/list-all-existing-escalation-policy-groups/)
6. [Severities](https://betterstack.com/docs/uptime/api/list-all-severities/)
7. [Severity groups](https://betterstack.com/docs/uptime/api/list-all-existing-severity-groups/)
8. [Incidents](https://betterstack.com/docs/uptime/api/list-all-incidents/)
9. [Comments](https://betterstack.com/docs/uptime/api/list-all-comments/)
1. [List comments GET](https://betterstack.com/docs/uptime/api/list-all-comments/)
2. [Get comment GET](https://betterstack.com/docs/uptime/api/list-a-single-comment/)
3. [Create comment POST](https://betterstack.com/docs/uptime/api/create-a-new-comment/)
4. [Update comment PATCH](https://betterstack.com/docs/uptime/api/update-a-comment/)
5. [Remove comment DELETE](https://betterstack.com/docs/uptime/api/delete-an-existing-comment/)
5. [Status pages](https://betterstack.com/docs/uptime/api/list-all-existing-status-pages/)
6. [Metadata](https://betterstack.com/docs/uptime/api/metadata/)
7. [Integrations](https://betterstack.com/docs/uptime/api/list-all-new-relic-integrations/)
8. [Team members](https://betterstack.com/docs/uptime/api/team-members/list/)
Get comment
===========
This will return an existing comment.
GET https://uptime.betterstack.com/api/v2/incidents/{incident\_id}/comments/{comment\_id}
URL parameters
incident\_id
required string
The ID of the incident
comment\_id
required string
The ID of the comment
Headers
Authorization
required string
Bearer `$TOKEN`
Content\_Type
string
application/json
200
Returns a single comment
Response body
{
"data": {
"id": "1",
"type": "incident_comment",
"attributes": {
"id": 1,
"content": "content",
"user_id": 123,
"user_email": "test@example.com",
"created_at": "2025-06-03T12:10:28.357Z",
"updated_at": "2025-06-03T12:10:28.357Z"
}
}
}
404
Comment or incident was not found
#### Example cURL
Example
Copied!
curl --url https://uptime.betterstack.com/api/v2/incidents/1/comments/1 \
--header "Authorization: Bearer $TOKEN" \
--header 'Content-Type: application/json'
* * *
[Previous article\
\
List comments](https://betterstack.com/docs/uptime/api/list-all-comments/)
[Next article\
\
Create comment](https://betterstack.com/docs/uptime/api/create-a-new-comment/)
### Please accept cookies
We use cookies to authenticate users, improve the product user experience, and for [personalized ads](https://business.safety.google/privacy/)
. [Learn more.](https://betterstack.com/privacy)
Deny Accept required Accept all
---
# Update a metric | Better Stack Documentation
###### Explore documentation
* [Welcome to Telemetry 👋](https://betterstack.com/docs/logs/start/)
* [Quick start guide](https://betterstack.com/docs/logs/logging-start/)
* [Wide events vs. metrics](https://betterstack.com/docs/logs/wide-events-time-series/)
* [Ingesting data](https://betterstack.com/docs/logs/api/updating-an-existing-metric/)
1. [Better Stack collector](https://betterstack.com/docs/logs/collector/)
2. [Vector](https://betterstack.com/docs/logs/vector/)
3. [OpenTelemetry](https://betterstack.com/docs/logs/open-telemetry/)
4. [Ingesting via HTTP API](https://betterstack.com/docs/logs/ingesting-data/http/logs/)
5. [Ingesting metrics](https://betterstack.com/docs/logs/ingesting-data/metrics/prometheus-scrape/)
6. [Ingesting logs](https://betterstack.com/docs/logs/ingesting-data/logs/docker-kubernetes/)
7. [Migrating to Better Stack](https://betterstack.com/docs/logs/datadog-agent/)
* [Using the product](https://betterstack.com/docs/logs/api/updating-an-existing-metric/)
1. [AI SRE ↗](https://betterstack.com/demos/ai-sre/)
2. [MCP server ↗](https://betterstack.com/docs/getting-started/integrations/mcp/)
3. [Transforming ingested data](https://betterstack.com/docs/logs/using-logtail/transforming-ingested-data/logs-vrl/)
4. [Querying data](https://betterstack.com/docs/logs/using-logtail/live-tail-query-language/)
5. [Tracing](https://betterstack.com/docs/logs/tracing/)
6. [Alerts](https://betterstack.com/docs/logs/dashboards/alerts/)
* [Telemetry API](https://betterstack.com/docs/logs/api/updating-an-existing-metric/)
1. [Getting an API token](https://betterstack.com/docs/logs/api/getting-started/)
2. [Sources & collectors](https://betterstack.com/docs/logs/api/list-all-existing-sources/)
1. [Sources API](https://betterstack.com/docs/logs/api/list-all-existing-sources/)
2. [Collectors API](https://betterstack.com/docs/logs/api/list-all-collectors/)
3. [Metrics API](https://betterstack.com/docs/logs/api/list-all-existing-metrics/)
1. [List all metrics GET](https://betterstack.com/docs/logs/api/list-all-existing-metrics/)
2. [Create a metric POST](https://betterstack.com/docs/logs/api/creating-a-metric/)
3. [Update a metric PATCH](https://betterstack.com/docs/logs/api/updating-an-existing-metric/)
4. [Remove a metric DELETE](https://betterstack.com/docs/logs/api/deleting-an-existing-metric/)
4. [Source groups API](https://betterstack.com/docs/logs/api/list-all-existing-source-groups/)
3. [Dashboards](https://betterstack.com/docs/logs/api/dashboards/list/)
4. [Explorations](https://betterstack.com/docs/logs/api/explorations/list/)
5. [Alerts API](https://betterstack.com/docs/logs/api/alerts/list/)
6. [Connections API](https://betterstack.com/docs/logs/api/connections/list/)
7. [Query API ↗](https://betterstack.com/docs/logs/query-api/connect-remotely/)
* [Alternative to](https://betterstack.com/docs/logs/api/updating-an-existing-metric/)
1. [Lightstep](https://betterstack.com/docs/logs/alternative-to/lightstep/)
Update a metric
===============
Updates an existing metric. At least one of `name`, `sql_expression`, `type`, or `aggregations` must be provided.
PATCH https://telemetry.betterstack.com/api/v2/sources/{source\_id}/metrics/{id}
URL parameters
source\_id
required integer
Source for which to update a metric
id
required string
ID of the metric you want to update
Headers
Authorization
required string
Bearer `$TOKEN`
Body parameters
name
string
Metric name
sql\_expression
string
SQL expression to use for the metric
aggregations
array
Aggregations to apply to the metric.
Valid aggregations are avg, count, uniq, max, min, anyLast, sum, p50, p90, p95, p99
type
string
Metric type.
Valid types are `string_low_cardinality`, `int64_delta`, `float64_delta`, `datetime64_delta`, and `boolean`
build\_type
string
How to process historical data. `new_data` (default) applies the change going forward. `historical_logs` reprocesses retained logs.
200
Response body
{
"data": {
"id": "g-123",
"type": "metric",
"attributes": {
"name": "level",
"sql_expression": "JSONExtract(raw, 'level', 'Nullable(String)')",
"aggregations": [],
"type": "string_low_cardinality"
}
}
}
404
The source does not have a metric with the given ID
Response body
{
"errors": "Resource with provided ID was not found"
}
#### Example cURL
Example
Copied!
curl --request PATCH \
--url https://telemetry.betterstack.com/api/v2/sources/123/metrics/g-456 \
--header "Authorization: Bearer $TOKEN" \
--header "Content-Type: application/json" \
--data '{
"name": "log_type"
}'
* * *
[Previous article\
\
Create a metric](https://betterstack.com/docs/logs/api/creating-a-metric/)
[Next article\
\
Remove a metric](https://betterstack.com/docs/logs/api/deleting-an-existing-metric/)
### Please accept cookies
We use cookies to authenticate users, improve the product user experience, and for [personalized ads](https://business.safety.google/privacy/)
. [Learn more.](https://betterstack.com/privacy)
Deny Accept required Accept all
---
# Remove an exploration | Better Stack Documentation
###### Explore documentation
* [Welcome to Telemetry 👋](https://betterstack.com/docs/logs/start/)
* [Quick start guide](https://betterstack.com/docs/logs/logging-start/)
* [Wide events vs. metrics](https://betterstack.com/docs/logs/wide-events-time-series/)
* [Ingesting data](https://betterstack.com/docs/logs/api/explorations/delete/)
1. [Better Stack collector](https://betterstack.com/docs/logs/collector/)
2. [Vector](https://betterstack.com/docs/logs/vector/)
3. [OpenTelemetry](https://betterstack.com/docs/logs/open-telemetry/)
4. [Ingesting via HTTP API](https://betterstack.com/docs/logs/ingesting-data/http/logs/)
5. [Ingesting metrics](https://betterstack.com/docs/logs/ingesting-data/metrics/prometheus-scrape/)
6. [Ingesting logs](https://betterstack.com/docs/logs/ingesting-data/logs/docker-kubernetes/)
7. [Migrating to Better Stack](https://betterstack.com/docs/logs/datadog-agent/)
* [Using the product](https://betterstack.com/docs/logs/api/explorations/delete/)
1. [AI SRE ↗](https://betterstack.com/demos/ai-sre/)
2. [MCP server ↗](https://betterstack.com/docs/getting-started/integrations/mcp/)
3. [Transforming ingested data](https://betterstack.com/docs/logs/using-logtail/transforming-ingested-data/logs-vrl/)
4. [Querying data](https://betterstack.com/docs/logs/using-logtail/live-tail-query-language/)
5. [Tracing](https://betterstack.com/docs/logs/tracing/)
6. [Alerts](https://betterstack.com/docs/logs/dashboards/alerts/)
* [Telemetry API](https://betterstack.com/docs/logs/api/explorations/delete/)
1. [Getting an API token](https://betterstack.com/docs/logs/api/getting-started/)
2. [Sources & collectors](https://betterstack.com/docs/logs/api/list-all-existing-sources/)
3. [Dashboards](https://betterstack.com/docs/logs/api/dashboards/list/)
4. [Explorations](https://betterstack.com/docs/logs/api/explorations/list/)
1. [Explorations API](https://betterstack.com/docs/logs/api/explorations/list/)
1. [List all explorations GET](https://betterstack.com/docs/logs/api/explorations/list/)
2. [Get a single exploration GET](https://betterstack.com/docs/logs/api/explorations/get/)
3. [Create an exploration POST](https://betterstack.com/docs/logs/api/explorations/create/)
4. [Update an exploration PATCH](https://betterstack.com/docs/logs/api/explorations/update/)
5. [Remove an exploration DELETE](https://betterstack.com/docs/logs/api/explorations/delete/)
2. [Exploration alerts API](https://betterstack.com/docs/logs/api/exploration-alerts/list/)
3. [Exploration groups API](https://betterstack.com/docs/logs/api/exploration-groups/list/)
5. [Alerts API](https://betterstack.com/docs/logs/api/alerts/list/)
6. [Connections API](https://betterstack.com/docs/logs/api/connections/list/)
7. [Query API ↗](https://betterstack.com/docs/logs/query-api/connect-remotely/)
* [Alternative to](https://betterstack.com/docs/logs/api/explorations/delete/)
1. [Lightstep](https://betterstack.com/docs/logs/alternative-to/lightstep/)
Remove an exploration
=====================
Permanently deletes an exploration by its ID.
Deleting an exploration also permanently deletes its associated chart, queries, and any configured alerts. This action cannot be undone.
DELETE https://telemetry.betterstack.com/api/v2/explorations/{id}
URL parameters
id
required integer
The unique identifier of the exploration to delete.
Headers
Authorization
required string
Bearer `$TOKEN`
204
The exploration was successfully deleted. No content is returned.
401
Invalid or missing authentication token.
404
An exploration with the specified ID was not found.
Example request
---------------
cURL
Copied!
curl --request DELETE \
--url "https://telemetry.betterstack.com/api/v2/explorations/123" \
--header "Authorization: Bearer $TOKEN"
* * *
[Previous article\
\
Update an exploration](https://betterstack.com/docs/logs/api/explorations/update/)
[Next article\
\
List all alerts in an exploration](https://betterstack.com/docs/logs/api/exploration-alerts/list/)
###### On this page
* [Example request](https://betterstack.com/docs/logs/api/explorations/delete/#example-request)
### Please accept cookies
We use cookies to authenticate users, improve the product user experience, and for [personalized ads](https://business.safety.google/privacy/)
. [Learn more.](https://betterstack.com/privacy)
Deny Accept required Accept all
---
# Incident details | Better Stack Documentation
###### Explore documentation
* [Welcome to Uptime 👋](https://betterstack.com/docs/uptime/start/)
* [Frequently Asked Questions](https://betterstack.com/docs/uptime/frequently-asked-questions/)
* [On-call scheduling and alerting](https://betterstack.com/docs/uptime/incident-details/)
1. [Get started](https://betterstack.com/docs/uptime/getting-started-with-oncall-v2/)
2. [Slack and other integrations ↗](https://betterstack.com/docs/uptime/slack/)
3. [Connecting external calendars](https://betterstack.com/docs/uptime/connecting-external-calendars/)
4. [Advanced guide](https://betterstack.com/docs/uptime/escalation-policies/)
* [Incidents](https://betterstack.com/docs/uptime/incident-details/)
1. [Get started](https://betterstack.com/docs/uptime/working-with-incidents/)
1. [Acknowledging an incident](https://betterstack.com/docs/uptime/acknowledging-an-incident/)
2. [Resolving an incident](https://betterstack.com/docs/uptime/resolving-an-incident/)
3. [Incident details](https://betterstack.com/docs/uptime/incident-details/)
4. [Commenting on incidents](https://betterstack.com/docs/uptime/commenting-on-incidents/)
5. [Incident grouping](https://betterstack.com/docs/uptime/incident-grouping/)
6. [Create incidents manually](https://betterstack.com/docs/uptime/creating-incidents-manually/)
2. [Advanced guide](https://betterstack.com/docs/uptime/post-mortems/)
3. [Reporting ↗](https://betterstack.com/docs/getting-started/team-and-account-management/reporting/)
* [Monitoring](https://betterstack.com/docs/uptime/incident-details/)
1. [Get started](https://betterstack.com/docs/uptime/monitoring-start/)
2. [Working with monitors](https://betterstack.com/docs/uptime/bulk-importing-monitors/)
3. [Customizing monitors](https://betterstack.com/docs/uptime/naming-monitors/)
4. [Monitor types](https://betterstack.com/docs/uptime/uptime-monitor/)
* [Status pages](https://betterstack.com/docs/uptime/incident-details/)
1. [Get started](https://betterstack.com/docs/uptime/getting-started-with-status-pages/)
2. [Advanced guide](https://betterstack.com/docs/uptime/custom-subdomain/)
* [Uptime API](https://betterstack.com/docs/uptime/incident-details/)
1. [Getting an API token](https://betterstack.com/docs/uptime/api/getting-started-with-uptime-api/)
2. [Monitors](https://betterstack.com/docs/uptime/api/list-all-existing-monitors/)
3. [Heartbeats](https://betterstack.com/docs/uptime/api/list-all-existing-hearbeats/)
4. [On-call & incidents](https://betterstack.com/docs/uptime/api/on-call-calendar/)
5. [Status pages](https://betterstack.com/docs/uptime/api/list-all-existing-status-pages/)
6. [Metadata](https://betterstack.com/docs/uptime/api/metadata/)
7. [Integrations](https://betterstack.com/docs/uptime/api/list-all-new-relic-integrations/)
8. [Team members](https://betterstack.com/docs/uptime/api/team-members/list/)
Incident details
================
### Responses
We save the raw response of your monitor.
### Screenshots
We take downtime screenshots of the monitored URL whenever we receive a non-blank response body. If the monitor fails due to a response timeout or returns an empty response body, no screenshot gets saved.
Since we take a screenshot at a slight delay from the monitor check, the screenshot might in some rare cases not reflect the failing state anymore.
* * *
[Previous article\
\
Resolving an incident](https://betterstack.com/docs/uptime/resolving-an-incident/)
[Next article\
\
Commenting on incidents](https://betterstack.com/docs/uptime/commenting-on-incidents/)
### Please accept cookies
We use cookies to authenticate users, improve the product user experience, and for [personalized ads](https://business.safety.google/privacy/)
. [Learn more.](https://betterstack.com/privacy)
Deny Accept required Accept all
---
# DNS monitor | Better Stack Documentation
###### Explore documentation
* [Welcome to Uptime 👋](https://betterstack.com/docs/uptime/start/)
* [Frequently Asked Questions](https://betterstack.com/docs/uptime/frequently-asked-questions/)
* [On-call scheduling and alerting](https://betterstack.com/docs/uptime/dns-monitor/)
1. [Get started](https://betterstack.com/docs/uptime/getting-started-with-oncall-v2/)
2. [Slack and other integrations ↗](https://betterstack.com/docs/uptime/slack/)
3. [Connecting external calendars](https://betterstack.com/docs/uptime/connecting-external-calendars/)
4. [Advanced guide](https://betterstack.com/docs/uptime/escalation-policies/)
* [Incidents](https://betterstack.com/docs/uptime/dns-monitor/)
1. [Get started](https://betterstack.com/docs/uptime/working-with-incidents/)
2. [Advanced guide](https://betterstack.com/docs/uptime/post-mortems/)
3. [Reporting ↗](https://betterstack.com/docs/getting-started/team-and-account-management/reporting/)
* [Monitoring](https://betterstack.com/docs/uptime/dns-monitor/)
1. [Get started](https://betterstack.com/docs/uptime/monitoring-start/)
2. [Working with monitors](https://betterstack.com/docs/uptime/bulk-importing-monitors/)
3. [Customizing monitors](https://betterstack.com/docs/uptime/naming-monitors/)
4. [Monitor types](https://betterstack.com/docs/uptime/uptime-monitor/)
1. [Uptime monitor](https://betterstack.com/docs/uptime/uptime-monitor/)
2. [Keyword monitor](https://betterstack.com/docs/uptime/keyword-monitor/)
3. [Ping monitor](https://betterstack.com/docs/uptime/ping-monitor/)
4. [Cron and heartbeat monitor](https://betterstack.com/docs/uptime/cron-and-heartbeat-monitor/)
5. [Playwright monitor](https://betterstack.com/docs/uptime/playwright-monitor/)
6. [API monitor](https://betterstack.com/docs/uptime/api-monitor/)
7. [DNS monitor](https://betterstack.com/docs/uptime/dns-monitor/)
8. [Domain expiration monitor](https://betterstack.com/docs/uptime/domain-expiration-monitoring/)
9. [SSL certificate monitor](https://betterstack.com/docs/uptime/ssl-certificate-monitor/)
10. [TCP/UDP port monitor](https://betterstack.com/docs/uptime/tcpudp-port-monitor/)
11. [Monitoring private networks](https://betterstack.com/docs/uptime/monitoring-private-networks/)
* [Status pages](https://betterstack.com/docs/uptime/dns-monitor/)
1. [Get started](https://betterstack.com/docs/uptime/getting-started-with-status-pages/)
2. [Advanced guide](https://betterstack.com/docs/uptime/custom-subdomain/)
* [Uptime API](https://betterstack.com/docs/uptime/dns-monitor/)
1. [Getting an API token](https://betterstack.com/docs/uptime/api/getting-started-with-uptime-api/)
2. [Monitors](https://betterstack.com/docs/uptime/api/list-all-existing-monitors/)
3. [Heartbeats](https://betterstack.com/docs/uptime/api/list-all-existing-hearbeats/)
4. [On-call & incidents](https://betterstack.com/docs/uptime/api/on-call-calendar/)
5. [Status pages](https://betterstack.com/docs/uptime/api/list-all-existing-status-pages/)
6. [Metadata](https://betterstack.com/docs/uptime/api/metadata/)
7. [Integrations](https://betterstack.com/docs/uptime/api/list-all-new-relic-integrations/)
8. [Team members](https://betterstack.com/docs/uptime/api/team-members/list/)
DNS monitor
===========
### Creating a DNS monitor
* Go to **Monitors** → **Create monitor**.
* Change the **Alert us when the host above** selection to "DNS server doesn't respond".
* Enter a DNS server IP in the **DNS server to monitor** field.
* Enter a domain name in the **Domain to query the DNS server with** field.
* Click **Create monitor**.
If this is your first time setting up DNS monitoring, we recommend starting with our [Introduction to DNS monitoring](https://betterstack.com/community/guides/what-is-dns-monitoring/?utm_content=callout&utm_medium=docs-uptime&utm_source=community&utm_term=docs-dns-monitor)
.
* * *
[Previous article\
\
API monitor](https://betterstack.com/docs/uptime/api-monitor/)
[Next article\
\
Domain expiration monitor](https://betterstack.com/docs/uptime/domain-expiration-monitoring/)
### Please accept cookies
We use cookies to authenticate users, improve the product user experience, and for [personalized ads](https://business.safety.google/privacy/)
. [Learn more.](https://betterstack.com/privacy)
Deny Accept required Accept all
---
# Domain expiration checks | Better Stack Documentation
###### Explore documentation
* [Welcome to Uptime 👋](https://betterstack.com/docs/uptime/start/)
* [Frequently Asked Questions](https://betterstack.com/docs/uptime/frequently-asked-questions/)
* [On-call scheduling and alerting](https://betterstack.com/docs/uptime/domain-expiration-checks/)
1. [Get started](https://betterstack.com/docs/uptime/getting-started-with-oncall-v2/)
2. [Slack and other integrations ↗](https://betterstack.com/docs/uptime/slack/)
3. [Connecting external calendars](https://betterstack.com/docs/uptime/connecting-external-calendars/)
4. [Advanced guide](https://betterstack.com/docs/uptime/escalation-policies/)
* [Incidents](https://betterstack.com/docs/uptime/domain-expiration-checks/)
1. [Get started](https://betterstack.com/docs/uptime/working-with-incidents/)
2. [Advanced guide](https://betterstack.com/docs/uptime/post-mortems/)
3. [Reporting ↗](https://betterstack.com/docs/getting-started/team-and-account-management/reporting/)
* [Monitoring](https://betterstack.com/docs/uptime/domain-expiration-checks/)
1. [Get started](https://betterstack.com/docs/uptime/monitoring-start/)
2. [Working with monitors](https://betterstack.com/docs/uptime/bulk-importing-monitors/)
3. [Customizing monitors](https://betterstack.com/docs/uptime/naming-monitors/)
1. [Naming monitors](https://betterstack.com/docs/uptime/naming-monitors/)
2. [Check frequency](https://betterstack.com/docs/uptime/check-frequency/)
3. [Request timeout](https://betterstack.com/docs/uptime/request-timeout/)
4. [Confirmation and recovery period](https://betterstack.com/docs/uptime/confirmation-and-recovery-period/)
5. [Domain expiration checks](https://betterstack.com/docs/uptime/domain-expiration-checks/)
6. [SSL certificate checks](https://betterstack.com/docs/uptime/ssl-certificate-checks/)
7. [Cache busting](https://betterstack.com/docs/uptime/cache-busting-in-monitoring/)
8. [Locations and regions](https://betterstack.com/docs/uptime/locations-and-regions/)
9. [Request parameters, headers and HTTP authentication](https://betterstack.com/docs/uptime/request-parameters-headers-and-http-authentication/)
10. [Github badge](https://betterstack.com/docs/uptime/github-badge/)
4. [Monitor types](https://betterstack.com/docs/uptime/uptime-monitor/)
* [Status pages](https://betterstack.com/docs/uptime/domain-expiration-checks/)
1. [Get started](https://betterstack.com/docs/uptime/getting-started-with-status-pages/)
2. [Advanced guide](https://betterstack.com/docs/uptime/custom-subdomain/)
* [Uptime API](https://betterstack.com/docs/uptime/domain-expiration-checks/)
1. [Getting an API token](https://betterstack.com/docs/uptime/api/getting-started-with-uptime-api/)
2. [Monitors](https://betterstack.com/docs/uptime/api/list-all-existing-monitors/)
3. [Heartbeats](https://betterstack.com/docs/uptime/api/list-all-existing-hearbeats/)
4. [On-call & incidents](https://betterstack.com/docs/uptime/api/on-call-calendar/)
5. [Status pages](https://betterstack.com/docs/uptime/api/list-all-existing-status-pages/)
6. [Metadata](https://betterstack.com/docs/uptime/api/metadata/)
7. [Integrations](https://betterstack.com/docs/uptime/api/list-all-new-relic-integrations/)
8. [Team members](https://betterstack.com/docs/uptime/api/team-members/list/)
Domain expiration checks
========================
The domain expiration checks allow you to monitor the URL's domain for domain expiry.
To change the monitor's domain expiration checks, go to [Monitors](https://uptime.betterstack.com/team/0/monitors)
→ **Select a monitor** → **Configure** → **Advanced settings** and select your preferred monitoring timeframe.
Bear in mind that changing the settings for the domain expiration will automatically update the domain expiration settings for all monitors for this domain in your team.
* * *
[Previous article\
\
Confirmation and recovery period](https://betterstack.com/docs/uptime/confirmation-and-recovery-period/)
[Next article\
\
SSL certificate checks](https://betterstack.com/docs/uptime/ssl-certificate-checks/)
### Please accept cookies
We use cookies to authenticate users, improve the product user experience, and for [personalized ads](https://business.safety.google/privacy/)
. [Learn more.](https://betterstack.com/privacy)
Deny Accept required Accept all
---
# Request timeout | Better Stack Documentation
###### Explore documentation
* [Welcome to Uptime 👋](https://betterstack.com/docs/uptime/start/)
* [Frequently Asked Questions](https://betterstack.com/docs/uptime/frequently-asked-questions/)
* [On-call scheduling and alerting](https://betterstack.com/docs/uptime/request-timeout/)
1. [Get started](https://betterstack.com/docs/uptime/getting-started-with-oncall-v2/)
2. [Slack and other integrations ↗](https://betterstack.com/docs/uptime/slack/)
3. [Connecting external calendars](https://betterstack.com/docs/uptime/connecting-external-calendars/)
4. [Advanced guide](https://betterstack.com/docs/uptime/escalation-policies/)
* [Incidents](https://betterstack.com/docs/uptime/request-timeout/)
1. [Get started](https://betterstack.com/docs/uptime/working-with-incidents/)
2. [Advanced guide](https://betterstack.com/docs/uptime/post-mortems/)
3. [Reporting ↗](https://betterstack.com/docs/getting-started/team-and-account-management/reporting/)
* [Monitoring](https://betterstack.com/docs/uptime/request-timeout/)
1. [Get started](https://betterstack.com/docs/uptime/monitoring-start/)
2. [Working with monitors](https://betterstack.com/docs/uptime/bulk-importing-monitors/)
3. [Customizing monitors](https://betterstack.com/docs/uptime/naming-monitors/)
1. [Naming monitors](https://betterstack.com/docs/uptime/naming-monitors/)
2. [Check frequency](https://betterstack.com/docs/uptime/check-frequency/)
3. [Request timeout](https://betterstack.com/docs/uptime/request-timeout/)
4. [Confirmation and recovery period](https://betterstack.com/docs/uptime/confirmation-and-recovery-period/)
5. [Domain expiration checks](https://betterstack.com/docs/uptime/domain-expiration-checks/)
6. [SSL certificate checks](https://betterstack.com/docs/uptime/ssl-certificate-checks/)
7. [Cache busting](https://betterstack.com/docs/uptime/cache-busting-in-monitoring/)
8. [Locations and regions](https://betterstack.com/docs/uptime/locations-and-regions/)
9. [Request parameters, headers and HTTP authentication](https://betterstack.com/docs/uptime/request-parameters-headers-and-http-authentication/)
10. [Github badge](https://betterstack.com/docs/uptime/github-badge/)
4. [Monitor types](https://betterstack.com/docs/uptime/uptime-monitor/)
* [Status pages](https://betterstack.com/docs/uptime/request-timeout/)
1. [Get started](https://betterstack.com/docs/uptime/getting-started-with-status-pages/)
2. [Advanced guide](https://betterstack.com/docs/uptime/custom-subdomain/)
* [Uptime API](https://betterstack.com/docs/uptime/request-timeout/)
1. [Getting an API token](https://betterstack.com/docs/uptime/api/getting-started-with-uptime-api/)
2. [Monitors](https://betterstack.com/docs/uptime/api/list-all-existing-monitors/)
3. [Heartbeats](https://betterstack.com/docs/uptime/api/list-all-existing-hearbeats/)
4. [On-call & incidents](https://betterstack.com/docs/uptime/api/on-call-calendar/)
5. [Status pages](https://betterstack.com/docs/uptime/api/list-all-existing-status-pages/)
6. [Metadata](https://betterstack.com/docs/uptime/api/metadata/)
7. [Integrations](https://betterstack.com/docs/uptime/api/list-all-new-relic-integrations/)
8. [Team members](https://betterstack.com/docs/uptime/api/team-members/list/)
Request timeout
===============
The **Request timeout** period defines how long the monitor will wait for the website to respond to the request sent before ‘deciding’ that there’s an issue and that an incident needs to be created.
Please note that the **Check frequency** must never be set to a shorter amount of time than the **Request timeout** period, as this would cause an error.
* * *
[Previous article\
\
Check frequency](https://betterstack.com/docs/uptime/check-frequency/)
[Next article\
\
Confirmation and recovery period](https://betterstack.com/docs/uptime/confirmation-and-recovery-period/)
### Please accept cookies
We use cookies to authenticate users, improve the product user experience, and for [personalized ads](https://business.safety.google/privacy/)
. [Learn more.](https://betterstack.com/privacy)
Deny Accept required Accept all
---
# Remove an exploration group | Better Stack Documentation
###### Explore documentation
* [Welcome to Telemetry 👋](https://betterstack.com/docs/logs/start/)
* [Quick start guide](https://betterstack.com/docs/logs/logging-start/)
* [Wide events vs. metrics](https://betterstack.com/docs/logs/wide-events-time-series/)
* [Ingesting data](https://betterstack.com/docs/logs/api/exploration-groups/delete/)
1. [Better Stack collector](https://betterstack.com/docs/logs/collector/)
2. [Vector](https://betterstack.com/docs/logs/vector/)
3. [OpenTelemetry](https://betterstack.com/docs/logs/open-telemetry/)
4. [Ingesting via HTTP API](https://betterstack.com/docs/logs/ingesting-data/http/logs/)
5. [Ingesting metrics](https://betterstack.com/docs/logs/ingesting-data/metrics/prometheus-scrape/)
6. [Ingesting logs](https://betterstack.com/docs/logs/ingesting-data/logs/docker-kubernetes/)
7. [Migrating to Better Stack](https://betterstack.com/docs/logs/datadog-agent/)
* [Using the product](https://betterstack.com/docs/logs/api/exploration-groups/delete/)
1. [AI SRE ↗](https://betterstack.com/demos/ai-sre/)
2. [MCP server ↗](https://betterstack.com/docs/getting-started/integrations/mcp/)
3. [Transforming ingested data](https://betterstack.com/docs/logs/using-logtail/transforming-ingested-data/logs-vrl/)
4. [Querying data](https://betterstack.com/docs/logs/using-logtail/live-tail-query-language/)
5. [Tracing](https://betterstack.com/docs/logs/tracing/)
6. [Alerts](https://betterstack.com/docs/logs/dashboards/alerts/)
* [Telemetry API](https://betterstack.com/docs/logs/api/exploration-groups/delete/)
1. [Getting an API token](https://betterstack.com/docs/logs/api/getting-started/)
2. [Sources & collectors](https://betterstack.com/docs/logs/api/list-all-existing-sources/)
3. [Dashboards](https://betterstack.com/docs/logs/api/dashboards/list/)
4. [Explorations](https://betterstack.com/docs/logs/api/explorations/list/)
1. [Explorations API](https://betterstack.com/docs/logs/api/explorations/list/)
2. [Exploration alerts API](https://betterstack.com/docs/logs/api/exploration-alerts/list/)
3. [Exploration groups API](https://betterstack.com/docs/logs/api/exploration-groups/list/)
1. [List all exploration groups GET](https://betterstack.com/docs/logs/api/exploration-groups/list/)
2. [Get a single exploration group GET](https://betterstack.com/docs/logs/api/exploration-groups/get/)
3. [Create an exploration group POST](https://betterstack.com/docs/logs/api/exploration-groups/create/)
4. [Update an exploration group PATCH](https://betterstack.com/docs/logs/api/exploration-groups/update/)
5. [Remove an exploration group DELETE](https://betterstack.com/docs/logs/api/exploration-groups/delete/)
6. [List explorations in a group GET](https://betterstack.com/docs/logs/api/exploration-groups/list-explorations/)
5. [Alerts API](https://betterstack.com/docs/logs/api/alerts/list/)
6. [Connections API](https://betterstack.com/docs/logs/api/connections/list/)
7. [Query API ↗](https://betterstack.com/docs/logs/query-api/connect-remotely/)
* [Alternative to](https://betterstack.com/docs/logs/api/exploration-groups/delete/)
1. [Lightstep](https://betterstack.com/docs/logs/alternative-to/lightstep/)
Remove an exploration group
===========================
Permanently deletes an exploration group by its ID.
Deleting a group does not delete the explorations within it. Those explorations will become ungrouped.
DELETE https://telemetry.betterstack.com/api/v2/exploration-groups/{id}
URL parameters
id
required integer
The unique identifier of the exploration group to delete.
Headers
Authorization
required string
Bearer `$TOKEN`
204
The exploration group was successfully deleted. No content is returned.
404
An exploration group with the specified ID was not found.
Example request
---------------
cURL
Copied!
curl --request DELETE \
--url "https://telemetry.betterstack.com/api/v2/exploration-groups/456" \
--header "Authorization: Bearer $TOKEN"
* * *
[Previous article\
\
Update an exploration group](https://betterstack.com/docs/logs/api/exploration-groups/update/)
[Next article\
\
List explorations in a group](https://betterstack.com/docs/logs/api/exploration-groups/list-explorations/)
###### On this page
* [Example request](https://betterstack.com/docs/logs/api/exploration-groups/delete/#example-request)
### Please accept cookies
We use cookies to authenticate users, improve the product user experience, and for [personalized ads](https://business.safety.google/privacy/)
. [Learn more.](https://betterstack.com/privacy)
Deny Accept required Accept all
---
# Embeddable status badge | Better Stack Documentation
###### Explore documentation
* [Welcome to Uptime 👋](https://betterstack.com/docs/uptime/start/)
* [Frequently Asked Questions](https://betterstack.com/docs/uptime/frequently-asked-questions/)
* [On-call scheduling and alerting](https://betterstack.com/docs/uptime/working-with-status-pages/embeddable-status-badge/)
1. [Get started](https://betterstack.com/docs/uptime/getting-started-with-oncall-v2/)
2. [Slack and other integrations ↗](https://betterstack.com/docs/uptime/slack/)
3. [Connecting external calendars](https://betterstack.com/docs/uptime/connecting-external-calendars/)
4. [Advanced guide](https://betterstack.com/docs/uptime/escalation-policies/)
* [Incidents](https://betterstack.com/docs/uptime/working-with-status-pages/embeddable-status-badge/)
1. [Get started](https://betterstack.com/docs/uptime/working-with-incidents/)
2. [Advanced guide](https://betterstack.com/docs/uptime/post-mortems/)
3. [Reporting ↗](https://betterstack.com/docs/getting-started/team-and-account-management/reporting/)
* [Monitoring](https://betterstack.com/docs/uptime/working-with-status-pages/embeddable-status-badge/)
1. [Get started](https://betterstack.com/docs/uptime/monitoring-start/)
2. [Working with monitors](https://betterstack.com/docs/uptime/bulk-importing-monitors/)
3. [Customizing monitors](https://betterstack.com/docs/uptime/naming-monitors/)
4. [Monitor types](https://betterstack.com/docs/uptime/uptime-monitor/)
* [Status pages](https://betterstack.com/docs/uptime/working-with-status-pages/embeddable-status-badge/)
1. [Get started](https://betterstack.com/docs/uptime/getting-started-with-status-pages/)
2. [Advanced guide](https://betterstack.com/docs/uptime/custom-subdomain/)
1. [Custom subdomain: status.yourdomain.com](https://betterstack.com/docs/uptime/custom-subdomain/)
2. [Customize status page with CSS and JavaScript](https://betterstack.com/docs/uptime/working-with-status-pages/customize-status-page-css-js/)
3. [Password, IP allowlist, and SSO protection](https://betterstack.com/docs/uptime/password-protected-status-page/)
4. [Status page updates](https://betterstack.com/docs/uptime/creating-status-report-and-status-update/)
5. [Manually tracked item](https://betterstack.com/docs/uptime/working-with-status-pages/manually-tracked-item/)
6. [Status announcement](https://betterstack.com/docs/uptime/embedding-announcements-into-your-site/)
7. [Embeddable status badge](https://betterstack.com/docs/uptime/working-with-status-pages/embeddable-status-badge/)
8. [Widget types](https://betterstack.com/docs/uptime/working-with-status-pages/widget-types/)
9. [Subscribing to status pages](https://betterstack.com/docs/uptime/subscribing-to-status-updates/)
* [Uptime API](https://betterstack.com/docs/uptime/working-with-status-pages/embeddable-status-badge/)
1. [Getting an API token](https://betterstack.com/docs/uptime/api/getting-started-with-uptime-api/)
2. [Monitors](https://betterstack.com/docs/uptime/api/list-all-existing-monitors/)
3. [Heartbeats](https://betterstack.com/docs/uptime/api/list-all-existing-hearbeats/)
4. [On-call & incidents](https://betterstack.com/docs/uptime/api/on-call-calendar/)
5. [Status pages](https://betterstack.com/docs/uptime/api/list-all-existing-status-pages/)
6. [Metadata](https://betterstack.com/docs/uptime/api/metadata/)
7. [Integrations](https://betterstack.com/docs/uptime/api/list-all-new-relic-integrations/)
8. [Team members](https://betterstack.com/docs/uptime/api/team-members/list/)
Embeddable status badge
=======================

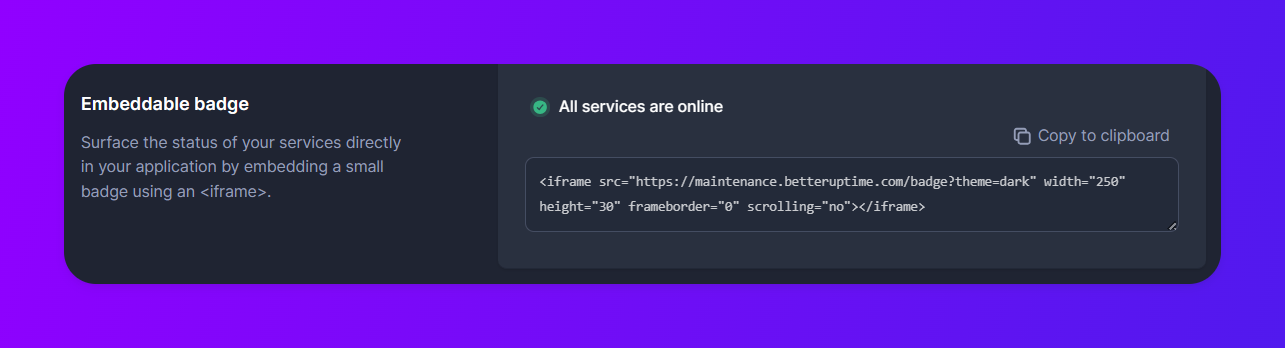
Take advantage of the Status pages by integrating a real-time status badge. This badge, implemented as an `
#### Using Tailwind?
Set `color-scheme: none` CSS property to ensure proper styling of the dark-theme badge.
* * *
[Previous article\
\
Status announcement](https://betterstack.com/docs/uptime/embedding-announcements-into-your-site/)
[Next article\
\
Widget types](https://betterstack.com/docs/uptime/working-with-status-pages/widget-types/)
### Please accept cookies
We use cookies to authenticate users, improve the product user experience, and for [personalized ads](https://business.safety.google/privacy/)
. [Learn more.](https://betterstack.com/privacy)
Deny Accept required Accept all
---
# Get started with status pages | Better Stack Documentation
###### Explore documentation
* [Welcome to Uptime 👋](https://betterstack.com/docs/uptime/start/)
* [Frequently Asked Questions](https://betterstack.com/docs/uptime/frequently-asked-questions/)
* [On-call scheduling and alerting](https://betterstack.com/docs/uptime/getting-started-with-status-pages/)
1. [Get started](https://betterstack.com/docs/uptime/getting-started-with-oncall-v2/)
2. [Slack and other integrations ↗](https://betterstack.com/docs/uptime/slack/)
3. [Connecting external calendars](https://betterstack.com/docs/uptime/connecting-external-calendars/)
4. [Advanced guide](https://betterstack.com/docs/uptime/escalation-policies/)
* [Incidents](https://betterstack.com/docs/uptime/getting-started-with-status-pages/)
1. [Get started](https://betterstack.com/docs/uptime/working-with-incidents/)
2. [Advanced guide](https://betterstack.com/docs/uptime/post-mortems/)
3. [Reporting ↗](https://betterstack.com/docs/getting-started/team-and-account-management/reporting/)
* [Monitoring](https://betterstack.com/docs/uptime/getting-started-with-status-pages/)
1. [Get started](https://betterstack.com/docs/uptime/monitoring-start/)
2. [Working with monitors](https://betterstack.com/docs/uptime/bulk-importing-monitors/)
3. [Customizing monitors](https://betterstack.com/docs/uptime/naming-monitors/)
4. [Monitor types](https://betterstack.com/docs/uptime/uptime-monitor/)
* [Status pages](https://betterstack.com/docs/uptime/getting-started-with-status-pages/)
1. [Get started](https://betterstack.com/docs/uptime/getting-started-with-status-pages/)
2. [Advanced guide](https://betterstack.com/docs/uptime/custom-subdomain/)
* [Uptime API](https://betterstack.com/docs/uptime/getting-started-with-status-pages/)
1. [Getting an API token](https://betterstack.com/docs/uptime/api/getting-started-with-uptime-api/)
2. [Monitors](https://betterstack.com/docs/uptime/api/list-all-existing-monitors/)
3. [Heartbeats](https://betterstack.com/docs/uptime/api/list-all-existing-hearbeats/)
4. [On-call & incidents](https://betterstack.com/docs/uptime/api/on-call-calendar/)
5. [Status pages](https://betterstack.com/docs/uptime/api/list-all-existing-status-pages/)
6. [Metadata](https://betterstack.com/docs/uptime/api/metadata/)
7. [Integrations](https://betterstack.com/docs/uptime/api/list-all-new-relic-integrations/)
8. [Team members](https://betterstack.com/docs/uptime/api/team-members/list/)
Get started with status pages
=============================
A [status page](https://betterstack.com/community/guides/incident-management/what-is-status-page/)
is a dedicated page that lets you inform your users about current outages and scheduled maintenance on your service(s).
The main purpose of a status page is to allow users to check if a given service is operational without the need to contact customer support directly.
For company employees, an internal status page provides the same benefit - here it's the developer teams who save time that would otherwise be spent on questions from department.
### Public vs. private status pages
In some cases, you don't want to show the system status to the public, and would rather have a private status page instead. To create a private status page, use the [password protection](https://betterstack.com/docs/uptime/password-protected-status-page/)
to only allow chosen people to access it.
This way, you can easily create a dedicated private status page for your internal stakeholders, specific clients, or customers.
Creating your first status page
-------------------------------
Before starting with the status page, it's best to [set up the monitors](https://betterstack.com/docs/uptime/monitoring-start/)
for the services whose status you want to communicate. Once you have the monitors ready, let's create your first status page.
* Go to **Status page** → **Create a Status page**.
### Step 1: Choosing a subdomain
* Enter your company name (it will be visible in the top left section of the status page)
* Choose a `*.betteruptime.com` subdomain or [configure a custom subdomain](https://betterstack.com/docs/uptime/custom-subdomain/)
Most internet companies have their status page on a status subdomain with the following format: status.domainname.com. See [status.stripe.com](https://status.stripe.com/)
or [status.slack.com](https://status.slack.com/)
for reference.
However, some opt in for dedicated URLs, like GitHub with [githubstatus.com](https://www.githubstatus.com/)
. These are usually larger companies with fully customized status page solutions.
### Step 2: Personalization
* Personalize your page with your website URL, logo, and more
### Step 3: Selecting services and creating structure
* Click the **Structure** tab at the top of the page.
* Drag and drop monitors from the **Available** to the **Selected** columns using the `⋮⋮` icon.
* Feel free to edit the public name or add a monitor description.
### Step 4: Creating a status page
* Now that we have finished the basic setup, we can click **Save changes**
* The status page is now live and available at your chosen URL
Next steps to enhance your status page 🚤
-----------------------------------------
* [Embed status page announcements into your site](https://betterstack.com/docs/uptime/embedding-announcements-into-your-site/)
to communicate incidents directly in your product.
* Build upon our [incident communication templates](https://betterstack.com/community/guides/incident-management/incident-templates/)
, and be prepared when incidents occur.
* * *
[Previous article\
\
Monitoring private networks](https://betterstack.com/docs/uptime/monitoring-private-networks/)
[Next article\
\
Custom subdomain: status.yourdomain.com](https://betterstack.com/docs/uptime/custom-subdomain/)
###### On this page
* [Creating your first status page](https://betterstack.com/docs/uptime/getting-started-with-status-pages/#creating-your-first-status-page)
* [Next steps to enhance your status page 🚤](https://betterstack.com/docs/uptime/getting-started-with-status-pages/#next-steps-to-enhance-your-status-page)
### Please accept cookies
We use cookies to authenticate users, improve the product user experience, and for [personalized ads](https://business.safety.google/privacy/)
. [Learn more.](https://betterstack.com/privacy)
Deny Accept required Accept all
---
# Ingesting metrics | Better Stack Documentation
###### Explore documentation
* [Welcome to Telemetry 👋](https://betterstack.com/docs/logs/start/)
* [Quick start guide](https://betterstack.com/docs/logs/logging-start/)
* [Wide events vs. metrics](https://betterstack.com/docs/logs/wide-events-time-series/)
* [Ingesting data](https://betterstack.com/docs/logs/ingesting-data/http/metrics/)
1. [Better Stack collector](https://betterstack.com/docs/logs/collector/)
2. [Vector](https://betterstack.com/docs/logs/vector/)
3. [OpenTelemetry](https://betterstack.com/docs/logs/open-telemetry/)
4. [Ingesting via HTTP API](https://betterstack.com/docs/logs/ingesting-data/http/logs/)
1. [Ingesting logs](https://betterstack.com/docs/logs/ingesting-data/http/logs/)
2. [Ingesting metrics](https://betterstack.com/docs/logs/ingesting-data/http/metrics/)
3. [Ingesting traces](https://betterstack.com/docs/logs/ingesting-data/http/traces/)
5. [Ingesting metrics](https://betterstack.com/docs/logs/ingesting-data/metrics/prometheus-scrape/)
6. [Ingesting logs](https://betterstack.com/docs/logs/ingesting-data/logs/docker-kubernetes/)
7. [Migrating to Better Stack](https://betterstack.com/docs/logs/datadog-agent/)
* [Using the product](https://betterstack.com/docs/logs/ingesting-data/http/metrics/)
1. [AI SRE ↗](https://betterstack.com/demos/ai-sre/)
2. [MCP server ↗](https://betterstack.com/docs/getting-started/integrations/mcp/)
3. [Transforming ingested data](https://betterstack.com/docs/logs/using-logtail/transforming-ingested-data/logs-vrl/)
4. [Querying data](https://betterstack.com/docs/logs/using-logtail/live-tail-query-language/)
5. [Tracing](https://betterstack.com/docs/logs/tracing/)
6. [Alerts](https://betterstack.com/docs/logs/dashboards/alerts/)
* [Telemetry API](https://betterstack.com/docs/logs/ingesting-data/http/metrics/)
1. [Getting an API token](https://betterstack.com/docs/logs/api/getting-started/)
2. [Sources & collectors](https://betterstack.com/docs/logs/api/list-all-existing-sources/)
3. [Dashboards](https://betterstack.com/docs/logs/api/dashboards/list/)
4. [Explorations](https://betterstack.com/docs/logs/api/explorations/list/)
5. [Alerts API](https://betterstack.com/docs/logs/api/alerts/list/)
6. [Connections API](https://betterstack.com/docs/logs/api/connections/list/)
7. [Query API ↗](https://betterstack.com/docs/logs/query-api/connect-remotely/)
* [Alternative to](https://betterstack.com/docs/logs/ingesting-data/http/metrics/)
1. [Lightstep](https://betterstack.com/docs/logs/alternative-to/lightstep/)
Ingesting metrics
=================
This endpoint allows you to send a single metric or a list of metrics. The events can be encoded in JSON or preferably in a more efficient MessagePack.
You can use these metrics to build [Dashboards](https://betterstack.com/docs/logs/dashboards/sql-queries/#prometheus-like-metrics)
using the built-in metrics `value`, `rate`, `series_id`, and `tags`. Please note that not all sources support sending metrics.
#### Want to send metrics to Better Stack?
Create a [new Prometheus source](https://telemetry.betterstack.com/team/0/sources/new?platform=prometheus&utm_content=callout&utm_medium=docs-logs&utm_source=community&utm_term=docs-sources-http-rest-api-metrics)
and start using this API.
POST /metrics
Headers
Content-Type
required string
Either application/json, application/msgpack, or application/x-ndjson
Authorization
required string
Bearer `$SOURCE_TOKEN`
Body parameters
Multiple events
required array
An array of metrics encoded in JSON or MessagePack, or newline-delimited JSONs of metrics
Single event
required object
A single metric encoded in JSON or MessagePack
202
The metric was, or the metrics were successfully logged.
403
You provided an invalid source token, or the source doesn't allow metrics ingestion.
Response body
Unauthorized
406
The body is not a valid JSON or MessagePack.
Response body
Couldn't parse JSON content.
413
The body is too large (over 20 MiB).
Response body
payload reached size limit
Examples
--------
### Single metric
Send a single metric using cURL:
JSON NDJSON MessagePack
Copied!
curl -X POST https://$INGESTING_HOST/metrics \
-H "Authorization: Bearer $SOURCE_TOKEN" \
-H "Content-Type: application/json" \
-d '{"name":"test_metric","gauge":{"value":123}}'
curl -X POST https://$INGESTING_HOST/metrics \
-H "Authorization: Bearer $SOURCE_TOKEN" \
-H "Content-Type: application/x-ndjson" \
-d '{"name":"test_metric","gauge":{"value":123}}'
# Python is required to prepare the binary data in this example
python3 -c 'import msgpack; \
print(msgpack.packb( \
{"name":"test_metric","gauge":{"value":123}} \
).hex())' \
| xxd -r -p \
| curl -X POST https://$INGESTING_HOST/metrics \
-H "Authorization: Bearer $SOURCE_TOKEN" \
-H "Content-Type: application/msgpack" \
--data-binary @-
### Multiple metrics
Send multiple metrics using cURL:
JSON NDJSON MessagePack
Copied!
curl -X POST https://$INGESTING_HOST/metrics \
-H "Authorization: Bearer $SOURCE_TOKEN" \
-H "Content-Type: application/json" \
-d '[{"name":"metric_a","gauge":{"value":3.14}},{"name":"metric_b","counter":{"value":42}}]'
curl -X POST https://$INGESTING_HOST/metrics \
-H "Authorization: Bearer $SOURCE_TOKEN" \
-H "Content-Type: application/x-ndjson" \
-d $'{"name":"metric_a","gauge":{"value":3.14}}\n{"name":"metric_b","counter":{"value":42}}'
# Python is required to prepare the binary data
python3 -c 'import msgpack; \
print(msgpack.packb( \
[{"name":"metric_a","gauge":{"value":3.14}},{"name":"metric_b","counter":{"value":42}}] \
).hex())' \
| xxd -r -p \
| curl -X POST https://$INGESTING_HOST/metrics \
-H "Authorization: Bearer $SOURCE_TOKEN" \
-H "Content-Type: application/msgpack" \
--data-binary @-
Sending timestamps
------------------
By default, the time of the metric will be the time of receiving it. You can override this by including a field `dt` containing the event time either as:
* [UNIX time](https://en.wikipedia.org/wiki/Unix_time)
in whole seconds, milliseconds, or nanoseconds.
`1672490759`, `1672490759123`, `1672490759123456000`
* String formatted according to [RFC 3339](https://datatracker.ietf.org/doc/html/rfc3339)
.
`2022-12-31T13:45:59.123456Z`, `2022-12-31 13:45:59.123456+02:00`
Alternatively, you can use ISO 8601, as it will most likely use a format compatible with RFC 3339. In MessagePack, you can also use the [timestamp extension type](https://github.com/msgpack/msgpack/blob/master/spec.md#timestamp-extension-type)
.
In case the timestamp can't be parsed, we save it as a string, but revert to using the reception time as the event time.
JSON
Copied!
curl -X POST https://$INGESTING_HOST/metrics \
-H "Authorization: Bearer $SOURCE_TOKEN" \
-H "Content-Type: application/json" \
-d '{"name":"test_metric","gauge":{"value":123},"dt":"2023-08-09 07:03:30+00:00"}'
Metric types
------------
### Gauges
A gauge represents a single numerical value that can go up or down. Common use cases include tracking temperature, current memory usage, or system load. Gauges reflect the current state or level at the time of reporting. For example, memory usage might fluctuate, and each time you send a gauge, you're reporting the latest value.
Gauge example
Copied!
{
"name": "node_cpu_temperature_celsius",
"gauge": {
"value": 63.5
}
}
### Counters
A counter is a metric type used for tracking monotonically increasing values, like the number of requests served or errors encountered. Unlike gauges, counters only increase or reset to zero, they never decrease. They're ideal for counting discrete events over time.
Counter example
Copied!
{
"name": "http_requests_total",
"counter": {
"value": 42
}
}
### Histograms
A histogram samples observations (such as request durations or response sizes) and counts them in configurable buckets. It also provides the sum of all observed values. Histograms are useful for measuring the distribution of values, allowing you to understand the frequency of observations within specific ranges.
The fields `dt`, `name`, `histogram.count`, `histogram.sum`, `histogram.buckets.*.count`, and `histogram.buckets.*.upper_limit` are required for histograms.
Histogram example
Copied!
{
"name": "http_request_duration_seconds",
"histogram": {
"count": 140,
"sum": 75.5,
"buckets": [\
{\
"upper_limit": 0.1,\
"count": 15\
},\
{\
"upper_limit": 0.2,\
"count": 30\
},\
{\
"upper_limit": 0.5,\
"count": 45\
},\
{\
"upper_limit": 1.0,\
"count": 50\
}\
]
}
}
#### How can you use Histograms in Better Stack?
When you send a histogram, we store its data in special metric-like columns, which allow for powerful analysis:
* The `buckets` column stores the cumulative counts for each bucket.
* The `buckets_sum` column contains the sum of all observed values.
* The `buckets_count` column contains the total number of observations.
You can then use SQL to build heatmaps, calculate custom quantiles (like p95), and visualize the distribution of your data.
Learn how to query this data in our [Querying histograms guide](https://betterstack.com/docs/logs/querying-histograms/?utm_content=callout&utm_medium=docs-logs&utm_source=community&utm_term=docs-sources-http-rest-api-metrics)
.
### Summaries
A summary also samples observations and provides a total count and sum of all observed values, similar to a histogram. Additionally, it calculates configurable quantiles (e.g., median, 90th percentile). Summaries are useful when you need to track the distribution of values and compute specific statistical measures over time.
The fields `dt`, `name`, `summary.count`, `summary.sum`, `summary.quantiles.*.value`, and `summary.quantiles.*.quantile` are required for summaries.
Summary example
Copied!
{
"name": "http_response_size_bytes",
"summary": {
"count": 100,
"sum": 25000,
"quantiles": [\
{\
"quantile": 0.5,\
"value": 200\
},\
{\
"quantile": 0.9,\
"value": 450\
},\
{\
"quantile": 0.99,\
"value": 600\
}\
]
}
}
#### How can you use Summaries in Better Stack?
Similar to histograms, summary data is stored in dedicated columns for powerful querying:
* The `quantiles` column stores an array of tuples representing the pre-calculated percentiles.
* The `quantiles_sum` column contains the sum of all observed values.
* The `quantiles_count` column contains the total number of observations.
You can query these columns to analyze statistical distributions over time. Querying summaries is similar to [Querying histograms](https://betterstack.com/docs/logs/querying-histograms/?utm_content=callout&utm_medium=docs-logs&utm_source=community&utm_term=docs-sources-http-rest-api-metrics)
.
Tagging metrics
---------------
You can use any string labels in the `tags` field of your metric to provide metadata for grouping and filtering of your data.
Tagged example
Copied!
{
"name": "node_cpu_temperature_celsius",
"gauge": {
"value": 63.5
},
"tags": {
"host": "server_1",
"region": "us-east",
"environment": "production"
}
}
#### Many unique tags may lead to higher costs
Tags have direct impact on [how do we bill for metrics](https://betterstack.com/docs/logs/billing-for-metrics/?utm_content=callout&utm_medium=docs-logs&utm_source=community&utm_term=docs-sources-http-rest-api-metrics)
. It's recommended to avoid unique or high-cardinality values that aren't necessary for your dashboards, such as process IDs or request IDs.
Many unique tag values can dramatically increase the number of metric series.
Request limits
--------------
The maximum allowed size of a single request is 10 MiB.
* * *
[Previous article\
\
Automatic JSON extraction from strings](https://betterstack.com/docs/logs/ingesting-data/http/logs/string-and-json-format/)
[Next article\
\
Ingesting traces](https://betterstack.com/docs/logs/ingesting-data/http/traces/)
###### On this page
* [Examples](https://betterstack.com/docs/logs/ingesting-data/http/metrics/#examples)
* [Sending timestamps](https://betterstack.com/docs/logs/ingesting-data/http/metrics/#sending-timestamps)
* [Metric types](https://betterstack.com/docs/logs/ingesting-data/http/metrics/#metric-types)
* [Tagging metrics](https://betterstack.com/docs/logs/ingesting-data/http/metrics/#tagging-metrics)
* [Request limits](https://betterstack.com/docs/logs/ingesting-data/http/metrics/#request-limits)
### Please accept cookies
We use cookies to authenticate users, improve the product user experience, and for [personalized ads](https://business.safety.google/privacy/)
. [Learn more.](https://betterstack.com/privacy)
Deny Accept required Accept all
---
# Update a warehouse source group | Better Stack Documentation
###### Explore documentation
* [Welcome to Warehouse 👋](https://betterstack.com/docs/warehouse/start/)
* [Ingesting data](https://betterstack.com/docs/warehouse/api/source-groups/update/)
1. [Ingesting events](https://betterstack.com/docs/warehouse/ingesting-data/intro/)
2. [S3 vs NVMe hosted data](https://betterstack.com/docs/warehouse/ingesting-data/s3-vs-nvme/)
3. [Host events in your S3 bucket](https://betterstack.com/docs/warehouse/ingesting-data/custom-s3-bucket/)
* [Querying data](https://betterstack.com/docs/warehouse/api/source-groups/update/)
1. [Querying events & time series](https://betterstack.com/docs/warehouse/querying-data/events-and-time-series/)
2. [Writing SQL queries](https://betterstack.com/docs/warehouse/querying-data/merge-and-state-aggregators/)
3. [Query speeds](https://betterstack.com/docs/warehouse/querying-data/query-speeds/)
4. [Ad-hoc SQL API](https://betterstack.com/docs/warehouse/querying-data/ad-hoc-sql-api/)
5. [Generate client-facing APIs](https://betterstack.com/docs/warehouse/querying-data/queries/)
6. [Visualizing data](https://betterstack.com/docs/warehouse/querying-data/visualizing-data/)
* [Vector embeddings](https://betterstack.com/docs/warehouse/api/source-groups/update/)
1. [Introduction to embeddings](https://betterstack.com/docs/warehouse/vector-embeddings/intro/)
2. [Using built-in embeddings](https://betterstack.com/docs/warehouse/vector-embeddings/built-in-embeddings/)
3. [Bringing your own embeddings](https://betterstack.com/docs/warehouse/vector-embeddings/bring-your-own/)
4. [Data structures and indices](https://betterstack.com/docs/warehouse/vector-embeddings/data-structures-and-indices/)
* [Use cases](https://betterstack.com/docs/warehouse/api/source-groups/update/)
1. [Retrieval Augmented Generation](https://betterstack.com/docs/warehouse/use-cases/building-rag/)
* [Management](https://betterstack.com/docs/warehouse/api/source-groups/update/)
1. [Controlling costs](https://betterstack.com/docs/warehouse/management/controlling-costs/)
* [Warehouse API](https://betterstack.com/docs/warehouse/api/source-groups/update/)
1. [Getting an API token](https://betterstack.com/docs/warehouse/api/getting-api-token/)
2. [Warehouse sources API](https://betterstack.com/docs/warehouse/api/sources/list/)
3. [Warehouse source groups API](https://betterstack.com/docs/warehouse/api/source-groups/list/)
1. [List all groups GET](https://betterstack.com/docs/warehouse/api/source-groups/list/)
2. [Get a single group GET](https://betterstack.com/docs/warehouse/api/source-groups/get/)
3. [Create a group POST](https://betterstack.com/docs/warehouse/api/source-groups/create/)
4. [Update a group PUT](https://betterstack.com/docs/warehouse/api/source-groups/update/)
5. [Remove a group DELETE](https://betterstack.com/docs/warehouse/api/source-groups/delete/)
6. [List sources in a group GET](https://betterstack.com/docs/warehouse/api/source-groups/list-sources/)
4. [Time series API](https://betterstack.com/docs/warehouse/api/time-series/list/)
5. [Embeddings API](https://betterstack.com/docs/warehouse/api/embeddings/list/)
Update a warehouse source group
===============================
Updates an existing Warehouse source group. Only provided parameters will be changed.
PATCH https://warehouse.betterstack.com/api/v1/source-groups/{id}
URL parameters
id
required string
The ID of the Warehouse source group to update.
Headers
Authorization
required string
Bearer `$TOKEN`
Content-Type
required string
application/json
Body parameters
name
string
The new name for the source group. Must contain only letters, numbers, and underscores.
200
The updated Warehouse source group.
Response body
{
"data": {
"id": "1234",
"type": "warehouse_source_group",
"attributes": {
"name": "analytics_updated",
"created_at": "2025-11-13T10:00:00Z",
"updated_at": "2025-11-25T20:44:50Z",
"sort_index": null,
"team_name": "example-team"
}
}
}
401
Unauthorized
Response body
{
"errors": "Invalid authentication"
}
404
Not Found
Response body
{
"errors": "Source group with the provided ID was not found"
}
422
Unprocessable Entity - Validation Errors
Response body
{
"errors": "Validation errors",
"invalid_values": {
"name": [\
"already taken",\
"name must only contain letters, numbers, and underscores"\
]
}
}
#### Example cURL
Example
Copied!
curl --request PATCH \
--url https://warehouse.betterstack.com/api/v1/source-groups/1234 \
--header "Authorization: Bearer $TOKEN" \
--header 'Content-Type: application/json' \
--data '{
"name": "analytics_updated"
}'
* * *
[Previous article\
\
Create a warehouse source group](https://betterstack.com/docs/warehouse/api/source-groups/create/)
[Next article\
\
Remove a warehouse source group](https://betterstack.com/docs/warehouse/api/source-groups/delete/)
### Please accept cookies
We use cookies to authenticate users, improve the product user experience, and for [personalized ads](https://business.safety.google/privacy/)
. [Learn more.](https://betterstack.com/privacy)
Deny Accept required Accept all
---
# Managing runbooks | Better Stack Documentation
###### Explore documentation
* [Welcome to Uptime 👋](https://betterstack.com/docs/uptime/start/)
* [Frequently Asked Questions](https://betterstack.com/docs/uptime/frequently-asked-questions/)
* [On-call scheduling and alerting](https://betterstack.com/docs/uptime/runbooks/)
1. [Get started](https://betterstack.com/docs/uptime/getting-started-with-oncall-v2/)
2. [Slack and other integrations ↗](https://betterstack.com/docs/uptime/slack/)
3. [Connecting external calendars](https://betterstack.com/docs/uptime/connecting-external-calendars/)
4. [Advanced guide](https://betterstack.com/docs/uptime/escalation-policies/)
1. [Escalation policies](https://betterstack.com/docs/uptime/escalation-policies/)
2. [Severities](https://betterstack.com/docs/uptime/severities/)
3. [Backup on-call schedule](https://betterstack.com/docs/uptime/creating-a-backup-oncall-schedule/)
4. [Runbooks](https://betterstack.com/docs/uptime/runbooks/)
5. [Zoom integration](https://betterstack.com/docs/uptime/integrations/zoom/)
* [Incidents](https://betterstack.com/docs/uptime/runbooks/)
1. [Get started](https://betterstack.com/docs/uptime/working-with-incidents/)
2. [Advanced guide](https://betterstack.com/docs/uptime/post-mortems/)
3. [Reporting ↗](https://betterstack.com/docs/getting-started/team-and-account-management/reporting/)
* [Monitoring](https://betterstack.com/docs/uptime/runbooks/)
1. [Get started](https://betterstack.com/docs/uptime/monitoring-start/)
2. [Working with monitors](https://betterstack.com/docs/uptime/bulk-importing-monitors/)
3. [Customizing monitors](https://betterstack.com/docs/uptime/naming-monitors/)
4. [Monitor types](https://betterstack.com/docs/uptime/uptime-monitor/)
* [Status pages](https://betterstack.com/docs/uptime/runbooks/)
1. [Get started](https://betterstack.com/docs/uptime/getting-started-with-status-pages/)
2. [Advanced guide](https://betterstack.com/docs/uptime/custom-subdomain/)
* [Uptime API](https://betterstack.com/docs/uptime/runbooks/)
1. [Getting an API token](https://betterstack.com/docs/uptime/api/getting-started-with-uptime-api/)
2. [Monitors](https://betterstack.com/docs/uptime/api/list-all-existing-monitors/)
3. [Heartbeats](https://betterstack.com/docs/uptime/api/list-all-existing-hearbeats/)
4. [On-call & incidents](https://betterstack.com/docs/uptime/api/on-call-calendar/)
5. [Status pages](https://betterstack.com/docs/uptime/api/list-all-existing-status-pages/)
6. [Metadata](https://betterstack.com/docs/uptime/api/metadata/)
7. [Integrations](https://betterstack.com/docs/uptime/api/list-all-new-relic-integrations/)
8. [Team members](https://betterstack.com/docs/uptime/api/team-members/list/)
Managing runbooks
=================
Create structured incident response procedures using Better Stack's **Escalation policies**. Runbooks help your team follow consistent steps during incidents, reducing response time and ensuring nothing is missed.
#### Need dedicated runbook management?
While some monitoring tools offer separate runbook features, Better Stack integrates runbooks directly into **Escalation policies**, keeping your incident response workflow simple and unified.
What are runbooks?
------------------
A runbook is a structured set of predefined steps for handling specific incidents or scenarios. They typically include:
* **Tasks to perform:** step-by-step procedures.
* **People to notify:** this is automated by using [Escalation rules](https://betterstack.com/docs/uptime/escalation-policies/#alerting)
.
* **Links to resources:** your dashboards, playbooks, and internal documentation.
Creating runbooks
-----------------
### Step 1: Create a runbook policy
Create a dedicated **Escalation policy** for your new runbook:
1. Go to [Escalation policies](https://uptime.betterstack.com/team/0/policies)
→ **Create escalation policy**.
2. **Name your runbook**, for example `Runbook: High CPU Usage`.
3. **Remove the default escalation steps** to avoid notifying people in the runbook directly.
4. **Position the runbook step** as the last step of your escalation flow.
5. **Add your runbook instructions**
* Use the **Instructions & todo list** step.
* Format your the step-by-step guide using markdown.
* Start a line with `- [ ]` to add an interactive task.
6. **Save the escalation policy**
Example runbook instructions with TODO list
Copied!
## When to Use
Triggered when CPU > 90% for 5+ minutes on a web server.
## Steps
- [ ] **Acknowledge the Alert**
- [ ] **Find the Affected Server**
- Use logs or metrics dashboard to identify the instance/container
- Example: `aws ecs list-tasks --cluster web-prod`
- [ ] **SSH or Access Container**
- `ssh ec2-user@`
- [ ] **Diagnose the Issue**
- Run `top` or `htop` to find CPU-heavy process
- Check application logs
- [ ] **Fix or Mitigate**
- Restart service if needed
- Scale up if traffic is legitimate
- [ ] **Verify**
- CPU drops below 70%
- No 5xx errors
- App is responsive

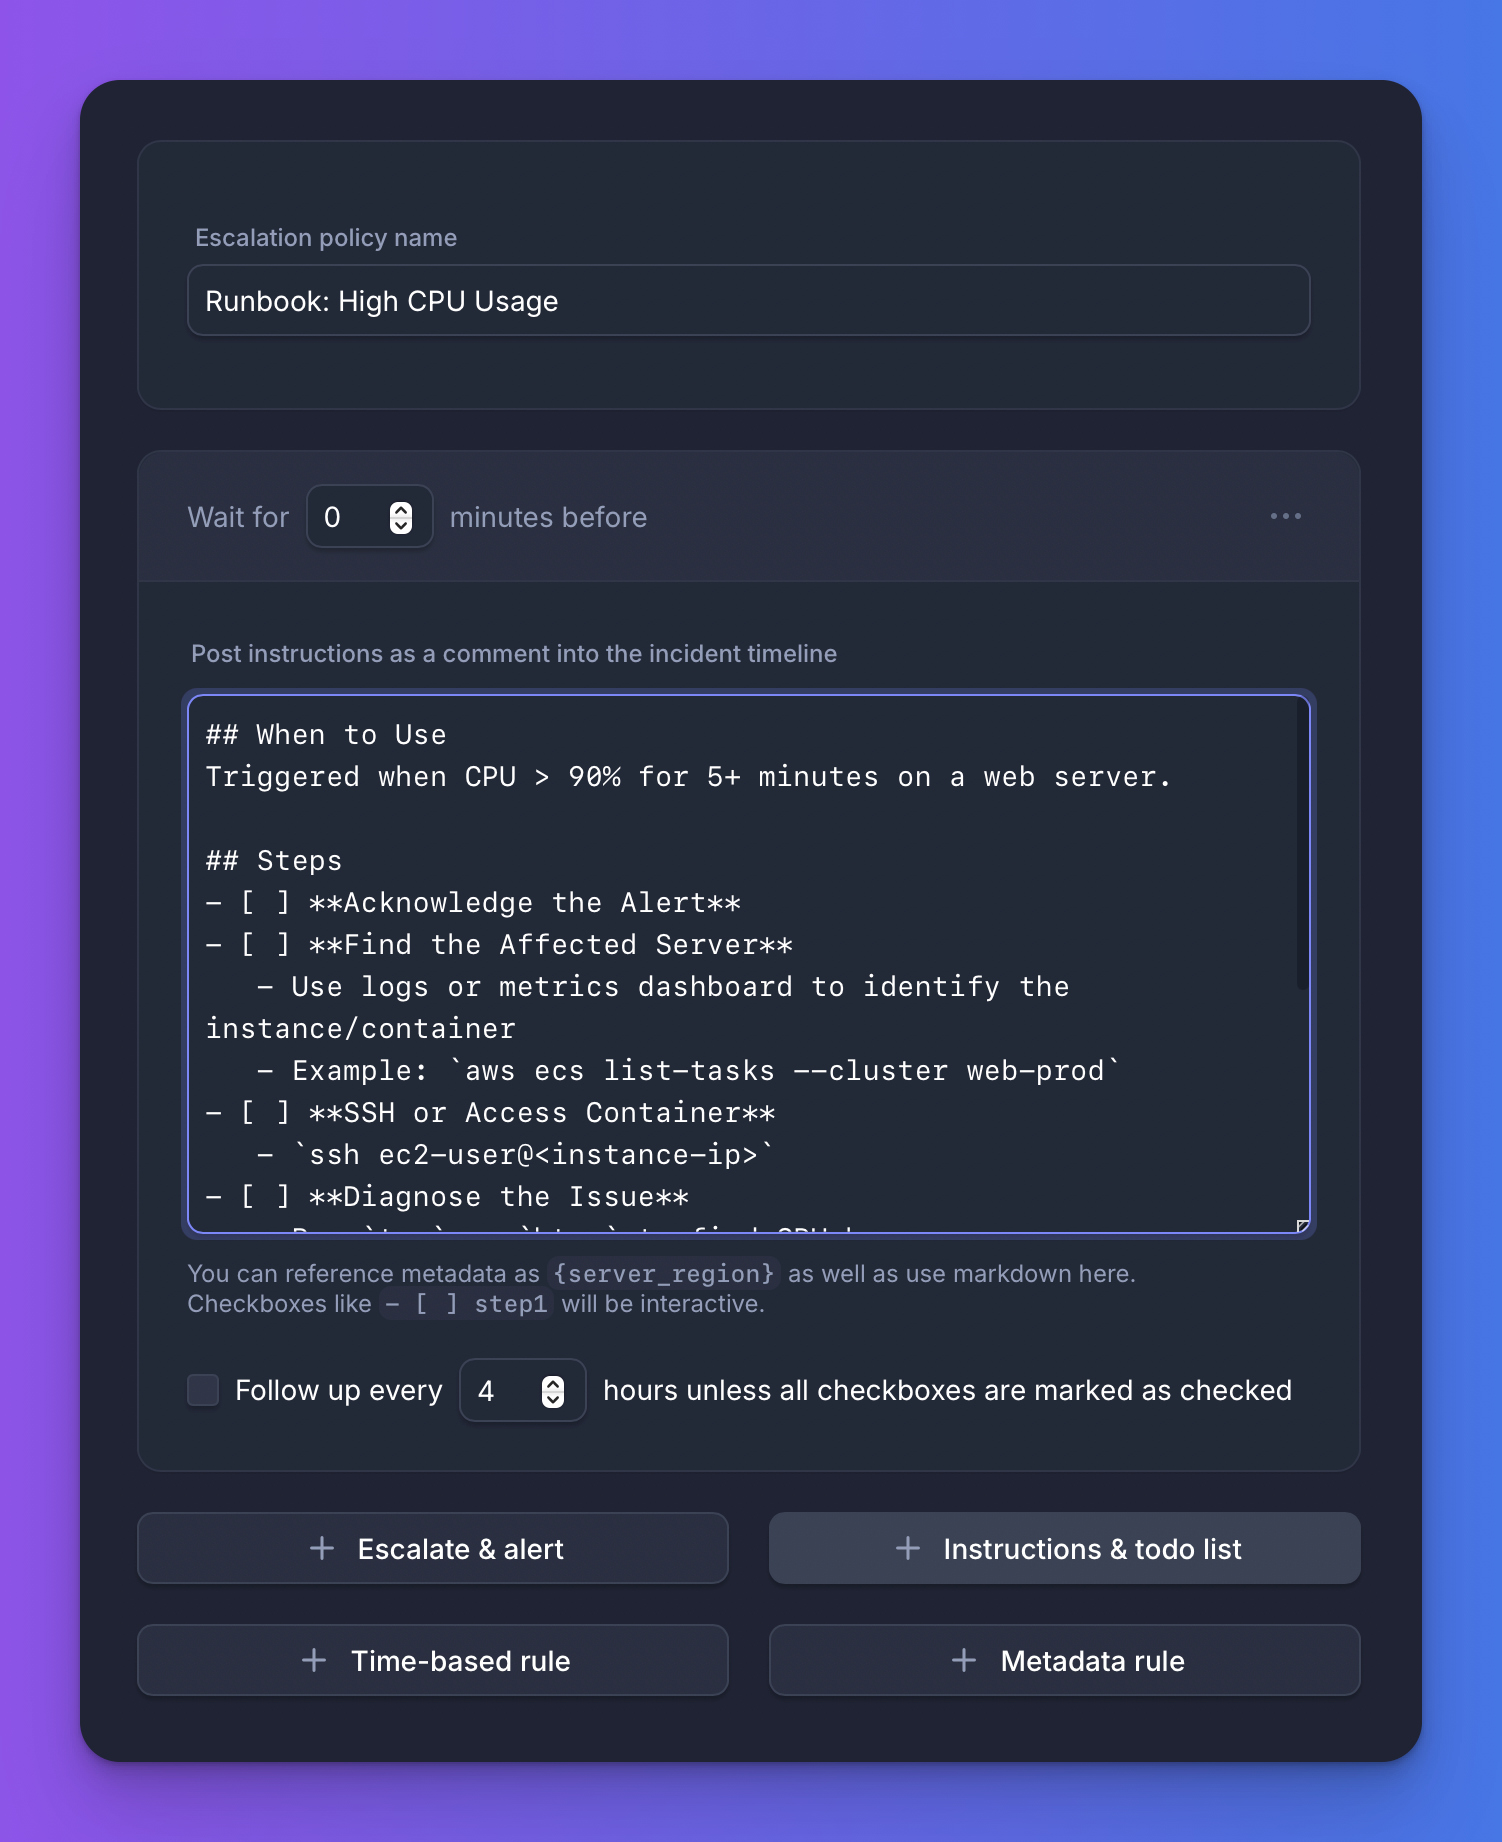
### Step 2: Reference runbooks in active policies
In your actual escalation policies - the ones that notify your team:
1. Go to [Escalation policies](https://uptime.betterstack.com/team/0/policies)
and edit one of your existing policies.
2. **Add a time-based rule** for the runbook.
3. **Set schedule** to all days from 00:00 to 00:00, ensuring it will be always used.
4. **Select your runbook policy** from the dropdown.
5. **Position the runbook step** as the last step of your escalation flow.
#### Need to use different runbooks based on incident context?
Use [Metadata-based rule](https://betterstack.com/docs/uptime/escalation-policies/?utm_content=callout&utm_medium=docs-uptime&utm_source=community&utm_term=docs-uptime-runbooks#metadata-based-rules)
instead of the time-based rule, and redirect to your runbooks based on the incident metadata values.

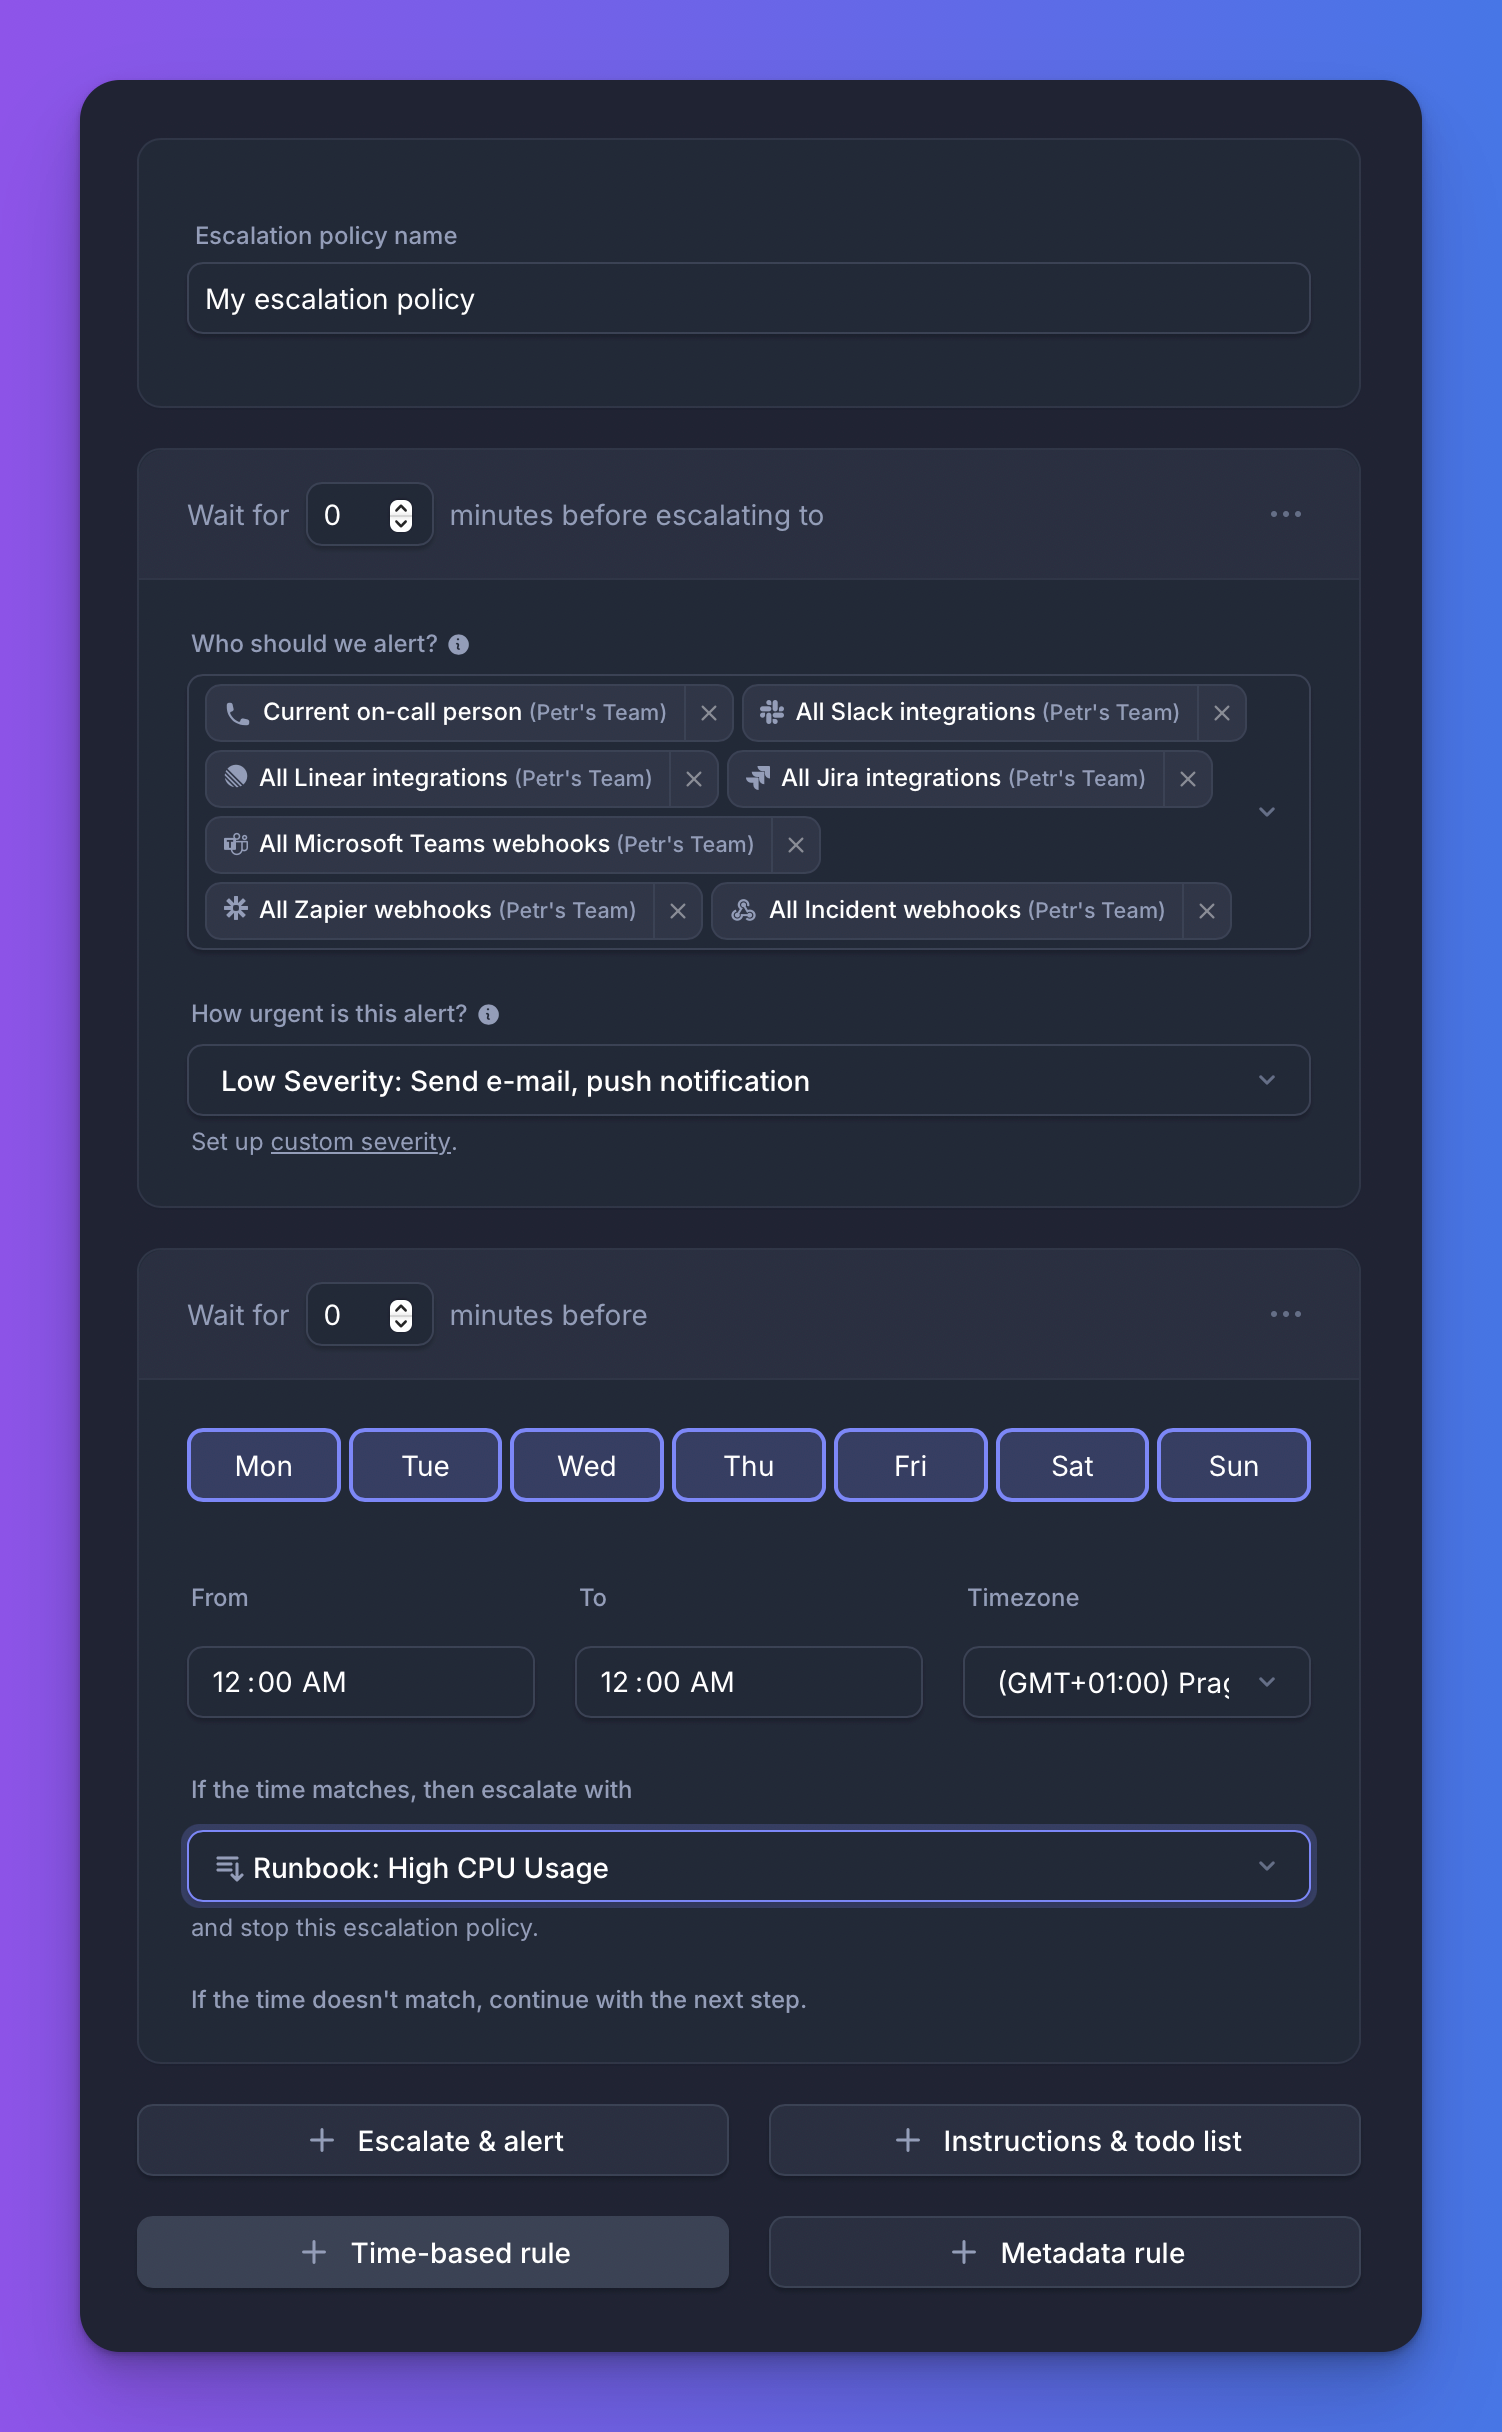
### Step 3: Test the escalation
Click the **Report a new incident** in your escalation policy to create a new incident.
You should see your instructions in the incident timeline:

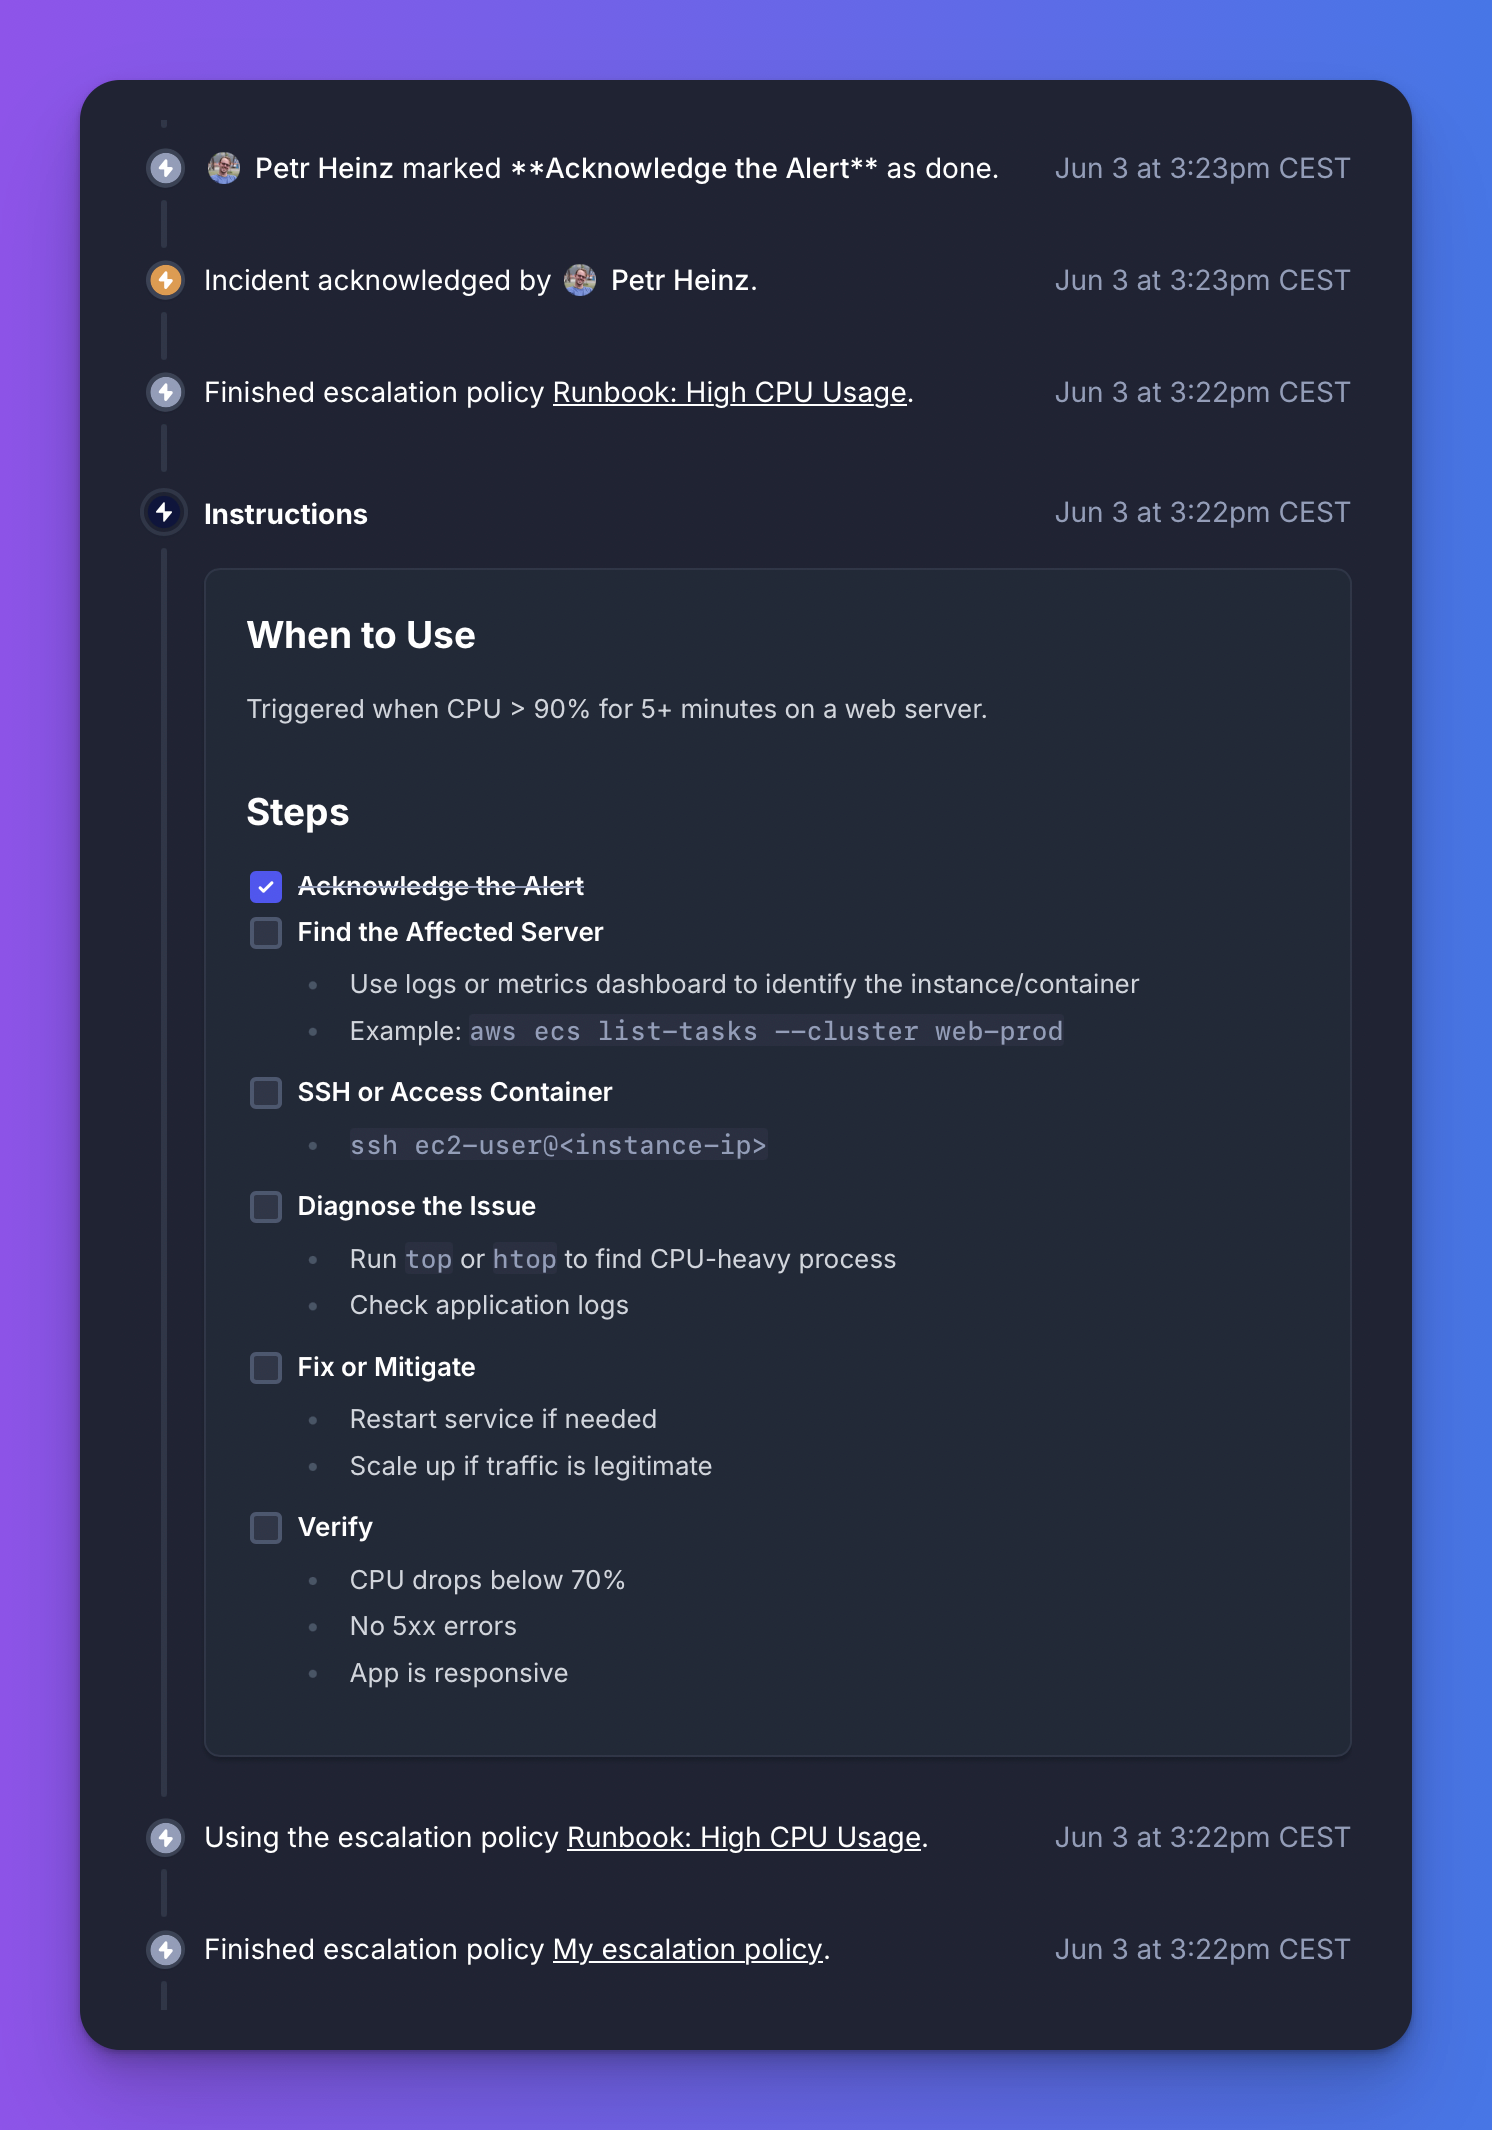
Best practices
--------------
### Naming convention
Use a consistent prefix for easy identification:
* `Runbook: Database Outage`
* `Runbook: API Rate Limiting`
* `Runbook: SSL Certificate Expiry`
### Keep instructions actionable
* **Use checkboxes** for step-by-step procedures.
* Include **specific commands and code snippets**.
* **Add links** to relevant dashboards and documentation.
* Specify **expected outcomes** for verification steps.
Reusing runbooks
----------------
The same runbook can be referenced across multiple escalation policies. For example, your **High CPU Usage** runbook might be used in policies for:
* Web server monitoring
* Background job processing
* Database server alerts
This approach keeps runbooks centralized while allowing flexible incident response workflows 🚀
* * *
[Previous article\
\
Create a backup on-call schedule](https://betterstack.com/docs/uptime/creating-a-backup-oncall-schedule/)
[Next article\
\
Zoom integration](https://betterstack.com/docs/uptime/integrations/zoom/)
###### On this page
* [What are runbooks?](https://betterstack.com/docs/uptime/runbooks/#what-are-runbooks)
* [Creating runbooks](https://betterstack.com/docs/uptime/runbooks/#creating-runbooks)
* [Best practices](https://betterstack.com/docs/uptime/runbooks/#best-practices)
* [Reusing runbooks](https://betterstack.com/docs/uptime/runbooks/#reusing-runbooks)
### Please accept cookies
We use cookies to authenticate users, improve the product user experience, and for [personalized ads](https://business.safety.google/privacy/)
. [Learn more.](https://betterstack.com/privacy)
Deny Accept required Accept all
---
# Get a heartbeat's availability summary | Better Stack Documentation
###### Explore documentation
* [Welcome to Uptime 👋](https://betterstack.com/docs/uptime/start/)
* [Frequently Asked Questions](https://betterstack.com/docs/uptime/frequently-asked-questions/)
* [On-call scheduling and alerting](https://betterstack.com/docs/uptime/api/get-a-heartbeats-availability-summary/)
1. [Get started](https://betterstack.com/docs/uptime/getting-started-with-oncall-v2/)
2. [Slack and other integrations ↗](https://betterstack.com/docs/uptime/slack/)
3. [Connecting external calendars](https://betterstack.com/docs/uptime/connecting-external-calendars/)
4. [Advanced guide](https://betterstack.com/docs/uptime/escalation-policies/)
* [Incidents](https://betterstack.com/docs/uptime/api/get-a-heartbeats-availability-summary/)
1. [Get started](https://betterstack.com/docs/uptime/working-with-incidents/)
2. [Advanced guide](https://betterstack.com/docs/uptime/post-mortems/)
3. [Reporting ↗](https://betterstack.com/docs/getting-started/team-and-account-management/reporting/)
* [Monitoring](https://betterstack.com/docs/uptime/api/get-a-heartbeats-availability-summary/)
1. [Get started](https://betterstack.com/docs/uptime/monitoring-start/)
2. [Working with monitors](https://betterstack.com/docs/uptime/bulk-importing-monitors/)
3. [Customizing monitors](https://betterstack.com/docs/uptime/naming-monitors/)
4. [Monitor types](https://betterstack.com/docs/uptime/uptime-monitor/)
* [Status pages](https://betterstack.com/docs/uptime/api/get-a-heartbeats-availability-summary/)
1. [Get started](https://betterstack.com/docs/uptime/getting-started-with-status-pages/)
2. [Advanced guide](https://betterstack.com/docs/uptime/custom-subdomain/)
* [Uptime API](https://betterstack.com/docs/uptime/api/get-a-heartbeats-availability-summary/)
1. [Getting an API token](https://betterstack.com/docs/uptime/api/getting-started-with-uptime-api/)
2. [Monitors](https://betterstack.com/docs/uptime/api/list-all-existing-monitors/)
3. [Heartbeats](https://betterstack.com/docs/uptime/api/list-all-existing-hearbeats/)
1. [Heartbeats API](https://betterstack.com/docs/uptime/api/list-all-existing-hearbeats/)
1. [List heartbeats GET](https://betterstack.com/docs/uptime/api/list-all-existing-hearbeats/)
2. [Get heartbeat GET](https://betterstack.com/docs/uptime/api/get-a-single-hearbeat/)
3. [Heartbeat availability GET](https://betterstack.com/docs/uptime/api/get-a-heartbeats-availability-summary/)
4. [Create heartbeat POST](https://betterstack.com/docs/uptime/api/create-a-hearbeat/)
5. [Update heartbeat PATCH](https://betterstack.com/docs/uptime/api/update-existing-hearbeat/)
6. [Remove heartbeat DELETE](https://betterstack.com/docs/uptime/api/delete-existing-heartbeat/)
7. [Response attributes](https://betterstack.com/docs/uptime/api/heartbeats-api-response-params/)
2. [Heartbeat groups API](https://betterstack.com/docs/uptime/api/list-all-existing-heartbeat-groups/)
4. [On-call & incidents](https://betterstack.com/docs/uptime/api/on-call-calendar/)
5. [Status pages](https://betterstack.com/docs/uptime/api/list-all-existing-status-pages/)
6. [Metadata](https://betterstack.com/docs/uptime/api/metadata/)
7. [Integrations](https://betterstack.com/docs/uptime/api/list-all-new-relic-integrations/)
8. [Team members](https://betterstack.com/docs/uptime/api/team-members/list/)
Get a heartbeat's availability summary
======================================
Returns availability summary for a specific heartbeat.
GET https://uptime.betterstack.com/api/v2/heartbeats/{heartbeat\_id}/availability
URL parameters
heartbeat\_id
required string
The ID of your requested heartbeat
Query parameters
from
string
Start date (e.g., 2021-01-26)
to
string
End date (e.g., 2021-01-27)
Headers
Authorization
required string
Bearer `$TOKEN`
200
Returns the availability summary since the heartbeat was created or for the specified date range.
The values of `total_downtime`, `longest_incident`, and `average_incident` are in seconds
Response body
{
"data": {
"id": "824910",
"type": "heartbeat_availability",
"attributes": {
"availability": 99.98,
"total_downtime": 335,
"number_of_incidents": 5,
"longest_incident": 194,
"average_incident": 67
}
}
}
400
When the optional from and to dates are invalid (e.g., the start date is in the future or the end date is before the start date).
Response body
{
"errors": "The data range is invalid. The date format could not be parsed, the start time is in the future, or the end time is before the start time."
}
#### Example cURL
Example
Copied!
curl --request GET \
--url https://uptime.betterstack.com/api/v2/heartbeats/123456789/availability?from=2021-01-26&to=2021-01-27 \
--header "Authorization: Bearer $TOKEN"
#### Looking for the details of a specific parameter?
Explore [the list of all heartbeats API parameters](https://betterstack.com/docs/uptime/api/heartbeats-api-response-params/?utm_content=callout&utm_medium=docs-uptime&utm_source=community&utm_term=docs-uptime-api-getting-heartbeats-availability-summary)
* * *
[Previous article\
\
Get a single heartbeat](https://betterstack.com/docs/uptime/api/get-a-single-hearbeat/)
[Next article\
\
Create a heartbeat](https://betterstack.com/docs/uptime/api/create-a-hearbeat/)
### Please accept cookies
We use cookies to authenticate users, improve the product user experience, and for [personalized ads](https://business.safety.google/privacy/)
. [Learn more.](https://betterstack.com/privacy)
Deny Accept required Accept all
---
# List Prometheus integrations | Better Stack Documentation
###### Explore documentation
* [Welcome to Uptime 👋](https://betterstack.com/docs/uptime/start/)
* [Frequently Asked Questions](https://betterstack.com/docs/uptime/frequently-asked-questions/)
* [On-call scheduling and alerting](https://betterstack.com/docs/uptime/api/list-all-prometheus-integrations/)
1. [Get started](https://betterstack.com/docs/uptime/getting-started-with-oncall-v2/)
2. [Slack and other integrations ↗](https://betterstack.com/docs/uptime/slack/)
3. [Connecting external calendars](https://betterstack.com/docs/uptime/connecting-external-calendars/)
4. [Advanced guide](https://betterstack.com/docs/uptime/escalation-policies/)
* [Incidents](https://betterstack.com/docs/uptime/api/list-all-prometheus-integrations/)
1. [Get started](https://betterstack.com/docs/uptime/working-with-incidents/)
2. [Advanced guide](https://betterstack.com/docs/uptime/post-mortems/)
3. [Reporting ↗](https://betterstack.com/docs/getting-started/team-and-account-management/reporting/)
* [Monitoring](https://betterstack.com/docs/uptime/api/list-all-prometheus-integrations/)
1. [Get started](https://betterstack.com/docs/uptime/monitoring-start/)
2. [Working with monitors](https://betterstack.com/docs/uptime/bulk-importing-monitors/)
3. [Customizing monitors](https://betterstack.com/docs/uptime/naming-monitors/)
4. [Monitor types](https://betterstack.com/docs/uptime/uptime-monitor/)
* [Status pages](https://betterstack.com/docs/uptime/api/list-all-prometheus-integrations/)
1. [Get started](https://betterstack.com/docs/uptime/getting-started-with-status-pages/)
2. [Advanced guide](https://betterstack.com/docs/uptime/custom-subdomain/)
* [Uptime API](https://betterstack.com/docs/uptime/api/list-all-prometheus-integrations/)
1. [Getting an API token](https://betterstack.com/docs/uptime/api/getting-started-with-uptime-api/)
2. [Monitors](https://betterstack.com/docs/uptime/api/list-all-existing-monitors/)
3. [Heartbeats](https://betterstack.com/docs/uptime/api/list-all-existing-hearbeats/)
4. [On-call & incidents](https://betterstack.com/docs/uptime/api/on-call-calendar/)
5. [Status pages](https://betterstack.com/docs/uptime/api/list-all-existing-status-pages/)
6. [Metadata](https://betterstack.com/docs/uptime/api/metadata/)
7. [Integrations](https://betterstack.com/docs/uptime/api/list-all-new-relic-integrations/)
1. [New Relic](https://betterstack.com/docs/uptime/api/list-all-new-relic-integrations/)
2. [Datadog](https://betterstack.com/docs/uptime/api/list-all-datadog-integrations/)
3. [AWS CloudWatch](https://betterstack.com/docs/uptime/api/list-all-aws-cloudwatch-integrations/)
4. [Microsoft Azure](https://betterstack.com/docs/uptime/api/list-all-azure-integrations/)
5. [Google Monitoring](https://betterstack.com/docs/uptime/api/list-all-google-monitoring-integrations/)
6. [Grafana](https://betterstack.com/docs/uptime/api/list-all-grafana-integrations/)
7. [Elastic](https://betterstack.com/docs/uptime/api/list-all-elastic-integrations/)
8. [Prometheus](https://betterstack.com/docs/uptime/api/list-all-prometheus-integrations/)
1. [List Prometheus integrations GET](https://betterstack.com/docs/uptime/api/list-all-prometheus-integrations/)
2. [Get Prometheus integration GET](https://betterstack.com/docs/uptime/api/single-prometheus-integration/)
3. [Create Prometheus integration POST](https://betterstack.com/docs/uptime/api/create-prometheus-integration/)
4. [Update Prometheus integration PATCH](https://betterstack.com/docs/uptime/api/update-prometheus-integration/)
5. [Remove Prometheus integration DELETE](https://betterstack.com/docs/uptime/api/delete-prometheus-integration/)
6. [Response attributes](https://betterstack.com/docs/uptime/api/prometheus-integrations-response-params/)
9. [Email](https://betterstack.com/docs/uptime/api/list-all-email-integrations/)
10. [Incoming webhooks](https://betterstack.com/docs/uptime/api/list-all-incoming-webhooks/)
11. [Atlassian Jira](https://betterstack.com/docs/uptime/api/list-all-jira-integrations/)
12. [Slack](https://betterstack.com/docs/uptime/api/list-all-slack-integrations/)
13. [Outgoing webhooks](https://betterstack.com/docs/uptime/api/list-all-outgoing-webhook-integrations/)
14. [Splunk On-Call](https://betterstack.com/docs/uptime/api/list-all-splunk-on-call-integrations/)
15. [PagerDuty](https://betterstack.com/docs/uptime/api/list-all-pagerduty-integrations/)
16. [Catalog](https://betterstack.com/docs/uptime/api/catalog-integrations-relations/)
8. [Team members](https://betterstack.com/docs/uptime/api/team-members/list/)
List Prometheus integrations
============================
Returns a list of all your Prometheus integrations. This endpoint [supports pagination](https://betterstack.com/docs/uptime/api/pagination/)
.
GET https://uptime.betterstack.com/api/v2/prometheus-integrations
Query parameters
team\_name
string
Filter integrations belonging to a specified team when using [global API token](https://betterstack.com/docs/uptime/api/getting-started-with-uptime-api/#get-a-global-api-token)
.
Headers
Authorization
required string
Bearer `$TOKEN`
200
Returns list of existing Prometheus integrations
Response body
{
"data": [\
{\
"id": "37",\
"type": "prometheus_integration",\
"attributes": {\
"call": false,\
"sms": false,\
"email": true,\
"team_wait": 180,\
"recovery_period": null,\
"policy_id": null,\
"push": true,\
"name": "Prometheus Integration",\
"paused": false,\
"webhook_url": "https://uptime.betterstack.dev/api/v1/prometheus/webhook/[token]",\
"team_name": "Testing"\
}\
}\
],
"pagination": {
"first": "https://uptime.betterstack.com/api/v2/prometheus-integrations?page=1",
"last": "https://uptime.betterstack.com/api/v2/prometheus-integrations?page=1",
"prev": null,
"next": null
}
}
#### Example cURL
Example
Copied!
curl --request GET \
--url https://uptime.betterstack.com/api/v2/prometheus-integrations \
--header "Authorization: Bearer $TOKEN"
#### Looking for the details of a specific parameter?
Explore [the list of all Prometheus integration API parameters](https://betterstack.com/docs/uptime/api/prometheus-integrations-response-params/?utm_content=callout&utm_medium=docs-uptime&utm_source=community&utm_term=docs-uptime-api-list-all-prometheus-integrations)
.
* * *
[Previous article\
\
Response attributes](https://betterstack.com/docs/uptime/api/grafana-elastic-response-params/)
[Next article\
\
Get Prometheus integration](https://betterstack.com/docs/uptime/api/single-prometheus-integration/)
### Please accept cookies
We use cookies to authenticate users, improve the product user experience, and for [personalized ads](https://business.safety.google/privacy/)
. [Learn more.](https://betterstack.com/privacy)
Deny Accept required Accept all
---
# Update Azure integration | Better Stack Documentation
###### Explore documentation
* [Welcome to Uptime 👋](https://betterstack.com/docs/uptime/start/)
* [Frequently Asked Questions](https://betterstack.com/docs/uptime/frequently-asked-questions/)
* [On-call scheduling and alerting](https://betterstack.com/docs/uptime/api/update-azure-integration/)
1. [Get started](https://betterstack.com/docs/uptime/getting-started-with-oncall-v2/)
2. [Slack and other integrations ↗](https://betterstack.com/docs/uptime/slack/)
3. [Connecting external calendars](https://betterstack.com/docs/uptime/connecting-external-calendars/)
4. [Advanced guide](https://betterstack.com/docs/uptime/escalation-policies/)
* [Incidents](https://betterstack.com/docs/uptime/api/update-azure-integration/)
1. [Get started](https://betterstack.com/docs/uptime/working-with-incidents/)
2. [Advanced guide](https://betterstack.com/docs/uptime/post-mortems/)
3. [Reporting ↗](https://betterstack.com/docs/getting-started/team-and-account-management/reporting/)
* [Monitoring](https://betterstack.com/docs/uptime/api/update-azure-integration/)
1. [Get started](https://betterstack.com/docs/uptime/monitoring-start/)
2. [Working with monitors](https://betterstack.com/docs/uptime/bulk-importing-monitors/)
3. [Customizing monitors](https://betterstack.com/docs/uptime/naming-monitors/)
4. [Monitor types](https://betterstack.com/docs/uptime/uptime-monitor/)
* [Status pages](https://betterstack.com/docs/uptime/api/update-azure-integration/)
1. [Get started](https://betterstack.com/docs/uptime/getting-started-with-status-pages/)
2. [Advanced guide](https://betterstack.com/docs/uptime/custom-subdomain/)
* [Uptime API](https://betterstack.com/docs/uptime/api/update-azure-integration/)
1. [Getting an API token](https://betterstack.com/docs/uptime/api/getting-started-with-uptime-api/)
2. [Monitors](https://betterstack.com/docs/uptime/api/list-all-existing-monitors/)
3. [Heartbeats](https://betterstack.com/docs/uptime/api/list-all-existing-hearbeats/)
4. [On-call & incidents](https://betterstack.com/docs/uptime/api/on-call-calendar/)
5. [Status pages](https://betterstack.com/docs/uptime/api/list-all-existing-status-pages/)
6. [Metadata](https://betterstack.com/docs/uptime/api/metadata/)
7. [Integrations](https://betterstack.com/docs/uptime/api/list-all-new-relic-integrations/)
1. [New Relic](https://betterstack.com/docs/uptime/api/list-all-new-relic-integrations/)
2. [Datadog](https://betterstack.com/docs/uptime/api/list-all-datadog-integrations/)
3. [AWS CloudWatch](https://betterstack.com/docs/uptime/api/list-all-aws-cloudwatch-integrations/)
4. [Microsoft Azure](https://betterstack.com/docs/uptime/api/list-all-azure-integrations/)
1. [List Azure integrations GET](https://betterstack.com/docs/uptime/api/list-all-azure-integrations/)
2. [Get Azure integration GET](https://betterstack.com/docs/uptime/api/single-azure-integration/)
3. [Create Azure integration POST](https://betterstack.com/docs/uptime/api/create-azure-integration/)
4. [Update Azure integration PATCH](https://betterstack.com/docs/uptime/api/update-azure-integration/)
5. [Remove Azure integration DELETE](https://betterstack.com/docs/uptime/api/delete-azure-integration/)
6. [Response attributes](https://betterstack.com/docs/uptime/api/azure-integrations-response-params/)
5. [Google Monitoring](https://betterstack.com/docs/uptime/api/list-all-google-monitoring-integrations/)
6. [Grafana](https://betterstack.com/docs/uptime/api/list-all-grafana-integrations/)
7. [Elastic](https://betterstack.com/docs/uptime/api/list-all-elastic-integrations/)
8. [Prometheus](https://betterstack.com/docs/uptime/api/list-all-prometheus-integrations/)
9. [Email](https://betterstack.com/docs/uptime/api/list-all-email-integrations/)
10. [Incoming webhooks](https://betterstack.com/docs/uptime/api/list-all-incoming-webhooks/)
11. [Atlassian Jira](https://betterstack.com/docs/uptime/api/list-all-jira-integrations/)
12. [Slack](https://betterstack.com/docs/uptime/api/list-all-slack-integrations/)
13. [Outgoing webhooks](https://betterstack.com/docs/uptime/api/list-all-outgoing-webhook-integrations/)
14. [Splunk On-Call](https://betterstack.com/docs/uptime/api/list-all-splunk-on-call-integrations/)
15. [PagerDuty](https://betterstack.com/docs/uptime/api/list-all-pagerduty-integrations/)
16. [Catalog](https://betterstack.com/docs/uptime/api/catalog-integrations-relations/)
8. [Team members](https://betterstack.com/docs/uptime/api/team-members/list/)
Update Azure integration
========================
Update an existing Azure integration. Send only the parameters you wish to change (eg. `paused`).
PATCH https://uptime.betterstack.com/api/v2/azure-integrations/{azure\_integration\_id}
URL parameters
azure\_integration\_id
required string
The ID of the Azure integration you want to update
Headers
Authorization
required string
Bearer `$TOKEN`
Content\_Type
string
application/json
Body parameters
name
string
The name of the Azure integration that you can see in the dashboard.
\*
Any params you'd like to set. See the [list of all Azure integration API parameters](https://betterstack.com/docs/uptime/api/azure-integrations-response-params/)
for details.
200
Returns the Azure integration
Response body
{
"data": {
"id": "37",
"type": "azure_integration",
"attributes": {
"call": false,
"sms": false,
"email": true,
"team_wait": 180,
"recovery_period": null,
"policy_id": null,
"push": true,
"name": "Test Again",
"paused": false,
"webhook_url": "https://uptime.betterstack.dev/api/v1/azure/webhook/[token]",
"team_name": "Testing",
}
}
}
#### Example cURL
Example
Copied!
curl -X "PATCH" "https://uptime.betterstack.com/api/v2/azure-integrations/37" \
-H "Authorization: Bearer $TOKEN" \
-H 'Content-Type: application/json; charset=utf-8' \
-d $'{
"name": "Test Again"
}'
#### Looking for the details of a specific parameter?
Explore [the list of all Azure integration API parameters](https://betterstack.com/docs/uptime/api/azure-integrations-response-params/?utm_content=callout&utm_medium=docs-uptime&utm_source=community&utm_term=docs-uptime-api-update-azure-integration)
* * *
[Previous article\
\
Create Azure integration](https://betterstack.com/docs/uptime/api/create-azure-integration/)
[Next article\
\
Remove Azure integration](https://betterstack.com/docs/uptime/api/delete-azure-integration/)
### Please accept cookies
We use cookies to authenticate users, improve the product user experience, and for [personalized ads](https://business.safety.google/privacy/)
. [Learn more.](https://betterstack.com/privacy)
Deny Accept required Accept all
---
# Simplified PromQL | Better Stack Documentation
###### Explore documentation
* [Welcome to Telemetry 👋](https://betterstack.com/docs/logs/start/)
* [Quick start guide](https://betterstack.com/docs/logs/logging-start/)
* [Wide events vs. metrics](https://betterstack.com/docs/logs/wide-events-time-series/)
* [Ingesting data](https://betterstack.com/docs/logs/using-logtail/simplified-promql/)
1. [Better Stack collector](https://betterstack.com/docs/logs/collector/)
2. [Vector](https://betterstack.com/docs/logs/vector/)
3. [OpenTelemetry](https://betterstack.com/docs/logs/open-telemetry/)
4. [Ingesting via HTTP API](https://betterstack.com/docs/logs/ingesting-data/http/logs/)
5. [Ingesting metrics](https://betterstack.com/docs/logs/ingesting-data/metrics/prometheus-scrape/)
6. [Ingesting logs](https://betterstack.com/docs/logs/ingesting-data/logs/docker-kubernetes/)
7. [Migrating to Better Stack](https://betterstack.com/docs/logs/datadog-agent/)
* [Using the product](https://betterstack.com/docs/logs/using-logtail/simplified-promql/)
1. [AI SRE ↗](https://betterstack.com/demos/ai-sre/)
2. [MCP server ↗](https://betterstack.com/docs/getting-started/integrations/mcp/)
3. [Transforming ingested data](https://betterstack.com/docs/logs/using-logtail/transforming-ingested-data/logs-vrl/)
4. [Querying data](https://betterstack.com/docs/logs/using-logtail/live-tail-query-language/)
1. [Live tail](https://betterstack.com/docs/logs/using-logtail/live-tail-query-language/)
2. [Events](https://betterstack.com/docs/logs/using-logtail/explore-logs/)
3. [Dashboards](https://betterstack.com/docs/logs/dashboards/getting-started/)
1. [Get started](https://betterstack.com/docs/logs/dashboards/getting-started/)
2. [Writing SQL queries](https://betterstack.com/docs/logs/dashboards/sql-queries/)
3. [Query variables](https://betterstack.com/docs/logs/dashboards/variables/)
4. [Querying histograms](https://betterstack.com/docs/logs/querying-histograms/)
5. [GeoIP map visualization](https://betterstack.com/docs/logs/map-visualization/)
6. [Simplified PromQL](https://betterstack.com/docs/logs/using-logtail/simplified-promql/)
7. [Pipelined Query Language](https://betterstack.com/docs/logs/dashboards/pql-queries/)
8. [Transforming query results with JavaScript](https://betterstack.com/docs/logs/dashboards/sql-queries/js-transform/)
9. [Schema migration Feb '26](https://betterstack.com/docs/logs/unifying-metrics-schema/)
4. [SQL API](https://betterstack.com/docs/logs/query-api/connect-remotely/)
5. [Query boost](https://betterstack.com/docs/logs/query-boost/)
6. [Faster queries](https://betterstack.com/docs/logs/faster-queries/)
7. [Host data in own bucket](https://betterstack.com/docs/logs/host-data-in-your-own-bucket/)
5. [Tracing](https://betterstack.com/docs/logs/tracing/)
6. [Alerts](https://betterstack.com/docs/logs/dashboards/alerts/)
* [Telemetry API](https://betterstack.com/docs/logs/using-logtail/simplified-promql/)
1. [Getting an API token](https://betterstack.com/docs/logs/api/getting-started/)
2. [Sources & collectors](https://betterstack.com/docs/logs/api/list-all-existing-sources/)
3. [Dashboards](https://betterstack.com/docs/logs/api/dashboards/list/)
4. [Explorations](https://betterstack.com/docs/logs/api/explorations/list/)
5. [Alerts API](https://betterstack.com/docs/logs/api/alerts/list/)
6. [Connections API](https://betterstack.com/docs/logs/api/connections/list/)
7. [Query API ↗](https://betterstack.com/docs/logs/query-api/connect-remotely/)
* [Alternative to](https://betterstack.com/docs/logs/using-logtail/simplified-promql/)
1. [Lightstep](https://betterstack.com/docs/logs/alternative-to/lightstep/)
Simplified PromQL
=================
Getting started
---------------
Create your first chart using a PromQL query. Start by creating a dashboard in [Dashboards](https://telemetry.betterstack.com/team/0/dashboards)
→ **Create dashboard**.
Create a new chart on your dashboard and use a query like the one below:
Average rate of http requests
Copied!
avg(rate(http_requests_total))
#### Simplified PromQL querying can only be used to query metrics
For querying logs, please use one of our other options
PromQL (Prometheus Query Language) is designed for querying time series data. In Betterstack, we've adapted a subset of PromQL to work with log data, allowing you to leverage some of your existing PromQL knowledge. Note that our implementation currently has some limitations:
1. The only supported function is `rate()`.
2. Some of the more advanced queries may not be supported yet
Supported operations
--------------------
Betterstack supports the following PromQL operations:
* Basic metric selection
* Label matching (e.g., `{label="value"}`)
* Aggregation operators with `by` and `without` clauses
* The `rate()` function
* Mathematical operations between series with the same tags
Aggregation operators include:
* `sum`: Calculate the sum of elements in the vector
* `avg`: Calculate the average of elements in the vector
* `min`: Select the minimum element of the vector
* `max`: Select the maximum element of the vector
* `count`: Count the number of elements in the vector
* `topk`: Select the k largest elements of the vector
* `bottomk`: Select the k smallest elements of the vector
Examples
--------
See the examples below for full queries using PromQL in Betterstack.
### HTTP request rate by method
Query the rate of HTTP requests
Copied!
sum by (method) (rate(http_requests_total))
This query returns the rate of HTTP requests, grouped by HTTP method.
### CPU usage rate by pod
Query CPU usage
Copied!
rate(container_cpu_usage_seconds_total{container!=""}) without (id)
This query returns the per-second rate of CPU usage over the last 15 minutes for each pod, excluding the "id" label.
### Average memory usage rate
Query memory usage by instance
Copied!
avg by (instance) (rate(process_resident_memory_bytes))
This query calculates the average per-second rate of memory usage for each instance.
### Top 5 most frequently accessed API endpoints
Query the top 5 most used api endpoints
Copied!
topk(5, sum by (endpoint) (rate(api_requests_total)))
This query returns the top 5 API endpoints with the highest per-second request rate.
### Network I/O rate by interface
Query the network transmission of each interface
Copied!
sum by (interface) (rate(network_transmit_bytes_total))
This query returns the per-second rate of network transmission (in bytes), grouped by network interface.
Need help?
----------
Please let us know at [hello@betterstack.com](mailto:hello@betterstack.com)
.
We're happy to help! 🙏
* * *
[Previous article\
\
Visualize location and IP data](https://betterstack.com/docs/logs/map-visualization/)
[Next article\
\
Writing queries using Pipelined Query Language](https://betterstack.com/docs/logs/dashboards/pql-queries/)
###### On this page
* [Getting started](https://betterstack.com/docs/logs/using-logtail/simplified-promql/#getting-started)
* [Supported operations](https://betterstack.com/docs/logs/using-logtail/simplified-promql/#supported-operations)
* [Examples](https://betterstack.com/docs/logs/using-logtail/simplified-promql/#examples)
* [Need help?](https://betterstack.com/docs/logs/using-logtail/simplified-promql/#need-help)
### Please accept cookies
We use cookies to authenticate users, improve the product user experience, and for [personalized ads](https://business.safety.google/privacy/)
. [Learn more.](https://betterstack.com/privacy)
Deny Accept required Accept all
---
# Domain expiration monitor | Better Stack Documentation
###### Explore documentation
* [Welcome to Uptime 👋](https://betterstack.com/docs/uptime/start/)
* [Frequently Asked Questions](https://betterstack.com/docs/uptime/frequently-asked-questions/)
* [On-call scheduling and alerting](https://betterstack.com/docs/uptime/domain-expiration-monitoring/)
1. [Get started](https://betterstack.com/docs/uptime/getting-started-with-oncall-v2/)
2. [Slack and other integrations ↗](https://betterstack.com/docs/uptime/slack/)
3. [Connecting external calendars](https://betterstack.com/docs/uptime/connecting-external-calendars/)
4. [Advanced guide](https://betterstack.com/docs/uptime/escalation-policies/)
* [Incidents](https://betterstack.com/docs/uptime/domain-expiration-monitoring/)
1. [Get started](https://betterstack.com/docs/uptime/working-with-incidents/)
2. [Advanced guide](https://betterstack.com/docs/uptime/post-mortems/)
3. [Reporting ↗](https://betterstack.com/docs/getting-started/team-and-account-management/reporting/)
* [Monitoring](https://betterstack.com/docs/uptime/domain-expiration-monitoring/)
1. [Get started](https://betterstack.com/docs/uptime/monitoring-start/)
2. [Working with monitors](https://betterstack.com/docs/uptime/bulk-importing-monitors/)
3. [Customizing monitors](https://betterstack.com/docs/uptime/naming-monitors/)
4. [Monitor types](https://betterstack.com/docs/uptime/uptime-monitor/)
1. [Uptime monitor](https://betterstack.com/docs/uptime/uptime-monitor/)
2. [Keyword monitor](https://betterstack.com/docs/uptime/keyword-monitor/)
3. [Ping monitor](https://betterstack.com/docs/uptime/ping-monitor/)
4. [Cron and heartbeat monitor](https://betterstack.com/docs/uptime/cron-and-heartbeat-monitor/)
5. [Playwright monitor](https://betterstack.com/docs/uptime/playwright-monitor/)
6. [API monitor](https://betterstack.com/docs/uptime/api-monitor/)
7. [DNS monitor](https://betterstack.com/docs/uptime/dns-monitor/)
8. [Domain expiration monitor](https://betterstack.com/docs/uptime/domain-expiration-monitoring/)
9. [SSL certificate monitor](https://betterstack.com/docs/uptime/ssl-certificate-monitor/)
10. [TCP/UDP port monitor](https://betterstack.com/docs/uptime/tcpudp-port-monitor/)
11. [Monitoring private networks](https://betterstack.com/docs/uptime/monitoring-private-networks/)
* [Status pages](https://betterstack.com/docs/uptime/domain-expiration-monitoring/)
1. [Get started](https://betterstack.com/docs/uptime/getting-started-with-status-pages/)
2. [Advanced guide](https://betterstack.com/docs/uptime/custom-subdomain/)
* [Uptime API](https://betterstack.com/docs/uptime/domain-expiration-monitoring/)
1. [Getting an API token](https://betterstack.com/docs/uptime/api/getting-started-with-uptime-api/)
2. [Monitors](https://betterstack.com/docs/uptime/api/list-all-existing-monitors/)
3. [Heartbeats](https://betterstack.com/docs/uptime/api/list-all-existing-hearbeats/)
4. [On-call & incidents](https://betterstack.com/docs/uptime/api/on-call-calendar/)
5. [Status pages](https://betterstack.com/docs/uptime/api/list-all-existing-status-pages/)
6. [Metadata](https://betterstack.com/docs/uptime/api/metadata/)
7. [Integrations](https://betterstack.com/docs/uptime/api/list-all-new-relic-integrations/)
8. [Team members](https://betterstack.com/docs/uptime/api/team-members/list/)
Domain expiration monitor
=========================
Domain expiration monitoring is built into [uptime monitors](https://betterstack.com/docs/uptime/uptime-monitor/)
and [keyword monitors](https://betterstack.com/docs/uptime/keyword-monitor/)
, and can be set up in each monitor type's **Advanced settings**.
If this is your first time setting up domain expiration monitoring, we recommend starting with our [Introduction to domain expiration monitoring](https://betterstack.com/community/guides/what-is-domain-expiration-monitoring/?utm_content=callout&utm_medium=docs-uptime&utm_source=community&utm_term=docs-domain-expiration-monitoring)
.
* * *
[Previous article\
\
DNS monitor](https://betterstack.com/docs/uptime/dns-monitor/)
[Next article\
\
SSL certificate monitor](https://betterstack.com/docs/uptime/ssl-certificate-monitor/)
### Please accept cookies
We use cookies to authenticate users, improve the product user experience, and for [personalized ads](https://business.safety.google/privacy/)
. [Learn more.](https://betterstack.com/privacy)
Deny Accept required Accept all
---
# SSL certificate monitor | Better Stack Documentation
###### Explore documentation
* [Welcome to Uptime 👋](https://betterstack.com/docs/uptime/start/)
* [Frequently Asked Questions](https://betterstack.com/docs/uptime/frequently-asked-questions/)
* [On-call scheduling and alerting](https://betterstack.com/docs/uptime/ssl-certificate-monitor/)
1. [Get started](https://betterstack.com/docs/uptime/getting-started-with-oncall-v2/)
2. [Slack and other integrations ↗](https://betterstack.com/docs/uptime/slack/)
3. [Connecting external calendars](https://betterstack.com/docs/uptime/connecting-external-calendars/)
4. [Advanced guide](https://betterstack.com/docs/uptime/escalation-policies/)
* [Incidents](https://betterstack.com/docs/uptime/ssl-certificate-monitor/)
1. [Get started](https://betterstack.com/docs/uptime/working-with-incidents/)
2. [Advanced guide](https://betterstack.com/docs/uptime/post-mortems/)
3. [Reporting ↗](https://betterstack.com/docs/getting-started/team-and-account-management/reporting/)
* [Monitoring](https://betterstack.com/docs/uptime/ssl-certificate-monitor/)
1. [Get started](https://betterstack.com/docs/uptime/monitoring-start/)
2. [Working with monitors](https://betterstack.com/docs/uptime/bulk-importing-monitors/)
3. [Customizing monitors](https://betterstack.com/docs/uptime/naming-monitors/)
4. [Monitor types](https://betterstack.com/docs/uptime/uptime-monitor/)
1. [Uptime monitor](https://betterstack.com/docs/uptime/uptime-monitor/)
2. [Keyword monitor](https://betterstack.com/docs/uptime/keyword-monitor/)
3. [Ping monitor](https://betterstack.com/docs/uptime/ping-monitor/)
4. [Cron and heartbeat monitor](https://betterstack.com/docs/uptime/cron-and-heartbeat-monitor/)
5. [Playwright monitor](https://betterstack.com/docs/uptime/playwright-monitor/)
6. [API monitor](https://betterstack.com/docs/uptime/api-monitor/)
7. [DNS monitor](https://betterstack.com/docs/uptime/dns-monitor/)
8. [Domain expiration monitor](https://betterstack.com/docs/uptime/domain-expiration-monitoring/)
9. [SSL certificate monitor](https://betterstack.com/docs/uptime/ssl-certificate-monitor/)
10. [TCP/UDP port monitor](https://betterstack.com/docs/uptime/tcpudp-port-monitor/)
11. [Monitoring private networks](https://betterstack.com/docs/uptime/monitoring-private-networks/)
* [Status pages](https://betterstack.com/docs/uptime/ssl-certificate-monitor/)
1. [Get started](https://betterstack.com/docs/uptime/getting-started-with-status-pages/)
2. [Advanced guide](https://betterstack.com/docs/uptime/custom-subdomain/)
* [Uptime API](https://betterstack.com/docs/uptime/ssl-certificate-monitor/)
1. [Getting an API token](https://betterstack.com/docs/uptime/api/getting-started-with-uptime-api/)
2. [Monitors](https://betterstack.com/docs/uptime/api/list-all-existing-monitors/)
3. [Heartbeats](https://betterstack.com/docs/uptime/api/list-all-existing-hearbeats/)
4. [On-call & incidents](https://betterstack.com/docs/uptime/api/on-call-calendar/)
5. [Status pages](https://betterstack.com/docs/uptime/api/list-all-existing-status-pages/)
6. [Metadata](https://betterstack.com/docs/uptime/api/metadata/)
7. [Integrations](https://betterstack.com/docs/uptime/api/list-all-new-relic-integrations/)
8. [Team members](https://betterstack.com/docs/uptime/api/team-members/list/)
SSL certificate monitor
=======================
SSL certificate monitoring is built into [uptime monitors](https://betterstack.com/docs/uptime/uptime-monitor/)
and [keyword monitors](https://betterstack.com/docs/uptime/keyword-monitor/)
and can be set up in each monitor's **Advanced settings**.
If this is your first time setting up SSL certificate monitoring, we recommend starting with our [Introduction to SSL certificate monitoring](https://betterstack.com/community/guides/monitoring/what-is-ssl-certificate-monitoring/?utm_content=callout&utm_medium=docs-uptime&utm_source=community&utm_term=docs-ssl-certificate-monitor)
.
* * *
[Previous article\
\
Domain expiration monitor](https://betterstack.com/docs/uptime/domain-expiration-monitoring/)
[Next article\
\
TCP/UDP port monitor](https://betterstack.com/docs/uptime/tcpudp-port-monitor/)
### Please accept cookies
We use cookies to authenticate users, improve the product user experience, and for [personalized ads](https://business.safety.google/privacy/)
. [Learn more.](https://betterstack.com/privacy)
Deny Accept required Accept all
---
# Check frequency | Better Stack Documentation
###### Explore documentation
* [Welcome to Uptime 👋](https://betterstack.com/docs/uptime/start/)
* [Frequently Asked Questions](https://betterstack.com/docs/uptime/frequently-asked-questions/)
* [On-call scheduling and alerting](https://betterstack.com/docs/uptime/check-frequency/)
1. [Get started](https://betterstack.com/docs/uptime/getting-started-with-oncall-v2/)
2. [Slack and other integrations ↗](https://betterstack.com/docs/uptime/slack/)
3. [Connecting external calendars](https://betterstack.com/docs/uptime/connecting-external-calendars/)
4. [Advanced guide](https://betterstack.com/docs/uptime/escalation-policies/)
* [Incidents](https://betterstack.com/docs/uptime/check-frequency/)
1. [Get started](https://betterstack.com/docs/uptime/working-with-incidents/)
2. [Advanced guide](https://betterstack.com/docs/uptime/post-mortems/)
3. [Reporting ↗](https://betterstack.com/docs/getting-started/team-and-account-management/reporting/)
* [Monitoring](https://betterstack.com/docs/uptime/check-frequency/)
1. [Get started](https://betterstack.com/docs/uptime/monitoring-start/)
2. [Working with monitors](https://betterstack.com/docs/uptime/bulk-importing-monitors/)
3. [Customizing monitors](https://betterstack.com/docs/uptime/naming-monitors/)
1. [Naming monitors](https://betterstack.com/docs/uptime/naming-monitors/)
2. [Check frequency](https://betterstack.com/docs/uptime/check-frequency/)
3. [Request timeout](https://betterstack.com/docs/uptime/request-timeout/)
4. [Confirmation and recovery period](https://betterstack.com/docs/uptime/confirmation-and-recovery-period/)
5. [Domain expiration checks](https://betterstack.com/docs/uptime/domain-expiration-checks/)
6. [SSL certificate checks](https://betterstack.com/docs/uptime/ssl-certificate-checks/)
7. [Cache busting](https://betterstack.com/docs/uptime/cache-busting-in-monitoring/)
8. [Locations and regions](https://betterstack.com/docs/uptime/locations-and-regions/)
9. [Request parameters, headers and HTTP authentication](https://betterstack.com/docs/uptime/request-parameters-headers-and-http-authentication/)
10. [Github badge](https://betterstack.com/docs/uptime/github-badge/)
4. [Monitor types](https://betterstack.com/docs/uptime/uptime-monitor/)
* [Status pages](https://betterstack.com/docs/uptime/check-frequency/)
1. [Get started](https://betterstack.com/docs/uptime/getting-started-with-status-pages/)
2. [Advanced guide](https://betterstack.com/docs/uptime/custom-subdomain/)
* [Uptime API](https://betterstack.com/docs/uptime/check-frequency/)
1. [Getting an API token](https://betterstack.com/docs/uptime/api/getting-started-with-uptime-api/)
2. [Monitors](https://betterstack.com/docs/uptime/api/list-all-existing-monitors/)
3. [Heartbeats](https://betterstack.com/docs/uptime/api/list-all-existing-hearbeats/)
4. [On-call & incidents](https://betterstack.com/docs/uptime/api/on-call-calendar/)
5. [Status pages](https://betterstack.com/docs/uptime/api/list-all-existing-status-pages/)
6. [Metadata](https://betterstack.com/docs/uptime/api/metadata/)
7. [Integrations](https://betterstack.com/docs/uptime/api/list-all-new-relic-integrations/)
8. [Team members](https://betterstack.com/docs/uptime/api/team-members/list/)
Check frequency
===============
The check frequency states how often we check the monitor. The frequency options range from 3 minutes for free plans to 30 seconds for paid plans.
To change the monitor's check frequency, go to [Monitors](https://uptime.betterstack.com/team/0/monitors)
→ **Select a monitor** → **Configure** → **Advanced settings** and select it from the dropdown menu.
* * *
[Previous article\
\
Naming monitors](https://betterstack.com/docs/uptime/naming-monitors/)
[Next article\
\
Request timeout](https://betterstack.com/docs/uptime/request-timeout/)
### Please accept cookies
We use cookies to authenticate users, improve the product user experience, and for [personalized ads](https://business.safety.google/privacy/)
. [Learn more.](https://betterstack.com/privacy)
Deny Accept required Accept all
---
# Get started with Telemetry API | Better Stack Documentation
###### Explore documentation
* [Welcome to Telemetry 👋](https://betterstack.com/docs/logs/start/)
* [Quick start guide](https://betterstack.com/docs/logs/logging-start/)
* [Wide events vs. metrics](https://betterstack.com/docs/logs/wide-events-time-series/)
* [Ingesting data](https://betterstack.com/docs/logs/api/getting-started/)
1. [Better Stack collector](https://betterstack.com/docs/logs/collector/)
2. [Vector](https://betterstack.com/docs/logs/vector/)
3. [OpenTelemetry](https://betterstack.com/docs/logs/open-telemetry/)
4. [Ingesting via HTTP API](https://betterstack.com/docs/logs/ingesting-data/http/logs/)
5. [Ingesting metrics](https://betterstack.com/docs/logs/ingesting-data/metrics/prometheus-scrape/)
6. [Ingesting logs](https://betterstack.com/docs/logs/ingesting-data/logs/docker-kubernetes/)
7. [Migrating to Better Stack](https://betterstack.com/docs/logs/datadog-agent/)
* [Using the product](https://betterstack.com/docs/logs/api/getting-started/)
1. [AI SRE ↗](https://betterstack.com/demos/ai-sre/)
2. [MCP server ↗](https://betterstack.com/docs/getting-started/integrations/mcp/)
3. [Transforming ingested data](https://betterstack.com/docs/logs/using-logtail/transforming-ingested-data/logs-vrl/)
4. [Querying data](https://betterstack.com/docs/logs/using-logtail/live-tail-query-language/)
5. [Tracing](https://betterstack.com/docs/logs/tracing/)
6. [Alerts](https://betterstack.com/docs/logs/dashboards/alerts/)
* [Telemetry API](https://betterstack.com/docs/logs/api/getting-started/)
1. [Getting an API token](https://betterstack.com/docs/logs/api/getting-started/)
2. [Sources & collectors](https://betterstack.com/docs/logs/api/list-all-existing-sources/)
3. [Dashboards](https://betterstack.com/docs/logs/api/dashboards/list/)
4. [Explorations](https://betterstack.com/docs/logs/api/explorations/list/)
5. [Alerts API](https://betterstack.com/docs/logs/api/alerts/list/)
6. [Connections API](https://betterstack.com/docs/logs/api/connections/list/)
7. [Query API ↗](https://betterstack.com/docs/logs/query-api/connect-remotely/)
* [Alternative to](https://betterstack.com/docs/logs/api/getting-started/)
1. [Lightstep](https://betterstack.com/docs/logs/alternative-to/lightstep/)
Get started with Telemetry API
==============================


How Telemetry API works
-----------------------
Our API follows [JSON:API](https://jsonapi.org/)
specification.
API requests made to Better Stack API are authorized using a [Bearer Authentication standard](https://swagger.io/docs/specification/authentication/bearer-authentication/)
. That means you'll only need to add a header with `Authorization: Bearer $TOKEN` to your requests.
Get a global API token
----------------------
A **global API token** is a token valid across all your teams, for managing anything within Better Stack.
* Go to [Better Stack → API tokens](https://betterstack.com/settings/global-api-tokens)
.
* Copy existing or create new tokens in **Global API tokens** section.


Get a Telemetry API token
-------------------------
A **Telemetry API token** is a team-scoped token for managing your al your Telemetry resources, and resources in [Errors](https://betterstack.com/docs/errors/)
and [Warehouse](https://betterstack.com/docs/warehouse/)
. You can get a separate API token for each of your teams.
* Go to [Better Stack → API tokens -> Team-based tokens](https://betterstack.com/settings/api-tokens/0)
.
* Select your team.
* Copy existing or create new tokens in **Telemetry API tokens** section.


Terraform support
-----------------
You can manage your telemetry resources using [Terraform](https://betterstack.com/docs/getting-started/integrations/terraform/)
.
Have any questions?
-------------------
Please feel free to message us at [hello@betterstack.com](mailto:hello@betterstack.com)
.
We'll get back to you as soon as we can, typically within a few hours. 🙏
Thank you!
* * *
[Previous article\
\
Alerts](https://betterstack.com/docs/logs/dashboards/alerts/)
[Next article\
\
List all sources](https://betterstack.com/docs/logs/api/list-all-existing-sources/)
###### On this page
* [How Telemetry API works](https://betterstack.com/docs/logs/api/getting-started/#how-telemetry-api-works)
* [Get a global API token](https://betterstack.com/docs/logs/api/getting-started/#get-a-global-api-token)
* [Get a Telemetry API token](https://betterstack.com/docs/logs/api/getting-started/#get-a-telemetry-api-token)
* [Terraform support](https://betterstack.com/docs/logs/api/getting-started/#terraform-support)
* [Have any questions?](https://betterstack.com/docs/logs/api/getting-started/#have-any-questions)
### Please accept cookies
We use cookies to authenticate users, improve the product user experience, and for [personalized ads](https://business.safety.google/privacy/)
. [Learn more.](https://betterstack.com/privacy)
Deny Accept required Accept all
---
# Get a single warehouse source group | Better Stack Documentation
###### Explore documentation
* [Welcome to Warehouse 👋](https://betterstack.com/docs/warehouse/start/)
* [Ingesting data](https://betterstack.com/docs/warehouse/api/source-groups/get/)
1. [Ingesting events](https://betterstack.com/docs/warehouse/ingesting-data/intro/)
2. [S3 vs NVMe hosted data](https://betterstack.com/docs/warehouse/ingesting-data/s3-vs-nvme/)
3. [Host events in your S3 bucket](https://betterstack.com/docs/warehouse/ingesting-data/custom-s3-bucket/)
* [Querying data](https://betterstack.com/docs/warehouse/api/source-groups/get/)
1. [Querying events & time series](https://betterstack.com/docs/warehouse/querying-data/events-and-time-series/)
2. [Writing SQL queries](https://betterstack.com/docs/warehouse/querying-data/merge-and-state-aggregators/)
3. [Query speeds](https://betterstack.com/docs/warehouse/querying-data/query-speeds/)
4. [Ad-hoc SQL API](https://betterstack.com/docs/warehouse/querying-data/ad-hoc-sql-api/)
5. [Generate client-facing APIs](https://betterstack.com/docs/warehouse/querying-data/queries/)
6. [Visualizing data](https://betterstack.com/docs/warehouse/querying-data/visualizing-data/)
* [Vector embeddings](https://betterstack.com/docs/warehouse/api/source-groups/get/)
1. [Introduction to embeddings](https://betterstack.com/docs/warehouse/vector-embeddings/intro/)
2. [Using built-in embeddings](https://betterstack.com/docs/warehouse/vector-embeddings/built-in-embeddings/)
3. [Bringing your own embeddings](https://betterstack.com/docs/warehouse/vector-embeddings/bring-your-own/)
4. [Data structures and indices](https://betterstack.com/docs/warehouse/vector-embeddings/data-structures-and-indices/)
* [Use cases](https://betterstack.com/docs/warehouse/api/source-groups/get/)
1. [Retrieval Augmented Generation](https://betterstack.com/docs/warehouse/use-cases/building-rag/)
* [Management](https://betterstack.com/docs/warehouse/api/source-groups/get/)
1. [Controlling costs](https://betterstack.com/docs/warehouse/management/controlling-costs/)
* [Warehouse API](https://betterstack.com/docs/warehouse/api/source-groups/get/)
1. [Getting an API token](https://betterstack.com/docs/warehouse/api/getting-api-token/)
2. [Warehouse sources API](https://betterstack.com/docs/warehouse/api/sources/list/)
3. [Warehouse source groups API](https://betterstack.com/docs/warehouse/api/source-groups/list/)
1. [List all groups GET](https://betterstack.com/docs/warehouse/api/source-groups/list/)
2. [Get a single group GET](https://betterstack.com/docs/warehouse/api/source-groups/get/)
3. [Create a group POST](https://betterstack.com/docs/warehouse/api/source-groups/create/)
4. [Update a group PUT](https://betterstack.com/docs/warehouse/api/source-groups/update/)
5. [Remove a group DELETE](https://betterstack.com/docs/warehouse/api/source-groups/delete/)
6. [List sources in a group GET](https://betterstack.com/docs/warehouse/api/source-groups/list-sources/)
4. [Time series API](https://betterstack.com/docs/warehouse/api/time-series/list/)
5. [Embeddings API](https://betterstack.com/docs/warehouse/api/embeddings/list/)
Get a single warehouse source group
===================================
Returns a specific Warehouse source group by its ID.
GET https://warehouse.betterstack.com/api/v1/source-groups/{id}
URL parameters
id
required string
The ID of the Warehouse source group to retrieve.
Headers
Authorization
required string
Bearer `$TOKEN`
200
The requested Warehouse source group.
Response body
{
"data": {
"id": "1234",
"type": "warehouse_source_group",
"attributes": {
"name": "Analytics",
"created_at": "2025-11-13T10:00:00Z",
"updated_at": "2025-11-25T20:44:50Z",
"sort_index": null,
"team_name": "example-team"
}
}
}
401
Unauthorized
Response body
{
"errors": "Invalid Team API token. How to find your Team API token: https://betterstack.com/docs/logs/api/getting-started/#obtaining-a-logtail-api-token"
}
404
Not Found
Response body
{
"errors": "Resource with the provided ID was not found"
}
#### Example cURL
Example
Copied!
curl --request GET \
--url https://warehouse.betterstack.com/api/v1/source-groups/1234 \
--header "Authorization: Bearer $TOKEN"
* * *
[Previous article\
\
List all warehouse source groups](https://betterstack.com/docs/warehouse/api/source-groups/list/)
[Next article\
\
Create a warehouse source group](https://betterstack.com/docs/warehouse/api/source-groups/create/)
### Please accept cookies
We use cookies to authenticate users, improve the product user experience, and for [personalized ads](https://business.safety.google/privacy/)
. [Learn more.](https://betterstack.com/privacy)
Deny Accept required Accept all
---
# Request parameters, headers and HTTP authentication | Better Stack Documentation
###### Explore documentation
* [Welcome to Uptime 👋](https://betterstack.com/docs/uptime/start/)
* [Frequently Asked Questions](https://betterstack.com/docs/uptime/frequently-asked-questions/)
* [On-call scheduling and alerting](https://betterstack.com/docs/uptime/request-parameters-headers-and-http-authentication/)
1. [Get started](https://betterstack.com/docs/uptime/getting-started-with-oncall-v2/)
2. [Slack and other integrations ↗](https://betterstack.com/docs/uptime/slack/)
3. [Connecting external calendars](https://betterstack.com/docs/uptime/connecting-external-calendars/)
4. [Advanced guide](https://betterstack.com/docs/uptime/escalation-policies/)
* [Incidents](https://betterstack.com/docs/uptime/request-parameters-headers-and-http-authentication/)
1. [Get started](https://betterstack.com/docs/uptime/working-with-incidents/)
2. [Advanced guide](https://betterstack.com/docs/uptime/post-mortems/)
3. [Reporting ↗](https://betterstack.com/docs/getting-started/team-and-account-management/reporting/)
* [Monitoring](https://betterstack.com/docs/uptime/request-parameters-headers-and-http-authentication/)
1. [Get started](https://betterstack.com/docs/uptime/monitoring-start/)
2. [Working with monitors](https://betterstack.com/docs/uptime/bulk-importing-monitors/)
3. [Customizing monitors](https://betterstack.com/docs/uptime/naming-monitors/)
1. [Naming monitors](https://betterstack.com/docs/uptime/naming-monitors/)
2. [Check frequency](https://betterstack.com/docs/uptime/check-frequency/)
3. [Request timeout](https://betterstack.com/docs/uptime/request-timeout/)
4. [Confirmation and recovery period](https://betterstack.com/docs/uptime/confirmation-and-recovery-period/)
5. [Domain expiration checks](https://betterstack.com/docs/uptime/domain-expiration-checks/)
6. [SSL certificate checks](https://betterstack.com/docs/uptime/ssl-certificate-checks/)
7. [Cache busting](https://betterstack.com/docs/uptime/cache-busting-in-monitoring/)
8. [Locations and regions](https://betterstack.com/docs/uptime/locations-and-regions/)
9. [Request parameters, headers and HTTP authentication](https://betterstack.com/docs/uptime/request-parameters-headers-and-http-authentication/)
10. [Github badge](https://betterstack.com/docs/uptime/github-badge/)
4. [Monitor types](https://betterstack.com/docs/uptime/uptime-monitor/)
* [Status pages](https://betterstack.com/docs/uptime/request-parameters-headers-and-http-authentication/)
1. [Get started](https://betterstack.com/docs/uptime/getting-started-with-status-pages/)
2. [Advanced guide](https://betterstack.com/docs/uptime/custom-subdomain/)
* [Uptime API](https://betterstack.com/docs/uptime/request-parameters-headers-and-http-authentication/)
1. [Getting an API token](https://betterstack.com/docs/uptime/api/getting-started-with-uptime-api/)
2. [Monitors](https://betterstack.com/docs/uptime/api/list-all-existing-monitors/)
3. [Heartbeats](https://betterstack.com/docs/uptime/api/list-all-existing-hearbeats/)
4. [On-call & incidents](https://betterstack.com/docs/uptime/api/on-call-calendar/)
5. [Status pages](https://betterstack.com/docs/uptime/api/list-all-existing-status-pages/)
6. [Metadata](https://betterstack.com/docs/uptime/api/metadata/)
7. [Integrations](https://betterstack.com/docs/uptime/api/list-all-new-relic-integrations/)
8. [Team members](https://betterstack.com/docs/uptime/api/team-members/list/)
Request parameters, headers and HTTP authentication
===================================================
Request parameters
------------------
Requests sent by monitors can be customized. Monitors use the GET HTTP method by default. To change it, go to [Monitors](https://uptime.betterstack.com/team/0/monitors)
→ **Select a monitor** → **Configure** → **Advanced settings** → **Request parameters**. Here you can pick other methods like POST, PATCH and others.
You can also include specific parameters to be included in the request body.
Request headers and HTTP authentication
---------------------------------------
There are two main authentication methods that can be used. The first one uses a header name and header value (for bearer token authentication). The second one is basic HTTP authentication with username and password.
* * *
[Previous article\
\
Locations and regions](https://betterstack.com/docs/uptime/locations-and-regions/)
[Next article\
\
Github badge](https://betterstack.com/docs/uptime/github-badge/)
###### On this page
* [Request parameters](https://betterstack.com/docs/uptime/request-parameters-headers-and-http-authentication/#request-parameters)
* [Request headers and HTTP authentication](https://betterstack.com/docs/uptime/request-parameters-headers-and-http-authentication/#request-headers-and-http-authentication)
### Please accept cookies
We use cookies to authenticate users, improve the product user experience, and for [personalized ads](https://business.safety.google/privacy/)
. [Learn more.](https://betterstack.com/privacy)
Deny Accept required Accept all
---
# Create outgoing webhook | Better Stack Documentation
###### Explore documentation
* [Welcome to Uptime 👋](https://betterstack.com/docs/uptime/start/)
* [Frequently Asked Questions](https://betterstack.com/docs/uptime/frequently-asked-questions/)
* [On-call scheduling and alerting](https://betterstack.com/docs/uptime/api/create-outgoing-webhook-integration/)
1. [Get started](https://betterstack.com/docs/uptime/getting-started-with-oncall-v2/)
2. [Slack and other integrations ↗](https://betterstack.com/docs/uptime/slack/)
3. [Connecting external calendars](https://betterstack.com/docs/uptime/connecting-external-calendars/)
4. [Advanced guide](https://betterstack.com/docs/uptime/escalation-policies/)
* [Incidents](https://betterstack.com/docs/uptime/api/create-outgoing-webhook-integration/)
1. [Get started](https://betterstack.com/docs/uptime/working-with-incidents/)
2. [Advanced guide](https://betterstack.com/docs/uptime/post-mortems/)
3. [Reporting ↗](https://betterstack.com/docs/getting-started/team-and-account-management/reporting/)
* [Monitoring](https://betterstack.com/docs/uptime/api/create-outgoing-webhook-integration/)
1. [Get started](https://betterstack.com/docs/uptime/monitoring-start/)
2. [Working with monitors](https://betterstack.com/docs/uptime/bulk-importing-monitors/)
3. [Customizing monitors](https://betterstack.com/docs/uptime/naming-monitors/)
4. [Monitor types](https://betterstack.com/docs/uptime/uptime-monitor/)
* [Status pages](https://betterstack.com/docs/uptime/api/create-outgoing-webhook-integration/)
1. [Get started](https://betterstack.com/docs/uptime/getting-started-with-status-pages/)
2. [Advanced guide](https://betterstack.com/docs/uptime/custom-subdomain/)
* [Uptime API](https://betterstack.com/docs/uptime/api/create-outgoing-webhook-integration/)
1. [Getting an API token](https://betterstack.com/docs/uptime/api/getting-started-with-uptime-api/)
2. [Monitors](https://betterstack.com/docs/uptime/api/list-all-existing-monitors/)
3. [Heartbeats](https://betterstack.com/docs/uptime/api/list-all-existing-hearbeats/)
4. [On-call & incidents](https://betterstack.com/docs/uptime/api/on-call-calendar/)
5. [Status pages](https://betterstack.com/docs/uptime/api/list-all-existing-status-pages/)
6. [Metadata](https://betterstack.com/docs/uptime/api/metadata/)
7. [Integrations](https://betterstack.com/docs/uptime/api/list-all-new-relic-integrations/)
1. [New Relic](https://betterstack.com/docs/uptime/api/list-all-new-relic-integrations/)
2. [Datadog](https://betterstack.com/docs/uptime/api/list-all-datadog-integrations/)
3. [AWS CloudWatch](https://betterstack.com/docs/uptime/api/list-all-aws-cloudwatch-integrations/)
4. [Microsoft Azure](https://betterstack.com/docs/uptime/api/list-all-azure-integrations/)
5. [Google Monitoring](https://betterstack.com/docs/uptime/api/list-all-google-monitoring-integrations/)
6. [Grafana](https://betterstack.com/docs/uptime/api/list-all-grafana-integrations/)
7. [Elastic](https://betterstack.com/docs/uptime/api/list-all-elastic-integrations/)
8. [Prometheus](https://betterstack.com/docs/uptime/api/list-all-prometheus-integrations/)
9. [Email](https://betterstack.com/docs/uptime/api/list-all-email-integrations/)
10. [Incoming webhooks](https://betterstack.com/docs/uptime/api/list-all-incoming-webhooks/)
11. [Atlassian Jira](https://betterstack.com/docs/uptime/api/list-all-jira-integrations/)
12. [Slack](https://betterstack.com/docs/uptime/api/list-all-slack-integrations/)
13. [Outgoing webhooks](https://betterstack.com/docs/uptime/api/list-all-outgoing-webhook-integrations/)
1. [List outgoing webhooks GET](https://betterstack.com/docs/uptime/api/list-all-outgoing-webhook-integrations/)
2. [Get outgoing webhook GET](https://betterstack.com/docs/uptime/api/single-outgoing-webhook-integration/)
3. [Create outgoing webhook POST](https://betterstack.com/docs/uptime/api/create-outgoing-webhook-integration/)
4. [Update outgoing webhook PATCH](https://betterstack.com/docs/uptime/api/update-outgoing-webhook-integration/)
5. [Remove outgoing webhook DELETE](https://betterstack.com/docs/uptime/api/delete-outgoing-webhook-integration/)
6. [Response attributes](https://betterstack.com/docs/uptime/api/outgoing-webhook-integrations-response-params/)
14. [Splunk On-Call](https://betterstack.com/docs/uptime/api/list-all-splunk-on-call-integrations/)
15. [PagerDuty](https://betterstack.com/docs/uptime/api/list-all-pagerduty-integrations/)
16. [Catalog](https://betterstack.com/docs/uptime/api/catalog-integrations-relations/)
8. [Team members](https://betterstack.com/docs/uptime/api/team-members/list/)
Create outgoing webhook
=======================
Returns either a newly created Outgoing Webhook integration, or validation errors.
POST https://uptime.betterstack.com/api/v2/outgoing-webhooks
Headers
Authorization
required string
Bearer `$TOKEN`
Content\_Type
string
application/json
Body parameters
team\_name
string
Required if using [global API token](https://betterstack.com/docs/uptime/api/getting-started-with-uptime-api/#get-a-global-api-token)
to specify the team which should own the resource.
name
string
The name of the Outgoing Webhook integration that you can see in the dashboard.
url
required string
The URL of the Outgoing Webhook integration.
trigger\_type
required string
The type of trigger for the Outgoing Webhook integration. Possible values are `on_call_change`, `incident_change` and `monitor_change`.
on\_incident\_started
boolean
Whether to trigger the Outgoing Webhook integration when an incident starts. Only applicable if `trigger_type` is `incident_change`.
on\_incident\_acknowledged
boolean
Whether to trigger the Outgoing Webhook integration when an incident is acknowledged. Only applicable if `trigger_type` is `incident_change`.
on\_incident\_resolved
boolean
Whether to trigger the Outgoing Webhook integration when an incident is resolved. Only applicable if `trigger_type` is `incident_change`.
on\_incident\_reopened
boolean
Whether to trigger the Outgoing Webhook integration when an incident is reopened. Only applicable if `trigger_type` is `incident_change`.
custom\_webhook\_template\_attributes
object
Use this to specify the custom webhook template attributes. See below.
custom\_webhook\_template\_attributes.http\_method
string
The HTTP method to use when sending the webhook. Possible values are `get`, `post`, `put`, `patch` and `head`.
custom\_webhook\_template\_attributes.auth\_username
string
The username to use for basic authentication.
custom\_webhook\_template\_attributes.auth\_password
string
The password to use for basic authentication.
custom\_webhook\_template\_attributes.headers\_template
array
The headers to send with the webhook.
Each header is an object with \`name\` and \`value\` keys.
Copied!
{
"custom_webhook_template_attributes": {
"headers_template": [\
{ "name": "Content-Type", "value": "application/json" },\
{ "name": "X-Custom-Header", "value": "Custom-Value" }\
]
}
}
custom\_webhook\_template\_attributes.body\_template
string|JSON
The body to send with the webhook. The value can be a stringified JSON or a JSON object.
Using JSON object
Copied!
{
"custom_webhook_template_attributes": {
"body_template": {
"data": {
"id": "$INCIDENT_ID",
"type": "incident",
"attributes": {
"name": "$NAME",
"url": "$URL",
"http_method": "$HTTP_METHOD",
"screenshot_url": "$SCREENSHOT_URL"
}
}
}
}
}
Using stringified JSON
Copied!
{
"custom_webhook_template_attributes": {
"body_template": "{\"data\":{\"id\":\"$INCIDENT_ID\",\"type\":\"incident\",\"attributes\":{\"name\":\"$NAME\",\"url\":\"$URL\",\"http_method\":\"$HTTP_METHOD\",\"screenshot_url\":\"$SCREENSHOT_URL\"}}}"
}
}
When not specified, the default template is used. Each `trigger_type` has its own default template:
Default template for \`on\_call\_change\`
Copied!
{
"data":{
"message": "$MESSAGE",
"emails": $EMAILS_JSON_ARRAY,
"calendar_id": $ON_CALL_CALENDAR_ID,
"calendar_name": "$ON_CALL_CALENDAR_NAME",
"primary_calendar": $DEFAULT_ON_CALL_CALENDAR
}
}
Default template for \`incident\_change\`
Copied!
{
"data": {
"id": "$INCIDENT_ID",
"type": "incident",
"attributes": {
"name": "$NAME",
"url": "$URL",
"http_method": "$HTTP_METHOD",
"cause": "$CAUSE",
"started_at": "$STARTED_AT",
"acknowledged_at": "$ACKNOWLEDGED_AT",
"resolved_at": "$RESOLVED_AT",
"response_content": "$RESPONSE_CONTENT",
"response_url": "$RESPONSE_URL",
"screenshot_url": "$SCREENSHOT_URL"
}
}
}
Default template for \`monitor\_change\`
Copied!
{
"data":{
"id": "$MONITOR_ID",
"type": "monitor",
"attributes":{
"url": "$URL",
"pronounceable_name": "$PRONOUNCEABLE_NAME",
"monitor_type": "$MONITOR_TYPE",
"required_keyword": "$REQUIRED_KEYWORD",
"verify_ssl": $VERIFY_SSL,
"check_frequency": $CHECK_FREQUENCY,
"call": $CALL,
"sms": $SMS,
"email": $EMAIL,
"team_wait": "$TEAM_WAIT",
"http_method": "$HTTP_METHOD",
"request_timeout": "$REQUEST_TIMEOUT",
"recovery_period": "$RECOVERY_PERIOD",
"request_body": "$REQUEST_BODY",
"paused_at": "$PAUSED_AT",
"last_checked_at": "$LAST_CHECKED_AT"
}
}
}
201
Returns newly created Outgoing Webhook integration
Response body
{
"data": {
"id": "16",
"type": "outgoing_webhook",
"attributes": {
"name": "test",
"url": "https://example.com",
"trigger_type": "on_call_change",
"team_name": "My team"
},
"relationships": {
"custom_webhook_template": {
"data": null
}
}
},
"included": []
}
#### Example cURL
Example
Copied!
curl -X "POST" "https://uptime.betterstack.com/api/v2/outgoing-webhooks/" \
-H "Authorization: Bearer $TOKEN" \
-H 'Content-Type: application/json; charset=utf-8' \
-d $'{
"name": "Test",
"url": "https://example.com",
"trigger_type": "on_call_change"
}'
#### Looking for the details of a specific parameter?
Explore [the list of all Outgoing Webhook integration API parameters](https://betterstack.com/docs/uptime/api/outgoing-webhook-integrations-response-params/?utm_content=callout&utm_medium=docs-uptime&utm_source=community&utm_term=docs-uptime-api-create-outgoing-webhook-integration)
* * *
[Previous article\
\
Get outgoing webhook](https://betterstack.com/docs/uptime/api/single-outgoing-webhook-integration/)
[Next article\
\
Update outgoing webhook](https://betterstack.com/docs/uptime/api/update-outgoing-webhook-integration/)
### Please accept cookies
We use cookies to authenticate users, improve the product user experience, and for [personalized ads](https://business.safety.google/privacy/)
. [Learn more.](https://betterstack.com/privacy)
Deny Accept required Accept all
---
# Playwright monitor | Better Stack Documentation
###### Explore documentation
* [Welcome to Uptime 👋](https://betterstack.com/docs/uptime/start/)
* [Frequently Asked Questions](https://betterstack.com/docs/uptime/frequently-asked-questions/)
* [On-call scheduling and alerting](https://betterstack.com/docs/uptime/playwright-monitor/)
1. [Get started](https://betterstack.com/docs/uptime/getting-started-with-oncall-v2/)
2. [Slack and other integrations ↗](https://betterstack.com/docs/uptime/slack/)
3. [Connecting external calendars](https://betterstack.com/docs/uptime/connecting-external-calendars/)
4. [Advanced guide](https://betterstack.com/docs/uptime/escalation-policies/)
* [Incidents](https://betterstack.com/docs/uptime/playwright-monitor/)
1. [Get started](https://betterstack.com/docs/uptime/working-with-incidents/)
2. [Advanced guide](https://betterstack.com/docs/uptime/post-mortems/)
3. [Reporting ↗](https://betterstack.com/docs/getting-started/team-and-account-management/reporting/)
* [Monitoring](https://betterstack.com/docs/uptime/playwright-monitor/)
1. [Get started](https://betterstack.com/docs/uptime/monitoring-start/)
2. [Working with monitors](https://betterstack.com/docs/uptime/bulk-importing-monitors/)
3. [Customizing monitors](https://betterstack.com/docs/uptime/naming-monitors/)
4. [Monitor types](https://betterstack.com/docs/uptime/uptime-monitor/)
1. [Uptime monitor](https://betterstack.com/docs/uptime/uptime-monitor/)
2. [Keyword monitor](https://betterstack.com/docs/uptime/keyword-monitor/)
3. [Ping monitor](https://betterstack.com/docs/uptime/ping-monitor/)
4. [Cron and heartbeat monitor](https://betterstack.com/docs/uptime/cron-and-heartbeat-monitor/)
5. [Playwright monitor](https://betterstack.com/docs/uptime/playwright-monitor/)
6. [API monitor](https://betterstack.com/docs/uptime/api-monitor/)
7. [DNS monitor](https://betterstack.com/docs/uptime/dns-monitor/)
8. [Domain expiration monitor](https://betterstack.com/docs/uptime/domain-expiration-monitoring/)
9. [SSL certificate monitor](https://betterstack.com/docs/uptime/ssl-certificate-monitor/)
10. [TCP/UDP port monitor](https://betterstack.com/docs/uptime/tcpudp-port-monitor/)
11. [Monitoring private networks](https://betterstack.com/docs/uptime/monitoring-private-networks/)
* [Status pages](https://betterstack.com/docs/uptime/playwright-monitor/)
1. [Get started](https://betterstack.com/docs/uptime/getting-started-with-status-pages/)
2. [Advanced guide](https://betterstack.com/docs/uptime/custom-subdomain/)
* [Uptime API](https://betterstack.com/docs/uptime/playwright-monitor/)
1. [Getting an API token](https://betterstack.com/docs/uptime/api/getting-started-with-uptime-api/)
2. [Monitors](https://betterstack.com/docs/uptime/api/list-all-existing-monitors/)
3. [Heartbeats](https://betterstack.com/docs/uptime/api/list-all-existing-hearbeats/)
4. [On-call & incidents](https://betterstack.com/docs/uptime/api/on-call-calendar/)
5. [Status pages](https://betterstack.com/docs/uptime/api/list-all-existing-status-pages/)
6. [Metadata](https://betterstack.com/docs/uptime/api/metadata/)
7. [Integrations](https://betterstack.com/docs/uptime/api/list-all-new-relic-integrations/)
8. [Team members](https://betterstack.com/docs/uptime/api/team-members/list/)
Playwright monitor
==================
Set up fast and reliable end-to-end monitoring for your web apps.
If this is your first time setting up Playwright monitoring, we recommend starting with our [Playwright Testing Essentials](https://betterstack.com/community/guides/testing/playwright-intro/?utm_content=callout&utm_medium=docs-uptime&utm_source=community&utm_term=docs-playwright-monitor)
.
Getting started
---------------
Create your first Playwright scenario:
* Navigate to [Monitors](https://uptime.betterstack.com/team/0/monitors)
→ **Create monitor**.
* Select **Alert us when: Playwright scenario fails**.
* Use the following code:
Test that users can sign up on mobile
Copied!
import { test, expect } from '@playwright/test';
test('mobile page contains Sign up', async ({ page }) => {
await page.setViewportSize({ width: 360, height: 640 });
await page.goto('https://betterstack.com/');
const pageContent = await page.textContent('body');
expect(pageContent).toContain('Sign up');
});
With this simple test, you can make sure that your customers can sign up from your landing page on mobile. Creating Playwright scenarios for critical user flows is a great way to protect yourself from regressions and unexpected issues.
#### Start monitoring your landing page today
Change the URL and the sign up button text in the example test above.
How to create Playwright scenarios?
-----------------------------------
We recommend using the [Playwright Codegen](https://playwright.dev/docs/codegen)
or [ChatGPT](https://chat.openai.com/)
:
* **Playwright Codegen**: Record end-to-end tests using VSCode or Playwright Inspector. Read more in [the official Playwright guide](https://playwright.dev/docs/codegen)
.
* **ChatGPT**: Generate your tests with the help of AI. Go to [ChatGPT](https://chat.openai.com/)
and start with this query:
Great starting query to use with ChatGPT
Copied!
Write a Playwright test using test and expect in JavaScript:
- Set viewport to mobile device size
- Open betterstack.com
- Click Sign up button
- ...
Using environment variables
---------------------------
You can use passwords, secrets, and tokens securely in your scenarios by defining them as environment variables:
1. Navigate to [Monitors](https://uptime.betterstack.com/team/0/monitors)
→ **Select a monitor** → **Configure** → **Advanced settings** → **Environment variables**.
2. Add variable names and values as needed.
To access defined variables in your scenario, use expressions like `process.env.PASSWORD`:
Test that users can sign in
Copied!
import { test, expect } from '@playwright/test';
test('users can sign in', async ({ page }) => {
await page.goto('https://app.example.com/');
await page.getByLabel('E-mail').fill('user@example.com');
await page.getByLabel('Password').fill(process.env.PASSWORD);
await page.getByRole('button', { name: 'Sign in' }).click();
await page.waitForURL('https://app.example.com/dashboard');
});
Adding instant retries of failing test
--------------------------------------
You can avoid flaky tests using retries in Playwright:
Retrying failing tests up to 2 times
Copied!
import { test, expect } from '@playwright/test';
// Retries failing tests up to 2 times
test.describe.configure({ retries: 2 });
test('has title', async ({ page }) => {
await page.goto('https://betterstack.com/')
await expect(page).toHaveTitle(/Better Stack/)
// Add some randomness to the results to test retry
// A single test succeeds only in 50% of cases
await expect(Math.random() > 0.5).toBeTruthy()
});
Using Playwright to monitor APIs
--------------------------------
You can call your API directly using `fetch` and use custom Javascript to verify the results:
API monitoring example
Copied!
import { test, expect } from '@playwright/test';
test('No expensive coffee in API', async () => {
const URL = 'https://api.sampleapis.com/coffee/hot';
const MAX_PRICE = 2.9;
const response = await fetch(URL, {
method: 'GET',
headers: {
'Authorization': `Bearer ${process.env.API_TOKEN}`,
'Content-Type': 'application/json',
},
});
console.debug("API Response:", response);
expect(response.ok).toBeTruthy();
const data = await response.json();
console.debug("API JSON data:", data);
const expensiveItems = data
.filter(item => item.price > MAX_PRICE);
if (expensiveItems.length > 0) {
console.warn('🚨 Found expensive items:');
expensiveItems.forEach(item => {
console.warn(`- ${item.title}: $${item.price}`);
});
throw new Error(`Found ${expensiveItems.length} item(s) over $${MAX_PRICE}.`);
}
});
Using `console.log` can provide additional info in case an incident is created.
Storing and querying data in Playwright scripts
-----------------------------------------------
**Playwright monitors are stateless.** For persistent storage in your Playwright scenario, use a [Warehouse source](https://betterstack.com/docs/warehouse/)
.
**Ingest data**: Send your Playwright script's output, console logs, or custom event data as [JSON events to a Warehouse source](https://betterstack.com/docs/warehouse/ingesting-data/)
. This allows you to retain any custom data you extract, detailed records of each test run, or performance metrics.
**Query as API**: Leverage the [Warehouse Query as API](https://betterstack.com/docs/warehouse/querying-data/queries/)
feature to define SQL queries over the data you stored. These queries can then be exposed as secure JSON endpoints you can use directly in your Playwright moniton, enabling it to react to the previous state.
**Alerts**: Use the data to create [custom alerting](https://betterstack.com/docs/logs/dashboards/alerts/)
based on thresholds or detected anomalies in your Playwright script's performance or output.
Need help?
----------
Please let us know at [hello@betterstack.com](mailto:hello@betterstack.com)
.
We're happy to help! 🙏
* * *
[Previous article\
\
Cron and heartbeat monitor](https://betterstack.com/docs/uptime/cron-and-heartbeat-monitor/)
[Next article\
\
API monitor](https://betterstack.com/docs/uptime/api-monitor/)
###### On this page
* [Getting started](https://betterstack.com/docs/uptime/playwright-monitor/#getting-started)
* [How to create Playwright scenarios?](https://betterstack.com/docs/uptime/playwright-monitor/#how-to-create-playwright-scenarios)
* [Using environment variables](https://betterstack.com/docs/uptime/playwright-monitor/#using-environment-variables)
* [Adding instant retries of failing test](https://betterstack.com/docs/uptime/playwright-monitor/#adding-instant-retries-of-failing-test)
* [Using Playwright to monitor APIs](https://betterstack.com/docs/uptime/playwright-monitor/#using-playwright-to-monitor-apis)
* [Storing and querying data in Playwright scripts](https://betterstack.com/docs/uptime/playwright-monitor/#storing-and-querying-data-in-playwright-scripts)
* [Need help?](https://betterstack.com/docs/uptime/playwright-monitor/#need-help)
### Please accept cookies
We use cookies to authenticate users, improve the product user experience, and for [personalized ads](https://business.safety.google/privacy/)
. [Learn more.](https://betterstack.com/privacy)
Deny Accept required Accept all
---
# Better Stack MinIO metrics | Better Stack Documentation
###### Explore documentation
* [Welcome to Telemetry 👋](https://betterstack.com/docs/logs/start/)
* [Quick start guide](https://betterstack.com/docs/logs/logging-start/)
* [Wide events vs. metrics](https://betterstack.com/docs/logs/wide-events-time-series/)
* [Ingesting data](https://betterstack.com/docs/logs/minio/)
1. [Better Stack collector](https://betterstack.com/docs/logs/collector/)
2. [Vector](https://betterstack.com/docs/logs/vector/)
3. [OpenTelemetry](https://betterstack.com/docs/logs/open-telemetry/)
4. [Ingesting via HTTP API](https://betterstack.com/docs/logs/ingesting-data/http/logs/)
5. [Ingesting metrics](https://betterstack.com/docs/logs/ingesting-data/metrics/prometheus-scrape/)
6. [Ingesting logs](https://betterstack.com/docs/logs/ingesting-data/logs/docker-kubernetes/)
1. [Docker & Kubernetes](https://betterstack.com/docs/logs/docker/)
2. [Operating systems](https://betterstack.com/docs/logs/ubuntu/)
3. [Log forwarders](https://betterstack.com/docs/logs/metrics/vector/)
4. [Programming languages](https://betterstack.com/docs/logs/javascript/)
5. [Cloud platforms](https://betterstack.com/docs/logs/aws/)
6. [Web servers & Load balancers](https://betterstack.com/docs/logs/nginx/)
7. [Databases & queues](https://betterstack.com/docs/logs/postgresql/)
8. [Storage](https://betterstack.com/docs/logs/minio/)
1. [MinIO](https://betterstack.com/docs/logs/minio/)
7. [Migrating to Better Stack](https://betterstack.com/docs/logs/datadog-agent/)
* [Using the product](https://betterstack.com/docs/logs/minio/)
1. [AI SRE ↗](https://betterstack.com/demos/ai-sre/)
2. [MCP server ↗](https://betterstack.com/docs/getting-started/integrations/mcp/)
3. [Transforming ingested data](https://betterstack.com/docs/logs/using-logtail/transforming-ingested-data/logs-vrl/)
4. [Querying data](https://betterstack.com/docs/logs/using-logtail/live-tail-query-language/)
5. [Tracing](https://betterstack.com/docs/logs/tracing/)
6. [Alerts](https://betterstack.com/docs/logs/dashboards/alerts/)
* [Telemetry API](https://betterstack.com/docs/logs/minio/)
1. [Getting an API token](https://betterstack.com/docs/logs/api/getting-started/)
2. [Sources & collectors](https://betterstack.com/docs/logs/api/list-all-existing-sources/)
3. [Dashboards](https://betterstack.com/docs/logs/api/dashboards/list/)
4. [Explorations](https://betterstack.com/docs/logs/api/explorations/list/)
5. [Alerts API](https://betterstack.com/docs/logs/api/alerts/list/)
6. [Connections API](https://betterstack.com/docs/logs/api/connections/list/)
7. [Query API ↗](https://betterstack.com/docs/logs/query-api/connect-remotely/)
* [Alternative to](https://betterstack.com/docs/logs/minio/)
1. [Lightstep](https://betterstack.com/docs/logs/alternative-to/lightstep/)
Better Stack MinIO metrics
==========================
Start collecting metrics in 2 minutes
-------------------------------------
Collect metrics from your MinIO server using [Vector](https://vector.dev/)
.
### 1\. Expose metrics
Expose metrics from your MinIO server by setting `MINIO_PROMETHEUS_AUTH_TYPE` environment variable:
Set up and restart MinIO
Copied!
export MINIO_PROMETHEUS_AUTH_TYPE=public
minio server /data
#### Use actual data path
Replace `/data` by your path to the data.
### 2\. Set up Vector
Select your platform:
Ubuntu • Debian CentOS • Red Hat • Amazon Linux macOS Windows Other
Install and configure [Vector](https://vector.dev/)
on Ubuntu or Debian:
Install and configure [Vector](https://vector.dev/)
on any Red Hat-based Linux:
Install and configure [Vector](https://vector.dev/)
on macOS:
Set up Vector
Copied!
curl -sSL https://telemetry.betterstack.com/setup-vector/minio/$SOURCE_TOKEN \
-o /tmp/setup-vector.sh && \
bash /tmp/setup-vector.sh
**Curious about what the script does?**
* Installs Vector using official package.
* Configures Vector for your Better Stack source.
* Enables and restarts Vector.
The script will ask for confirmation before making any changes.
#### Install
Install [Vector](https://vector.dev/docs/setup/installation/operating-systems/windows/)
on Windows using official installer:
Install Vector
Copied!
powershell Invoke-WebRequest https://packages.timber.io/vector/latest/vector-x64.msi -OutFile vector-latest-x64.msi
msiexec /i vector-latest-x64.msi
#### Setup
Run in Powershell as administrator to download Vector config:
Download Vector config using Powershell
Copied!
$config_yaml_path = "C:\Program Files\Vector\config\vector.yaml"
$backup_path = "C:\Program Files\Vector\config\vector-backup.yaml"
Move-Item -Path "$config_yaml_path" -Destination "$backup_path"
Invoke-RestMethod -Uri https://telemetry.betterstack.com/vector-yaml/minio/$SOURCE_TOKEN |
Add-Content $config_yaml_path
#### Run Vector
Run Vector with new configuration:
Start Vector
Copied!
& "C:\Program Files\Vector\bin\vector" --config "C:\Program Files\Vector\config\vector.yaml"
#### Install
Install [Vector](https://vector.dev/docs/setup/installation/manual/vector-installer/)
using official installer:
Install Vector
Copied!
curl --proto '=https' --tlsv1.2 -sSf https://sh.vector.dev | sh -s -- -y
Create a [Vector service](https://www.shubhamdipt.com/blog/how-to-create-a-systemd-service-in-linux/)
:
Create a Vector service
Copied!
mkdir -p /etc/vector
mkdir -p /var/lib/vector/
cat <<-'SERVICE' >> /etc/systemd/system/vector.service
[Unit]
Description=Vector
Documentation=https://vector.dev
After=network-online.target
Requires=network-online.target
[Service]
User=vector
Group=vector
ExecStart=/root/.vector/bin/vector
ExecReload=/bin/kill -HUP $MAINPID
Restart=no
AmbientCapabilities=CAP_NET_BIND_SERVICE
EnvironmentFile=-/etc/default/vector
[Install]
WantedBy=multi-user.target
SERVICE
#### Setup
Download Vector configuration for your source:
Download Vector config
Copied!
CONFIG_YAML_PATH="/etc/vector/vector.yaml"
BACKUP_SUFFIX=".bak-$(date +%Y%m%d%H%M%S)"
mv "${CONFIG_YAML_PATH}" "${CONFIG_YAML_PATH}${BACKUP_SUFFIX}"
curl -o "$CONFIG_YAML_PATH" \
https://telemetry.betterstack.com/vector-yaml/minio/$SOURCE_TOKEN
#### Restart Vector
Restart Vector to reload the configuration:
Restart Vector
Copied!
systemctl restart vector
You should see your logs in [Better Stack → Live tail](https://telemetry.betterstack.com/team/0/tail)
.
Need help?
----------
Please let us know at [hello@betterstack.com](mailto:hello@betterstack.com)
.
We're happy to help! 🙏
* * *
[Previous article\
\
Better Stack Elasticsearch logging](https://betterstack.com/docs/logs/elasticsearch/)
[Next article\
\
Better Stack Datadog Agent metrics & logs forwarding](https://betterstack.com/docs/logs/datadog-agent/)
###### On this page
* [Start collecting metrics in 2 minutes](https://betterstack.com/docs/logs/minio/#start-collecting-metrics-in-2-minutes)
* [Need help?](https://betterstack.com/docs/logs/minio/#need-help)
### Please accept cookies
We use cookies to authenticate users, improve the product user experience, and for [personalized ads](https://business.safety.google/privacy/)
. [Learn more.](https://betterstack.com/privacy)
Deny Accept required Accept all
---
# Commenting on incidents | Better Stack Documentation
###### Explore documentation
* [Welcome to Uptime 👋](https://betterstack.com/docs/uptime/start/)
* [Frequently Asked Questions](https://betterstack.com/docs/uptime/frequently-asked-questions/)
* [On-call scheduling and alerting](https://betterstack.com/docs/uptime/commenting-on-incidents/)
1. [Get started](https://betterstack.com/docs/uptime/getting-started-with-oncall-v2/)
2. [Slack and other integrations ↗](https://betterstack.com/docs/uptime/slack/)
3. [Connecting external calendars](https://betterstack.com/docs/uptime/connecting-external-calendars/)
4. [Advanced guide](https://betterstack.com/docs/uptime/escalation-policies/)
* [Incidents](https://betterstack.com/docs/uptime/commenting-on-incidents/)
1. [Get started](https://betterstack.com/docs/uptime/working-with-incidents/)
1. [Acknowledging an incident](https://betterstack.com/docs/uptime/acknowledging-an-incident/)
2. [Resolving an incident](https://betterstack.com/docs/uptime/resolving-an-incident/)
3. [Incident details](https://betterstack.com/docs/uptime/incident-details/)
4. [Commenting on incidents](https://betterstack.com/docs/uptime/commenting-on-incidents/)
5. [Incident grouping](https://betterstack.com/docs/uptime/incident-grouping/)
6. [Create incidents manually](https://betterstack.com/docs/uptime/creating-incidents-manually/)
2. [Advanced guide](https://betterstack.com/docs/uptime/post-mortems/)
3. [Reporting ↗](https://betterstack.com/docs/getting-started/team-and-account-management/reporting/)
* [Monitoring](https://betterstack.com/docs/uptime/commenting-on-incidents/)
1. [Get started](https://betterstack.com/docs/uptime/monitoring-start/)
2. [Working with monitors](https://betterstack.com/docs/uptime/bulk-importing-monitors/)
3. [Customizing monitors](https://betterstack.com/docs/uptime/naming-monitors/)
4. [Monitor types](https://betterstack.com/docs/uptime/uptime-monitor/)
* [Status pages](https://betterstack.com/docs/uptime/commenting-on-incidents/)
1. [Get started](https://betterstack.com/docs/uptime/getting-started-with-status-pages/)
2. [Advanced guide](https://betterstack.com/docs/uptime/custom-subdomain/)
* [Uptime API](https://betterstack.com/docs/uptime/commenting-on-incidents/)
1. [Getting an API token](https://betterstack.com/docs/uptime/api/getting-started-with-uptime-api/)
2. [Monitors](https://betterstack.com/docs/uptime/api/list-all-existing-monitors/)
3. [Heartbeats](https://betterstack.com/docs/uptime/api/list-all-existing-hearbeats/)
4. [On-call & incidents](https://betterstack.com/docs/uptime/api/on-call-calendar/)
5. [Status pages](https://betterstack.com/docs/uptime/api/list-all-existing-status-pages/)
6. [Metadata](https://betterstack.com/docs/uptime/api/metadata/)
7. [Integrations](https://betterstack.com/docs/uptime/api/list-all-new-relic-integrations/)
8. [Team members](https://betterstack.com/docs/uptime/api/team-members/list/)
Commenting on incidents
=======================
You can collaborate on resolving an incident with your colleagues by using comments. Upload screenshots, share your insights, and collaborate on resolving the incident together.
You can use [Markdown](https://docs.github.com/en/get-started/writing-on-github/getting-started-with-writing-and-formatting-on-github/basic-writing-and-formatting-syntax)
in the comments.
* * *
[Previous article\
\
Incident details](https://betterstack.com/docs/uptime/incident-details/)
[Next article\
\
Incident grouping](https://betterstack.com/docs/uptime/incident-grouping/)
### Please accept cookies
We use cookies to authenticate users, improve the product user experience, and for [personalized ads](https://business.safety.google/privacy/)
. [Learn more.](https://betterstack.com/privacy)
Deny Accept required Accept all
---
# Get a single heartbeat | Better Stack Documentation
###### Explore documentation
* [Welcome to Uptime 👋](https://betterstack.com/docs/uptime/start/)
* [Frequently Asked Questions](https://betterstack.com/docs/uptime/frequently-asked-questions/)
* [On-call scheduling and alerting](https://betterstack.com/docs/uptime/api/get-a-single-hearbeat/)
1. [Get started](https://betterstack.com/docs/uptime/getting-started-with-oncall-v2/)
2. [Slack and other integrations ↗](https://betterstack.com/docs/uptime/slack/)
3. [Connecting external calendars](https://betterstack.com/docs/uptime/connecting-external-calendars/)
4. [Advanced guide](https://betterstack.com/docs/uptime/escalation-policies/)
* [Incidents](https://betterstack.com/docs/uptime/api/get-a-single-hearbeat/)
1. [Get started](https://betterstack.com/docs/uptime/working-with-incidents/)
2. [Advanced guide](https://betterstack.com/docs/uptime/post-mortems/)
3. [Reporting ↗](https://betterstack.com/docs/getting-started/team-and-account-management/reporting/)
* [Monitoring](https://betterstack.com/docs/uptime/api/get-a-single-hearbeat/)
1. [Get started](https://betterstack.com/docs/uptime/monitoring-start/)
2. [Working with monitors](https://betterstack.com/docs/uptime/bulk-importing-monitors/)
3. [Customizing monitors](https://betterstack.com/docs/uptime/naming-monitors/)
4. [Monitor types](https://betterstack.com/docs/uptime/uptime-monitor/)
* [Status pages](https://betterstack.com/docs/uptime/api/get-a-single-hearbeat/)
1. [Get started](https://betterstack.com/docs/uptime/getting-started-with-status-pages/)
2. [Advanced guide](https://betterstack.com/docs/uptime/custom-subdomain/)
* [Uptime API](https://betterstack.com/docs/uptime/api/get-a-single-hearbeat/)
1. [Getting an API token](https://betterstack.com/docs/uptime/api/getting-started-with-uptime-api/)
2. [Monitors](https://betterstack.com/docs/uptime/api/list-all-existing-monitors/)
3. [Heartbeats](https://betterstack.com/docs/uptime/api/list-all-existing-hearbeats/)
1. [Heartbeats API](https://betterstack.com/docs/uptime/api/list-all-existing-hearbeats/)
1. [List heartbeats GET](https://betterstack.com/docs/uptime/api/list-all-existing-hearbeats/)
2. [Get heartbeat GET](https://betterstack.com/docs/uptime/api/get-a-single-hearbeat/)
3. [Heartbeat availability GET](https://betterstack.com/docs/uptime/api/get-a-heartbeats-availability-summary/)
4. [Create heartbeat POST](https://betterstack.com/docs/uptime/api/create-a-hearbeat/)
5. [Update heartbeat PATCH](https://betterstack.com/docs/uptime/api/update-existing-hearbeat/)
6. [Remove heartbeat DELETE](https://betterstack.com/docs/uptime/api/delete-existing-heartbeat/)
7. [Response attributes](https://betterstack.com/docs/uptime/api/heartbeats-api-response-params/)
2. [Heartbeat groups API](https://betterstack.com/docs/uptime/api/list-all-existing-heartbeat-groups/)
4. [On-call & incidents](https://betterstack.com/docs/uptime/api/on-call-calendar/)
5. [Status pages](https://betterstack.com/docs/uptime/api/list-all-existing-status-pages/)
6. [Metadata](https://betterstack.com/docs/uptime/api/metadata/)
7. [Integrations](https://betterstack.com/docs/uptime/api/list-all-new-relic-integrations/)
8. [Team members](https://betterstack.com/docs/uptime/api/team-members/list/)
Get a single heartbeat
======================
Returns a single heartbeat by ID.
GET https://uptime.betterstack.com/api/v2/heartbeats/{heartbeat\_id}
URL parameters
heartbeat\_id
required string
The ID of your requested heartbeat
Headers
Authorization
required string
Bearer `$TOKEN`
200
The requested heartbeat. The `status` attribute can have one of the following values:
`paused` - the heartbeat was paused
`pending` - the heartbeat was just created and is waiting for the first request
`up` - heartbeat received request on time
`down` - heartbeat did not receive a request on time
Response body
{
"data": {
"id": "12345",
"type": "heartbeat",
"attributes": {
"url": "https://uptime.betterstack.com/api/v1/heartbeat/abcd1234abcd1234abcd1234",
"name": "Testing heartbeat",
"period": 10800,
"grace": 300,
"call": false,
"sms": false,
"email": true,
"push": true,
"team_wait": 180,
"heartbeat_group_id": null,
"team_name": "Test team",
"sort_index": null,
"paused_at": null,
"maintenance_from": "01:02:00",
"maintenance_to": "03:04:00",
"maintenance_timezone": "Amsterdam",
"maintenance_days": [\
"mon",\
"tue",\
"wed",\
"thu",\
"fri",\
"sat",\
"sun"\
],
"created_at": "2020-05-05T11:41:49.327Z",
"updated_at": "2020-12-10T15:00:15.089Z",
"status": "up"
}
}
}
#### Example cURL
Example
Copied!
curl --request GET \
--url https://uptime.betterstack.com/api/v2/heartbeats/12345 \
--header "Authorization: Bearer $TOKEN"
#### Looking for the details of a specific parameter?
Explore [the list of all heartbeats API parameters](https://betterstack.com/docs/uptime/api/heartbeats-api-response-params/?utm_content=callout&utm_medium=docs-uptime&utm_source=community&utm_term=docs-uptime-api-getting-single-heartbeat)
* * *
[Previous article\
\
List heartbeats](https://betterstack.com/docs/uptime/api/list-all-existing-hearbeats/)
[Next article\
\
Get a heartbeat's availability summary](https://betterstack.com/docs/uptime/api/get-a-heartbeats-availability-summary/)
### Please accept cookies
We use cookies to authenticate users, improve the product user experience, and for [personalized ads](https://business.safety.google/privacy/)
. [Learn more.](https://betterstack.com/privacy)
Deny Accept required Accept all
---
# Better Stack Java logging | Better Stack Documentation
###### Explore documentation
* [Welcome to Telemetry 👋](https://betterstack.com/docs/logs/start/)
* [Quick start guide](https://betterstack.com/docs/logs/logging-start/)
* [Wide events vs. metrics](https://betterstack.com/docs/logs/wide-events-time-series/)
* [Ingesting data](https://betterstack.com/docs/logs/java/)
1. [Better Stack collector](https://betterstack.com/docs/logs/collector/)
2. [Vector](https://betterstack.com/docs/logs/vector/)
3. [OpenTelemetry](https://betterstack.com/docs/logs/open-telemetry/)
4. [Ingesting via HTTP API](https://betterstack.com/docs/logs/ingesting-data/http/logs/)
5. [Ingesting metrics](https://betterstack.com/docs/logs/ingesting-data/metrics/prometheus-scrape/)
6. [Ingesting logs](https://betterstack.com/docs/logs/ingesting-data/logs/docker-kubernetes/)
1. [Docker & Kubernetes](https://betterstack.com/docs/logs/docker/)
2. [Operating systems](https://betterstack.com/docs/logs/ubuntu/)
3. [Log forwarders](https://betterstack.com/docs/logs/metrics/vector/)
4. [Programming languages](https://betterstack.com/docs/logs/javascript/)
1. [JavaScript & Node.js](https://betterstack.com/docs/logs/javascript/)
2. [Python](https://betterstack.com/docs/logs/python/)
3. [Ruby](https://betterstack.com/docs/logs/ruby-and-rails/)
4. [PHP](https://betterstack.com/docs/logs/php/)
5. [Java](https://betterstack.com/docs/logs/java/)
6. [.NET](https://betterstack.com/docs/logs/net-c/)
7. [Go](https://betterstack.com/docs/logs/go/)
8. [Erlang](https://betterstack.com/docs/logs/erlang/)
5. [Cloud platforms](https://betterstack.com/docs/logs/aws/)
6. [Web servers & Load balancers](https://betterstack.com/docs/logs/nginx/)
7. [Databases & queues](https://betterstack.com/docs/logs/postgresql/)
8. [Storage](https://betterstack.com/docs/logs/minio/)
7. [Migrating to Better Stack](https://betterstack.com/docs/logs/datadog-agent/)
* [Using the product](https://betterstack.com/docs/logs/java/)
1. [AI SRE ↗](https://betterstack.com/demos/ai-sre/)
2. [MCP server ↗](https://betterstack.com/docs/getting-started/integrations/mcp/)
3. [Transforming ingested data](https://betterstack.com/docs/logs/using-logtail/transforming-ingested-data/logs-vrl/)
4. [Querying data](https://betterstack.com/docs/logs/using-logtail/live-tail-query-language/)
5. [Tracing](https://betterstack.com/docs/logs/tracing/)
6. [Alerts](https://betterstack.com/docs/logs/dashboards/alerts/)
* [Telemetry API](https://betterstack.com/docs/logs/java/)
1. [Getting an API token](https://betterstack.com/docs/logs/api/getting-started/)
2. [Sources & collectors](https://betterstack.com/docs/logs/api/list-all-existing-sources/)
3. [Dashboards](https://betterstack.com/docs/logs/api/dashboards/list/)
4. [Explorations](https://betterstack.com/docs/logs/api/explorations/list/)
5. [Alerts API](https://betterstack.com/docs/logs/api/alerts/list/)
6. [Connections API](https://betterstack.com/docs/logs/api/connections/list/)
7. [Query API ↗](https://betterstack.com/docs/logs/query-api/connect-remotely/)
* [Alternative to](https://betterstack.com/docs/logs/java/)
1. [Lightstep](https://betterstack.com/docs/logs/alternative-to/lightstep/)
Better Stack Java logging
=========================
Start logging in 5 minutes
--------------------------
Collect logs from your Java applications using [Logback](https://logback.qos.ch/)
.
### 1\. Dependencies
Add Better Stack Logback appender to your `pom.xml` or `build.gradle` file:
Maven (pom.xml) Gradle (build.gradle)
Copied!
com.logtail
logback-logtail
0.3.3
dependencies {
// ...existing dependencies...
implementation 'com.logtail:logback-logtail:0.3.3'
}
You will need a Logback logger with a data-binding package for Jackson.
**Don't have Logback in your project yet?**
Add these dependencies to your `pom.xml` or `build.gradle` file:
Maven (pom.xml) Gradle (build.gradle)
Copied!
ch.qos.logback
logback-classic
1.2.11
ch.qos.logback
logback-core
1.2.11
com.fasterxml.jackson.core
jackson-databind
2.13.5
org.slf4j
slf4j-api
1.7.7
dependencies {
// ...existing dependencies...
implementation 'ch.qos.logback:logback-classic:1.2.11'
implementation 'ch.qos.logback:logback-core:1.2.11'
implementation 'com.fasterxml.jackson.core:jackson-databind:2.13.5'
implementation 'org.slf4j:slf4j-api:1.7.7'
}
### 2\. Setup
Set up log appenders in your `logback.xml` configuration:
Logback config
Copied!
MyApp
$SOURCE_TOKEN
https://$INGESTING_HOST
requestId,requestTime
string,int
%d{yyyy-MM-dd HH:mm:ss.SSS} %-5level %msg%n
### 3\. Start logging 🎉
Import and use the logger:
Send logs to Logtail
Copied!
import org.slf4j.Logger;
import org.slf4j.LoggerFactory;
public class App {
public static void main(String[] args) {
Logger logger = LoggerFactory.getLogger(App.class);
logger.error("Something bad happened.");
String json = "{ \"item\": \"Orange soda\", \"price\": 100.00 }";
logger.info("Log message with structured logging " + json);
}
}
You should see your logs in [Better Stack → Live tail](https://telemetry.betterstack.com/team/0/tail)
.
Find structured data under the `message_json` field.
Better Stack parses any JSON at the end of the log line.
Need help?
----------
Please let us know at [hello@betterstack.com](mailto:hello@betterstack.com)
.
We're happy to help! 🙏
Additional information
----------------------
* **New to logging in Java?** Check out our [Intro guide to logging in Java](https://betterstack.com/community/guides/logging/how-to-start-logging-with-java/)
.
* **Want to support more data types?** Install an add-on module for Jackson and register it in the Logtail appender's `` tag. For example, see [adding JavaTimeModule on Github](https://github.com/logtail/logback-logtail/pull/21/files)
.
* **Need to fine-tune logging?** Configure more options inside `` tag in `logback.xml`:
* `appName` - Application name for Better Stack indexation.
* `sourceToken` - Your Better Stack source token.
* `ingestUrl` - The ingesting URL of your source. Default: `https://in.logs.betterstack.com`. Use the ingesting host listed in your source settings.
* `mdcFields` - MDC fields that will be sent as metadata, separated by a comma.
* `mdcTypes` - MDC fields types that will be sent as metadata, in the same order as `mdcFields` are set up, separated by a comma. Possible values are `string`, `boolean`, `int`, and `long`.
* `maxQueueSize` - Maximum number of messages in the queue. Messages over the limit will be dropped. Default: 100000.
* `batchSize` - Batch size for the number of messages to be sent via the API. Default: 1000.
* `batchInterval` - Maximum wait time for a batch to be sent via the API, in milliseconds. Default: 3000.
* `setConnectTimeout` - Connection timeout of the underlying HTTP client, in milliseconds. Default: 5000.
* `readTimeout` - Read timeout of the underlying HTTP client, in milliseconds. Default: 10000.
* `maxRetries` - Maximum number of retries for sending logs to Better Stack. After that, current batch of logs will be dropped. Default: 5.
* `retrySleepMilliseconds` - Number of milliseconds to sleep before retrying to send logs to Better Stack. Default: 300.
* `objectMapperModule` - Registers an add-on data type module for Jackson to serialize logged data, e.g. `com.fasterxml.jackson.datatype.jsr310.JavaTimeModule`. Can be used multiple times.
### Example project
Want to try a more detailed example with Maven or Gradle?
See our [Java Logtail example projects on GitHub](https://github.com/logtail/logback-logtail/tree/master/examples)
.
* * *
[Previous article\
\
Better Stack PHP logging](https://betterstack.com/docs/logs/php/)
[Next article\
\
Better Stack .NET logging](https://betterstack.com/docs/logs/net-c/)
###### On this page
* [Start logging in 5 minutes](https://betterstack.com/docs/logs/java/#start-logging-in-5-minutes)
* [Need help?](https://betterstack.com/docs/logs/java/#need-help)
* [Additional information](https://betterstack.com/docs/logs/java/#additional-information)
### Please accept cookies
We use cookies to authenticate users, improve the product user experience, and for [personalized ads](https://business.safety.google/privacy/)
. [Learn more.](https://betterstack.com/privacy)
Deny Accept required Accept all
---
# Create incidents manually | Better Stack Documentation
###### Explore documentation
* [Welcome to Uptime 👋](https://betterstack.com/docs/uptime/start/)
* [Frequently Asked Questions](https://betterstack.com/docs/uptime/frequently-asked-questions/)
* [On-call scheduling and alerting](https://betterstack.com/docs/uptime/creating-incidents-manually/)
1. [Get started](https://betterstack.com/docs/uptime/getting-started-with-oncall-v2/)
2. [Slack and other integrations ↗](https://betterstack.com/docs/uptime/slack/)
3. [Connecting external calendars](https://betterstack.com/docs/uptime/connecting-external-calendars/)
4. [Advanced guide](https://betterstack.com/docs/uptime/escalation-policies/)
* [Incidents](https://betterstack.com/docs/uptime/creating-incidents-manually/)
1. [Get started](https://betterstack.com/docs/uptime/working-with-incidents/)
1. [Acknowledging an incident](https://betterstack.com/docs/uptime/acknowledging-an-incident/)
2. [Resolving an incident](https://betterstack.com/docs/uptime/resolving-an-incident/)
3. [Incident details](https://betterstack.com/docs/uptime/incident-details/)
4. [Commenting on incidents](https://betterstack.com/docs/uptime/commenting-on-incidents/)
5. [Incident grouping](https://betterstack.com/docs/uptime/incident-grouping/)
6. [Create incidents manually](https://betterstack.com/docs/uptime/creating-incidents-manually/)
2. [Advanced guide](https://betterstack.com/docs/uptime/post-mortems/)
3. [Reporting ↗](https://betterstack.com/docs/getting-started/team-and-account-management/reporting/)
* [Monitoring](https://betterstack.com/docs/uptime/creating-incidents-manually/)
1. [Get started](https://betterstack.com/docs/uptime/monitoring-start/)
2. [Working with monitors](https://betterstack.com/docs/uptime/bulk-importing-monitors/)
3. [Customizing monitors](https://betterstack.com/docs/uptime/naming-monitors/)
4. [Monitor types](https://betterstack.com/docs/uptime/uptime-monitor/)
* [Status pages](https://betterstack.com/docs/uptime/creating-incidents-manually/)
1. [Get started](https://betterstack.com/docs/uptime/getting-started-with-status-pages/)
2. [Advanced guide](https://betterstack.com/docs/uptime/custom-subdomain/)
* [Uptime API](https://betterstack.com/docs/uptime/creating-incidents-manually/)
1. [Getting an API token](https://betterstack.com/docs/uptime/api/getting-started-with-uptime-api/)
2. [Monitors](https://betterstack.com/docs/uptime/api/list-all-existing-monitors/)
3. [Heartbeats](https://betterstack.com/docs/uptime/api/list-all-existing-hearbeats/)
4. [On-call & incidents](https://betterstack.com/docs/uptime/api/on-call-calendar/)
5. [Status pages](https://betterstack.com/docs/uptime/api/list-all-existing-status-pages/)
6. [Metadata](https://betterstack.com/docs/uptime/api/metadata/)
7. [Integrations](https://betterstack.com/docs/uptime/api/list-all-new-relic-integrations/)
8. [Team members](https://betterstack.com/docs/uptime/api/team-members/list/)
Create incidents manually
=========================
Manual incidents are great for reporting time-sensitive issues that your monitors won't catch — like "The site is up, but payments are failing." They're typically reported by colleagues in non-technical roles who spot a problem before any alert fires.
From the incidents dashboard
----------------------------
1. Go to [Better Stack](https://uptime.betterstack.com/)
→ **Incidents**.
2. Click **Report a new incident** in the upper-right corner.
3. Describe the issue and optionally attach screenshots or files.
4. Select who should get notified.
5. Click **Create new incident**.
Via a shareable URL
-------------------
To let colleagues who don't have a Better Stack account report incidents, share your secret incident form URL. Anyone with the link can submit an incident without signing in.
1. Go to [Better Stack](https://uptime.betterstack.com/)
→ **Incidents**.
2. Click **Report a new incident**.
3. Copy the URL shown at the top of the page.
4. Share it in your company's Slack or internal wiki.
Using an escalation policy
--------------------------
Escalation policies give you a dedicated incident form with predefined escalation steps. Reporters only describe the issue — no need to choose who gets notified. This is especially useful when different teams own different services: each team gets their own policy and form, so incidents always reach the right people automatically.
With [metadata-based routing](https://betterstack.com/docs/uptime/escalation-policies/#metadata-based-rules)
, you can go further. Add metadata fields to your policy — such as **Service** or **Environment** — and route incidents to different responders based on the values filled in. A production database incident can page the on-call engineer, while a staging incident only sends an email.
1. Go to [Better Stack](https://uptime.betterstack.com/)
→ **Escalation policies** → **Add escalation policy**.
2. Configure the escalation steps and, optionally, add metadata fields and routing rules.
3. Save the policy.
4. Click **Report a new incident** on the policy page to open or share the policy-specific form.
The form skips the notification channel step entirely — escalation is handled by the policy. If you added metadata fields, reporters fill those in instead.
From Slack
----------
Use the `/incident` slash command in any Slack channel connected to Better Stack:
Slack
Copied!
/incident New users can't sign up
A modal opens with **Brief description**, **In-depth description**, and **Who should we notify?** fields. Click **Report incident** to submit.
Add metadata to incidents
-------------------------
Metadata lets you attach key-value information to an incident — such as **Service**, **Environment**, or **Team**. Use it to route incidents to the right responders, filter the incidents list, and control the status of of status page resources.
Metadata fields are configured per Slack integration or escalation policy. See [Metadata-based routing](https://betterstack.com/docs/uptime/escalation-policies/#metadata-based-rules)
for setup instructions.
**In the incident form:** Metadata fields appear at the bottom of the form when your team has them configured. Fill them in before submitting.
**In Slack:** Metadata works the same way. After selecting a team or escalation policy in the **Who should we notify?** dropdown, any configured metadata fields appear in the modal automatically.
Using the API
-------------
Use `POST /api/v3/incidents` to create incidents programmatically. See the [full API reference](https://betterstack.com/docs/uptime/api/create-a-new-incident/)
for all available attributes.
Create an incident with metadata
Copied!
curl --request POST \
--url https://uptime.betterstack.com/api/v3/incidents \
--header "Authorization: Bearer $TOKEN" \
--header "Content-Type: application/json" \
--data '{
"summary": "Users can'\''t sign up",
"requester_email": "alice@example.com",
"description": "500 errors on the login page since 14:30 UTC.",
"metadata": {
"Service": [{ "value": "Payments" }],
"Environment": [{ "value": "Production" }]
}
}'
**Required attributes**
* `summary` — Brief description of the incident.
* `requester_email` — Email of the person reporting.
**Optional attributes**
* `description` — In-depth description.
* `call`, `sms`, `email`, `push` — Notification channels (`true` or `false`).
* `team_wait` — Seconds to wait before alerting the entire team. Default is `180`. Set to `null` to never alert the entire team.
* `policy_id` — ID of the escalation policy to use.
* `metadata` — Key-value pairs to attach to the incident.
Other ways to trigger incidents
-------------------------------
### Email integration
Send an email to your integration's unique inbox address and Better Stack creates an incident automatically. This is useful for monitoring tools or services that send email alerts and need to page your on-call team.
See [Email integration](https://betterstack.com/docs/uptime/integrating-with-better-uptime/incoming-emails/)
for setup instructions.
### Incoming webhooks
POST a payload to your webhook's unique URL and Better Stack creates an incident based on your configured rules. This is useful for connecting custom systems or third-party tools that support outbound webhooks.
See [Incoming webhooks](https://betterstack.com/docs/uptime/incoming-webhooks/)
for setup instructions.
### Call routing
Provision a phone number and anyone who calls it immediately triggers an incident. Better Stack then routes the call to your on-call team. This is useful for non-technical colleagues who need a simple way to escalate urgent issues.
See [Call routing](https://betterstack.com/docs/uptime/on-call-routing-number/)
for setup instructions.
* * *
[Previous article\
\
Incident grouping](https://betterstack.com/docs/uptime/incident-grouping/)
[Next article\
\
Post mortems](https://betterstack.com/docs/uptime/post-mortems/)
###### On this page
* [From the incidents dashboard](https://betterstack.com/docs/uptime/creating-incidents-manually/#from-the-incidents-dashboard)
* [Via a shareable URL](https://betterstack.com/docs/uptime/creating-incidents-manually/#via-a-shareable-url)
* [Using an escalation policy](https://betterstack.com/docs/uptime/creating-incidents-manually/#using-an-escalation-policy)
* [From Slack](https://betterstack.com/docs/uptime/creating-incidents-manually/#from-slack)
* [Add metadata to incidents](https://betterstack.com/docs/uptime/creating-incidents-manually/#add-metadata-to-incidents)
* [Using the API](https://betterstack.com/docs/uptime/creating-incidents-manually/#using-the-api)
* [Other ways to trigger incidents](https://betterstack.com/docs/uptime/creating-incidents-manually/#other-ways-to-trigger-incidents)
### Please accept cookies
We use cookies to authenticate users, improve the product user experience, and for [personalized ads](https://business.safety.google/privacy/)
. [Learn more.](https://betterstack.com/privacy)
Deny Accept required Accept all
---
# Get monitor | Better Stack Documentation
###### Explore documentation
* [Welcome to Uptime 👋](https://betterstack.com/docs/uptime/start/)
* [Frequently Asked Questions](https://betterstack.com/docs/uptime/frequently-asked-questions/)
* [On-call scheduling and alerting](https://betterstack.com/docs/uptime/api/get-a-single-monitor/)
1. [Get started](https://betterstack.com/docs/uptime/getting-started-with-oncall-v2/)
2. [Slack and other integrations ↗](https://betterstack.com/docs/uptime/slack/)
3. [Connecting external calendars](https://betterstack.com/docs/uptime/connecting-external-calendars/)
4. [Advanced guide](https://betterstack.com/docs/uptime/escalation-policies/)
* [Incidents](https://betterstack.com/docs/uptime/api/get-a-single-monitor/)
1. [Get started](https://betterstack.com/docs/uptime/working-with-incidents/)
2. [Advanced guide](https://betterstack.com/docs/uptime/post-mortems/)
3. [Reporting ↗](https://betterstack.com/docs/getting-started/team-and-account-management/reporting/)
* [Monitoring](https://betterstack.com/docs/uptime/api/get-a-single-monitor/)
1. [Get started](https://betterstack.com/docs/uptime/monitoring-start/)
2. [Working with monitors](https://betterstack.com/docs/uptime/bulk-importing-monitors/)
3. [Customizing monitors](https://betterstack.com/docs/uptime/naming-monitors/)
4. [Monitor types](https://betterstack.com/docs/uptime/uptime-monitor/)
* [Status pages](https://betterstack.com/docs/uptime/api/get-a-single-monitor/)
1. [Get started](https://betterstack.com/docs/uptime/getting-started-with-status-pages/)
2. [Advanced guide](https://betterstack.com/docs/uptime/custom-subdomain/)
* [Uptime API](https://betterstack.com/docs/uptime/api/get-a-single-monitor/)
1. [Getting an API token](https://betterstack.com/docs/uptime/api/getting-started-with-uptime-api/)
2. [Monitors](https://betterstack.com/docs/uptime/api/list-all-existing-monitors/)
1. [Monitors API](https://betterstack.com/docs/uptime/api/list-all-existing-monitors/)
1. [List monitors GET](https://betterstack.com/docs/uptime/api/list-all-existing-monitors/)
2. [Get monitor GET](https://betterstack.com/docs/uptime/api/get-a-single-monitor/)
3. [Monitor response times GET](https://betterstack.com/docs/uptime/api/get-monitors-response-times/)
4. [Monitor availability GET](https://betterstack.com/docs/uptime/api/get-a-monitors-availability-summary/)
5. [Create monitor POST](https://betterstack.com/docs/uptime/api/create-a-new-monitor/)
6. [Update monitor PATCH](https://betterstack.com/docs/uptime/api/update-an-existing-monitor/)
7. [Remove monitor DELETE](https://betterstack.com/docs/uptime/api/delete-an-existing-monitor/)
8. [Response attributes](https://betterstack.com/docs/uptime/api/monitors-api-response-params/)
2. [Monitor groups API](https://betterstack.com/docs/uptime/api/list-all-existing-monitor-groups/)
3. [Heartbeats](https://betterstack.com/docs/uptime/api/list-all-existing-hearbeats/)
4. [On-call & incidents](https://betterstack.com/docs/uptime/api/on-call-calendar/)
5. [Status pages](https://betterstack.com/docs/uptime/api/list-all-existing-status-pages/)
6. [Metadata](https://betterstack.com/docs/uptime/api/metadata/)
7. [Integrations](https://betterstack.com/docs/uptime/api/list-all-new-relic-integrations/)
8. [Team members](https://betterstack.com/docs/uptime/api/team-members/list/)
Get monitor
===========
Returns a single monitor.
GET https://uptime.betterstack.com/api/v2/monitors/{monitor\_id}
URL parameters
monitor\_id
required string
The ID of the monitor you want to get
Headers
Authorization
required string
Bearer `$TOKEN`
200
Returns a single monitor.
The status attribute can have one of the following values:
`paused` - the monitor was paused
`pending` - the monitor was just created and it's waiting for the first check
`maintenance` - the monitor is paused because it is currently in its maintenance period
`up` - checks are passing
`validating` - service seems to be back up, but the recovery\_period since the last failed check still hasn't passed
`down` - checks are failing
If an escalation policy is set (policy\_id) then the simple escalation policy settings (call, sms, email, push) are ignored.
Response body
{
"data": {
"id": "123456789",
"type": "monitor",
"attributes": {
"url": "https://uptime.betterstack.com",
"pronounceable_name": "Uptime homepage",
"monitor_type": "keyword",
"monitor_group_id": "12345",
"last_checked_at": "2020-09-01T14:17:46.000Z",
"status": "up",
"policy_id": null,
"expiration_policy_id": null,
"team_name": "Test team",
"required_keyword": "We call you",
"verify_ssl": true,
"check_frequency": 30,
"call": true,
"sms": true,
"email": true,
"push": true,
"team_wait": null,
"http_method": "get",
"request_timeout": 15,
"recovery_period": 0,
"request_headers": [\
{\
"id": "123",\
"name": "Content-Type",\
"value": "application/xml"\
}\
],
"request_body": "",
"paused_at": null,
"created_at": "2020-02-18T13:38:16.586Z",
"updated_at": "2020-09-08T13:10:20.202Z",
"ssl_expiration": 7,
"domain_expiration": 14,
"regions": [\
"us",\
"eu",\
"as",\
"au"\
],
"maintenance_from": "01:02:00",
"maintenance_to": "03:04:00",
"maintenance_timezone": "Amsterdam",
"maintenance_days": [\
"mon",\
"tue",\
"wed",\
"thu",\
"fri",\
"sat",\
"sun"\
],
"port": null,
"confirmation_period": 120,
"expected_status_codes": [],
"environment_variables": {}
}
}
}
404
Response body
{
"errors": "Resource with provided ID was not found"
}
#### Example cURL
Example
Copied!
curl --request GET \
--url https://uptime.betterstack.com/api/v2/monitors/123456789 \
--header "Authorization: Bearer $TOKEN"
#### Looking for the details of a specific parameter?
Explore [the list of all monitor API parameters](https://betterstack.com/docs/uptime/api/monitors-api-response-params/?utm_content=callout&utm_medium=docs-uptime&utm_source=community&utm_term=docs-uptime-api-get-single-monitor)
* * *
[Previous article\
\
List monitors](https://betterstack.com/docs/uptime/api/list-all-existing-monitors/)
[Next article\
\
Monitor response times](https://betterstack.com/docs/uptime/api/get-monitors-response-times/)
### Please accept cookies
We use cookies to authenticate users, improve the product user experience, and for [personalized ads](https://business.safety.google/privacy/)
. [Learn more.](https://betterstack.com/privacy)
Deny Accept required Accept all
---
# Remove Datadog integration | Better Stack Documentation
###### Explore documentation
* [Welcome to Uptime 👋](https://betterstack.com/docs/uptime/start/)
* [Frequently Asked Questions](https://betterstack.com/docs/uptime/frequently-asked-questions/)
* [On-call scheduling and alerting](https://betterstack.com/docs/uptime/api/delete-datadog-integration/)
1. [Get started](https://betterstack.com/docs/uptime/getting-started-with-oncall-v2/)
2. [Slack and other integrations ↗](https://betterstack.com/docs/uptime/slack/)
3. [Connecting external calendars](https://betterstack.com/docs/uptime/connecting-external-calendars/)
4. [Advanced guide](https://betterstack.com/docs/uptime/escalation-policies/)
* [Incidents](https://betterstack.com/docs/uptime/api/delete-datadog-integration/)
1. [Get started](https://betterstack.com/docs/uptime/working-with-incidents/)
2. [Advanced guide](https://betterstack.com/docs/uptime/post-mortems/)
3. [Reporting ↗](https://betterstack.com/docs/getting-started/team-and-account-management/reporting/)
* [Monitoring](https://betterstack.com/docs/uptime/api/delete-datadog-integration/)
1. [Get started](https://betterstack.com/docs/uptime/monitoring-start/)
2. [Working with monitors](https://betterstack.com/docs/uptime/bulk-importing-monitors/)
3. [Customizing monitors](https://betterstack.com/docs/uptime/naming-monitors/)
4. [Monitor types](https://betterstack.com/docs/uptime/uptime-monitor/)
* [Status pages](https://betterstack.com/docs/uptime/api/delete-datadog-integration/)
1. [Get started](https://betterstack.com/docs/uptime/getting-started-with-status-pages/)
2. [Advanced guide](https://betterstack.com/docs/uptime/custom-subdomain/)
* [Uptime API](https://betterstack.com/docs/uptime/api/delete-datadog-integration/)
1. [Getting an API token](https://betterstack.com/docs/uptime/api/getting-started-with-uptime-api/)
2. [Monitors](https://betterstack.com/docs/uptime/api/list-all-existing-monitors/)
3. [Heartbeats](https://betterstack.com/docs/uptime/api/list-all-existing-hearbeats/)
4. [On-call & incidents](https://betterstack.com/docs/uptime/api/on-call-calendar/)
5. [Status pages](https://betterstack.com/docs/uptime/api/list-all-existing-status-pages/)
6. [Metadata](https://betterstack.com/docs/uptime/api/metadata/)
7. [Integrations](https://betterstack.com/docs/uptime/api/list-all-new-relic-integrations/)
1. [New Relic](https://betterstack.com/docs/uptime/api/list-all-new-relic-integrations/)
2. [Datadog](https://betterstack.com/docs/uptime/api/list-all-datadog-integrations/)
1. [List Datadog integrations GET](https://betterstack.com/docs/uptime/api/list-all-datadog-integrations/)
2. [Get Datadog integration GET](https://betterstack.com/docs/uptime/api/single-datadog-integration/)
3. [Create Datadog integration POST](https://betterstack.com/docs/uptime/api/create-datadog-integration/)
4. [Update Datadog integration PATCH](https://betterstack.com/docs/uptime/api/update-datadog-integration/)
5. [Remove Datadog integration DELETE](https://betterstack.com/docs/uptime/api/delete-datadog-integration/)
6. [Response attributes](https://betterstack.com/docs/uptime/api/datadog-integrations-response-params/)
3. [AWS CloudWatch](https://betterstack.com/docs/uptime/api/list-all-aws-cloudwatch-integrations/)
4. [Microsoft Azure](https://betterstack.com/docs/uptime/api/list-all-azure-integrations/)
5. [Google Monitoring](https://betterstack.com/docs/uptime/api/list-all-google-monitoring-integrations/)
6. [Grafana](https://betterstack.com/docs/uptime/api/list-all-grafana-integrations/)
7. [Elastic](https://betterstack.com/docs/uptime/api/list-all-elastic-integrations/)
8. [Prometheus](https://betterstack.com/docs/uptime/api/list-all-prometheus-integrations/)
9. [Email](https://betterstack.com/docs/uptime/api/list-all-email-integrations/)
10. [Incoming webhooks](https://betterstack.com/docs/uptime/api/list-all-incoming-webhooks/)
11. [Atlassian Jira](https://betterstack.com/docs/uptime/api/list-all-jira-integrations/)
12. [Slack](https://betterstack.com/docs/uptime/api/list-all-slack-integrations/)
13. [Outgoing webhooks](https://betterstack.com/docs/uptime/api/list-all-outgoing-webhook-integrations/)
14. [Splunk On-Call](https://betterstack.com/docs/uptime/api/list-all-splunk-on-call-integrations/)
15. [PagerDuty](https://betterstack.com/docs/uptime/api/list-all-pagerduty-integrations/)
16. [Catalog](https://betterstack.com/docs/uptime/api/catalog-integrations-relations/)
8. [Team members](https://betterstack.com/docs/uptime/api/team-members/list/)
Remove Datadog integration
==========================
Permanently deletes an existing Datadog integration.
DELETE https://uptime.betterstack.com/api/v2/datadog-integrations/{datadog\_integration\_id}
URL parameters
datadog\_integration\_id
required string
The ID of the Datadog integration you want to delete
Headers
Authorization
required string
Bearer `$TOKEN`
204
Returns empty body
#### Example cURL
Example
Copied!
curl --request DELETE \
--url https://uptime.betterstack.com/api/v2/datadog-integrations/37 \
--header "Authorization: Bearer $TOKEN"
#### Looking for the details of a specific parameter?
Explore [the list of all Datadog integration API parameters](https://betterstack.com/docs/uptime/api/datadog-integrations-response-params/?utm_content=callout&utm_medium=docs-uptime&utm_source=community&utm_term=docs-uptime-api-delete-datadog-integration)
* * *
[Previous article\
\
Update Datadog integration](https://betterstack.com/docs/uptime/api/update-datadog-integration/)
[Next article\
\
Response attributes](https://betterstack.com/docs/uptime/api/datadog-integrations-response-params/)
### Please accept cookies
We use cookies to authenticate users, improve the product user experience, and for [personalized ads](https://business.safety.google/privacy/)
. [Learn more.](https://betterstack.com/privacy)
Deny Accept required Accept all
---
# Remove a source group | Better Stack Documentation
###### Explore documentation
* [Welcome to Telemetry 👋](https://betterstack.com/docs/logs/start/)
* [Quick start guide](https://betterstack.com/docs/logs/logging-start/)
* [Wide events vs. metrics](https://betterstack.com/docs/logs/wide-events-time-series/)
* [Ingesting data](https://betterstack.com/docs/logs/api/deleting-an-existing-source-group/)
1. [Better Stack collector](https://betterstack.com/docs/logs/collector/)
2. [Vector](https://betterstack.com/docs/logs/vector/)
3. [OpenTelemetry](https://betterstack.com/docs/logs/open-telemetry/)
4. [Ingesting via HTTP API](https://betterstack.com/docs/logs/ingesting-data/http/logs/)
5. [Ingesting metrics](https://betterstack.com/docs/logs/ingesting-data/metrics/prometheus-scrape/)
6. [Ingesting logs](https://betterstack.com/docs/logs/ingesting-data/logs/docker-kubernetes/)
7. [Migrating to Better Stack](https://betterstack.com/docs/logs/datadog-agent/)
* [Using the product](https://betterstack.com/docs/logs/api/deleting-an-existing-source-group/)
1. [AI SRE ↗](https://betterstack.com/demos/ai-sre/)
2. [MCP server ↗](https://betterstack.com/docs/getting-started/integrations/mcp/)
3. [Transforming ingested data](https://betterstack.com/docs/logs/using-logtail/transforming-ingested-data/logs-vrl/)
4. [Querying data](https://betterstack.com/docs/logs/using-logtail/live-tail-query-language/)
5. [Tracing](https://betterstack.com/docs/logs/tracing/)
6. [Alerts](https://betterstack.com/docs/logs/dashboards/alerts/)
* [Telemetry API](https://betterstack.com/docs/logs/api/deleting-an-existing-source-group/)
1. [Getting an API token](https://betterstack.com/docs/logs/api/getting-started/)
2. [Sources & collectors](https://betterstack.com/docs/logs/api/list-all-existing-sources/)
1. [Sources API](https://betterstack.com/docs/logs/api/list-all-existing-sources/)
2. [Collectors API](https://betterstack.com/docs/logs/api/list-all-collectors/)
3. [Metrics API](https://betterstack.com/docs/logs/api/list-all-existing-metrics/)
4. [Source groups API](https://betterstack.com/docs/logs/api/list-all-existing-source-groups/)
1. [List all source groups GET](https://betterstack.com/docs/logs/api/list-all-existing-source-groups/)
2. [Get a single source group GET](https://betterstack.com/docs/logs/api/getting-a-single-source-group/)
3. [List sources in group GET](https://betterstack.com/docs/logs/api/listing-sources-in-source-group/)
4. [Create a source group GET](https://betterstack.com/docs/logs/api/create-a-source-group/)
5. [Update a source group PATCH](https://betterstack.com/docs/logs/api/updating-a-source-group/)
6. [Remove a source group DELETE](https://betterstack.com/docs/logs/api/deleting-an-existing-source-group/)
3. [Dashboards](https://betterstack.com/docs/logs/api/dashboards/list/)
4. [Explorations](https://betterstack.com/docs/logs/api/explorations/list/)
5. [Alerts API](https://betterstack.com/docs/logs/api/alerts/list/)
6. [Connections API](https://betterstack.com/docs/logs/api/connections/list/)
7. [Query API ↗](https://betterstack.com/docs/logs/query-api/connect-remotely/)
* [Alternative to](https://betterstack.com/docs/logs/api/deleting-an-existing-source-group/)
1. [Lightstep](https://betterstack.com/docs/logs/alternative-to/lightstep/)
Remove a source group
=====================
Permanently deletes an existing source group.
DELETE https://telemetry.betterstack.com/api/v1/source-groups/{source\_group\_id}
URL parameters
id
required string
ID of the source group you want to delete
Headers
Authorization
required string
Bearer `$TOKEN`
204
The source group was deleted.
404
Your team has no source group with the given ID
Response body
{
"errors": "Resource with provided ID was not found"
}
#### Example cURL
Example
Copied!
curl --request DELETE \
--url https://telemetry.betterstack.com/api/v1/source-groups/123 \
--header "Authorization: Bearer $TOKEN"
* * *
[Previous article\
\
Update a source group](https://betterstack.com/docs/logs/api/updating-a-source-group/)
[Next article\
\
List all dashboards](https://betterstack.com/docs/logs/api/dashboards/list/)
### Please accept cookies
We use cookies to authenticate users, improve the product user experience, and for [personalized ads](https://business.safety.google/privacy/)
. [Learn more.](https://betterstack.com/privacy)
Deny Accept required Accept all
---
# Widget types | Better Stack Documentation
###### Explore documentation
* [Welcome to Uptime 👋](https://betterstack.com/docs/uptime/start/)
* [Frequently Asked Questions](https://betterstack.com/docs/uptime/frequently-asked-questions/)
* [On-call scheduling and alerting](https://betterstack.com/docs/uptime/working-with-status-pages/widget-types/)
1. [Get started](https://betterstack.com/docs/uptime/getting-started-with-oncall-v2/)
2. [Slack and other integrations ↗](https://betterstack.com/docs/uptime/slack/)
3. [Connecting external calendars](https://betterstack.com/docs/uptime/connecting-external-calendars/)
4. [Advanced guide](https://betterstack.com/docs/uptime/escalation-policies/)
* [Incidents](https://betterstack.com/docs/uptime/working-with-status-pages/widget-types/)
1. [Get started](https://betterstack.com/docs/uptime/working-with-incidents/)
2. [Advanced guide](https://betterstack.com/docs/uptime/post-mortems/)
3. [Reporting ↗](https://betterstack.com/docs/getting-started/team-and-account-management/reporting/)
* [Monitoring](https://betterstack.com/docs/uptime/working-with-status-pages/widget-types/)
1. [Get started](https://betterstack.com/docs/uptime/monitoring-start/)
2. [Working with monitors](https://betterstack.com/docs/uptime/bulk-importing-monitors/)
3. [Customizing monitors](https://betterstack.com/docs/uptime/naming-monitors/)
4. [Monitor types](https://betterstack.com/docs/uptime/uptime-monitor/)
* [Status pages](https://betterstack.com/docs/uptime/working-with-status-pages/widget-types/)
1. [Get started](https://betterstack.com/docs/uptime/getting-started-with-status-pages/)
2. [Advanced guide](https://betterstack.com/docs/uptime/custom-subdomain/)
1. [Custom subdomain: status.yourdomain.com](https://betterstack.com/docs/uptime/custom-subdomain/)
2. [Customize status page with CSS and JavaScript](https://betterstack.com/docs/uptime/working-with-status-pages/customize-status-page-css-js/)
3. [Password, IP allowlist, and SSO protection](https://betterstack.com/docs/uptime/password-protected-status-page/)
4. [Status page updates](https://betterstack.com/docs/uptime/creating-status-report-and-status-update/)
5. [Manually tracked item](https://betterstack.com/docs/uptime/working-with-status-pages/manually-tracked-item/)
6. [Status announcement](https://betterstack.com/docs/uptime/embedding-announcements-into-your-site/)
7. [Embeddable status badge](https://betterstack.com/docs/uptime/working-with-status-pages/embeddable-status-badge/)
8. [Widget types](https://betterstack.com/docs/uptime/working-with-status-pages/widget-types/)
9. [Subscribing to status pages](https://betterstack.com/docs/uptime/subscribing-to-status-updates/)
* [Uptime API](https://betterstack.com/docs/uptime/working-with-status-pages/widget-types/)
1. [Getting an API token](https://betterstack.com/docs/uptime/api/getting-started-with-uptime-api/)
2. [Monitors](https://betterstack.com/docs/uptime/api/list-all-existing-monitors/)
3. [Heartbeats](https://betterstack.com/docs/uptime/api/list-all-existing-hearbeats/)
4. [On-call & incidents](https://betterstack.com/docs/uptime/api/on-call-calendar/)
5. [Status pages](https://betterstack.com/docs/uptime/api/list-all-existing-status-pages/)
6. [Metadata](https://betterstack.com/docs/uptime/api/metadata/)
7. [Integrations](https://betterstack.com/docs/uptime/api/list-all-new-relic-integrations/)
8. [Team members](https://betterstack.com/docs/uptime/api/team-members/list/)
Widget types
============
Status pages use widgets to display the health and performance of your services. You can choose from several widget types to provide different levels of detail, from a simple status indicator to detailed performance charts.
How to change a widget type
---------------------------
1. Go to **[Status pages](https://uptime.betterstack.com/team/0/status-pages)
** and select the status page you want to edit.
2. Click the **Structure** tab.
3. Expand the resource you want to change or add a new one.
4. Choose a new widget from the **Widget type** dropdown menu.
5. Click **Save changes**.
Available widget types
----------------------
Some advanced widget types are only available for status pages using the **Modern** design. To change the design, go to **[Status pages](https://uptime.betterstack.com/team/0/status-pages?utm_content=callout&utm_medium=docs-uptime&utm_source=community&utm_term=widget-types)
**, select your page, and find the option in the **Settings** tab.
### Current status only
The `plain` widget is the simplest option. It displays only the current operational status of a resource (e.g., "Operational", "Degraded", "Downtime"). It's ideal for a clean overview when you want to minimize visual clutter.

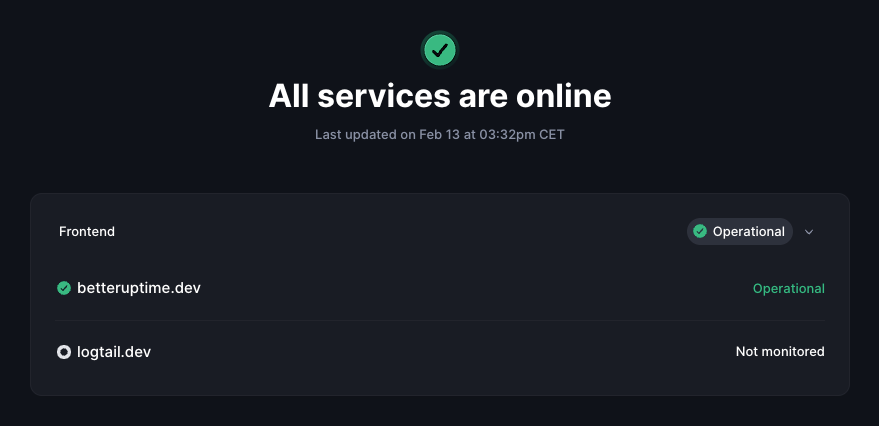
### Historical status
The `history` widget shows the current status along with a visual history of its uptime over a set period (from 7 to 365 days). This gives visitors a quick glance at recent reliability.

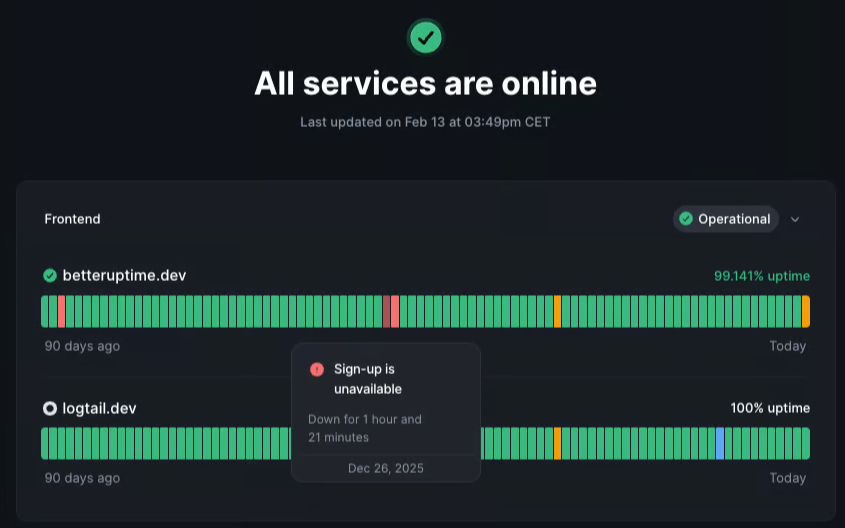
### Intraday historical status
The `intraday_history` widget provides a more detailed view of the resource's uptime history (from 7 to 365 days). It visualizes the proportions of downtime, degraded performance, and maintenance for each day, making even brief service disruptions clearly visible.

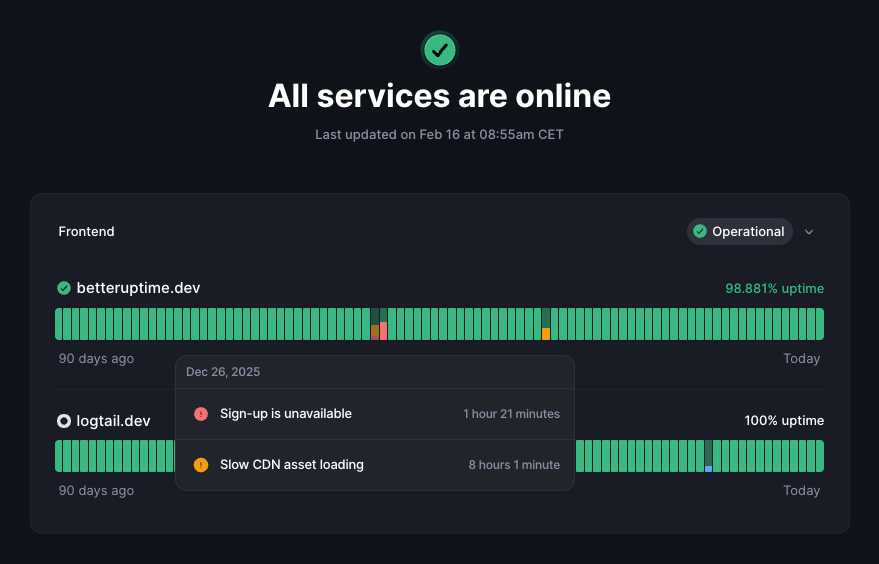
### With status history & chart
Available for monitors and log-based charts, the `response_times` widget displays a chart of response times over a selected period. It's useful for showing performance trends and identifying latency issues.

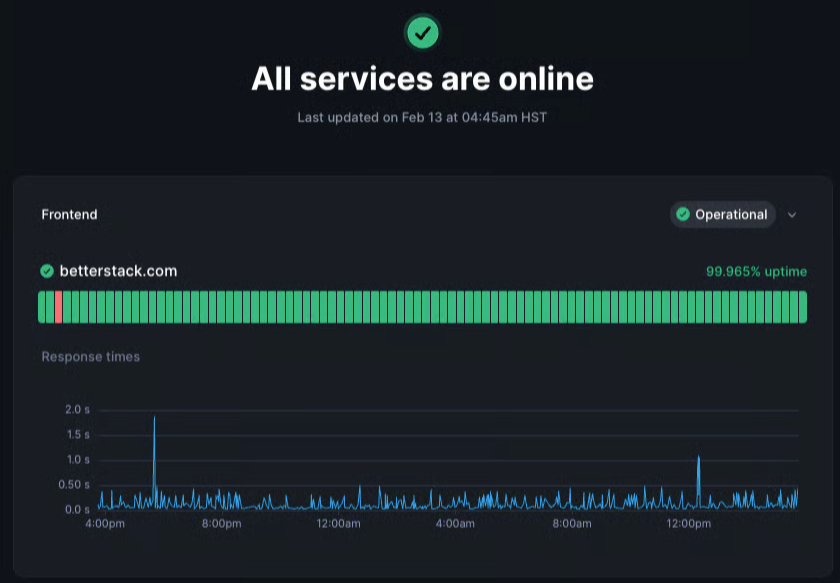
### Chart only
Exclusively for log-based charts, the `chart_only` widget shows only the chart without any additional status indicators. This is perfect for embedding custom metrics or data visualizations directly onto your status page.

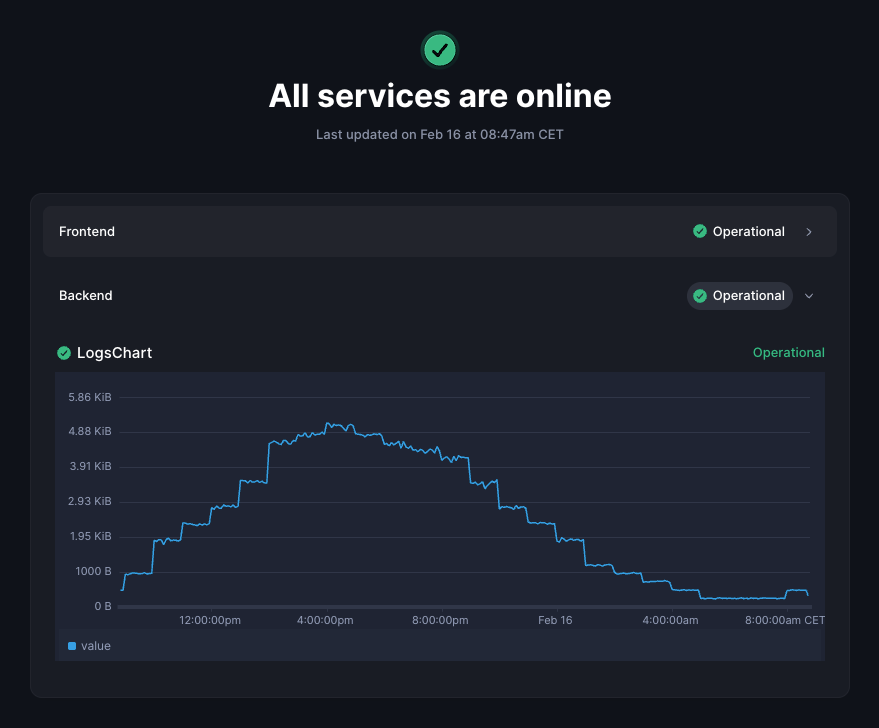
* * *
[Previous article\
\
Embeddable status badge](https://betterstack.com/docs/uptime/working-with-status-pages/embeddable-status-badge/)
[Next article\
\
Subscribing to status pages](https://betterstack.com/docs/uptime/subscribing-to-status-updates/)
###### On this page
* [How to change a widget type](https://betterstack.com/docs/uptime/working-with-status-pages/widget-types/#how-to-change-a-widget-type)
* [Available widget types](https://betterstack.com/docs/uptime/working-with-status-pages/widget-types/#available-widget-types)
### Please accept cookies
We use cookies to authenticate users, improve the product user experience, and for [personalized ads](https://business.safety.google/privacy/)
. [Learn more.](https://betterstack.com/privacy)
Deny Accept required Accept all
---
# Status announcement | Better Stack Documentation
###### Explore documentation
* [Welcome to Uptime 👋](https://betterstack.com/docs/uptime/start/)
* [Frequently Asked Questions](https://betterstack.com/docs/uptime/frequently-asked-questions/)
* [On-call scheduling and alerting](https://betterstack.com/docs/uptime/embedding-announcements-into-your-site/)
1. [Get started](https://betterstack.com/docs/uptime/getting-started-with-oncall-v2/)
2. [Slack and other integrations ↗](https://betterstack.com/docs/uptime/slack/)
3. [Connecting external calendars](https://betterstack.com/docs/uptime/connecting-external-calendars/)
4. [Advanced guide](https://betterstack.com/docs/uptime/escalation-policies/)
* [Incidents](https://betterstack.com/docs/uptime/embedding-announcements-into-your-site/)
1. [Get started](https://betterstack.com/docs/uptime/working-with-incidents/)
2. [Advanced guide](https://betterstack.com/docs/uptime/post-mortems/)
3. [Reporting ↗](https://betterstack.com/docs/getting-started/team-and-account-management/reporting/)
* [Monitoring](https://betterstack.com/docs/uptime/embedding-announcements-into-your-site/)
1. [Get started](https://betterstack.com/docs/uptime/monitoring-start/)
2. [Working with monitors](https://betterstack.com/docs/uptime/bulk-importing-monitors/)
3. [Customizing monitors](https://betterstack.com/docs/uptime/naming-monitors/)
4. [Monitor types](https://betterstack.com/docs/uptime/uptime-monitor/)
* [Status pages](https://betterstack.com/docs/uptime/embedding-announcements-into-your-site/)
1. [Get started](https://betterstack.com/docs/uptime/getting-started-with-status-pages/)
2. [Advanced guide](https://betterstack.com/docs/uptime/custom-subdomain/)
1. [Custom subdomain: status.yourdomain.com](https://betterstack.com/docs/uptime/custom-subdomain/)
2. [Customize status page with CSS and JavaScript](https://betterstack.com/docs/uptime/working-with-status-pages/customize-status-page-css-js/)
3. [Password, IP allowlist, and SSO protection](https://betterstack.com/docs/uptime/password-protected-status-page/)
4. [Status page updates](https://betterstack.com/docs/uptime/creating-status-report-and-status-update/)
5. [Manually tracked item](https://betterstack.com/docs/uptime/working-with-status-pages/manually-tracked-item/)
6. [Status announcement](https://betterstack.com/docs/uptime/embedding-announcements-into-your-site/)
7. [Embeddable status badge](https://betterstack.com/docs/uptime/working-with-status-pages/embeddable-status-badge/)
8. [Widget types](https://betterstack.com/docs/uptime/working-with-status-pages/widget-types/)
9. [Subscribing to status pages](https://betterstack.com/docs/uptime/subscribing-to-status-updates/)
* [Uptime API](https://betterstack.com/docs/uptime/embedding-announcements-into-your-site/)
1. [Getting an API token](https://betterstack.com/docs/uptime/api/getting-started-with-uptime-api/)
2. [Monitors](https://betterstack.com/docs/uptime/api/list-all-existing-monitors/)
3. [Heartbeats](https://betterstack.com/docs/uptime/api/list-all-existing-hearbeats/)
4. [On-call & incidents](https://betterstack.com/docs/uptime/api/on-call-calendar/)
5. [Status pages](https://betterstack.com/docs/uptime/api/list-all-existing-status-pages/)
6. [Metadata](https://betterstack.com/docs/uptime/api/metadata/)
7. [Integrations](https://betterstack.com/docs/uptime/api/list-all-new-relic-integrations/)
8. [Team members](https://betterstack.com/docs/uptime/api/team-members/list/)
Status announcement
===================
Share important updates manually using the system status announcement. This displays a persistent message on your status page regardless of incident status.
1. Go to **Status pages** → select your status page → **Settings** → **Advanced settings**.
2. Navigate to **Share significant news** and enter your announcement.
3. Check **Notify your subscribers about the update** to send notifications.
4. Click **Save changes**.
Remove the announcement by clearing the text field and saving.


The system status announcement does not update automatically based on service status. Update it manually in **Share significant news** when needed.
### When to use system announcements
Use system status announcements for:
* **Scheduled maintenance** - Inform users about upcoming planned downtime
* **Major updates** - Share news about significant feature releases
* **Service changes** - Announce changes to service availability or features
* **General notices** - Communicate important information not tied to incidents
System announcements appear on your status page until you manually remove them. For automatic incident-based notifications, use the [embeddable status badge instead](https://betterstack.com/docs/uptime/working-with-status-pages/embeddable-status-badge/)
.
Embed the announcement on your site
-----------------------------------
Embed real-time status announcements directly on your website. The announcement stays hidden and only appears when you publish a status page announcement, keeping your users informed.
1. Go to **Status pages** → select your status page → **Advanced settings**.
2. Navigate to **Embed the announcement into your site**.
3. Copy the provided `
### 3\. Start logging 🎉
Send logs to Logtail
Copied!
logtail.error("Something bad happend.");
logtail.info("Log message with structured data.", {
item: "Orange Soda",
price: 100.00
});
// Ensure that all logs are sent to Logtail
logtail.flush()
You should see your logs in [Better Stack → Live tail](https://logtail.com/team/0/tail)
.
Logging from browser and Node.js
--------------------------------
Collect logs from both backend and frontend code of your Node.js application.
### 1\. Install
Install Logtail JavaScript NPM package:
Install Logtail JS
Copied!
npm install @logtail/js
### 2\. Setup
Set up Logtail client in backend and frontend code:
Backend code Frontend code
Copied!
const { Node: Logtail } = require("@logtail/js");
const logtail = new Logtail("$SOURCE_TOKEN", {
endpoint: 'https://$INGESTING_HOST',
});
import { Browser as Logtail } from "@logtail/js";
const logtail = new Logtail("$SOURCE_TOKEN", {
endpoint: 'https://$INGESTING_HOST',
});
### 3\. Start logging 🎉
Log the same way in backend and frontend:
Send logs to Better Stack
Copied!
logtail.error("Something bad happend.");
logtail.info("Log message with structured data.", {
item: "Orange Soda",
price: 100.00
});
// Ensure that all logs are sent to Logtail
logtail.flush()
You should see your logs in [Better Stack → Live tail](https://logtail.com/team/0/tail)
.
**Node.js version 12 or higher is required.**
Need help?
----------
Please let us know at [hello@betterstack.com](mailto:hello@betterstack.com)
.
We're happy to help! 🙏
Additional information
----------------------
* Want to learning more about **log levels** and **middleware** in Node.js?
Continue to the [Advanced usage of Better Stack JavaScript client](https://betterstack.com/docs/logs/javascript/logging/)
.
* New to logging? See the [Intro guide to Node.js logging](https://betterstack.com/community/guides/logging/how-to-start-logging-with-node-js/)
and the [Best practices for logging in Node.js](https://betterstack.com/community/guides/logging/nodejs-logging-best-practices/)
.
* Logging from browser? Some browsers (e.g. Brave, or some browser extensions) may block your logs from being sent. If you need to work around this issue, see [possible workarounds on Github](https://github.com/logtail/logtail-js/issues/74)
.
* Using [Bun](https://bun.sh/)
runtime? No worries, our logging packages are tested in Bun as well as Node.
* Using helper function for logging in Node.js? You can fix the logged `context.runtime` info by passing `stackContextHint` to the logger. See the [usage in example project](https://github.com/logtail/logtail-js/blob/master/example-project/index.js#L59)
to learn more.
### NPM packages
Package [@logtail/js](https://www.npmjs.com/package/@logtail/js)
provides a convenient way to install and manage both [@logtail/node](https://www.npmjs.com/package/@logtail/node)
and [@logtail/browser](https://www.npmjs.com/package/@logtail/browser)
NPM packages. You can install the packages separately if you wish to.
* * *
[Previous article\
\
JavaScript & Node.js](https://betterstack.com/docs/logs/javascript/)
[Next article\
\
JavaScript advanced usage](https://betterstack.com/docs/logs/javascript/logging/)
###### On this page
* [Logging from Node.js](https://betterstack.com/docs/logs/javascript/install/#logging-from-node-js)
* [Logging from browser](https://betterstack.com/docs/logs/javascript/install/#logging-from-browser)
* [Logging from browser and Node.js](https://betterstack.com/docs/logs/javascript/install/#logging-from-browser-and-node-js)
* [Need help?](https://betterstack.com/docs/logs/javascript/install/#need-help)
* [Additional information](https://betterstack.com/docs/logs/javascript/install/#additional-information)
### Please accept cookies
We use cookies to authenticate users, improve the product user experience, and for [personalized ads](https://business.safety.google/privacy/)
. [Learn more.](https://betterstack.com/privacy)
Deny Accept required Accept all
---
# List PagerDuty integrations | Better Stack Documentation
###### Explore documentation
* [Welcome to Uptime 👋](https://betterstack.com/docs/uptime/start/)
* [Frequently Asked Questions](https://betterstack.com/docs/uptime/frequently-asked-questions/)
* [On-call scheduling and alerting](https://betterstack.com/docs/uptime/api/list-all-pagerduty-integrations/)
1. [Get started](https://betterstack.com/docs/uptime/getting-started-with-oncall-v2/)
2. [Slack and other integrations ↗](https://betterstack.com/docs/uptime/slack/)
3. [Connecting external calendars](https://betterstack.com/docs/uptime/connecting-external-calendars/)
4. [Advanced guide](https://betterstack.com/docs/uptime/escalation-policies/)
* [Incidents](https://betterstack.com/docs/uptime/api/list-all-pagerduty-integrations/)
1. [Get started](https://betterstack.com/docs/uptime/working-with-incidents/)
2. [Advanced guide](https://betterstack.com/docs/uptime/post-mortems/)
3. [Reporting ↗](https://betterstack.com/docs/getting-started/team-and-account-management/reporting/)
* [Monitoring](https://betterstack.com/docs/uptime/api/list-all-pagerduty-integrations/)
1. [Get started](https://betterstack.com/docs/uptime/monitoring-start/)
2. [Working with monitors](https://betterstack.com/docs/uptime/bulk-importing-monitors/)
3. [Customizing monitors](https://betterstack.com/docs/uptime/naming-monitors/)
4. [Monitor types](https://betterstack.com/docs/uptime/uptime-monitor/)
* [Status pages](https://betterstack.com/docs/uptime/api/list-all-pagerduty-integrations/)
1. [Get started](https://betterstack.com/docs/uptime/getting-started-with-status-pages/)
2. [Advanced guide](https://betterstack.com/docs/uptime/custom-subdomain/)
* [Uptime API](https://betterstack.com/docs/uptime/api/list-all-pagerduty-integrations/)
1. [Getting an API token](https://betterstack.com/docs/uptime/api/getting-started-with-uptime-api/)
2. [Monitors](https://betterstack.com/docs/uptime/api/list-all-existing-monitors/)
3. [Heartbeats](https://betterstack.com/docs/uptime/api/list-all-existing-hearbeats/)
4. [On-call & incidents](https://betterstack.com/docs/uptime/api/on-call-calendar/)
5. [Status pages](https://betterstack.com/docs/uptime/api/list-all-existing-status-pages/)
6. [Metadata](https://betterstack.com/docs/uptime/api/metadata/)
7. [Integrations](https://betterstack.com/docs/uptime/api/list-all-new-relic-integrations/)
1. [New Relic](https://betterstack.com/docs/uptime/api/list-all-new-relic-integrations/)
2. [Datadog](https://betterstack.com/docs/uptime/api/list-all-datadog-integrations/)
3. [AWS CloudWatch](https://betterstack.com/docs/uptime/api/list-all-aws-cloudwatch-integrations/)
4. [Microsoft Azure](https://betterstack.com/docs/uptime/api/list-all-azure-integrations/)
5. [Google Monitoring](https://betterstack.com/docs/uptime/api/list-all-google-monitoring-integrations/)
6. [Grafana](https://betterstack.com/docs/uptime/api/list-all-grafana-integrations/)
7. [Elastic](https://betterstack.com/docs/uptime/api/list-all-elastic-integrations/)
8. [Prometheus](https://betterstack.com/docs/uptime/api/list-all-prometheus-integrations/)
9. [Email](https://betterstack.com/docs/uptime/api/list-all-email-integrations/)
10. [Incoming webhooks](https://betterstack.com/docs/uptime/api/list-all-incoming-webhooks/)
11. [Atlassian Jira](https://betterstack.com/docs/uptime/api/list-all-jira-integrations/)
12. [Slack](https://betterstack.com/docs/uptime/api/list-all-slack-integrations/)
13. [Outgoing webhooks](https://betterstack.com/docs/uptime/api/list-all-outgoing-webhook-integrations/)
14. [Splunk On-Call](https://betterstack.com/docs/uptime/api/list-all-splunk-on-call-integrations/)
15. [PagerDuty](https://betterstack.com/docs/uptime/api/list-all-pagerduty-integrations/)
1. [List PagerDuty integrations GET](https://betterstack.com/docs/uptime/api/list-all-pagerduty-integrations/)
2. [Get PagerDuty integration GET](https://betterstack.com/docs/uptime/api/single-pagerduty-integration/)
3. [Create PagerDuty integration POST](https://betterstack.com/docs/uptime/api/create-pagerduty-integration/)
4. [Update PagerDuty integration PATCH](https://betterstack.com/docs/uptime/api/update-pagerduty-integration/)
5. [Remove PagerDuty integration DELETE](https://betterstack.com/docs/uptime/api/delete-pagerduty-integration/)
6. [Response attributes](https://betterstack.com/docs/uptime/api/pagerduty-integrations-response-params/)
16. [Catalog](https://betterstack.com/docs/uptime/api/catalog-integrations-relations/)
8. [Team members](https://betterstack.com/docs/uptime/api/team-members/list/)
List PagerDuty integrations
===========================
Returns a list of all your PagerDuty integrations. This endpoint [supports pagination](https://betterstack.com/docs/uptime/api/pagination/)
.
GET https://uptime.betterstack.com/api/v2/pager-duty-webhooks
Query parameters
team\_name
string
Filter integrations belonging to a specified team when using [global API token](https://betterstack.com/docs/uptime/api/getting-started-with-uptime-api/#get-a-global-api-token)
.
Headers
Authorization
required string
Bearer `$TOKEN`
200
Returns list of existing PagerDuty integrations
Response body
{
"data": [\
{\
"id": "17",\
"type": "pager_duty_webhook",\
"attributes": {\
"name": "Test",\
"key": "[key]",\
"team_name": "My team"\
}\
}\
],
"pagination": {
"first": "https://uptime.test/api/v2/pager-duty-webhooks?page=1",
"last": "https://uptime.test/api/v2/pager-duty-webhooks?page=1",
"prev": null,
"next": null
}
}
#### Example cURL
Example
Copied!
curl --request GET \
--url https://uptime.betterstack.com/api/v2/p \
--header "Authorization: Bearer $TOKEN"
#### Looking for the details of a specific parameter?
Explore [the list of all PagerDuty integration API parameters](https://betterstack.com/docs/uptime/api/pagerduty-integrations-response-params/?utm_content=callout&utm_medium=docs-uptime&utm_source=community&utm_term=docs-uptime-api-list-all-pagerduty-integrations)
.
* * *
[Previous article\
\
Response attributes](https://betterstack.com/docs/uptime/api/splunk-on-call-integrations-response-params/)
[Next article\
\
Get PagerDuty integration](https://betterstack.com/docs/uptime/api/single-pagerduty-integration/)
### Please accept cookies
We use cookies to authenticate users, improve the product user experience, and for [personalized ads](https://business.safety.google/privacy/)
. [Learn more.](https://betterstack.com/privacy)
Deny Accept required Accept all
---
# Get Prometheus integration | Better Stack Documentation
###### Explore documentation
* [Welcome to Uptime 👋](https://betterstack.com/docs/uptime/start/)
* [Frequently Asked Questions](https://betterstack.com/docs/uptime/frequently-asked-questions/)
* [On-call scheduling and alerting](https://betterstack.com/docs/uptime/api/single-prometheus-integration/)
1. [Get started](https://betterstack.com/docs/uptime/getting-started-with-oncall-v2/)
2. [Slack and other integrations ↗](https://betterstack.com/docs/uptime/slack/)
3. [Connecting external calendars](https://betterstack.com/docs/uptime/connecting-external-calendars/)
4. [Advanced guide](https://betterstack.com/docs/uptime/escalation-policies/)
* [Incidents](https://betterstack.com/docs/uptime/api/single-prometheus-integration/)
1. [Get started](https://betterstack.com/docs/uptime/working-with-incidents/)
2. [Advanced guide](https://betterstack.com/docs/uptime/post-mortems/)
3. [Reporting ↗](https://betterstack.com/docs/getting-started/team-and-account-management/reporting/)
* [Monitoring](https://betterstack.com/docs/uptime/api/single-prometheus-integration/)
1. [Get started](https://betterstack.com/docs/uptime/monitoring-start/)
2. [Working with monitors](https://betterstack.com/docs/uptime/bulk-importing-monitors/)
3. [Customizing monitors](https://betterstack.com/docs/uptime/naming-monitors/)
4. [Monitor types](https://betterstack.com/docs/uptime/uptime-monitor/)
* [Status pages](https://betterstack.com/docs/uptime/api/single-prometheus-integration/)
1. [Get started](https://betterstack.com/docs/uptime/getting-started-with-status-pages/)
2. [Advanced guide](https://betterstack.com/docs/uptime/custom-subdomain/)
* [Uptime API](https://betterstack.com/docs/uptime/api/single-prometheus-integration/)
1. [Getting an API token](https://betterstack.com/docs/uptime/api/getting-started-with-uptime-api/)
2. [Monitors](https://betterstack.com/docs/uptime/api/list-all-existing-monitors/)
3. [Heartbeats](https://betterstack.com/docs/uptime/api/list-all-existing-hearbeats/)
4. [On-call & incidents](https://betterstack.com/docs/uptime/api/on-call-calendar/)
5. [Status pages](https://betterstack.com/docs/uptime/api/list-all-existing-status-pages/)
6. [Metadata](https://betterstack.com/docs/uptime/api/metadata/)
7. [Integrations](https://betterstack.com/docs/uptime/api/list-all-new-relic-integrations/)
1. [New Relic](https://betterstack.com/docs/uptime/api/list-all-new-relic-integrations/)
2. [Datadog](https://betterstack.com/docs/uptime/api/list-all-datadog-integrations/)
3. [AWS CloudWatch](https://betterstack.com/docs/uptime/api/list-all-aws-cloudwatch-integrations/)
4. [Microsoft Azure](https://betterstack.com/docs/uptime/api/list-all-azure-integrations/)
5. [Google Monitoring](https://betterstack.com/docs/uptime/api/list-all-google-monitoring-integrations/)
6. [Grafana](https://betterstack.com/docs/uptime/api/list-all-grafana-integrations/)
7. [Elastic](https://betterstack.com/docs/uptime/api/list-all-elastic-integrations/)
8. [Prometheus](https://betterstack.com/docs/uptime/api/list-all-prometheus-integrations/)
1. [List Prometheus integrations GET](https://betterstack.com/docs/uptime/api/list-all-prometheus-integrations/)
2. [Get Prometheus integration GET](https://betterstack.com/docs/uptime/api/single-prometheus-integration/)
3. [Create Prometheus integration POST](https://betterstack.com/docs/uptime/api/create-prometheus-integration/)
4. [Update Prometheus integration PATCH](https://betterstack.com/docs/uptime/api/update-prometheus-integration/)
5. [Remove Prometheus integration DELETE](https://betterstack.com/docs/uptime/api/delete-prometheus-integration/)
6. [Response attributes](https://betterstack.com/docs/uptime/api/prometheus-integrations-response-params/)
9. [Email](https://betterstack.com/docs/uptime/api/list-all-email-integrations/)
10. [Incoming webhooks](https://betterstack.com/docs/uptime/api/list-all-incoming-webhooks/)
11. [Atlassian Jira](https://betterstack.com/docs/uptime/api/list-all-jira-integrations/)
12. [Slack](https://betterstack.com/docs/uptime/api/list-all-slack-integrations/)
13. [Outgoing webhooks](https://betterstack.com/docs/uptime/api/list-all-outgoing-webhook-integrations/)
14. [Splunk On-Call](https://betterstack.com/docs/uptime/api/list-all-splunk-on-call-integrations/)
15. [PagerDuty](https://betterstack.com/docs/uptime/api/list-all-pagerduty-integrations/)
16. [Catalog](https://betterstack.com/docs/uptime/api/catalog-integrations-relations/)
8. [Team members](https://betterstack.com/docs/uptime/api/team-members/list/)
Get Prometheus integration
==========================
Returns a single Prometheus integration by ID.
GET https://uptime.betterstack.com/api/v2/prometheus-integrations/{prometheus\_integration\_id}
URL parameters
prometheus\_integration\_id
required string
The ID of the Prometheus integration you want to get.
Headers
Authorization
required string
Bearer `$TOKEN`
200
Returns a single Prometheus integration
Response body
{
"data": {
"id": "37",
"type": "prometheus_integration",
"attributes": {
"call": false,
"sms": false,
"email": true,
"team_wait": 180,
"recovery_period": null,
"policy_id": null,
"push": true,
"name": "Test",
"paused": false,
"webhook_url": "https://uptime.betterstack.dev/api/v1/prometheus/webhook/[token]",
"team_name": "Testing"
}
}
}
#### Example cURL
Example
Copied!
curl --request GET \
--url https://uptime.betterstack.com/api/v2/prometheus-integrations/37 \
--header "Authorization: Bearer $TOKEN"
#### Looking for the details of a specific parameter?
Explore [the list of all Prometheus integration API parameters](https://betterstack.com/docs/uptime/api/prometheus-integrations-response-params/?utm_content=callout&utm_medium=docs-uptime&utm_source=community&utm_term=docs-uptime-api-single-prometheus-integration)
* * *
[Previous article\
\
List Prometheus integrations](https://betterstack.com/docs/uptime/api/list-all-prometheus-integrations/)
[Next article\
\
Create Prometheus integration](https://betterstack.com/docs/uptime/api/create-prometheus-integration/)
### Please accept cookies
We use cookies to authenticate users, improve the product user experience, and for [personalized ads](https://business.safety.google/privacy/)
. [Learn more.](https://betterstack.com/privacy)
Deny Accept required Accept all
---
# Remove outgoing webhook | Better Stack Documentation
###### Explore documentation
* [Welcome to Uptime 👋](https://betterstack.com/docs/uptime/start/)
* [Frequently Asked Questions](https://betterstack.com/docs/uptime/frequently-asked-questions/)
* [On-call scheduling and alerting](https://betterstack.com/docs/uptime/api/delete-outgoing-webhook-integration/)
1. [Get started](https://betterstack.com/docs/uptime/getting-started-with-oncall-v2/)
2. [Slack and other integrations ↗](https://betterstack.com/docs/uptime/slack/)
3. [Connecting external calendars](https://betterstack.com/docs/uptime/connecting-external-calendars/)
4. [Advanced guide](https://betterstack.com/docs/uptime/escalation-policies/)
* [Incidents](https://betterstack.com/docs/uptime/api/delete-outgoing-webhook-integration/)
1. [Get started](https://betterstack.com/docs/uptime/working-with-incidents/)
2. [Advanced guide](https://betterstack.com/docs/uptime/post-mortems/)
3. [Reporting ↗](https://betterstack.com/docs/getting-started/team-and-account-management/reporting/)
* [Monitoring](https://betterstack.com/docs/uptime/api/delete-outgoing-webhook-integration/)
1. [Get started](https://betterstack.com/docs/uptime/monitoring-start/)
2. [Working with monitors](https://betterstack.com/docs/uptime/bulk-importing-monitors/)
3. [Customizing monitors](https://betterstack.com/docs/uptime/naming-monitors/)
4. [Monitor types](https://betterstack.com/docs/uptime/uptime-monitor/)
* [Status pages](https://betterstack.com/docs/uptime/api/delete-outgoing-webhook-integration/)
1. [Get started](https://betterstack.com/docs/uptime/getting-started-with-status-pages/)
2. [Advanced guide](https://betterstack.com/docs/uptime/custom-subdomain/)
* [Uptime API](https://betterstack.com/docs/uptime/api/delete-outgoing-webhook-integration/)
1. [Getting an API token](https://betterstack.com/docs/uptime/api/getting-started-with-uptime-api/)
2. [Monitors](https://betterstack.com/docs/uptime/api/list-all-existing-monitors/)
3. [Heartbeats](https://betterstack.com/docs/uptime/api/list-all-existing-hearbeats/)
4. [On-call & incidents](https://betterstack.com/docs/uptime/api/on-call-calendar/)
5. [Status pages](https://betterstack.com/docs/uptime/api/list-all-existing-status-pages/)
6. [Metadata](https://betterstack.com/docs/uptime/api/metadata/)
7. [Integrations](https://betterstack.com/docs/uptime/api/list-all-new-relic-integrations/)
1. [New Relic](https://betterstack.com/docs/uptime/api/list-all-new-relic-integrations/)
2. [Datadog](https://betterstack.com/docs/uptime/api/list-all-datadog-integrations/)
3. [AWS CloudWatch](https://betterstack.com/docs/uptime/api/list-all-aws-cloudwatch-integrations/)
4. [Microsoft Azure](https://betterstack.com/docs/uptime/api/list-all-azure-integrations/)
5. [Google Monitoring](https://betterstack.com/docs/uptime/api/list-all-google-monitoring-integrations/)
6. [Grafana](https://betterstack.com/docs/uptime/api/list-all-grafana-integrations/)
7. [Elastic](https://betterstack.com/docs/uptime/api/list-all-elastic-integrations/)
8. [Prometheus](https://betterstack.com/docs/uptime/api/list-all-prometheus-integrations/)
9. [Email](https://betterstack.com/docs/uptime/api/list-all-email-integrations/)
10. [Incoming webhooks](https://betterstack.com/docs/uptime/api/list-all-incoming-webhooks/)
11. [Atlassian Jira](https://betterstack.com/docs/uptime/api/list-all-jira-integrations/)
12. [Slack](https://betterstack.com/docs/uptime/api/list-all-slack-integrations/)
13. [Outgoing webhooks](https://betterstack.com/docs/uptime/api/list-all-outgoing-webhook-integrations/)
1. [List outgoing webhooks GET](https://betterstack.com/docs/uptime/api/list-all-outgoing-webhook-integrations/)
2. [Get outgoing webhook GET](https://betterstack.com/docs/uptime/api/single-outgoing-webhook-integration/)
3. [Create outgoing webhook POST](https://betterstack.com/docs/uptime/api/create-outgoing-webhook-integration/)
4. [Update outgoing webhook PATCH](https://betterstack.com/docs/uptime/api/update-outgoing-webhook-integration/)
5. [Remove outgoing webhook DELETE](https://betterstack.com/docs/uptime/api/delete-outgoing-webhook-integration/)
6. [Response attributes](https://betterstack.com/docs/uptime/api/outgoing-webhook-integrations-response-params/)
14. [Splunk On-Call](https://betterstack.com/docs/uptime/api/list-all-splunk-on-call-integrations/)
15. [PagerDuty](https://betterstack.com/docs/uptime/api/list-all-pagerduty-integrations/)
16. [Catalog](https://betterstack.com/docs/uptime/api/catalog-integrations-relations/)
8. [Team members](https://betterstack.com/docs/uptime/api/team-members/list/)
Remove outgoing webhook
=======================
Permanently deletes an existing Outgoing Webhook integration.
DELETE https://uptime.betterstack.com/api/v2/outgoing-webhooks/{outgoing\_webhook\_id}
URL parameters
outgoing\_webhook\_id
required string
The ID of the Outgoing Webhook integration you want to delete
Headers
Authorization
required string
Bearer `$TOKEN`
204
Returns empty body
#### Example cURL
Example
Copied!
curl --request DELETE \
--url https://uptime.betterstack.com/api/v2/outgoing-webhooks/16 \
--header "Authorization: Bearer $TOKEN"
#### Looking for the details of a specific parameter?
Explore [the list of all Outgoing Webhook integration API parameters](https://betterstack.com/docs/uptime/api/outgoing-webhook-integrations-response-params/?utm_content=callout&utm_medium=docs-uptime&utm_source=community&utm_term=docs-uptime-api-delete-outgoing-webhook-integration)
* * *
[Previous article\
\
Update outgoing webhook](https://betterstack.com/docs/uptime/api/update-outgoing-webhook-integration/)
[Next article\
\
Response attributes](https://betterstack.com/docs/uptime/api/outgoing-webhook-integrations-response-params/)
### Please accept cookies
We use cookies to authenticate users, improve the product user experience, and for [personalized ads](https://business.safety.google/privacy/)
. [Learn more.](https://betterstack.com/privacy)
Deny Accept required Accept all
---
# Create Elastic integration | Better Stack Documentation
###### Explore documentation
* [Welcome to Uptime 👋](https://betterstack.com/docs/uptime/start/)
* [Frequently Asked Questions](https://betterstack.com/docs/uptime/frequently-asked-questions/)
* [On-call scheduling and alerting](https://betterstack.com/docs/uptime/api/create-elastic-integration/)
1. [Get started](https://betterstack.com/docs/uptime/getting-started-with-oncall-v2/)
2. [Slack and other integrations ↗](https://betterstack.com/docs/uptime/slack/)
3. [Connecting external calendars](https://betterstack.com/docs/uptime/connecting-external-calendars/)
4. [Advanced guide](https://betterstack.com/docs/uptime/escalation-policies/)
* [Incidents](https://betterstack.com/docs/uptime/api/create-elastic-integration/)
1. [Get started](https://betterstack.com/docs/uptime/working-with-incidents/)
2. [Advanced guide](https://betterstack.com/docs/uptime/post-mortems/)
3. [Reporting ↗](https://betterstack.com/docs/getting-started/team-and-account-management/reporting/)
* [Monitoring](https://betterstack.com/docs/uptime/api/create-elastic-integration/)
1. [Get started](https://betterstack.com/docs/uptime/monitoring-start/)
2. [Working with monitors](https://betterstack.com/docs/uptime/bulk-importing-monitors/)
3. [Customizing monitors](https://betterstack.com/docs/uptime/naming-monitors/)
4. [Monitor types](https://betterstack.com/docs/uptime/uptime-monitor/)
* [Status pages](https://betterstack.com/docs/uptime/api/create-elastic-integration/)
1. [Get started](https://betterstack.com/docs/uptime/getting-started-with-status-pages/)
2. [Advanced guide](https://betterstack.com/docs/uptime/custom-subdomain/)
* [Uptime API](https://betterstack.com/docs/uptime/api/create-elastic-integration/)
1. [Getting an API token](https://betterstack.com/docs/uptime/api/getting-started-with-uptime-api/)
2. [Monitors](https://betterstack.com/docs/uptime/api/list-all-existing-monitors/)
3. [Heartbeats](https://betterstack.com/docs/uptime/api/list-all-existing-hearbeats/)
4. [On-call & incidents](https://betterstack.com/docs/uptime/api/on-call-calendar/)
5. [Status pages](https://betterstack.com/docs/uptime/api/list-all-existing-status-pages/)
6. [Metadata](https://betterstack.com/docs/uptime/api/metadata/)
7. [Integrations](https://betterstack.com/docs/uptime/api/list-all-new-relic-integrations/)
1. [New Relic](https://betterstack.com/docs/uptime/api/list-all-new-relic-integrations/)
2. [Datadog](https://betterstack.com/docs/uptime/api/list-all-datadog-integrations/)
3. [AWS CloudWatch](https://betterstack.com/docs/uptime/api/list-all-aws-cloudwatch-integrations/)
4. [Microsoft Azure](https://betterstack.com/docs/uptime/api/list-all-azure-integrations/)
5. [Google Monitoring](https://betterstack.com/docs/uptime/api/list-all-google-monitoring-integrations/)
6. [Grafana](https://betterstack.com/docs/uptime/api/list-all-grafana-integrations/)
7. [Elastic](https://betterstack.com/docs/uptime/api/list-all-elastic-integrations/)
1. [List Elastic integrations GET](https://betterstack.com/docs/uptime/api/list-all-elastic-integrations/)
2. [Get Elastic integration GET](https://betterstack.com/docs/uptime/api/single-elastic-integration/)
3. [Create Elastic integration POST](https://betterstack.com/docs/uptime/api/create-elastic-integration/)
4. [Update Elastic integration PATCH](https://betterstack.com/docs/uptime/api/update-elastic-integration/)
5. [Remove Elastic integration DELETE](https://betterstack.com/docs/uptime/api/delete-elastic-integration/)
6. [Response attributes](https://betterstack.com/docs/uptime/api/grafana-elastic-response-params/)
8. [Prometheus](https://betterstack.com/docs/uptime/api/list-all-prometheus-integrations/)
9. [Email](https://betterstack.com/docs/uptime/api/list-all-email-integrations/)
10. [Incoming webhooks](https://betterstack.com/docs/uptime/api/list-all-incoming-webhooks/)
11. [Atlassian Jira](https://betterstack.com/docs/uptime/api/list-all-jira-integrations/)
12. [Slack](https://betterstack.com/docs/uptime/api/list-all-slack-integrations/)
13. [Outgoing webhooks](https://betterstack.com/docs/uptime/api/list-all-outgoing-webhook-integrations/)
14. [Splunk On-Call](https://betterstack.com/docs/uptime/api/list-all-splunk-on-call-integrations/)
15. [PagerDuty](https://betterstack.com/docs/uptime/api/list-all-pagerduty-integrations/)
16. [Catalog](https://betterstack.com/docs/uptime/api/catalog-integrations-relations/)
8. [Team members](https://betterstack.com/docs/uptime/api/team-members/list/)
Create Elastic integration
==========================
Returns either a newly created Elastic integration, or validation errors.
POST https://uptime.betterstack.com/api/v2/elastic-integrations
Headers
Authorization
required string
Bearer `$TOKEN`
Content\_Type
string
application/json
Body parameters
team\_name
string
Required if using [global API token](https://betterstack.com/docs/uptime/api/getting-started-with-uptime-api/#get-a-global-api-token)
to specify the team which should own the resource
name
string
The name of the Elastic integration that you can see in the dashboard.
\*
Any other params you'd like to set. See the [list of all Elastic integration API parameters](https://betterstack.com/docs/uptime/api/grafana-elastic-response-params/)
for details.
201
Returns newly created Elastic integration
Response body
{
"data": {
"id": "37",
"type": "elastic_integration",
"attributes": {
"call": false,
"sms": false,
"email": true,
"team_wait": 180,
"recovery_period": null,
"policy_id": null,
"push": true,
"name": "Test",
"paused": false,
"webhook_url": "https://uptime.betterstack.dev/api/v1/elastic/webhook/[token]",
"team_name": "Testing"
}
}
}
#### Example cURL
Example
Copied!
curl -X "POST" "https://uptime.betterstack.com/api/v2/elastic-integrations/" \
-H "Authorization: Bearer $TOKEN" \
-H 'Content-Type: application/json; charset=utf-8' \
-d $'{
"name": "Test"
}'
#### Looking for the details of a specific parameter?
Explore [the list of all Elastic integration API parameters](https://betterstack.com/docs/uptime/api/grafana-elastic-response-params/?utm_content=callout&utm_medium=docs-uptime&utm_source=community&utm_term=docs-uptime-api-create-elastic-integration)
* * *
[Previous article\
\
Get Elastic integration](https://betterstack.com/docs/uptime/api/single-elastic-integration/)
[Next article\
\
Update Elastic integration](https://betterstack.com/docs/uptime/api/update-elastic-integration/)
### Please accept cookies
We use cookies to authenticate users, improve the product user experience, and for [personalized ads](https://business.safety.google/privacy/)
. [Learn more.](https://betterstack.com/privacy)
Deny Accept required Accept all
---
# Better Stack Erlang logging | Better Stack Documentation
###### Explore documentation
* [Welcome to Telemetry 👋](https://betterstack.com/docs/logs/start/)
* [Quick start guide](https://betterstack.com/docs/logs/logging-start/)
* [Wide events vs. metrics](https://betterstack.com/docs/logs/wide-events-time-series/)
* [Ingesting data](https://betterstack.com/docs/logs/erlang/)
1. [Better Stack collector](https://betterstack.com/docs/logs/collector/)
2. [Vector](https://betterstack.com/docs/logs/vector/)
3. [OpenTelemetry](https://betterstack.com/docs/logs/open-telemetry/)
4. [Ingesting via HTTP API](https://betterstack.com/docs/logs/ingesting-data/http/logs/)
5. [Ingesting metrics](https://betterstack.com/docs/logs/ingesting-data/metrics/prometheus-scrape/)
6. [Ingesting logs](https://betterstack.com/docs/logs/ingesting-data/logs/docker-kubernetes/)
1. [Docker & Kubernetes](https://betterstack.com/docs/logs/docker/)
2. [Operating systems](https://betterstack.com/docs/logs/ubuntu/)
3. [Log forwarders](https://betterstack.com/docs/logs/metrics/vector/)
4. [Programming languages](https://betterstack.com/docs/logs/javascript/)
1. [JavaScript & Node.js](https://betterstack.com/docs/logs/javascript/)
2. [Python](https://betterstack.com/docs/logs/python/)
3. [Ruby](https://betterstack.com/docs/logs/ruby-and-rails/)
4. [PHP](https://betterstack.com/docs/logs/php/)
5. [Java](https://betterstack.com/docs/logs/java/)
6. [.NET](https://betterstack.com/docs/logs/net-c/)
7. [Go](https://betterstack.com/docs/logs/go/)
8. [Erlang](https://betterstack.com/docs/logs/erlang/)
5. [Cloud platforms](https://betterstack.com/docs/logs/aws/)
6. [Web servers & Load balancers](https://betterstack.com/docs/logs/nginx/)
7. [Databases & queues](https://betterstack.com/docs/logs/postgresql/)
8. [Storage](https://betterstack.com/docs/logs/minio/)
7. [Migrating to Better Stack](https://betterstack.com/docs/logs/datadog-agent/)
* [Using the product](https://betterstack.com/docs/logs/erlang/)
1. [AI SRE ↗](https://betterstack.com/demos/ai-sre/)
2. [MCP server ↗](https://betterstack.com/docs/getting-started/integrations/mcp/)
3. [Transforming ingested data](https://betterstack.com/docs/logs/using-logtail/transforming-ingested-data/logs-vrl/)
4. [Querying data](https://betterstack.com/docs/logs/using-logtail/live-tail-query-language/)
5. [Tracing](https://betterstack.com/docs/logs/tracing/)
6. [Alerts](https://betterstack.com/docs/logs/dashboards/alerts/)
* [Telemetry API](https://betterstack.com/docs/logs/erlang/)
1. [Getting an API token](https://betterstack.com/docs/logs/api/getting-started/)
2. [Sources & collectors](https://betterstack.com/docs/logs/api/list-all-existing-sources/)
3. [Dashboards](https://betterstack.com/docs/logs/api/dashboards/list/)
4. [Explorations](https://betterstack.com/docs/logs/api/explorations/list/)
5. [Alerts API](https://betterstack.com/docs/logs/api/alerts/list/)
6. [Connections API](https://betterstack.com/docs/logs/api/connections/list/)
7. [Query API ↗](https://betterstack.com/docs/logs/query-api/connect-remotely/)
* [Alternative to](https://betterstack.com/docs/logs/erlang/)
1. [Lightstep](https://betterstack.com/docs/logs/alternative-to/lightstep/)
Better Stack Erlang logging
===========================
Start logging in 3 steps
------------------------
Collect logs from your Erlang application.
### 1\. Install
Add [betterstack\_logger](https://github.com/silviucpp/betterstack_logger)
to your project dependencies using Rebar or Mix.
rebar.config mix.exs
Copied!
{deps, [betterstack_logger]}.
def deps do
[\
{:betterstack_logger, "~> 1.0"}\
]
end
### 2\. Setup
Configure `betterstack_logger` in your application's configuration file,or add it programmatically via Logger API:
sys.config call logger:add\_handler in your start module
Copied!
[\
{betterstack_logger, [\
{logger, [\
{handler, betterstack_logs, betterstack_logger, #{\
level => info,\
config => #{\
http_pool_options => [\
{timeout, 15000},\
{max_connections, 10}\
],\
betterstack_host => <<"https://$INGESTING_HOST">>,\
betterstack_source_token => <<"$SOURCE_TOKEN">>,\
extra_fields => [\
{<<"_env">>, <<"prod">>}\
],\
upload_batch_max_size => 50,\
upload_batch_inteval_ms => 5000,\
upload_failed_retry_count => 3,\
upload_failed_retry_delay_ms => 1000\
},\
formatter => {\
logger_formatter, #{\
single_line => true,\
template => [pid, " ", mfa,":",line, " => ", msg],\
time_offset => "Z"\
}\
},\
filters => [\
%{remote_group_leader, {fun logger_filters:remote_gl/2, stop}},\
%{progress, {fun logger_filters:progress/2, stop}},\
%{sasl, {fun logger_filters:domain/2, {stop, sub, [otp, sasl]}}}\
]\
}}\
]}\
]}\
].
logger:add_handler(my_handler, betterstack_logs, #{
level => info,
config => #{
http_pool_options => [\
{timeout, 15000},\
{max_connections, 10}\
],
betterstack_host => <<"https://$INGESTING_HOST">>,
betterstack_source_token => <<"$SOURCE_TOKEN">>,
extra_fields => [\
{<<"_env">>, <<"prod">>}\
],
upload_batch_max_size => 50,
upload_batch_inteval_ms => 5000,
upload_failed_retry_count => 3,
upload_failed_retry_delay_ms => 1000
},
formatter => {
logger_formatter, #{
single_line => true,
template => [pid, " ", mfa,":",line, " => ", msg],
time_offset => "Z"
}
},
filters => [\
%{remote_group_leader, {fun logger_filters:remote_gl/2, stop}},\
%{progress, {fun logger_filters:progress/2, stop}},\
%{sasl, {fun logger_filters:domain/2, {stop, sub, [otp, sasl]}}}\
]
}).
#### Using the logger as default handler is not supported.
To avoid cyclic dependency, it's not currently possible to set `betterstack_logger` as `default` handler via `sys.config`.
### 3\. Start logging 🎉
Use the Erlang `logger` module as usual. Your log events will be sent to Better Stack automatically.
Example usage
Copied!
logger:info("Application started successfully."),
logger:error("Failed to connect to database."),
logger:debug("Debugging value: ~p", [Value]).
You should see your logs in [Better Stack → Live tail](https://telemetry.betterstack.com/team/0/tail)
.
* * *
Huge thanks to [Silviu Caragea](https://github.com/silviucpp)
who maintains the [betterstack\_logger](https://github.com/silviucpp/betterstack_logger)
library as an MIT-licenced open-source! ❤️
Need help?
----------
Please reach out to us at [hello@betterstack.com](mailto:hello@betterstack.com)
.
We're happy to help! 🙏
Additional information
----------------------
Ensure your application terminates gracefully, giving the logger enough time to finish sending logs to BetterStack.
Use `init:stop()` to end your application properly.
Avoid using `erlang:halt()`, as it terminates all processes immediately and may drop your logs.
* * *
[Previous article\
\
Better Stack Go logging](https://betterstack.com/docs/logs/go/)
[Next article\
\
AWS integration](https://betterstack.com/docs/logs/aws/)
###### On this page
* [Start logging in 3 steps](https://betterstack.com/docs/logs/erlang/#start-logging-in-3-steps)
* [Need help?](https://betterstack.com/docs/logs/erlang/#need-help)
* [Additional information](https://betterstack.com/docs/logs/erlang/#additional-information)
### Please accept cookies
We use cookies to authenticate users, improve the product user experience, and for [personalized ads](https://business.safety.google/privacy/)
. [Learn more.](https://betterstack.com/privacy)
Deny Accept required Accept all
---
# Better Stack Cloudflare HTTP requests logging | Better Stack Documentation
###### Explore documentation
* [Welcome to Telemetry 👋](https://betterstack.com/docs/logs/start/)
* [Quick start guide](https://betterstack.com/docs/logs/logging-start/)
* [Wide events vs. metrics](https://betterstack.com/docs/logs/wide-events-time-series/)
* [Ingesting data](https://betterstack.com/docs/logs/cloudflare-http-requests/)
1. [Better Stack collector](https://betterstack.com/docs/logs/collector/)
2. [Vector](https://betterstack.com/docs/logs/vector/)
3. [OpenTelemetry](https://betterstack.com/docs/logs/open-telemetry/)
4. [Ingesting via HTTP API](https://betterstack.com/docs/logs/ingesting-data/http/logs/)
5. [Ingesting metrics](https://betterstack.com/docs/logs/ingesting-data/metrics/prometheus-scrape/)
6. [Ingesting logs](https://betterstack.com/docs/logs/ingesting-data/logs/docker-kubernetes/)
1. [Docker & Kubernetes](https://betterstack.com/docs/logs/docker/)
2. [Operating systems](https://betterstack.com/docs/logs/ubuntu/)
3. [Log forwarders](https://betterstack.com/docs/logs/metrics/vector/)
4. [Programming languages](https://betterstack.com/docs/logs/javascript/)
5. [Cloud platforms](https://betterstack.com/docs/logs/aws/)
1. [AWS](https://betterstack.com/docs/logs/aws/)
2. [Azure](https://betterstack.com/docs/logs/azure-logs/)
3. [Cloudflare](https://betterstack.com/docs/logs/cloudflare/)
1. [Logpush](https://betterstack.com/docs/logs/cloudflare/logpush/)
2. [Cloudflare metrics](https://betterstack.com/docs/logs/cloudflare-exporter/)
3. [HTTP requests](https://betterstack.com/docs/logs/cloudflare-http-requests/)
4. [Workers](https://betterstack.com/docs/logs/cloudflare-worker/)
4. [Google](https://betterstack.com/docs/logs/google-cloud-pubsub/)
5. [Digital Ocean](https://betterstack.com/docs/logs/digital-ocean-apps/)
6. [Heroku](https://betterstack.com/docs/logs/heroku/)
7. [Vercel](https://betterstack.com/docs/logs/vercel/automatic-integration/)
8. [Render](https://betterstack.com/docs/logs/render/)
9. [Fly.io](https://betterstack.com/docs/logs/fly-io/)
10. [Supabase](https://betterstack.com/docs/logs/supabase/)
6. [Web servers & Load balancers](https://betterstack.com/docs/logs/nginx/)
7. [Databases & queues](https://betterstack.com/docs/logs/postgresql/)
8. [Storage](https://betterstack.com/docs/logs/minio/)
7. [Migrating to Better Stack](https://betterstack.com/docs/logs/datadog-agent/)
* [Using the product](https://betterstack.com/docs/logs/cloudflare-http-requests/)
1. [AI SRE ↗](https://betterstack.com/demos/ai-sre/)
2. [MCP server ↗](https://betterstack.com/docs/getting-started/integrations/mcp/)
3. [Transforming ingested data](https://betterstack.com/docs/logs/using-logtail/transforming-ingested-data/logs-vrl/)
4. [Querying data](https://betterstack.com/docs/logs/using-logtail/live-tail-query-language/)
5. [Tracing](https://betterstack.com/docs/logs/tracing/)
6. [Alerts](https://betterstack.com/docs/logs/dashboards/alerts/)
* [Telemetry API](https://betterstack.com/docs/logs/cloudflare-http-requests/)
1. [Getting an API token](https://betterstack.com/docs/logs/api/getting-started/)
2. [Sources & collectors](https://betterstack.com/docs/logs/api/list-all-existing-sources/)
3. [Dashboards](https://betterstack.com/docs/logs/api/dashboards/list/)
4. [Explorations](https://betterstack.com/docs/logs/api/explorations/list/)
5. [Alerts API](https://betterstack.com/docs/logs/api/alerts/list/)
6. [Connections API](https://betterstack.com/docs/logs/api/connections/list/)
7. [Query API ↗](https://betterstack.com/docs/logs/query-api/connect-remotely/)
* [Alternative to](https://betterstack.com/docs/logs/cloudflare-http-requests/)
1. [Lightstep](https://betterstack.com/docs/logs/alternative-to/lightstep/)
Better Stack Cloudflare HTTP requests logging
=============================================
Start logging in 5 minutes
--------------------------
Use custom Cloudflare Worker code to log HTTP requests.
### Set up Cloudflare Worker
1. Go to your [Cloudflare dashboard](https://dash.cloudflare.com/)
→ Select your domain → `Workers`.
2. Click `Manage Workers` → `Create a Worker`.
3. Replace the script with the following code and click `Save and Deploy`.
Cloudflare worker code
Copied!
const CF_APP_VERSION = '1.0.0'
const logtailApiURL = "https://$INGESTING_HOST/";
const sourceToken = "$SOURCE_TOKEN";
const headers = [\
"rMeth",\
"rUrl",\
"uAgent",\
"cfRay",\
"cIP",\
"statusCode",\
"contentLength",\
"cfCacheStatus",\
"contentType",\
"responseConnection",\
"requestConnection",\
"cacheControl",\
"acceptRanges",\
"expectCt",\
"expires",\
"lastModified",\
"vary",\
"server",\
"etag",\
"date",\
"transferEncoding",\
]
const options = {
metadata: headers.map(value => ({ field: value })),
}
const sleep = ms => {
return new Promise(resolve => {
setTimeout(resolve, ms)
})
}
const makeid = length => {
let text = ""
const possible = "ABCDEFGHIJKLMNPQRSTUVWXYZ0123456789"
for (let i = 0; i < length; i += 1) {
text += possible.charAt(Math.floor(Math.random() * possible.length))
}
return text
}
const buildLogMessage = (request, response) => {
const logDefs = {
rMeth: request.method,
rUrl: request.url,
uAgent: request.headers.get("user-agent"),
cfRay: request.headers.get("cf-ray"),
cIP: request.headers.get("cf-connecting-ip"),
statusCode: response.status,
contentLength: response.headers.get("content-length"),
cfCacheStatus: response.headers.get("cf-cache-status"),
contentType: response.headers.get("content-type"),
responseConnection: response.headers.get("connection"),
requestConnection: request.headers.get("connection"),
cacheControl: response.headers.get("cache-control"),
acceptRanges: response.headers.get("accept-ranges"),
expectCt: response.headers.get("expect-ct"),
expires: response.headers.get("expires"),
lastModified: response.headers.get("last-modified"),
vary: response.headers.get("vary"),
server: response.headers.get("server"),
etag: response.headers.get("etag"),
date: response.headers.get("date"),
transferEncoding: response.headers.get("transfer-encoding"),
}
const logArray = []
options.metadata.forEach(entry => logArray.push(logDefs[entry.field]))
return logArray.join(" | ")
}
const buildMetadataFromHeaders = headers => {
const responseMetadata = {}
Array.from(headers).forEach(([key, value]) => {
responseMetadata[key.replace(/-/g, "_")] = value
})
return responseMetadata
}
// Batching
const BATCH_INTERVAL_MS = 500
const MAX_REQUESTS_PER_BATCH = 100
const WORKER_ID = makeid(6)
let workerTimestamp
let batchTimeoutReached = true
let logEventsBatch = []
// Backoff
const BACKOFF_INTERVAL = 10000
let backoff = 0
async function addToBatch(body, connectingIp, event) {
logEventsBatch.push(body)
if (logEventsBatch.length >= MAX_REQUESTS_PER_BATCH) {
event.waitUntil(postBatch(event))
}
return true
}
async function handleRequest(event) {
const { request } = event
const requestMetadata = buildMetadataFromHeaders(request.headers)
const t1 = Date.now()
const response = await fetch(request)
const originTimeMs = Date.now() - t1
const rUrl = request.url
const rMeth = request.method
const rCf = request.cf
delete rCf.tlsClientAuth
delete rCf.tlsExportedAuthenticator
const responseMetadata = buildMetadataFromHeaders(response.headers)
const eventBody = {
message: buildLogMessage(request, response),
dt: new Date().toISOString(),
metadata: {
response: {
headers: responseMetadata,
origin_time: originTimeMs,
status_code: response.status,
},
request: {
url: rUrl,
method: rMeth,
headers: requestMetadata,
cf: rCf,
},
cloudflare_worker: {
version: CF_APP_VERSION,
worker_id: WORKER_ID,
worker_started: workerTimestamp,
},
},
}
event.waitUntil(
addToBatch(eventBody, requestMetadata.cf_connecting_ip, event),
)
return response
}
const fetchAndSetBackOff = async (lfRequest, event) => {
if (backoff <= Date.now()) {
const resp = await fetch(logtailApiURL, lfRequest)
if (resp.status === 403 || resp.status === 429) {
backoff = Date.now() + BACKOFF_INTERVAL
}
}
event.waitUntil(scheduleBatch(event))
return true
}
const postBatch = async event => {
const batchInFlight = [...logEventsBatch]
logEventsBatch = []
const rHost = batchInFlight[0].metadata.request.headers.host
const body = JSON.stringify(batchInFlight)
const request = {
method: "POST",
headers: {
"Authorization": `Bearer ${sourceToken}`,
"Content-Type": "application/json",
"User-Agent": `Cloudflare Worker via ${rHost}`,
},
body,
}
event.waitUntil(fetchAndSetBackOff(request, event))
}
const scheduleBatch = async event => {
if (batchTimeoutReached) {
batchTimeoutReached = false
await sleep(BATCH_INTERVAL_MS)
if (logEventsBatch.length > 0) {
event.waitUntil(postBatch(event))
}
batchTimeoutReached = true
}
return true
}
addEventListener("fetch", event => {
event.passThroughOnException()
if (!workerTimestamp) {
workerTimestamp = new Date().toISOString()
}
event.waitUntil(scheduleBatch(event))
event.respondWith(handleRequest(event))
})
### Add route to the worker
1. Go back to `Workers` → `Add route`.
2. Set the route pattern to `*.your-domain.com/*` and select the newly created Better Stack worker.
3. Click on `Save` and you're all set. 🎉
You should see your logs in [Better Stack → Live tail](https://telemetry.betterstack.com/team/0/tail)
.
Need help?
----------
Please let us know at [hello@betterstack.com](mailto:hello@betterstack.com)
.
We're happy to help! 🙏
* * *
[Previous article\
\
Cloudflare Prometheus Exporter](https://betterstack.com/docs/logs/cloudflare-exporter/)
[Next article\
\
Better Stack Cloudflare Workers logging](https://betterstack.com/docs/logs/cloudflare-worker/)
###### On this page
* [Start logging in 5 minutes](https://betterstack.com/docs/logs/cloudflare-http-requests/#start-logging-in-5-minutes)
* [Need help?](https://betterstack.com/docs/logs/cloudflare-http-requests/#need-help)
### Please accept cookies
We use cookies to authenticate users, improve the product user experience, and for [personalized ads](https://business.safety.google/privacy/)
. [Learn more.](https://betterstack.com/privacy)
Deny Accept required Accept all
---
# List outgoing webhooks | Better Stack Documentation
###### Explore documentation
* [Welcome to Uptime 👋](https://betterstack.com/docs/uptime/start/)
* [Frequently Asked Questions](https://betterstack.com/docs/uptime/frequently-asked-questions/)
* [On-call scheduling and alerting](https://betterstack.com/docs/uptime/api/list-all-outgoing-webhook-integrations/)
1. [Get started](https://betterstack.com/docs/uptime/getting-started-with-oncall-v2/)
2. [Slack and other integrations ↗](https://betterstack.com/docs/uptime/slack/)
3. [Connecting external calendars](https://betterstack.com/docs/uptime/connecting-external-calendars/)
4. [Advanced guide](https://betterstack.com/docs/uptime/escalation-policies/)
* [Incidents](https://betterstack.com/docs/uptime/api/list-all-outgoing-webhook-integrations/)
1. [Get started](https://betterstack.com/docs/uptime/working-with-incidents/)
2. [Advanced guide](https://betterstack.com/docs/uptime/post-mortems/)
3. [Reporting ↗](https://betterstack.com/docs/getting-started/team-and-account-management/reporting/)
* [Monitoring](https://betterstack.com/docs/uptime/api/list-all-outgoing-webhook-integrations/)
1. [Get started](https://betterstack.com/docs/uptime/monitoring-start/)
2. [Working with monitors](https://betterstack.com/docs/uptime/bulk-importing-monitors/)
3. [Customizing monitors](https://betterstack.com/docs/uptime/naming-monitors/)
4. [Monitor types](https://betterstack.com/docs/uptime/uptime-monitor/)
* [Status pages](https://betterstack.com/docs/uptime/api/list-all-outgoing-webhook-integrations/)
1. [Get started](https://betterstack.com/docs/uptime/getting-started-with-status-pages/)
2. [Advanced guide](https://betterstack.com/docs/uptime/custom-subdomain/)
* [Uptime API](https://betterstack.com/docs/uptime/api/list-all-outgoing-webhook-integrations/)
1. [Getting an API token](https://betterstack.com/docs/uptime/api/getting-started-with-uptime-api/)
2. [Monitors](https://betterstack.com/docs/uptime/api/list-all-existing-monitors/)
3. [Heartbeats](https://betterstack.com/docs/uptime/api/list-all-existing-hearbeats/)
4. [On-call & incidents](https://betterstack.com/docs/uptime/api/on-call-calendar/)
5. [Status pages](https://betterstack.com/docs/uptime/api/list-all-existing-status-pages/)
6. [Metadata](https://betterstack.com/docs/uptime/api/metadata/)
7. [Integrations](https://betterstack.com/docs/uptime/api/list-all-new-relic-integrations/)
1. [New Relic](https://betterstack.com/docs/uptime/api/list-all-new-relic-integrations/)
2. [Datadog](https://betterstack.com/docs/uptime/api/list-all-datadog-integrations/)
3. [AWS CloudWatch](https://betterstack.com/docs/uptime/api/list-all-aws-cloudwatch-integrations/)
4. [Microsoft Azure](https://betterstack.com/docs/uptime/api/list-all-azure-integrations/)
5. [Google Monitoring](https://betterstack.com/docs/uptime/api/list-all-google-monitoring-integrations/)
6. [Grafana](https://betterstack.com/docs/uptime/api/list-all-grafana-integrations/)
7. [Elastic](https://betterstack.com/docs/uptime/api/list-all-elastic-integrations/)
8. [Prometheus](https://betterstack.com/docs/uptime/api/list-all-prometheus-integrations/)
9. [Email](https://betterstack.com/docs/uptime/api/list-all-email-integrations/)
10. [Incoming webhooks](https://betterstack.com/docs/uptime/api/list-all-incoming-webhooks/)
11. [Atlassian Jira](https://betterstack.com/docs/uptime/api/list-all-jira-integrations/)
12. [Slack](https://betterstack.com/docs/uptime/api/list-all-slack-integrations/)
13. [Outgoing webhooks](https://betterstack.com/docs/uptime/api/list-all-outgoing-webhook-integrations/)
1. [List outgoing webhooks GET](https://betterstack.com/docs/uptime/api/list-all-outgoing-webhook-integrations/)
2. [Get outgoing webhook GET](https://betterstack.com/docs/uptime/api/single-outgoing-webhook-integration/)
3. [Create outgoing webhook POST](https://betterstack.com/docs/uptime/api/create-outgoing-webhook-integration/)
4. [Update outgoing webhook PATCH](https://betterstack.com/docs/uptime/api/update-outgoing-webhook-integration/)
5. [Remove outgoing webhook DELETE](https://betterstack.com/docs/uptime/api/delete-outgoing-webhook-integration/)
6. [Response attributes](https://betterstack.com/docs/uptime/api/outgoing-webhook-integrations-response-params/)
14. [Splunk On-Call](https://betterstack.com/docs/uptime/api/list-all-splunk-on-call-integrations/)
15. [PagerDuty](https://betterstack.com/docs/uptime/api/list-all-pagerduty-integrations/)
16. [Catalog](https://betterstack.com/docs/uptime/api/catalog-integrations-relations/)
8. [Team members](https://betterstack.com/docs/uptime/api/team-members/list/)
List outgoing webhooks
======================
Returns a list of all your Outgoing Webhook integrations. This endpoint [supports pagination](https://betterstack.com/docs/uptime/api/pagination/)
.
GET https://uptime.betterstack.com/api/v2/outgoing-webhooks
Query parameters
team\_name
string
Filter outgoing webhooks belonging to a specified team when using [global API token](https://betterstack.com/docs/uptime/api/getting-started-with-uptime-api/#get-a-global-api-token)
.
Headers
Authorization
required string
Bearer `$TOKEN`
200
Returns list of existing Outgoing Webhook integrations
Response body
{
"data": [\
{\
"id": "16",\
"type": "outgoing_webhook",\
"attributes": {\
"name": "test",\
"url": "https://example.com",\
"trigger_type": "on_call_change",\
"team_name": "My team"\
},\
"relationships": {\
"custom_webhook_template": {\
"data": null\
}\
}\
},\
{\
"id": "17",\
"type": "outgoing_webhook",\
"attributes": {\
"name": "test with custom template",\
"url": "https://example.com",\
"trigger_type": "incident_change",\
"team_name": "My team",\
"on_incident_started": true,\
"on_incident_acknowledged": false,\
"on_incident_resolved": true\
},\
"relationships": {\
"custom_webhook_template": {\
"data": {\
"id": "18",\
"type": "custom_webhook_template"\
}\
}\
}\
}\
],
"included": [\
{\
"id": "18",\
"type": "custom_webhook_template",\
"attributes": {\
"http_method": "post",\
"headers_template": [\
{\
"name": "Content-Type",\
"value": "application/json"\
},\
{\
"name": "X-My-Header",\
"value": "my-value"\
}\
],\
"body_template": "{\"data\":{\"id\":\"$INCIDENT_ID\",\"type\":\"incident\",\"hello\":\"world\",\"attributes\":{\"name\":\"$NAME\",\"url\":\"$URL\",\"http_method\":\"$HTTP_METHOD\",\"cause\":\"$CAUSE\",\"started_at\":\"$STARTED_AT\",\"acknowledged_at\":\"$ACKNOWLEDGED_AT\",\"resolved_at\":\"$RESOLVED_AT\",\"response_content\":\"$RESPONSE_CONTENT\",\"response_url\":\"$RESPONSE_URL\",\"screenshot_url\":\"$SCREENSHOT_URL\"}}}",\
"auth_username": "user",\
"auth_password": "password"\
}\
}\
],
"pagination": {
"first": "https://uptime.betterstack.test/api/v2/outgoing-webhooks?page=1",
"last": "https://uptime.betterstack.test/api/v2/outgoing-webhooks?page=1",
"prev": null,
"next": null
}
}
#### Example cURL
Example
Copied!
curl --request GET \
--url https://uptime.betterstack.com/api/v2/outgoing-webhooks \
--header "Authorization: Bearer $TOKEN"
#### Looking for the details of a specific parameter?
Explore [the list of all Outgoing Webhook integration API parameters](https://betterstack.com/docs/uptime/api/outgoing-webhook-integrations-response-params/?utm_content=callout&utm_medium=docs-uptime&utm_source=community&utm_term=docs-uptime-api-list-all-outgoing-webhook-integrations)
.
* * *
[Previous article\
\
Response attributes](https://betterstack.com/docs/uptime/api/slack-integrations-response-params/)
[Next article\
\
Get outgoing webhook](https://betterstack.com/docs/uptime/api/single-outgoing-webhook-integration/)
### Please accept cookies
We use cookies to authenticate users, improve the product user experience, and for [personalized ads](https://business.safety.google/privacy/)
. [Learn more.](https://betterstack.com/privacy)
Deny Accept required Accept all
---
# List Datadog integrations | Better Stack Documentation
###### Explore documentation
* [Welcome to Uptime 👋](https://betterstack.com/docs/uptime/start/)
* [Frequently Asked Questions](https://betterstack.com/docs/uptime/frequently-asked-questions/)
* [On-call scheduling and alerting](https://betterstack.com/docs/uptime/api/list-all-datadog-integrations/)
1. [Get started](https://betterstack.com/docs/uptime/getting-started-with-oncall-v2/)
2. [Slack and other integrations ↗](https://betterstack.com/docs/uptime/slack/)
3. [Connecting external calendars](https://betterstack.com/docs/uptime/connecting-external-calendars/)
4. [Advanced guide](https://betterstack.com/docs/uptime/escalation-policies/)
* [Incidents](https://betterstack.com/docs/uptime/api/list-all-datadog-integrations/)
1. [Get started](https://betterstack.com/docs/uptime/working-with-incidents/)
2. [Advanced guide](https://betterstack.com/docs/uptime/post-mortems/)
3. [Reporting ↗](https://betterstack.com/docs/getting-started/team-and-account-management/reporting/)
* [Monitoring](https://betterstack.com/docs/uptime/api/list-all-datadog-integrations/)
1. [Get started](https://betterstack.com/docs/uptime/monitoring-start/)
2. [Working with monitors](https://betterstack.com/docs/uptime/bulk-importing-monitors/)
3. [Customizing monitors](https://betterstack.com/docs/uptime/naming-monitors/)
4. [Monitor types](https://betterstack.com/docs/uptime/uptime-monitor/)
* [Status pages](https://betterstack.com/docs/uptime/api/list-all-datadog-integrations/)
1. [Get started](https://betterstack.com/docs/uptime/getting-started-with-status-pages/)
2. [Advanced guide](https://betterstack.com/docs/uptime/custom-subdomain/)
* [Uptime API](https://betterstack.com/docs/uptime/api/list-all-datadog-integrations/)
1. [Getting an API token](https://betterstack.com/docs/uptime/api/getting-started-with-uptime-api/)
2. [Monitors](https://betterstack.com/docs/uptime/api/list-all-existing-monitors/)
3. [Heartbeats](https://betterstack.com/docs/uptime/api/list-all-existing-hearbeats/)
4. [On-call & incidents](https://betterstack.com/docs/uptime/api/on-call-calendar/)
5. [Status pages](https://betterstack.com/docs/uptime/api/list-all-existing-status-pages/)
6. [Metadata](https://betterstack.com/docs/uptime/api/metadata/)
7. [Integrations](https://betterstack.com/docs/uptime/api/list-all-new-relic-integrations/)
1. [New Relic](https://betterstack.com/docs/uptime/api/list-all-new-relic-integrations/)
2. [Datadog](https://betterstack.com/docs/uptime/api/list-all-datadog-integrations/)
1. [List Datadog integrations GET](https://betterstack.com/docs/uptime/api/list-all-datadog-integrations/)
2. [Get Datadog integration GET](https://betterstack.com/docs/uptime/api/single-datadog-integration/)
3. [Create Datadog integration POST](https://betterstack.com/docs/uptime/api/create-datadog-integration/)
4. [Update Datadog integration PATCH](https://betterstack.com/docs/uptime/api/update-datadog-integration/)
5. [Remove Datadog integration DELETE](https://betterstack.com/docs/uptime/api/delete-datadog-integration/)
6. [Response attributes](https://betterstack.com/docs/uptime/api/datadog-integrations-response-params/)
3. [AWS CloudWatch](https://betterstack.com/docs/uptime/api/list-all-aws-cloudwatch-integrations/)
4. [Microsoft Azure](https://betterstack.com/docs/uptime/api/list-all-azure-integrations/)
5. [Google Monitoring](https://betterstack.com/docs/uptime/api/list-all-google-monitoring-integrations/)
6. [Grafana](https://betterstack.com/docs/uptime/api/list-all-grafana-integrations/)
7. [Elastic](https://betterstack.com/docs/uptime/api/list-all-elastic-integrations/)
8. [Prometheus](https://betterstack.com/docs/uptime/api/list-all-prometheus-integrations/)
9. [Email](https://betterstack.com/docs/uptime/api/list-all-email-integrations/)
10. [Incoming webhooks](https://betterstack.com/docs/uptime/api/list-all-incoming-webhooks/)
11. [Atlassian Jira](https://betterstack.com/docs/uptime/api/list-all-jira-integrations/)
12. [Slack](https://betterstack.com/docs/uptime/api/list-all-slack-integrations/)
13. [Outgoing webhooks](https://betterstack.com/docs/uptime/api/list-all-outgoing-webhook-integrations/)
14. [Splunk On-Call](https://betterstack.com/docs/uptime/api/list-all-splunk-on-call-integrations/)
15. [PagerDuty](https://betterstack.com/docs/uptime/api/list-all-pagerduty-integrations/)
16. [Catalog](https://betterstack.com/docs/uptime/api/catalog-integrations-relations/)
8. [Team members](https://betterstack.com/docs/uptime/api/team-members/list/)
List Datadog integrations
=========================
Returns a list of all your Datadog integrations. This endpoint [supports pagination](https://betterstack.com/docs/uptime/api/pagination/)
.
GET https://uptime.betterstack.com/api/v2/datadog-integrations
Query parameters
team\_name
string
Filter Datadog integrations belonging to a specified team when using [global API token](https://betterstack.com/docs/uptime/api/getting-started-with-uptime-api/#get-a-global-api-token)
.
Headers
Authorization
required string
Bearer `$TOKEN`
200
Returns list of existing Datadog integrations
Response body
{
"data": [\
{\
"id": "37",\
"type": "datadog_integration",\
"attributes": {\
"call": false,\
"sms": false,\
"email": true,\
"team_wait": 180,\
"recovery_period": null,\
"policy_id": null,\
"push": true,\
"name": "Datadog Integration",\
"team_name": "Testing",\
"paused": false,\
"alerting_rule": "alert_and_warn",\
"webhook_url": "https://uptime.betterstack.dev/api/v1/datadog/webhook/[token]"\
}\
}\
],
"pagination": {
"first": "https://uptime.betterstack.com/api/v2/datadog-integrations?page=1",
"last": "https://uptime.betterstack.com/api/v2/datadog-integrations?page=1",
"prev": null,
"next": null
}
}
#### Example cURL
Example
Copied!
curl --request GET \
--url https://uptime.betterstack.com/api/v2/datadog-integrations \
--header "Authorization: Bearer $TOKEN"
#### Looking for the details of a specific parameter?
Explore [the list of all Datadog integration API parameters](https://betterstack.com/docs/uptime/api/datadog-integrations-response-params/?utm_content=callout&utm_medium=docs-uptime&utm_source=community&utm_term=docs-uptime-api-list-all-datadog-integrations)
.
* * *
[Previous article\
\
Response attributes](https://betterstack.com/docs/uptime/api/new-relic-integrations-response-params/)
[Next article\
\
Get Datadog integration](https://betterstack.com/docs/uptime/api/single-datadog-integration/)
### Please accept cookies
We use cookies to authenticate users, improve the product user experience, and for [personalized ads](https://business.safety.google/privacy/)
. [Learn more.](https://betterstack.com/privacy)
Deny Accept required Accept all
---
# List catalog attributes | Better Stack Documentation
###### Explore documentation
* [Welcome to Uptime 👋](https://betterstack.com/docs/uptime/start/)
* [Frequently Asked Questions](https://betterstack.com/docs/uptime/frequently-asked-questions/)
* [On-call scheduling and alerting](https://betterstack.com/docs/uptime/api/list-all-catalog-attributes/)
1. [Get started](https://betterstack.com/docs/uptime/getting-started-with-oncall-v2/)
2. [Slack and other integrations ↗](https://betterstack.com/docs/uptime/slack/)
3. [Connecting external calendars](https://betterstack.com/docs/uptime/connecting-external-calendars/)
4. [Advanced guide](https://betterstack.com/docs/uptime/escalation-policies/)
* [Incidents](https://betterstack.com/docs/uptime/api/list-all-catalog-attributes/)
1. [Get started](https://betterstack.com/docs/uptime/working-with-incidents/)
2. [Advanced guide](https://betterstack.com/docs/uptime/post-mortems/)
3. [Reporting ↗](https://betterstack.com/docs/getting-started/team-and-account-management/reporting/)
* [Monitoring](https://betterstack.com/docs/uptime/api/list-all-catalog-attributes/)
1. [Get started](https://betterstack.com/docs/uptime/monitoring-start/)
2. [Working with monitors](https://betterstack.com/docs/uptime/bulk-importing-monitors/)
3. [Customizing monitors](https://betterstack.com/docs/uptime/naming-monitors/)
4. [Monitor types](https://betterstack.com/docs/uptime/uptime-monitor/)
* [Status pages](https://betterstack.com/docs/uptime/api/list-all-catalog-attributes/)
1. [Get started](https://betterstack.com/docs/uptime/getting-started-with-status-pages/)
2. [Advanced guide](https://betterstack.com/docs/uptime/custom-subdomain/)
* [Uptime API](https://betterstack.com/docs/uptime/api/list-all-catalog-attributes/)
1. [Getting an API token](https://betterstack.com/docs/uptime/api/getting-started-with-uptime-api/)
2. [Monitors](https://betterstack.com/docs/uptime/api/list-all-existing-monitors/)
3. [Heartbeats](https://betterstack.com/docs/uptime/api/list-all-existing-hearbeats/)
4. [On-call & incidents](https://betterstack.com/docs/uptime/api/on-call-calendar/)
5. [Status pages](https://betterstack.com/docs/uptime/api/list-all-existing-status-pages/)
6. [Metadata](https://betterstack.com/docs/uptime/api/metadata/)
7. [Integrations](https://betterstack.com/docs/uptime/api/list-all-new-relic-integrations/)
1. [New Relic](https://betterstack.com/docs/uptime/api/list-all-new-relic-integrations/)
2. [Datadog](https://betterstack.com/docs/uptime/api/list-all-datadog-integrations/)
3. [AWS CloudWatch](https://betterstack.com/docs/uptime/api/list-all-aws-cloudwatch-integrations/)
4. [Microsoft Azure](https://betterstack.com/docs/uptime/api/list-all-azure-integrations/)
5. [Google Monitoring](https://betterstack.com/docs/uptime/api/list-all-google-monitoring-integrations/)
6. [Grafana](https://betterstack.com/docs/uptime/api/list-all-grafana-integrations/)
7. [Elastic](https://betterstack.com/docs/uptime/api/list-all-elastic-integrations/)
8. [Prometheus](https://betterstack.com/docs/uptime/api/list-all-prometheus-integrations/)
9. [Email](https://betterstack.com/docs/uptime/api/list-all-email-integrations/)
10. [Incoming webhooks](https://betterstack.com/docs/uptime/api/list-all-incoming-webhooks/)
11. [Atlassian Jira](https://betterstack.com/docs/uptime/api/list-all-jira-integrations/)
12. [Slack](https://betterstack.com/docs/uptime/api/list-all-slack-integrations/)
13. [Outgoing webhooks](https://betterstack.com/docs/uptime/api/list-all-outgoing-webhook-integrations/)
14. [Splunk On-Call](https://betterstack.com/docs/uptime/api/list-all-splunk-on-call-integrations/)
15. [PagerDuty](https://betterstack.com/docs/uptime/api/list-all-pagerduty-integrations/)
16. [Catalog](https://betterstack.com/docs/uptime/api/catalog-integrations-relations/)
1. [Catalog relations](https://betterstack.com/docs/uptime/api/list-all-catalog-relations/)
2. [Catalog attributes](https://betterstack.com/docs/uptime/api/list-all-catalog-attributes/)
1. [List catalog attributes GET](https://betterstack.com/docs/uptime/api/list-all-catalog-attributes/)
2. [Get catalog attribute GET](https://betterstack.com/docs/uptime/api/single-catalog-attribute/)
3. [Create catalog attribute POST](https://betterstack.com/docs/uptime/api/create-catalog-attribute/)
4. [Update catalog attribute PATCH](https://betterstack.com/docs/uptime/api/update-catalog-attribute/)
5. [Remove catalog attribute DELETE](https://betterstack.com/docs/uptime/api/delete-catalog-attribute/)
6. [Response attributes](https://betterstack.com/docs/uptime/api/catalog-attribute-response-params/)
3. [Catalog records](https://betterstack.com/docs/uptime/api/list-all-catalog-records/)
8. [Team members](https://betterstack.com/docs/uptime/api/team-members/list/)
List catalog attributes
=======================
Returns a list of all Catalog attributes for a [Catalog relation](https://betterstack.com/docs/uptime/api/list-all-catalog-relations/)
. This endpoint [supports pagination](https://betterstack.com/docs/uptime/api/pagination/)
.
GET https://uptime.betterstack.com/api/v2/catalog/relations/{relation\_id}/attributes
URL parameters
relation\_id
required string
The ID of the Catalog relation you want to get attributes for.
Headers
Authorization
required string
Bearer `$TOKEN`
200
Returns list of existing Catalog attributes
Response body
{
"data": [\
{\
"id": "56",\
"type": "catalog_attribute",\
"attributes": {\
"name": "Team",\
"primary": true,\
"position": 0\
}\
},\
{\
"id": "57",\
"type": "catalog_attribute",\
"attributes": {\
"name": "Team Lead",\
"primary": false,\
"position": 1\
}\
}\
],
"pagination": {
"first": "https://uptime.betterstack.com/api/v2/catalog/relations/37/attributes?page=1",
"last": "https://uptime.betterstack.com/api/v2/catalog/relations/37/attributes?page=1",
"prev": null,
"next": null
}
}
#### Example cURL
Example
Copied!
curl --request GET \
--url https://uptime.betterstack.com/api/v2/catalog/relations/37/attributes \
--header "Authorization: Bearer $TOKEN"
#### Looking for the details of a specific parameter?
Explore [the list of all Catalog attribute API parameters](https://betterstack.com/docs/uptime/api/catalog-attribute-response-params/?utm_content=callout&utm_medium=docs-uptime&utm_source=community&utm_term=docs-uptime-api-list-all-catalog-attributes)
* * *
[Previous article\
\
Response attributes](https://betterstack.com/docs/uptime/api/catalog-relation-response-params/)
[Next article\
\
Get catalog attribute](https://betterstack.com/docs/uptime/api/single-catalog-attribute/)
### Please accept cookies
We use cookies to authenticate users, improve the product user experience, and for [personalized ads](https://business.safety.google/privacy/)
. [Learn more.](https://betterstack.com/privacy)
Deny Accept required Accept all
---
# Get catalog attribute | Better Stack Documentation
###### Explore documentation
* [Welcome to Uptime 👋](https://betterstack.com/docs/uptime/start/)
* [Frequently Asked Questions](https://betterstack.com/docs/uptime/frequently-asked-questions/)
* [On-call scheduling and alerting](https://betterstack.com/docs/uptime/api/single-catalog-attribute/)
1. [Get started](https://betterstack.com/docs/uptime/getting-started-with-oncall-v2/)
2. [Slack and other integrations ↗](https://betterstack.com/docs/uptime/slack/)
3. [Connecting external calendars](https://betterstack.com/docs/uptime/connecting-external-calendars/)
4. [Advanced guide](https://betterstack.com/docs/uptime/escalation-policies/)
* [Incidents](https://betterstack.com/docs/uptime/api/single-catalog-attribute/)
1. [Get started](https://betterstack.com/docs/uptime/working-with-incidents/)
2. [Advanced guide](https://betterstack.com/docs/uptime/post-mortems/)
3. [Reporting ↗](https://betterstack.com/docs/getting-started/team-and-account-management/reporting/)
* [Monitoring](https://betterstack.com/docs/uptime/api/single-catalog-attribute/)
1. [Get started](https://betterstack.com/docs/uptime/monitoring-start/)
2. [Working with monitors](https://betterstack.com/docs/uptime/bulk-importing-monitors/)
3. [Customizing monitors](https://betterstack.com/docs/uptime/naming-monitors/)
4. [Monitor types](https://betterstack.com/docs/uptime/uptime-monitor/)
* [Status pages](https://betterstack.com/docs/uptime/api/single-catalog-attribute/)
1. [Get started](https://betterstack.com/docs/uptime/getting-started-with-status-pages/)
2. [Advanced guide](https://betterstack.com/docs/uptime/custom-subdomain/)
* [Uptime API](https://betterstack.com/docs/uptime/api/single-catalog-attribute/)
1. [Getting an API token](https://betterstack.com/docs/uptime/api/getting-started-with-uptime-api/)
2. [Monitors](https://betterstack.com/docs/uptime/api/list-all-existing-monitors/)
3. [Heartbeats](https://betterstack.com/docs/uptime/api/list-all-existing-hearbeats/)
4. [On-call & incidents](https://betterstack.com/docs/uptime/api/on-call-calendar/)
5. [Status pages](https://betterstack.com/docs/uptime/api/list-all-existing-status-pages/)
6. [Metadata](https://betterstack.com/docs/uptime/api/metadata/)
7. [Integrations](https://betterstack.com/docs/uptime/api/list-all-new-relic-integrations/)
1. [New Relic](https://betterstack.com/docs/uptime/api/list-all-new-relic-integrations/)
2. [Datadog](https://betterstack.com/docs/uptime/api/list-all-datadog-integrations/)
3. [AWS CloudWatch](https://betterstack.com/docs/uptime/api/list-all-aws-cloudwatch-integrations/)
4. [Microsoft Azure](https://betterstack.com/docs/uptime/api/list-all-azure-integrations/)
5. [Google Monitoring](https://betterstack.com/docs/uptime/api/list-all-google-monitoring-integrations/)
6. [Grafana](https://betterstack.com/docs/uptime/api/list-all-grafana-integrations/)
7. [Elastic](https://betterstack.com/docs/uptime/api/list-all-elastic-integrations/)
8. [Prometheus](https://betterstack.com/docs/uptime/api/list-all-prometheus-integrations/)
9. [Email](https://betterstack.com/docs/uptime/api/list-all-email-integrations/)
10. [Incoming webhooks](https://betterstack.com/docs/uptime/api/list-all-incoming-webhooks/)
11. [Atlassian Jira](https://betterstack.com/docs/uptime/api/list-all-jira-integrations/)
12. [Slack](https://betterstack.com/docs/uptime/api/list-all-slack-integrations/)
13. [Outgoing webhooks](https://betterstack.com/docs/uptime/api/list-all-outgoing-webhook-integrations/)
14. [Splunk On-Call](https://betterstack.com/docs/uptime/api/list-all-splunk-on-call-integrations/)
15. [PagerDuty](https://betterstack.com/docs/uptime/api/list-all-pagerduty-integrations/)
16. [Catalog](https://betterstack.com/docs/uptime/api/catalog-integrations-relations/)
1. [Catalog relations](https://betterstack.com/docs/uptime/api/list-all-catalog-relations/)
2. [Catalog attributes](https://betterstack.com/docs/uptime/api/list-all-catalog-attributes/)
1. [List catalog attributes GET](https://betterstack.com/docs/uptime/api/list-all-catalog-attributes/)
2. [Get catalog attribute GET](https://betterstack.com/docs/uptime/api/single-catalog-attribute/)
3. [Create catalog attribute POST](https://betterstack.com/docs/uptime/api/create-catalog-attribute/)
4. [Update catalog attribute PATCH](https://betterstack.com/docs/uptime/api/update-catalog-attribute/)
5. [Remove catalog attribute DELETE](https://betterstack.com/docs/uptime/api/delete-catalog-attribute/)
6. [Response attributes](https://betterstack.com/docs/uptime/api/catalog-attribute-response-params/)
3. [Catalog records](https://betterstack.com/docs/uptime/api/list-all-catalog-records/)
8. [Team members](https://betterstack.com/docs/uptime/api/team-members/list/)
Get catalog attribute
=====================
Returns a single Catalog attribute by ID.
GET https://uptime.betterstack.com/api/v2/catalog/relations/{relation\_id}/attributes/{attribute\_id}
URL parameters
relation\_id
required string
The ID of the related Catalog relation.
attribute\_id
required string
The ID of the Catalog attribute you want to get.
Headers
Authorization
required string
Bearer `$TOKEN`
200
Returns a single Catalog attribute
Response body
{
"data": {
"id": "56",
"type": "catalog_attribute",
"attributes": {
"name": "Team",
"primary": true,
"position": 0
}
}
}
#### Example cURL
Example
Copied!
curl --request GET \
--url https://uptime.betterstack.com/api/v2/catalog/relations/37/attributes/56 \
--header "Authorization: Bearer $TOKEN"
#### Looking for the details of a specific parameter?
Explore [the list of all Catalog attribute API parameters](https://betterstack.com/docs/uptime/api/catalog-attribute-response-params/?utm_content=callout&utm_medium=docs-uptime&utm_source=community&utm_term=docs-uptime-api-single-catalog-attribute)
* * *
[Previous article\
\
List catalog attributes](https://betterstack.com/docs/uptime/api/list-all-catalog-attributes/)
[Next article\
\
Create catalog attribute](https://betterstack.com/docs/uptime/api/create-catalog-attribute/)
### Please accept cookies
We use cookies to authenticate users, improve the product user experience, and for [personalized ads](https://business.safety.google/privacy/)
. [Learn more.](https://betterstack.com/privacy)
Deny Accept required Accept all
---
# List Elastic integrations | Better Stack Documentation
###### Explore documentation
* [Welcome to Uptime 👋](https://betterstack.com/docs/uptime/start/)
* [Frequently Asked Questions](https://betterstack.com/docs/uptime/frequently-asked-questions/)
* [On-call scheduling and alerting](https://betterstack.com/docs/uptime/api/list-all-elastic-integrations/)
1. [Get started](https://betterstack.com/docs/uptime/getting-started-with-oncall-v2/)
2. [Slack and other integrations ↗](https://betterstack.com/docs/uptime/slack/)
3. [Connecting external calendars](https://betterstack.com/docs/uptime/connecting-external-calendars/)
4. [Advanced guide](https://betterstack.com/docs/uptime/escalation-policies/)
* [Incidents](https://betterstack.com/docs/uptime/api/list-all-elastic-integrations/)
1. [Get started](https://betterstack.com/docs/uptime/working-with-incidents/)
2. [Advanced guide](https://betterstack.com/docs/uptime/post-mortems/)
3. [Reporting ↗](https://betterstack.com/docs/getting-started/team-and-account-management/reporting/)
* [Monitoring](https://betterstack.com/docs/uptime/api/list-all-elastic-integrations/)
1. [Get started](https://betterstack.com/docs/uptime/monitoring-start/)
2. [Working with monitors](https://betterstack.com/docs/uptime/bulk-importing-monitors/)
3. [Customizing monitors](https://betterstack.com/docs/uptime/naming-monitors/)
4. [Monitor types](https://betterstack.com/docs/uptime/uptime-monitor/)
* [Status pages](https://betterstack.com/docs/uptime/api/list-all-elastic-integrations/)
1. [Get started](https://betterstack.com/docs/uptime/getting-started-with-status-pages/)
2. [Advanced guide](https://betterstack.com/docs/uptime/custom-subdomain/)
* [Uptime API](https://betterstack.com/docs/uptime/api/list-all-elastic-integrations/)
1. [Getting an API token](https://betterstack.com/docs/uptime/api/getting-started-with-uptime-api/)
2. [Monitors](https://betterstack.com/docs/uptime/api/list-all-existing-monitors/)
3. [Heartbeats](https://betterstack.com/docs/uptime/api/list-all-existing-hearbeats/)
4. [On-call & incidents](https://betterstack.com/docs/uptime/api/on-call-calendar/)
5. [Status pages](https://betterstack.com/docs/uptime/api/list-all-existing-status-pages/)
6. [Metadata](https://betterstack.com/docs/uptime/api/metadata/)
7. [Integrations](https://betterstack.com/docs/uptime/api/list-all-new-relic-integrations/)
1. [New Relic](https://betterstack.com/docs/uptime/api/list-all-new-relic-integrations/)
2. [Datadog](https://betterstack.com/docs/uptime/api/list-all-datadog-integrations/)
3. [AWS CloudWatch](https://betterstack.com/docs/uptime/api/list-all-aws-cloudwatch-integrations/)
4. [Microsoft Azure](https://betterstack.com/docs/uptime/api/list-all-azure-integrations/)
5. [Google Monitoring](https://betterstack.com/docs/uptime/api/list-all-google-monitoring-integrations/)
6. [Grafana](https://betterstack.com/docs/uptime/api/list-all-grafana-integrations/)
7. [Elastic](https://betterstack.com/docs/uptime/api/list-all-elastic-integrations/)
1. [List Elastic integrations GET](https://betterstack.com/docs/uptime/api/list-all-elastic-integrations/)
2. [Get Elastic integration GET](https://betterstack.com/docs/uptime/api/single-elastic-integration/)
3. [Create Elastic integration POST](https://betterstack.com/docs/uptime/api/create-elastic-integration/)
4. [Update Elastic integration PATCH](https://betterstack.com/docs/uptime/api/update-elastic-integration/)
5. [Remove Elastic integration DELETE](https://betterstack.com/docs/uptime/api/delete-elastic-integration/)
6. [Response attributes](https://betterstack.com/docs/uptime/api/grafana-elastic-response-params/)
8. [Prometheus](https://betterstack.com/docs/uptime/api/list-all-prometheus-integrations/)
9. [Email](https://betterstack.com/docs/uptime/api/list-all-email-integrations/)
10. [Incoming webhooks](https://betterstack.com/docs/uptime/api/list-all-incoming-webhooks/)
11. [Atlassian Jira](https://betterstack.com/docs/uptime/api/list-all-jira-integrations/)
12. [Slack](https://betterstack.com/docs/uptime/api/list-all-slack-integrations/)
13. [Outgoing webhooks](https://betterstack.com/docs/uptime/api/list-all-outgoing-webhook-integrations/)
14. [Splunk On-Call](https://betterstack.com/docs/uptime/api/list-all-splunk-on-call-integrations/)
15. [PagerDuty](https://betterstack.com/docs/uptime/api/list-all-pagerduty-integrations/)
16. [Catalog](https://betterstack.com/docs/uptime/api/catalog-integrations-relations/)
8. [Team members](https://betterstack.com/docs/uptime/api/team-members/list/)
List Elastic integrations
=========================
Returns a list of all your Elastic integrations. This endpoint [supports pagination](https://betterstack.com/docs/uptime/api/pagination/)
.
GET https://uptime.betterstack.com/api/v2/elastic-integrations
Query parameters
team\_name
string
Filter Elastic integrations belonging to a specified team when using [global API token](https://betterstack.com/docs/uptime/api/getting-started-with-uptime-api/#get-a-global-api-token)
.
Headers
Authorization
required string
Bearer `$TOKEN`
200
Returns list of existing Elastic integrations
Response body
{
"data": [\
{\
"id": "37",\
"type": "elastic_integration",\
"attributes": {\
"call": false,\
"sms": false,\
"email": true,\
"team_wait": 180,\
"recovery_period": null,\
"policy_id": null,\
"push": true,\
"name": "Elastic Integration",\
"paused": false,\
"webhook_url": "https://uptime.betterstack.dev/api/v1/elastic/webhook/[token]",\
"team_name": "Testing"\
}\
}\
],
"pagination": {
"first": "https://uptime.betterstack.com/api/v2/elastic-integrations?page=1",
"last": "https://uptime.betterstack.com/api/v2/elastic-integrations?page=1",
"prev": null,
"next": null
}
}
#### Example cURL
Example
Copied!
curl --request GET \
--url https://uptime.betterstack.com/api/v2/elastic-integrations \
--header "Authorization: Bearer $TOKEN"
#### Looking for the details of a specific parameter?
Explore [the list of all Elastic integration API parameters](https://betterstack.com/docs/uptime/api/grafana-elastic-response-params/?utm_content=callout&utm_medium=docs-uptime&utm_source=community&utm_term=docs-uptime-api-list-all-elastic-integrations)
.
* * *
[Previous article\
\
Response attributes](https://betterstack.com/docs/uptime/api/grafana-integrations-response-params/)
[Next article\
\
Get Elastic integration](https://betterstack.com/docs/uptime/api/single-elastic-integration/)
### Please accept cookies
We use cookies to authenticate users, improve the product user experience, and for [personalized ads](https://business.safety.google/privacy/)
. [Learn more.](https://betterstack.com/privacy)
Deny Accept required Accept all
---
# List Grafana integrations | Better Stack Documentation
###### Explore documentation
* [Welcome to Uptime 👋](https://betterstack.com/docs/uptime/start/)
* [Frequently Asked Questions](https://betterstack.com/docs/uptime/frequently-asked-questions/)
* [On-call scheduling and alerting](https://betterstack.com/docs/uptime/api/list-all-grafana-integrations/)
1. [Get started](https://betterstack.com/docs/uptime/getting-started-with-oncall-v2/)
2. [Slack and other integrations ↗](https://betterstack.com/docs/uptime/slack/)
3. [Connecting external calendars](https://betterstack.com/docs/uptime/connecting-external-calendars/)
4. [Advanced guide](https://betterstack.com/docs/uptime/escalation-policies/)
* [Incidents](https://betterstack.com/docs/uptime/api/list-all-grafana-integrations/)
1. [Get started](https://betterstack.com/docs/uptime/working-with-incidents/)
2. [Advanced guide](https://betterstack.com/docs/uptime/post-mortems/)
3. [Reporting ↗](https://betterstack.com/docs/getting-started/team-and-account-management/reporting/)
* [Monitoring](https://betterstack.com/docs/uptime/api/list-all-grafana-integrations/)
1. [Get started](https://betterstack.com/docs/uptime/monitoring-start/)
2. [Working with monitors](https://betterstack.com/docs/uptime/bulk-importing-monitors/)
3. [Customizing monitors](https://betterstack.com/docs/uptime/naming-monitors/)
4. [Monitor types](https://betterstack.com/docs/uptime/uptime-monitor/)
* [Status pages](https://betterstack.com/docs/uptime/api/list-all-grafana-integrations/)
1. [Get started](https://betterstack.com/docs/uptime/getting-started-with-status-pages/)
2. [Advanced guide](https://betterstack.com/docs/uptime/custom-subdomain/)
* [Uptime API](https://betterstack.com/docs/uptime/api/list-all-grafana-integrations/)
1. [Getting an API token](https://betterstack.com/docs/uptime/api/getting-started-with-uptime-api/)
2. [Monitors](https://betterstack.com/docs/uptime/api/list-all-existing-monitors/)
3. [Heartbeats](https://betterstack.com/docs/uptime/api/list-all-existing-hearbeats/)
4. [On-call & incidents](https://betterstack.com/docs/uptime/api/on-call-calendar/)
5. [Status pages](https://betterstack.com/docs/uptime/api/list-all-existing-status-pages/)
6. [Metadata](https://betterstack.com/docs/uptime/api/metadata/)
7. [Integrations](https://betterstack.com/docs/uptime/api/list-all-new-relic-integrations/)
1. [New Relic](https://betterstack.com/docs/uptime/api/list-all-new-relic-integrations/)
2. [Datadog](https://betterstack.com/docs/uptime/api/list-all-datadog-integrations/)
3. [AWS CloudWatch](https://betterstack.com/docs/uptime/api/list-all-aws-cloudwatch-integrations/)
4. [Microsoft Azure](https://betterstack.com/docs/uptime/api/list-all-azure-integrations/)
5. [Google Monitoring](https://betterstack.com/docs/uptime/api/list-all-google-monitoring-integrations/)
6. [Grafana](https://betterstack.com/docs/uptime/api/list-all-grafana-integrations/)
1. [List Grafana integrations GET](https://betterstack.com/docs/uptime/api/list-all-grafana-integrations/)
2. [Get Grafana integration GET](https://betterstack.com/docs/uptime/api/single-grafana-integration/)
3. [Create Grafana integration POST](https://betterstack.com/docs/uptime/api/create-grafana-integration/)
4. [Update Grafana integration PATCH](https://betterstack.com/docs/uptime/api/update-grafana-integration/)
5. [Remove Grafana integration DELETE](https://betterstack.com/docs/uptime/api/deletegrafana-integration/)
6. [Response attributes](https://betterstack.com/docs/uptime/api/grafana-integrations-response-params/)
7. [Elastic](https://betterstack.com/docs/uptime/api/list-all-elastic-integrations/)
8. [Prometheus](https://betterstack.com/docs/uptime/api/list-all-prometheus-integrations/)
9. [Email](https://betterstack.com/docs/uptime/api/list-all-email-integrations/)
10. [Incoming webhooks](https://betterstack.com/docs/uptime/api/list-all-incoming-webhooks/)
11. [Atlassian Jira](https://betterstack.com/docs/uptime/api/list-all-jira-integrations/)
12. [Slack](https://betterstack.com/docs/uptime/api/list-all-slack-integrations/)
13. [Outgoing webhooks](https://betterstack.com/docs/uptime/api/list-all-outgoing-webhook-integrations/)
14. [Splunk On-Call](https://betterstack.com/docs/uptime/api/list-all-splunk-on-call-integrations/)
15. [PagerDuty](https://betterstack.com/docs/uptime/api/list-all-pagerduty-integrations/)
16. [Catalog](https://betterstack.com/docs/uptime/api/catalog-integrations-relations/)
8. [Team members](https://betterstack.com/docs/uptime/api/team-members/list/)
List Grafana integrations
=========================
Returns a list of all your Grafana integrations. This endpoint [supports pagination](https://betterstack.com/docs/uptime/api/pagination/)
.
GET https://uptime.betterstack.com/api/v2/grafana-integrations
Query parameters
team\_name
string
Filter integrations belonging to a specified team when using [global API token](https://betterstack.com/docs/uptime/api/getting-started-with-uptime-api/#get-a-global-api-token)
.
Headers
Authorization
required string
Bearer `$TOKEN`
200
Returns list of existing Grafana integrations
Response body
{
"data": [\
{\
"id": "37",\
"type": "grafana_integration",\
"attributes": {\
"call": false,\
"sms": false,\
"email": true,\
"team_wait": 180,\
"recovery_period": null,\
"policy_id": null,\
"push": true,\
"name": "Grafana Integration",\
"paused": false,\
"webhook_url": "https://uptime.betterstack.dev/api/v1/grafana/webhook/[token]",\
"team_name": "Testing"\
}\
}\
],
"pagination": {
"first": "https://uptime.betterstack.com/api/v2/grafana-integrations?page=1",
"last": "https://uptime.betterstack.com/api/v2/grafana-integrations?page=1",
"prev": null,
"next": null
}
}
#### Example cURL
Example
Copied!
curl --request GET \
--url https://uptime.betterstack.com/api/v2/grafana-integrations \
--header "Authorization: Bearer $TOKEN"
#### Looking for the details of a specific parameter?
Explore [the list of all Grafana integration API parameters](https://betterstack.com/docs/uptime/api/grafana-integrations-response-params/?utm_content=callout&utm_medium=docs-uptime&utm_source=community&utm_term=docs-uptime-api-list-all-grafana-integrations)
.
* * *
[Previous article\
\
Response attributes](https://betterstack.com/docs/uptime/api/google-monitoring-integrations-response-params/)
[Next article\
\
Get Grafana integration](https://betterstack.com/docs/uptime/api/single-grafana-integration/)
### Please accept cookies
We use cookies to authenticate users, improve the product user experience, and for [personalized ads](https://business.safety.google/privacy/)
. [Learn more.](https://betterstack.com/privacy)
Deny Accept required Accept all
---
# JavaScript advanced usage | Better Stack Documentation
###### Explore documentation
* [Welcome to Telemetry 👋](https://betterstack.com/docs/logs/start/)
* [Quick start guide](https://betterstack.com/docs/logs/logging-start/)
* [Wide events vs. metrics](https://betterstack.com/docs/logs/wide-events-time-series/)
* [Ingesting data](https://betterstack.com/docs/logs/javascript/logging/)
1. [Better Stack collector](https://betterstack.com/docs/logs/collector/)
2. [Vector](https://betterstack.com/docs/logs/vector/)
3. [OpenTelemetry](https://betterstack.com/docs/logs/open-telemetry/)
4. [Ingesting via HTTP API](https://betterstack.com/docs/logs/ingesting-data/http/logs/)
5. [Ingesting metrics](https://betterstack.com/docs/logs/ingesting-data/metrics/prometheus-scrape/)
6. [Ingesting logs](https://betterstack.com/docs/logs/ingesting-data/logs/docker-kubernetes/)
1. [Docker & Kubernetes](https://betterstack.com/docs/logs/docker/)
2. [Operating systems](https://betterstack.com/docs/logs/ubuntu/)
3. [Log forwarders](https://betterstack.com/docs/logs/metrics/vector/)
4. [Programming languages](https://betterstack.com/docs/logs/javascript/)
1. [JavaScript & Node.js](https://betterstack.com/docs/logs/javascript/)
1. [Quick start guide](https://betterstack.com/docs/logs/javascript/install/)
2. [Advanced usage](https://betterstack.com/docs/logs/javascript/logging/)
3. [Frameworks](https://betterstack.com/docs/logs/javascript/frameworks/)
2. [Python](https://betterstack.com/docs/logs/python/)
3. [Ruby](https://betterstack.com/docs/logs/ruby-and-rails/)
4. [PHP](https://betterstack.com/docs/logs/php/)
5. [Java](https://betterstack.com/docs/logs/java/)
6. [.NET](https://betterstack.com/docs/logs/net-c/)
7. [Go](https://betterstack.com/docs/logs/go/)
8. [Erlang](https://betterstack.com/docs/logs/erlang/)
5. [Cloud platforms](https://betterstack.com/docs/logs/aws/)
6. [Web servers & Load balancers](https://betterstack.com/docs/logs/nginx/)
7. [Databases & queues](https://betterstack.com/docs/logs/postgresql/)
8. [Storage](https://betterstack.com/docs/logs/minio/)
7. [Migrating to Better Stack](https://betterstack.com/docs/logs/datadog-agent/)
* [Using the product](https://betterstack.com/docs/logs/javascript/logging/)
1. [AI SRE ↗](https://betterstack.com/demos/ai-sre/)
2. [MCP server ↗](https://betterstack.com/docs/getting-started/integrations/mcp/)
3. [Transforming ingested data](https://betterstack.com/docs/logs/using-logtail/transforming-ingested-data/logs-vrl/)
4. [Querying data](https://betterstack.com/docs/logs/using-logtail/live-tail-query-language/)
5. [Tracing](https://betterstack.com/docs/logs/tracing/)
6. [Alerts](https://betterstack.com/docs/logs/dashboards/alerts/)
* [Telemetry API](https://betterstack.com/docs/logs/javascript/logging/)
1. [Getting an API token](https://betterstack.com/docs/logs/api/getting-started/)
2. [Sources & collectors](https://betterstack.com/docs/logs/api/list-all-existing-sources/)
3. [Dashboards](https://betterstack.com/docs/logs/api/dashboards/list/)
4. [Explorations](https://betterstack.com/docs/logs/api/explorations/list/)
5. [Alerts API](https://betterstack.com/docs/logs/api/alerts/list/)
6. [Connections API](https://betterstack.com/docs/logs/api/connections/list/)
7. [Query API ↗](https://betterstack.com/docs/logs/query-api/connect-remotely/)
* [Alternative to](https://betterstack.com/docs/logs/javascript/logging/)
1. [Lightstep](https://betterstack.com/docs/logs/alternative-to/lightstep/)
JavaScript advanced usage
=========================
Get started with Logtail in your JavaScript application using this overview of the Logtail logger.
**New to logging?** See the [Intro guide to Node.js logging](https://betterstack.com/community/guides/logging/how-to-start-logging-with-node-js/?utm_content=callout&utm_medium=docs-logs&utm_source=community&utm_term=docs-logs-javascript-and-node-log-types)
and the [Best practices for logging in Node.js](https://betterstack.com/community/guides/logging/nodejs-logging-best-practices/?utm_content=callout&utm_medium=docs-logs&utm_source=community&utm_term=docs-logs-javascript-and-node-log-types)
.
**Not using Logtail yet?** Check out the [Quick start guide](https://betterstack.com/docs/logs/javascript/install/?utm_content=callout&utm_medium=docs-logs&utm_source=community&utm_term=docs-logs-javascript-and-node-log-types)
to install and set up the Logtail JavaScript client.
Log levels
----------
Logtail JavaScript client instance provides 4 logging methods for the 4 default log levels. The log levels and their methods are:
* **DEBUG** - Send debug messages with `debug()`
* **INFO** - Keep track of your app's progress with `info()`
* **WARN** - Report non-critical issues with `warn()`
* **ERROR** - Log serious problems with `error()`
Logging example
---------------
To send a log message of selected log level, use the corresponding method. In this example, we send the **DEBUG** level log and **ERROR** level log:
Send logs to Logtail
Copied!
// Send DEBUG level log using the debug() method
logtail.debug("I am using Logtail!");
// Send ERROR level log using the error() method
logtail.error("Oops! An runtime ERROR occurred!");
The Logtail client automatically adds context to the logs.
The following JSON output is sent to Logtail:
Output
{
"dt":"2022-02-01 12:01:10.127 UTC",
"context":{
"runtime":{
"column_integer":"21",
"file_string":"node_modules/@logtail/core/dist/cjs/base.js",
"line_integer":"141",
"type_string":"Node",
"function_string":"debug",
"method_string":"debug"
},
"system":{
"main_file_string":"/mnt/d/js_logtail/index.js",
"pid_integer":"4193"
}
},
"level_string":"debug",
"message_string":"I am using Logtail!"
}
{
"dt":"2022-02-01 12:01:10.127 UTC",
"context":{
"runtime":{
"column_integer":"8",
"file_string":"index.js",
"line_integer":"40",
"type_string":"Object"
},
"system":{
"main_file_string":"/mnt/d/js_logtail/index.js",
"pid_integer":"4193"
}
},
"level_string":"error",
"message_string":"Oops! A runtime ERROR occurred!"
}
Logging structured data
-----------------------
Quickly troubleshoot your application by logging structured data. Pass an object as a second argument to any logging method, like in the example below:
Send structured logs to Logtail
Copied!
logtail.warn("Something is not quite right.", {
user: {
username: "John Doe",
email: "john@example.com"
},
additional_info: {
tried_accessing: "/url/of/error"
}
});
This creates the following JSON output:
Output
{
"dt":"2022-02-01 12:01:10.127 UTC",
"context":{
"runtime":{
"column_integer":"8",
"file_string":"index.js",
"line_integer":"29",
"type_string":"Object"
},
"system":{
"main_file_string":"/mnt/d/js_logtail/index.js",
"pid_integer":"4193"
}
},
"level_string":"warn",
"message_string":"Something is not quite right.",
"additional_info":{
"tried_accessing_string":"/url/of/error"
},
"user":{
"email_string":"someuser@example.com",
"username_string":"someuser"
}
}
Middleware
----------
You can intercept every logged item and modify it before it's pushed to Logtail. This could be useful, for example, for adding the current user's ID to the log or for filtering:
Enrich logs Filter logs
Copied!
// Intercept the log and add userId to the content
async function enrichLogs(log) {
return {
...log,
userId: getCurrentUserId()
};
}
// Tell Logtail client to use the enriching function
logtail.use(enrichLogs);
// Ignore any log with "[ignore]" in its message
async function filterLogs(log) {
const shouldIgnore = log.message?.includes("[ignore]");
return shouldIgnore ? null : log;
}
// Tell Logtail client to use the filtering function
logtail.use(filterLogs);
### TypeScript
If you're using Logtail in a TypeScript codebase, you can take advantage of our types. You could write the enriching middleware function with types like this:
Enrich logs in TypeScript
Copied!
import { ILogtailLog } from "@logtail/types";
async function enrichLogs(log: ILogtailLog): Promise {
return {
...log,
userId: getCurrentUserId()
};
}
* * *
[Previous article\
\
JavaScript quick start guide](https://betterstack.com/docs/logs/javascript/install/)
[Next article\
\
JavaScript logging frameworks](https://betterstack.com/docs/logs/javascript/frameworks/)
###### On this page
* [Log levels](https://betterstack.com/docs/logs/javascript/logging/#log-levels)
* [Logging example](https://betterstack.com/docs/logs/javascript/logging/#logging-example)
* [Logging structured data](https://betterstack.com/docs/logs/javascript/logging/#logging-structured-data)
* [Middleware](https://betterstack.com/docs/logs/javascript/logging/#middleware)
### Please accept cookies
We use cookies to authenticate users, improve the product user experience, and for [personalized ads](https://business.safety.google/privacy/)
. [Learn more.](https://betterstack.com/privacy)
Deny Accept required Accept all
---
# Update outgoing webhook | Better Stack Documentation
###### Explore documentation
* [Welcome to Uptime 👋](https://betterstack.com/docs/uptime/start/)
* [Frequently Asked Questions](https://betterstack.com/docs/uptime/frequently-asked-questions/)
* [On-call scheduling and alerting](https://betterstack.com/docs/uptime/api/update-outgoing-webhook-integration/)
1. [Get started](https://betterstack.com/docs/uptime/getting-started-with-oncall-v2/)
2. [Slack and other integrations ↗](https://betterstack.com/docs/uptime/slack/)
3. [Connecting external calendars](https://betterstack.com/docs/uptime/connecting-external-calendars/)
4. [Advanced guide](https://betterstack.com/docs/uptime/escalation-policies/)
* [Incidents](https://betterstack.com/docs/uptime/api/update-outgoing-webhook-integration/)
1. [Get started](https://betterstack.com/docs/uptime/working-with-incidents/)
2. [Advanced guide](https://betterstack.com/docs/uptime/post-mortems/)
3. [Reporting ↗](https://betterstack.com/docs/getting-started/team-and-account-management/reporting/)
* [Monitoring](https://betterstack.com/docs/uptime/api/update-outgoing-webhook-integration/)
1. [Get started](https://betterstack.com/docs/uptime/monitoring-start/)
2. [Working with monitors](https://betterstack.com/docs/uptime/bulk-importing-monitors/)
3. [Customizing monitors](https://betterstack.com/docs/uptime/naming-monitors/)
4. [Monitor types](https://betterstack.com/docs/uptime/uptime-monitor/)
* [Status pages](https://betterstack.com/docs/uptime/api/update-outgoing-webhook-integration/)
1. [Get started](https://betterstack.com/docs/uptime/getting-started-with-status-pages/)
2. [Advanced guide](https://betterstack.com/docs/uptime/custom-subdomain/)
* [Uptime API](https://betterstack.com/docs/uptime/api/update-outgoing-webhook-integration/)
1. [Getting an API token](https://betterstack.com/docs/uptime/api/getting-started-with-uptime-api/)
2. [Monitors](https://betterstack.com/docs/uptime/api/list-all-existing-monitors/)
3. [Heartbeats](https://betterstack.com/docs/uptime/api/list-all-existing-hearbeats/)
4. [On-call & incidents](https://betterstack.com/docs/uptime/api/on-call-calendar/)
5. [Status pages](https://betterstack.com/docs/uptime/api/list-all-existing-status-pages/)
6. [Metadata](https://betterstack.com/docs/uptime/api/metadata/)
7. [Integrations](https://betterstack.com/docs/uptime/api/list-all-new-relic-integrations/)
1. [New Relic](https://betterstack.com/docs/uptime/api/list-all-new-relic-integrations/)
2. [Datadog](https://betterstack.com/docs/uptime/api/list-all-datadog-integrations/)
3. [AWS CloudWatch](https://betterstack.com/docs/uptime/api/list-all-aws-cloudwatch-integrations/)
4. [Microsoft Azure](https://betterstack.com/docs/uptime/api/list-all-azure-integrations/)
5. [Google Monitoring](https://betterstack.com/docs/uptime/api/list-all-google-monitoring-integrations/)
6. [Grafana](https://betterstack.com/docs/uptime/api/list-all-grafana-integrations/)
7. [Elastic](https://betterstack.com/docs/uptime/api/list-all-elastic-integrations/)
8. [Prometheus](https://betterstack.com/docs/uptime/api/list-all-prometheus-integrations/)
9. [Email](https://betterstack.com/docs/uptime/api/list-all-email-integrations/)
10. [Incoming webhooks](https://betterstack.com/docs/uptime/api/list-all-incoming-webhooks/)
11. [Atlassian Jira](https://betterstack.com/docs/uptime/api/list-all-jira-integrations/)
12. [Slack](https://betterstack.com/docs/uptime/api/list-all-slack-integrations/)
13. [Outgoing webhooks](https://betterstack.com/docs/uptime/api/list-all-outgoing-webhook-integrations/)
1. [List outgoing webhooks GET](https://betterstack.com/docs/uptime/api/list-all-outgoing-webhook-integrations/)
2. [Get outgoing webhook GET](https://betterstack.com/docs/uptime/api/single-outgoing-webhook-integration/)
3. [Create outgoing webhook POST](https://betterstack.com/docs/uptime/api/create-outgoing-webhook-integration/)
4. [Update outgoing webhook PATCH](https://betterstack.com/docs/uptime/api/update-outgoing-webhook-integration/)
5. [Remove outgoing webhook DELETE](https://betterstack.com/docs/uptime/api/delete-outgoing-webhook-integration/)
6. [Response attributes](https://betterstack.com/docs/uptime/api/outgoing-webhook-integrations-response-params/)
14. [Splunk On-Call](https://betterstack.com/docs/uptime/api/list-all-splunk-on-call-integrations/)
15. [PagerDuty](https://betterstack.com/docs/uptime/api/list-all-pagerduty-integrations/)
16. [Catalog](https://betterstack.com/docs/uptime/api/catalog-integrations-relations/)
8. [Team members](https://betterstack.com/docs/uptime/api/team-members/list/)
Update outgoing webhook
=======================
Update an existing Outgoing Webhook integration. Send only the parameters you wish to change (eg. `name`).
PATCH https://uptime.betterstack.com/api/v2/outgoing-webhooks/{outgoing\_webhook\_id}
URL parameters
outgoing\_webhook\_id
required string
The ID of the Outgoing Webhook integration you want to update
Headers
Authorization
required string
Bearer `$TOKEN`
Content\_Type
string
application/json
Body parameters
name
string
The name of the Outgoing Webhook integration that you can see in the dashboard.
url
string
The URL of the Outgoing Webhook integration.
on\_incident\_started
boolean
Whether to trigger the Outgoing Webhook integration when an incident starts. Only applicable if `trigger_type` is `incident_change`.
on\_incident\_acknowledged
boolean
Whether to trigger the Outgoing Webhook integration when an incident is acknowledged. Only applicable if `trigger_type` is `incident_change`.
on\_incident\_resolved
boolean
Whether to trigger the Outgoing Webhook integration when an incident is resolved. Only applicable if `trigger_type` is `incident_change`.
on\_incident\_reopened
boolean
Whether to trigger the Outgoing Webhook integration when an incident is reopened. Only applicable if `trigger_type` is `incident_change`.
custom\_webhook\_template\_attributes
object
Use this to specify the custom webhook template attributes. See below.
custom\_webhook\_template\_attributes.http\_method
string
The HTTP method to use when sending the webhook. Possible values are `get`, `post`, `put`, `patch` and `head`.
custom\_webhook\_template\_attributes.auth\_username
string
The username to use for basic authentication.
custom\_webhook\_template\_attributes.auth\_password
string
The password to use for basic authentication.
custom\_webhook\_template\_attributes.headers\_template
array
The headers to send with the webhook.
Each header is an object with \`name\` and \`value\` keys.
Copied!
{
"custom_webhook_template_attributes": {
"headers_template": [\
{ "name": "Content-Type", "value": "application/json" },\
{ "name": "X-Custom-Header", "value": "Custom-Value" }\
]
}
}
custom\_webhook\_template\_attributes.body\_template
string|JSON
The body to send with the webhook. The value can be a stringified JSON or a JSON object.
Using JSON object
Copied!
{
"custom_webhook_template_attributes": {
"body_template": {
"data": {
"id": "$INCIDENT_ID",
"type": "incident",
"attributes": {
"name": "$NAME",
"url": "$URL",
"http_method": "$HTTP_METHOD",
"screenshot_url": "$SCREENSHOT_URL"
}
}
}
}
}
Using stringified JSON
Copied!
{
"custom_webhook_template_attributes": {
"body_template": "{\"data\":{\"id\":\"$INCIDENT_ID\",\"type\":\"incident\",\"attributes\":{\"name\":\"$NAME\",\"url\":\"$URL\",\"http_method\":\"$HTTP_METHOD\",\"screenshot_url\":\"$SCREENSHOT_URL\"}}}"
}
}
When not specified, the default template is used. Each `trigger_type` has its own default template:
Default template for \`on\_call\_change\`
Copied!
{
"data":{
"message": "$MESSAGE",
"emails": $EMAILS_JSON_ARRAY,
"calendar_id": $ON_CALL_CALENDAR_ID,
"calendar_name": "$ON_CALL_CALENDAR_NAME",
"primary_calendar": $DEFAULT_ON_CALL_CALENDAR
}
}
Default template for \`incident\_change\`
Copied!
{
"data": {
"id": "$INCIDENT_ID",
"type": "incident",
"attributes": {
"name": "$NAME",
"url": "$URL",
"http_method": "$HTTP_METHOD",
"cause": "$CAUSE",
"started_at": "$STARTED_AT",
"acknowledged_at": "$ACKNOWLEDGED_AT",
"resolved_at": "$RESOLVED_AT",
"response_content": "$RESPONSE_CONTENT",
"response_url": "$RESPONSE_URL",
"screenshot_url": "$SCREENSHOT_URL"
}
}
}
Default template for \`monitor\_change\`
Copied!
{
"data":{
"id": "$MONITOR_ID",
"type": "monitor",
"attributes":{
"url": "$URL",
"pronounceable_name": "$PRONOUNCEABLE_NAME",
"monitor_type": "$MONITOR_TYPE",
"required_keyword": "$REQUIRED_KEYWORD",
"verify_ssl": $VERIFY_SSL,
"check_frequency": $CHECK_FREQUENCY,
"call": $CALL,
"sms": $SMS,
"email": $EMAIL,
"team_wait": "$TEAM_WAIT",
"http_method": "$HTTP_METHOD",
"request_timeout": "$REQUEST_TIMEOUT",
"recovery_period": "$RECOVERY_PERIOD",
"request_body": "$REQUEST_BODY",
"paused_at": "$PAUSED_AT",
"last_checked_at": "$LAST_CHECKED_AT"
}
}
}
200
Returns the updated Outgoing Webhook integration
Response body
{
"data": {
"id": "16",
"type": "outgoing_webhook",
"attributes": {
"name": "test",
"url": "https://example.com",
"trigger_type": "on_call_change",
"team_name": "My team"
},
"relationships": {
"custom_webhook_template": {
"data": null
}
}
},
"included": []
}
#### Example cURL
Example
Copied!
curl -X "PATCH" "https://uptime.betterstack.com/api/v2/outgoing-webhooks/16" \
-H "Authorization: Bearer $TOKEN" \
-H 'Content-Type: application/json; charset=utf-8' \
-d $'{
"name": "Test Again"
}'
#### Looking for the details of a specific parameter?
Explore [the list of all Outgoing Webhook integration API parameters](https://betterstack.com/docs/uptime/api/outgoing-webhook-integrations-response-params/?utm_content=callout&utm_medium=docs-uptime&utm_source=community&utm_term=docs-uptime-api-update-outgoing-webhook-integration)
* * *
[Previous article\
\
Create outgoing webhook](https://betterstack.com/docs/uptime/api/create-outgoing-webhook-integration/)
[Next article\
\
Remove outgoing webhook](https://betterstack.com/docs/uptime/api/delete-outgoing-webhook-integration/)
### Please accept cookies
We use cookies to authenticate users, improve the product user experience, and for [personalized ads](https://business.safety.google/privacy/)
. [Learn more.](https://betterstack.com/privacy)
Deny Accept required Accept all
---
# Logtail Bunyan stream | Better Stack Documentation
###### Explore documentation
* [Welcome to Telemetry 👋](https://betterstack.com/docs/logs/start/)
* [Quick start guide](https://betterstack.com/docs/logs/logging-start/)
* [Wide events vs. metrics](https://betterstack.com/docs/logs/wide-events-time-series/)
* [Ingesting data](https://betterstack.com/docs/logs/javascript/bunyan/)
1. [Better Stack collector](https://betterstack.com/docs/logs/collector/)
2. [Vector](https://betterstack.com/docs/logs/vector/)
3. [OpenTelemetry](https://betterstack.com/docs/logs/open-telemetry/)
4. [Ingesting via HTTP API](https://betterstack.com/docs/logs/ingesting-data/http/logs/)
5. [Ingesting metrics](https://betterstack.com/docs/logs/ingesting-data/metrics/prometheus-scrape/)
6. [Ingesting logs](https://betterstack.com/docs/logs/ingesting-data/logs/docker-kubernetes/)
1. [Docker & Kubernetes](https://betterstack.com/docs/logs/docker/)
2. [Operating systems](https://betterstack.com/docs/logs/ubuntu/)
3. [Log forwarders](https://betterstack.com/docs/logs/metrics/vector/)
4. [Programming languages](https://betterstack.com/docs/logs/javascript/)
1. [JavaScript & Node.js](https://betterstack.com/docs/logs/javascript/)
1. [Quick start guide](https://betterstack.com/docs/logs/javascript/install/)
2. [Advanced usage](https://betterstack.com/docs/logs/javascript/logging/)
3. [Frameworks](https://betterstack.com/docs/logs/javascript/frameworks/)
1. [Next.js](https://betterstack.com/docs/logs/javascript/nextjs/)
2. [Pino](https://betterstack.com/docs/logs/javascript/pino/)
3. [Koa](https://betterstack.com/docs/logs/javascript/koa/)
4. [Winston](https://betterstack.com/docs/logs/javascript/winston/)
5. [Bunyan](https://betterstack.com/docs/logs/javascript/bunyan/)
2. [Python](https://betterstack.com/docs/logs/python/)
3. [Ruby](https://betterstack.com/docs/logs/ruby-and-rails/)
4. [PHP](https://betterstack.com/docs/logs/php/)
5. [Java](https://betterstack.com/docs/logs/java/)
6. [.NET](https://betterstack.com/docs/logs/net-c/)
7. [Go](https://betterstack.com/docs/logs/go/)
8. [Erlang](https://betterstack.com/docs/logs/erlang/)
5. [Cloud platforms](https://betterstack.com/docs/logs/aws/)
6. [Web servers & Load balancers](https://betterstack.com/docs/logs/nginx/)
7. [Databases & queues](https://betterstack.com/docs/logs/postgresql/)
8. [Storage](https://betterstack.com/docs/logs/minio/)
7. [Migrating to Better Stack](https://betterstack.com/docs/logs/datadog-agent/)
* [Using the product](https://betterstack.com/docs/logs/javascript/bunyan/)
1. [AI SRE ↗](https://betterstack.com/demos/ai-sre/)
2. [MCP server ↗](https://betterstack.com/docs/getting-started/integrations/mcp/)
3. [Transforming ingested data](https://betterstack.com/docs/logs/using-logtail/transforming-ingested-data/logs-vrl/)
4. [Querying data](https://betterstack.com/docs/logs/using-logtail/live-tail-query-language/)
5. [Tracing](https://betterstack.com/docs/logs/tracing/)
6. [Alerts](https://betterstack.com/docs/logs/dashboards/alerts/)
* [Telemetry API](https://betterstack.com/docs/logs/javascript/bunyan/)
1. [Getting an API token](https://betterstack.com/docs/logs/api/getting-started/)
2. [Sources & collectors](https://betterstack.com/docs/logs/api/list-all-existing-sources/)
3. [Dashboards](https://betterstack.com/docs/logs/api/dashboards/list/)
4. [Explorations](https://betterstack.com/docs/logs/api/explorations/list/)
5. [Alerts API](https://betterstack.com/docs/logs/api/alerts/list/)
6. [Connections API](https://betterstack.com/docs/logs/api/connections/list/)
7. [Query API ↗](https://betterstack.com/docs/logs/query-api/connect-remotely/)
* [Alternative to](https://betterstack.com/docs/logs/javascript/bunyan/)
1. [Lightstep](https://betterstack.com/docs/logs/alternative-to/lightstep/)
Logtail Bunyan stream
=====================
Start logging in 3 steps
------------------------
### 1\. Install
Install Logtail Bunyan and Logtail Node NPM packages:
Install Logtail packages
Copied!
npm install @logtail/bunyan @logtail/node
### 2\. Setup
Set up Logtail Bunyan stream:
Set up Bunyan logger
Copied!
const bunyan = require("bunyan");
const { Logtail } = require("@logtail/node");
const { LogtailStream } = require("@logtail/bunyan");
// Create Logtail client
const logtail = new Logtail("$SOURCE_TOKEN", {
endpoint: 'https://$INGESTING_HOST',
});
// Create Bunyan logger
const logger = bunyan.createLogger({
name: "Example logger",
level: "debug",
streams: [\
{\
stream: new LogtailStream(logtail),\
},\
],
});
### 3\. Start logging 🎉
Use Bunyan logger as usual:
Send logs to Logtail
Copied!
logger.error("Something bad happened.");
logger.info({
item: "Orange Soda",
price: 100.00
}, "Log message with structured logging.");
// Ensure that all logs are sent to Logtail
logtail.flush()
You should see your logs in [Logtail → Live tail](https://logtail.com/team/0/tail)
.
**Bunyan version 2.0.0 or higher is required.**
Need help?
----------
Please let us know at [hello@betterstack.com](mailto:hello@betterstack.com)
.
We're happy to help! 🙏
Other Logtail clients
---------------------
Looking for a different JavaScript logging solution? Check out [Logtail clients for JavaScript and Node.js](https://betterstack.com/docs/logs/javascript/)
.
* * *
[Previous article\
\
Better Stack Winston transport](https://betterstack.com/docs/logs/javascript/winston/)
[Next article\
\
Better Stack Python logging](https://betterstack.com/docs/logs/python/)
###### On this page
* [Start logging in 3 steps](https://betterstack.com/docs/logs/javascript/bunyan/#start-logging-in-3-steps)
* [Need help?](https://betterstack.com/docs/logs/javascript/bunyan/#need-help)
* [Other Logtail clients](https://betterstack.com/docs/logs/javascript/bunyan/#other-logtail-clients)
### Please accept cookies
We use cookies to authenticate users, improve the product user experience, and for [personalized ads](https://business.safety.google/privacy/)
. [Learn more.](https://betterstack.com/privacy)
Deny Accept required Accept all
---
# List Azure integrations | Better Stack Documentation
###### Explore documentation
* [Welcome to Uptime 👋](https://betterstack.com/docs/uptime/start/)
* [Frequently Asked Questions](https://betterstack.com/docs/uptime/frequently-asked-questions/)
* [On-call scheduling and alerting](https://betterstack.com/docs/uptime/api/list-all-azure-integrations/)
1. [Get started](https://betterstack.com/docs/uptime/getting-started-with-oncall-v2/)
2. [Slack and other integrations ↗](https://betterstack.com/docs/uptime/slack/)
3. [Connecting external calendars](https://betterstack.com/docs/uptime/connecting-external-calendars/)
4. [Advanced guide](https://betterstack.com/docs/uptime/escalation-policies/)
* [Incidents](https://betterstack.com/docs/uptime/api/list-all-azure-integrations/)
1. [Get started](https://betterstack.com/docs/uptime/working-with-incidents/)
2. [Advanced guide](https://betterstack.com/docs/uptime/post-mortems/)
3. [Reporting ↗](https://betterstack.com/docs/getting-started/team-and-account-management/reporting/)
* [Monitoring](https://betterstack.com/docs/uptime/api/list-all-azure-integrations/)
1. [Get started](https://betterstack.com/docs/uptime/monitoring-start/)
2. [Working with monitors](https://betterstack.com/docs/uptime/bulk-importing-monitors/)
3. [Customizing monitors](https://betterstack.com/docs/uptime/naming-monitors/)
4. [Monitor types](https://betterstack.com/docs/uptime/uptime-monitor/)
* [Status pages](https://betterstack.com/docs/uptime/api/list-all-azure-integrations/)
1. [Get started](https://betterstack.com/docs/uptime/getting-started-with-status-pages/)
2. [Advanced guide](https://betterstack.com/docs/uptime/custom-subdomain/)
* [Uptime API](https://betterstack.com/docs/uptime/api/list-all-azure-integrations/)
1. [Getting an API token](https://betterstack.com/docs/uptime/api/getting-started-with-uptime-api/)
2. [Monitors](https://betterstack.com/docs/uptime/api/list-all-existing-monitors/)
3. [Heartbeats](https://betterstack.com/docs/uptime/api/list-all-existing-hearbeats/)
4. [On-call & incidents](https://betterstack.com/docs/uptime/api/on-call-calendar/)
5. [Status pages](https://betterstack.com/docs/uptime/api/list-all-existing-status-pages/)
6. [Metadata](https://betterstack.com/docs/uptime/api/metadata/)
7. [Integrations](https://betterstack.com/docs/uptime/api/list-all-new-relic-integrations/)
1. [New Relic](https://betterstack.com/docs/uptime/api/list-all-new-relic-integrations/)
2. [Datadog](https://betterstack.com/docs/uptime/api/list-all-datadog-integrations/)
3. [AWS CloudWatch](https://betterstack.com/docs/uptime/api/list-all-aws-cloudwatch-integrations/)
4. [Microsoft Azure](https://betterstack.com/docs/uptime/api/list-all-azure-integrations/)
1. [List Azure integrations GET](https://betterstack.com/docs/uptime/api/list-all-azure-integrations/)
2. [Get Azure integration GET](https://betterstack.com/docs/uptime/api/single-azure-integration/)
3. [Create Azure integration POST](https://betterstack.com/docs/uptime/api/create-azure-integration/)
4. [Update Azure integration PATCH](https://betterstack.com/docs/uptime/api/update-azure-integration/)
5. [Remove Azure integration DELETE](https://betterstack.com/docs/uptime/api/delete-azure-integration/)
6. [Response attributes](https://betterstack.com/docs/uptime/api/azure-integrations-response-params/)
5. [Google Monitoring](https://betterstack.com/docs/uptime/api/list-all-google-monitoring-integrations/)
6. [Grafana](https://betterstack.com/docs/uptime/api/list-all-grafana-integrations/)
7. [Elastic](https://betterstack.com/docs/uptime/api/list-all-elastic-integrations/)
8. [Prometheus](https://betterstack.com/docs/uptime/api/list-all-prometheus-integrations/)
9. [Email](https://betterstack.com/docs/uptime/api/list-all-email-integrations/)
10. [Incoming webhooks](https://betterstack.com/docs/uptime/api/list-all-incoming-webhooks/)
11. [Atlassian Jira](https://betterstack.com/docs/uptime/api/list-all-jira-integrations/)
12. [Slack](https://betterstack.com/docs/uptime/api/list-all-slack-integrations/)
13. [Outgoing webhooks](https://betterstack.com/docs/uptime/api/list-all-outgoing-webhook-integrations/)
14. [Splunk On-Call](https://betterstack.com/docs/uptime/api/list-all-splunk-on-call-integrations/)
15. [PagerDuty](https://betterstack.com/docs/uptime/api/list-all-pagerduty-integrations/)
16. [Catalog](https://betterstack.com/docs/uptime/api/catalog-integrations-relations/)
8. [Team members](https://betterstack.com/docs/uptime/api/team-members/list/)
List Azure integrations
=======================
Returns a list of all your Azure integrations. This endpoint [supports pagination](https://betterstack.com/docs/uptime/api/pagination/)
.
GET https://uptime.betterstack.com/api/v2/azure-integrations
Query parameters
team\_name
string
Filter Azure integrations belonging to a specified team when using [global API token](https://betterstack.com/docs/uptime/api/getting-started-with-uptime-api/#get-a-global-api-token)
.
Headers
Authorization
required string
Bearer `$TOKEN`
200
Returns list of existing Azure integrations
Response body
{
"data": [\
{\
"id": "37",\
"type": "azure_integration",\
"attributes": {\
"call": false,\
"sms": false,\
"email": true,\
"team_wait": 180,\
"recovery_period": null,\
"policy_id": null,\
"push": true,\
"name": "Azure Integration",\
"paused": false,\
"webhook_url": "https://uptime.betterstack.dev/api/v1/azure/webhook/[token]",\
"team_name": "Testing",\
}\
}\
],
"pagination": {
"first": "https://uptime.betterstack.com/api/v2/azure-integrations?page=1",
"last": "https://uptime.betterstack.com/api/v2/azure-integrations?page=1",
"prev": null,
"next": null
}
}
#### Example cURL
Example
Copied!
curl --request GET \
--url https://uptime.betterstack.com/api/v2/azure-integrations \
--header "Authorization: Bearer $TOKEN"
#### Looking for the details of a specific parameter?
Explore [the list of all Azure integration API parameters](https://betterstack.com/docs/uptime/api/azure-integrations-response-params/?utm_content=callout&utm_medium=docs-uptime&utm_source=community&utm_term=docs-uptime-api-list-all-azure-integrations)
.
* * *
[Previous article\
\
Response attributes](https://betterstack.com/docs/uptime/api/aws-cloudwatch-integrations-response-params/)
[Next article\
\
Get Azure integration](https://betterstack.com/docs/uptime/api/single-azure-integration/)
### Please accept cookies
We use cookies to authenticate users, improve the product user experience, and for [personalized ads](https://business.safety.google/privacy/)
. [Learn more.](https://betterstack.com/privacy)
Deny Accept required Accept all
---
# Update Google Monitoring integration | Better Stack Documentation
###### Explore documentation
* [Welcome to Uptime 👋](https://betterstack.com/docs/uptime/start/)
* [Frequently Asked Questions](https://betterstack.com/docs/uptime/frequently-asked-questions/)
* [On-call scheduling and alerting](https://betterstack.com/docs/uptime/api/update-google-monitoring-integration/)
1. [Get started](https://betterstack.com/docs/uptime/getting-started-with-oncall-v2/)
2. [Slack and other integrations ↗](https://betterstack.com/docs/uptime/slack/)
3. [Connecting external calendars](https://betterstack.com/docs/uptime/connecting-external-calendars/)
4. [Advanced guide](https://betterstack.com/docs/uptime/escalation-policies/)
* [Incidents](https://betterstack.com/docs/uptime/api/update-google-monitoring-integration/)
1. [Get started](https://betterstack.com/docs/uptime/working-with-incidents/)
2. [Advanced guide](https://betterstack.com/docs/uptime/post-mortems/)
3. [Reporting ↗](https://betterstack.com/docs/getting-started/team-and-account-management/reporting/)
* [Monitoring](https://betterstack.com/docs/uptime/api/update-google-monitoring-integration/)
1. [Get started](https://betterstack.com/docs/uptime/monitoring-start/)
2. [Working with monitors](https://betterstack.com/docs/uptime/bulk-importing-monitors/)
3. [Customizing monitors](https://betterstack.com/docs/uptime/naming-monitors/)
4. [Monitor types](https://betterstack.com/docs/uptime/uptime-monitor/)
* [Status pages](https://betterstack.com/docs/uptime/api/update-google-monitoring-integration/)
1. [Get started](https://betterstack.com/docs/uptime/getting-started-with-status-pages/)
2. [Advanced guide](https://betterstack.com/docs/uptime/custom-subdomain/)
* [Uptime API](https://betterstack.com/docs/uptime/api/update-google-monitoring-integration/)
1. [Getting an API token](https://betterstack.com/docs/uptime/api/getting-started-with-uptime-api/)
2. [Monitors](https://betterstack.com/docs/uptime/api/list-all-existing-monitors/)
3. [Heartbeats](https://betterstack.com/docs/uptime/api/list-all-existing-hearbeats/)
4. [On-call & incidents](https://betterstack.com/docs/uptime/api/on-call-calendar/)
5. [Status pages](https://betterstack.com/docs/uptime/api/list-all-existing-status-pages/)
6. [Metadata](https://betterstack.com/docs/uptime/api/metadata/)
7. [Integrations](https://betterstack.com/docs/uptime/api/list-all-new-relic-integrations/)
1. [New Relic](https://betterstack.com/docs/uptime/api/list-all-new-relic-integrations/)
2. [Datadog](https://betterstack.com/docs/uptime/api/list-all-datadog-integrations/)
3. [AWS CloudWatch](https://betterstack.com/docs/uptime/api/list-all-aws-cloudwatch-integrations/)
4. [Microsoft Azure](https://betterstack.com/docs/uptime/api/list-all-azure-integrations/)
5. [Google Monitoring](https://betterstack.com/docs/uptime/api/list-all-google-monitoring-integrations/)
1. [List Google Monitoring integrations GET](https://betterstack.com/docs/uptime/api/list-all-google-monitoring-integrations/)
2. [Get Google Monitoring integration GET](https://betterstack.com/docs/uptime/api/single-google-monitoring-integration/)
3. [Create Google Monitoring integration POST](https://betterstack.com/docs/uptime/api/create-google-monitoring-integration/)
4. [Update Google Monitoring integration PATCH](https://betterstack.com/docs/uptime/api/update-google-monitoring-integration/)
5. [Remove Google Monitoring integration DELETE](https://betterstack.com/docs/uptime/api/delete-google-monitoring-integration/)
6. [Response attributes](https://betterstack.com/docs/uptime/api/google-monitoring-integrations-response-params/)
6. [Grafana](https://betterstack.com/docs/uptime/api/list-all-grafana-integrations/)
7. [Elastic](https://betterstack.com/docs/uptime/api/list-all-elastic-integrations/)
8. [Prometheus](https://betterstack.com/docs/uptime/api/list-all-prometheus-integrations/)
9. [Email](https://betterstack.com/docs/uptime/api/list-all-email-integrations/)
10. [Incoming webhooks](https://betterstack.com/docs/uptime/api/list-all-incoming-webhooks/)
11. [Atlassian Jira](https://betterstack.com/docs/uptime/api/list-all-jira-integrations/)
12. [Slack](https://betterstack.com/docs/uptime/api/list-all-slack-integrations/)
13. [Outgoing webhooks](https://betterstack.com/docs/uptime/api/list-all-outgoing-webhook-integrations/)
14. [Splunk On-Call](https://betterstack.com/docs/uptime/api/list-all-splunk-on-call-integrations/)
15. [PagerDuty](https://betterstack.com/docs/uptime/api/list-all-pagerduty-integrations/)
16. [Catalog](https://betterstack.com/docs/uptime/api/catalog-integrations-relations/)
8. [Team members](https://betterstack.com/docs/uptime/api/team-members/list/)
Update Google Monitoring integration
====================================
Update an existing Google Monitoring integration. Send only the parameters you wish to change (eg. `paused`).
PATCH https://uptime.betterstack.com/api/v2/google-monitoring-integrations/{google\_monitoring\_integration\_id}
URL parameters
google\_monitoring\_integration\_id
required string
The ID of the Google Monitoring integration you want to update
Headers
Authorization
required string
Bearer `$TOKEN`
Content\_Type
string
application/json
Body parameters
name
string
The name of the Google Monitoring integration that you can see in the dashboard.
\*
Any params you'd like to set. See the [list of all Google Monitoring integration API parameters](https://betterstack.com/docs/uptime/api/google-monitoring-integrations-response-params/)
for details.
200
Returns the Google Monitoring integration
Response body
{
"data": {
"id": "37",
"type": "google_monitoring_integration",
"attributes": {
"call": false,
"sms": false,
"email": true,
"team_wait": 180,
"recovery_period": null,
"policy_id": null,
"push": true,
"name": "Test Again",
"paused": false,
"webhook_url": "https://uptime.betterstack.dev/api/v1/google-monitoring/webhook/[token]",
"team_name": "Testing"
}
}
}
#### Example cURL
Example
Copied!
curl -X "PATCH" "https://uptime.betterstack.com/api/v2/google-monitoring-integrations/37" \
-H "Authorization: Bearer $TOKEN" \
-H 'Content-Type: application/json; charset=utf-8' \
-d $'{
"name": "Test Again"
}'
#### Looking for the details of a specific parameter?
Explore [the list of all Google Monitoring integration API parameters](https://betterstack.com/docs/uptime/api/google-monitoring-integrations-response-params/?utm_content=callout&utm_medium=docs-uptime&utm_source=community&utm_term=docs-uptime-api-update-google-monitoring-integration)
* * *
[Previous article\
\
Create Google Monitoring integration](https://betterstack.com/docs/uptime/api/create-google-monitoring-integration/)
[Next article\
\
Remove Google Monitoring integration](https://betterstack.com/docs/uptime/api/delete-google-monitoring-integration/)
### Please accept cookies
We use cookies to authenticate users, improve the product user experience, and for [personalized ads](https://business.safety.google/privacy/)
. [Learn more.](https://betterstack.com/privacy)
Deny Accept required Accept all
---
# Get Google Monitoring integration | Better Stack Documentation
###### Explore documentation
* [Welcome to Uptime 👋](https://betterstack.com/docs/uptime/start/)
* [Frequently Asked Questions](https://betterstack.com/docs/uptime/frequently-asked-questions/)
* [On-call scheduling and alerting](https://betterstack.com/docs/uptime/api/single-google-monitoring-integration/)
1. [Get started](https://betterstack.com/docs/uptime/getting-started-with-oncall-v2/)
2. [Slack and other integrations ↗](https://betterstack.com/docs/uptime/slack/)
3. [Connecting external calendars](https://betterstack.com/docs/uptime/connecting-external-calendars/)
4. [Advanced guide](https://betterstack.com/docs/uptime/escalation-policies/)
* [Incidents](https://betterstack.com/docs/uptime/api/single-google-monitoring-integration/)
1. [Get started](https://betterstack.com/docs/uptime/working-with-incidents/)
2. [Advanced guide](https://betterstack.com/docs/uptime/post-mortems/)
3. [Reporting ↗](https://betterstack.com/docs/getting-started/team-and-account-management/reporting/)
* [Monitoring](https://betterstack.com/docs/uptime/api/single-google-monitoring-integration/)
1. [Get started](https://betterstack.com/docs/uptime/monitoring-start/)
2. [Working with monitors](https://betterstack.com/docs/uptime/bulk-importing-monitors/)
3. [Customizing monitors](https://betterstack.com/docs/uptime/naming-monitors/)
4. [Monitor types](https://betterstack.com/docs/uptime/uptime-monitor/)
* [Status pages](https://betterstack.com/docs/uptime/api/single-google-monitoring-integration/)
1. [Get started](https://betterstack.com/docs/uptime/getting-started-with-status-pages/)
2. [Advanced guide](https://betterstack.com/docs/uptime/custom-subdomain/)
* [Uptime API](https://betterstack.com/docs/uptime/api/single-google-monitoring-integration/)
1. [Getting an API token](https://betterstack.com/docs/uptime/api/getting-started-with-uptime-api/)
2. [Monitors](https://betterstack.com/docs/uptime/api/list-all-existing-monitors/)
3. [Heartbeats](https://betterstack.com/docs/uptime/api/list-all-existing-hearbeats/)
4. [On-call & incidents](https://betterstack.com/docs/uptime/api/on-call-calendar/)
5. [Status pages](https://betterstack.com/docs/uptime/api/list-all-existing-status-pages/)
6. [Metadata](https://betterstack.com/docs/uptime/api/metadata/)
7. [Integrations](https://betterstack.com/docs/uptime/api/list-all-new-relic-integrations/)
1. [New Relic](https://betterstack.com/docs/uptime/api/list-all-new-relic-integrations/)
2. [Datadog](https://betterstack.com/docs/uptime/api/list-all-datadog-integrations/)
3. [AWS CloudWatch](https://betterstack.com/docs/uptime/api/list-all-aws-cloudwatch-integrations/)
4. [Microsoft Azure](https://betterstack.com/docs/uptime/api/list-all-azure-integrations/)
5. [Google Monitoring](https://betterstack.com/docs/uptime/api/list-all-google-monitoring-integrations/)
1. [List Google Monitoring integrations GET](https://betterstack.com/docs/uptime/api/list-all-google-monitoring-integrations/)
2. [Get Google Monitoring integration GET](https://betterstack.com/docs/uptime/api/single-google-monitoring-integration/)
3. [Create Google Monitoring integration POST](https://betterstack.com/docs/uptime/api/create-google-monitoring-integration/)
4. [Update Google Monitoring integration PATCH](https://betterstack.com/docs/uptime/api/update-google-monitoring-integration/)
5. [Remove Google Monitoring integration DELETE](https://betterstack.com/docs/uptime/api/delete-google-monitoring-integration/)
6. [Response attributes](https://betterstack.com/docs/uptime/api/google-monitoring-integrations-response-params/)
6. [Grafana](https://betterstack.com/docs/uptime/api/list-all-grafana-integrations/)
7. [Elastic](https://betterstack.com/docs/uptime/api/list-all-elastic-integrations/)
8. [Prometheus](https://betterstack.com/docs/uptime/api/list-all-prometheus-integrations/)
9. [Email](https://betterstack.com/docs/uptime/api/list-all-email-integrations/)
10. [Incoming webhooks](https://betterstack.com/docs/uptime/api/list-all-incoming-webhooks/)
11. [Atlassian Jira](https://betterstack.com/docs/uptime/api/list-all-jira-integrations/)
12. [Slack](https://betterstack.com/docs/uptime/api/list-all-slack-integrations/)
13. [Outgoing webhooks](https://betterstack.com/docs/uptime/api/list-all-outgoing-webhook-integrations/)
14. [Splunk On-Call](https://betterstack.com/docs/uptime/api/list-all-splunk-on-call-integrations/)
15. [PagerDuty](https://betterstack.com/docs/uptime/api/list-all-pagerduty-integrations/)
16. [Catalog](https://betterstack.com/docs/uptime/api/catalog-integrations-relations/)
8. [Team members](https://betterstack.com/docs/uptime/api/team-members/list/)
Get Google Monitoring integration
=================================
Returns a single Google Monitoring integration by ID.
GET https://uptime.betterstack.com/api/v2/google-monitoring-integrations/{google\_monitoring\_integration\_id}
URL parameters
google\_monitoring\_integration\_id
required string
The ID of the Google Monitoring integration you want to get.
Headers
Authorization
required string
Bearer `$TOKEN`
200
Returns a single Google Monitoring integration
Response body
{
"data": {
"id": "37",
"type": "google_monitoring_integration",
"attributes": {
"call": false,
"sms": false,
"email": true,
"team_wait": 180,
"recovery_period": null,
"policy_id": null,
"push": true,
"name": "Test",
"paused": false,
"webhook_url": "https://uptime.betterstack.dev/api/v1/google-monitoring/webhook/[token]",
"team_name": "Testing"
}
}
}
#### Example cURL
Example
Copied!
curl --request GET \
--url https://uptime.betterstack.com/api/v2/google-monitoring-integrations/37 \
--header "Authorization: Bearer $TOKEN"
#### Looking for the details of a specific parameter?
Explore [the list of all Google Monitoring integration API parameters](https://betterstack.com/docs/uptime/api/google-monitoring-integrations-response-params/?utm_content=callout&utm_medium=docs-uptime&utm_source=community&utm_term=docs-uptime-api-single-google-monitoring-integration)
* * *
[Previous article\
\
List Google Monitoring integrations](https://betterstack.com/docs/uptime/api/list-all-google-monitoring-integrations/)
[Next article\
\
Create Google Monitoring integration](https://betterstack.com/docs/uptime/api/create-google-monitoring-integration/)
### Please accept cookies
We use cookies to authenticate users, improve the product user experience, and for [personalized ads](https://business.safety.google/privacy/)
. [Learn more.](https://betterstack.com/privacy)
Deny Accept required Accept all
---
# Update Datadog integration | Better Stack Documentation
###### Explore documentation
* [Welcome to Uptime 👋](https://betterstack.com/docs/uptime/start/)
* [Frequently Asked Questions](https://betterstack.com/docs/uptime/frequently-asked-questions/)
* [On-call scheduling and alerting](https://betterstack.com/docs/uptime/api/update-datadog-integration/)
1. [Get started](https://betterstack.com/docs/uptime/getting-started-with-oncall-v2/)
2. [Slack and other integrations ↗](https://betterstack.com/docs/uptime/slack/)
3. [Connecting external calendars](https://betterstack.com/docs/uptime/connecting-external-calendars/)
4. [Advanced guide](https://betterstack.com/docs/uptime/escalation-policies/)
* [Incidents](https://betterstack.com/docs/uptime/api/update-datadog-integration/)
1. [Get started](https://betterstack.com/docs/uptime/working-with-incidents/)
2. [Advanced guide](https://betterstack.com/docs/uptime/post-mortems/)
3. [Reporting ↗](https://betterstack.com/docs/getting-started/team-and-account-management/reporting/)
* [Monitoring](https://betterstack.com/docs/uptime/api/update-datadog-integration/)
1. [Get started](https://betterstack.com/docs/uptime/monitoring-start/)
2. [Working with monitors](https://betterstack.com/docs/uptime/bulk-importing-monitors/)
3. [Customizing monitors](https://betterstack.com/docs/uptime/naming-monitors/)
4. [Monitor types](https://betterstack.com/docs/uptime/uptime-monitor/)
* [Status pages](https://betterstack.com/docs/uptime/api/update-datadog-integration/)
1. [Get started](https://betterstack.com/docs/uptime/getting-started-with-status-pages/)
2. [Advanced guide](https://betterstack.com/docs/uptime/custom-subdomain/)
* [Uptime API](https://betterstack.com/docs/uptime/api/update-datadog-integration/)
1. [Getting an API token](https://betterstack.com/docs/uptime/api/getting-started-with-uptime-api/)
2. [Monitors](https://betterstack.com/docs/uptime/api/list-all-existing-monitors/)
3. [Heartbeats](https://betterstack.com/docs/uptime/api/list-all-existing-hearbeats/)
4. [On-call & incidents](https://betterstack.com/docs/uptime/api/on-call-calendar/)
5. [Status pages](https://betterstack.com/docs/uptime/api/list-all-existing-status-pages/)
6. [Metadata](https://betterstack.com/docs/uptime/api/metadata/)
7. [Integrations](https://betterstack.com/docs/uptime/api/list-all-new-relic-integrations/)
1. [New Relic](https://betterstack.com/docs/uptime/api/list-all-new-relic-integrations/)
2. [Datadog](https://betterstack.com/docs/uptime/api/list-all-datadog-integrations/)
1. [List Datadog integrations GET](https://betterstack.com/docs/uptime/api/list-all-datadog-integrations/)
2. [Get Datadog integration GET](https://betterstack.com/docs/uptime/api/single-datadog-integration/)
3. [Create Datadog integration POST](https://betterstack.com/docs/uptime/api/create-datadog-integration/)
4. [Update Datadog integration PATCH](https://betterstack.com/docs/uptime/api/update-datadog-integration/)
5. [Remove Datadog integration DELETE](https://betterstack.com/docs/uptime/api/delete-datadog-integration/)
6. [Response attributes](https://betterstack.com/docs/uptime/api/datadog-integrations-response-params/)
3. [AWS CloudWatch](https://betterstack.com/docs/uptime/api/list-all-aws-cloudwatch-integrations/)
4. [Microsoft Azure](https://betterstack.com/docs/uptime/api/list-all-azure-integrations/)
5. [Google Monitoring](https://betterstack.com/docs/uptime/api/list-all-google-monitoring-integrations/)
6. [Grafana](https://betterstack.com/docs/uptime/api/list-all-grafana-integrations/)
7. [Elastic](https://betterstack.com/docs/uptime/api/list-all-elastic-integrations/)
8. [Prometheus](https://betterstack.com/docs/uptime/api/list-all-prometheus-integrations/)
9. [Email](https://betterstack.com/docs/uptime/api/list-all-email-integrations/)
10. [Incoming webhooks](https://betterstack.com/docs/uptime/api/list-all-incoming-webhooks/)
11. [Atlassian Jira](https://betterstack.com/docs/uptime/api/list-all-jira-integrations/)
12. [Slack](https://betterstack.com/docs/uptime/api/list-all-slack-integrations/)
13. [Outgoing webhooks](https://betterstack.com/docs/uptime/api/list-all-outgoing-webhook-integrations/)
14. [Splunk On-Call](https://betterstack.com/docs/uptime/api/list-all-splunk-on-call-integrations/)
15. [PagerDuty](https://betterstack.com/docs/uptime/api/list-all-pagerduty-integrations/)
16. [Catalog](https://betterstack.com/docs/uptime/api/catalog-integrations-relations/)
8. [Team members](https://betterstack.com/docs/uptime/api/team-members/list/)
Update Datadog integration
==========================
Update an existing Datadog integration. Send only the parameters you wish to change (eg. `paused`).
PATCH https://uptime.betterstack.com/api/v2/datadog-integrations/{datadog\_integration\_id}
URL parameters
datadog\_integration\_id
required string
The ID of the Datadog integration you want to update
Headers
Authorization
required string
Bearer `$TOKEN`
Content\_Type
string
application/json
Body parameters
name
string
The name of the Datadog integration that you can see in the dashboard.
\*
Any params you'd like to set. See the [list of all Datadog integration API parameters](https://betterstack.com/docs/uptime/api/datadog-integrations-response-params/)
for details.
200
Returns the Datadog integration
Response body
{
"data": {
"id": "37",
"type": "datadog_integration",
"attributes": {
"call": false,
"sms": false,
"email": true,
"team_wait": 180,
"recovery_period": null,
"policy_id": null,
"push": true,
"name": "Test Again",
"team_name": "Testing",
"paused": false,
"alerting_rule": "alert",
"webhook_url": "https://uptime.betterstack.dev/api/v1/datadog/webhook/[token]"
}
}
}
#### Example cURL
Example
Copied!
curl -X "PATCH" "https://uptime.betterstack.com/api/v2/datadog-integrations/37" \
-H "Authorization: Bearer $TOKEN" \
-H 'Content-Type: application/json; charset=utf-8' \
-d $'{
"name": "Test Again"
}'
#### Looking for the details of a specific parameter?
Explore [the list of all Datadog integration API parameters](https://betterstack.com/docs/uptime/api/datadog-integrations-response-params/?utm_content=callout&utm_medium=docs-uptime&utm_source=community&utm_term=docs-uptime-api-update-datadog-integration)
* * *
[Previous article\
\
Create Datadog integration](https://betterstack.com/docs/uptime/api/create-datadog-integration/)
[Next article\
\
Remove Datadog integration](https://betterstack.com/docs/uptime/api/delete-datadog-integration/)
### Please accept cookies
We use cookies to authenticate users, improve the product user experience, and for [personalized ads](https://business.safety.google/privacy/)
. [Learn more.](https://betterstack.com/privacy)
Deny Accept required Accept all
---