]` part of the exception message written to the error logs:
io.questdb.cairo.CairoException: [24] could not open read-only [file=/root/.questdb/db/cpu/service.k]
The above message reports error code 24 which is "Too many open files" on Linux.
Some error log messages may also include `errno=` key/value pair:
2022-02-01T13:40:10.636014Z E i.q.c.l.t.LineTcpConnectionContext [8655] could not process line data [table=test_table, msg=could not mmap [size=248, offset=0, fd=1766, memUsed=314809894008, fileLen=8192], errno=12]
The above message reports error code 12 which is "Out of memory" on Linux.
Linux error codes[](https://questdb.com/docs/troubleshooting/os-error-codes/#linux-error-codes "Direct link to Linux error codes")
------------------------------------------------------------------------------------------------------------------------------------
| Error number | Error name | Description |
| --- | --- | --- |
| 1 | EPERM | Operation not permitted. |
| 2 | ENOENT | No such file or directory. |
| 3 | ESRCH | No such process. |
| 4 | EINTR | Interrupted system call. |
| 5 | EIO | I/O error. |
| 6 | ENXIO | No such device or address. |
| 7 | E2BIG | Argument list too long. |
| 8 | ENOEXEC | Exec format error. |
| 9 | EBADF | Bad file number. |
| 10 | ECHILD | No child processes. |
| 11 | EAGAIN | Try again. |
| 12 | ENOMEM | Out of memory. |
| 13 | EACCES | Permission denied. |
| 14 | EFAULT | Bad address. |
| 15 | ENOTBLK | Block device required. |
| 16 | EBUSY | Device or resource busy. |
| 17 | EEXIST | File exists. |
| 18 | EXDEV | Cross-device link. |
| 19 | ENODEV | No such device. |
| 20 | ENOTDIR | Not a directory. |
| 21 | EISDIR | Is a directory. |
| 22 | EINVAL | Invalid argument. |
| 23 | ENFILE | File table overflow. |
| 24 | EMFILE | Too many open files. |
| 25 | ENOTTY | Not a typewriter. |
| 26 | ETXTBSY | Text file busy. |
| 27 | EFBIG | File too large. |
| 28 | ENOSPC | No space left on device. |
| 29 | ESPIPE | Illegal seek. |
| 30 | EROFS | Read-only file system. |
| 31 | EMLINK | Too many links. |
| 32 | EPIPE | Broken pipe. |
| 33 | EDOM | Math argument out of domain of func. |
| 34 | ERANGE | Math result not representable. |
| 35 | EDEADLK | Resource deadlock would occur. |
| 36 | ENAMETOOLONG | File name too long. |
| 37 | ENOLCK | No record locks available. |
| 38 | ENOSYS | Function not implemented. |
| 39 | ENOTEMPTY | Directory not empty. |
| 40 | ELOOP | Too many symbolic links encountered. |
| 42 | ENOMSG | No message of desired type. |
| 43 | EIDRM | Identifier removed. |
| 44 | ECHRNG | Channel number out of range. |
| 45 | EL2NSYNC | Level 2 not synchronized. |
| 46 | EL3HLT | Level 3 halted. |
| 47 | EL3RST | Level 3 reset. |
| 48 | ELNRNG | Link number out of range. |
| 49 | EUNATCH | Protocol driver not attached. |
| 50 | ENOCSI | No CSI structure available. |
| 51 | EL2HLT | Level 2 halted. |
| 52 | EBADE | Invalid exchange. |
| 53 | EBADR | Invalid request descriptor. |
| 54 | EXFULL | Exchange full. |
| 55 | ENOANO | No anode. |
| 56 | EBADRQC | Invalid request code. |
| 57 | EBADSLT | Invalid slot. |
| 59 | EBFONT | Bad font file format. |
| 60 | ENOSTR | Device not a stream. |
| 61 | ENODATA | No data available. |
| 62 | ETIME | Timer expired. |
| 63 | ENOSR | Out of streams resources. |
| 64 | ENONET | Machine is not on the network. |
| 65 | ENOPKG | Package not installed. |
| 66 | EREMOTE | Object is remote. |
| 67 | ENOLINK | Link has been severed. |
| 68 | EADV | Advertise error. |
| 69 | ESRMNT | Srmount error. |
| 70 | ECOMM | Communication error on send. |
| 71 | EPROTO | Protocol error. |
| 72 | EMULTIHOP | Multihop attempted. |
| 73 | EDOTDOT | RFS specific error. |
| 74 | EBADMSG | Not a data message. |
| 75 | EOVERFLOW | Value too large for defined data type. |
| 76 | ENOTUNIQ | Name not unique on network. |
| 77 | EBADFD | File descriptor in bad state. |
| 78 | EREMCHG | Remote address changed. |
| 79 | ELIBACC | Can not access a needed shared library. |
| 80 | ELIBBAD | Accessing a corrupted shared library. |
| 81 | ELIBSCN | .lib section in a.out corrupted. |
| 82 | ELIBMAX | Attempting to link in too many shared libraries. |
| 83 | ELIBEXEC | Cannot exec a shared library directly. |
| 84 | EILSEQ | Illegal byte sequence. |
| 85 | ERESTART | Interrupted system call should be restarted. |
| 86 | ESTRPIPE | Streams pipe error. |
| 87 | EUSERS | Too many users. |
| 88 | ENOTSOCK | Socket operation on non-socket. |
| 89 | EDESTADDRREQ | Destination address required. |
| 90 | EMSGSIZE | Message too long. |
| 91 | EPROTOTYPE | Protocol wrong type for socket. |
| 92 | ENOPROTOOPT | Protocol not available. |
| 93 | EPROTONOSUPPORT | Protocol not supported. |
| 94 | ESOCKTNOSUPPORT | Socket type not supported. |
| 95 | EOPNOTSUPP | Operation not supported on transport endpoint. |
| 96 | EPFNOSUPPORT | Protocol family not supported. |
| 97 | EAFNOSUPPORT | Address family not supported by protocol. |
| 98 | EADDRINUSE | Address already in use. |
| 99 | EADDRNOTAVAIL | Cannot assign requested address. |
| 100 | ENETDOWN | Network is down. |
| 101 | ENETUNREACH | Network is unreachable. |
| 102 | ENETRESET | Network dropped connection because of reset. |
| 103 | ECONNABORTED | Software caused connection abort. |
| 104 | ECONNRESET | Connection reset by peer. |
| 105 | ENOBUFS | No buffer space available. |
| 106 | EISCONN | Transport endpoint is already connected. |
| 107 | ENOTCONN | Transport endpoint is not connected. |
| 108 | ESHUTDOWN | Cannot send after transport endpoint shutdown. |
| 109 | ETOOMANYREFS | Too many references: cannot splice. |
| 110 | ETIMEDOUT | Connection timed out. |
| 111 | ECONNREFUSED | Connection refused. |
| 112 | EHOSTDOWN | Host is down. |
| 113 | EHOSTUNREACH | No route to host. |
| 114 | EALREADY | Operation already in progress. |
| 115 | EINPROGRESS | Operation now in progress. |
| 116 | ESTALE | Stale NFS file handle. |
| 117 | EUCLEAN | Structure needs cleaning. |
| 118 | ENOTNAM | Not a XENIX named type file. |
| 119 | ENAVAIL | No XENIX semaphores available. |
| 120 | EISNAM | Is a named type file. |
| 121 | EREMOTEIO | Remote I/O error. |
| 122 | EDQUOT | Quota exceeded. |
| 123 | ENOMEDIUM | No medium found. |
| 124 | EMEDIUMTYPE | Wrong medium type. |
| 125 | ECANCELED | Operation Canceled. |
| 126 | ENOKEY | Required key not available. |
| 127 | EKEYEXPIRED | Key has expired. |
| 128 | EKEYREVOKED | Key has been revoked. |
| 129 | EKEYREJECTED | Key was rejected by service. |
| 130 | EOWNERDEAD | Owner died. |
| 131 | ENOTRECOVERABLE | State not recoverable. |
Windows error codes[](https://questdb.com/docs/troubleshooting/os-error-codes/#windows-error-codes "Direct link to Windows error codes")
------------------------------------------------------------------------------------------------------------------------------------------
A complete list of Windows error codes may be found [here](https://docs.microsoft.com/en-us/windows/win32/debug/system-error-codes)
.
| Error number | Error name | Description |
| --- | --- | --- |
| 1 | ERROR\_INVALID\_FUNCTION | Incorrect function. |
| 2 | ERROR\_FILE\_NOT\_FOUND | The system cannot find the file specified. |
| 3 | ERROR\_PATH\_NOT\_FOUND | The system cannot find the path specified. |
| 4 | ERROR\_TOO\_MANY\_OPEN\_FILES | The system cannot open the file. |
| 5 | ERROR\_ACCESS\_DENIED | Access is denied. |
| 6 | ERROR\_INVALID\_HANDLE | The handle is invalid. |
| 7 | ERROR\_ARENA\_TRASHED | The storage control blocks were destroyed. |
| 8 | ERROR\_NOT\_ENOUGH\_MEMORY | Not enough memory is available to process this command. |
| 9 | ERROR\_INVALID\_BLOCK | The storage control block address is invalid. |
| 10 | ERROR\_BAD\_ENVIRONMENT | The environment is incorrect. |
| 11 | ERROR\_BAD\_FORMAT | An attempt was made to load a program with an incorrect format. |
| 12 | ERROR\_INVALID\_ACCESS | The access code is invalid. |
| 13 | ERROR\_INVALID\_DATA | The data is invalid. |
| 14 | ERROR\_OUTOFMEMORY | Not enough storage is available to complete this operation. |
| 15 | ERROR\_INVALID\_DRIVE | The system cannot find the drive specified. |
| 16 | ERROR\_CURRENT\_DIRECTORY | The directory cannot be removed. |
| 17 | ERROR\_NOT\_SAME\_DEVICE | The system cannot move the file to a different disk drive. |
| 18 | ERROR\_NO\_MORE\_FILES | There are no more files. |
| 19 | ERROR\_WRITE\_PROTECT | The media is write protected. |
| 20 | ERROR\_BAD\_UNIT | The system cannot find the device specified. |
| 21 | ERROR\_NOT\_READY | The device is not ready. |
| 22 | ERROR\_BAD\_COMMAND | The device does not recognize the command. |
| 23 | ERROR\_CRC | Data error (cyclic redundancy check). |
| 24 | ERROR\_BAD\_LENGTH | The program issued a command but the command length is incorrect. |
| 25 | ERROR\_SEEK | The drive cannot locate a specific area or track on the disk. |
| 26 | ERROR\_NOT\_DOS\_DISK | The specified disk or diskette cannot be accessed. |
| 27 | ERROR\_SECTOR\_NOT\_FOUND | The drive cannot find the sector requested. |
| 28 | ERROR\_OUT\_OF\_PAPER | The printer is out of paper. |
| 29 | ERROR\_WRITE\_FAULT | The system cannot write to the specified device. |
| 30 | ERROR\_READ\_FAULT | The system cannot read from the specified device. |
| 31 | ERROR\_GEN\_FAILURE | A device attached to the system is not functioning. |
| 32 | ERROR\_SHARING\_VIOLATION | The process cannot access the file because it is being used by another process. |
| 33 | ERROR\_LOCK\_VIOLATION | The process cannot access the file because another process has locked a portion of the file. |
| 34 | ERROR\_WRONG\_DISK | The wrong diskette is in the drive. Insert %2 (Volume Serial Number: %3) into drive %1. |
| 36 | ERROR\_SHARING\_BUFFER\_EXCEEDED | Too many files opened for sharing. |
| 38 | ERROR\_HANDLE\_EOF | Reached the end of the file. |
| 39 | ERROR\_HANDLE\_DISK\_FULL | The disk is full. |
| 87 | ERROR\_INVALID\_PARAMETER | The parameter is incorrect. |
| 112 | ERROR\_DISK\_FULL | The disk is full. |
| 123 | ERROR\_INVALID\_NAME | The file name, directory name, or volume label syntax is incorrect. |
| 1450 | ERROR\_NO\_SYSTEM\_RESOURCES | Insufficient system resources exist to complete the requested service. |
MacOS error codes[](https://questdb.com/docs/troubleshooting/os-error-codes/#macos-error-codes "Direct link to MacOS error codes")
------------------------------------------------------------------------------------------------------------------------------------
| Error number | Error name | Description |
| --- | --- | --- |
| 0 | Base | Undefined error: 0 |
| 1 | EPERM | Operation not permitted |
| 2 | ENOENT | No such file or directory |
| 3 | ESRCH | No such process |
| 4 | EINTR | Interrupted system call |
| 5 | EIO | Input/output error |
| 6 | ENXIO | Device not configured |
| 7 | E2BIG | Argument list too long |
| 8 | ENOEXEC | Exec format error |
| 9 | EBADF | Bad file descriptor |
| 10 | ECHILD | No child processes |
| 11 | EDEADLK | Resource deadlock avoided |
| 12 | ENOMEM | Cannot allocate memory |
| 13 | EACCES | Permission denied |
| 14 | EFAULT | Bad address |
| 15 | ENOTBLK | Block device required |
| 16 | EBUSY | Device busy |
| 17 | EEXIST | File exists |
| 18 | EXDEV | Cross-device link |
| 19 | ENODEV | Operation not supported by device |
| 20 | ENOTDIR | Not a directory |
| 21 | EISDIR | Is a directory |
| 22 | EINVAL | Invalid argument |
| 23 | ENFILE | Too many open files in system |
| 24 | EMFILE | Too many open files |
| 25 | ENOTTY | Inappropriate ioctl for device |
| 26 | ETXTBSY | Text file busy |
| 27 | EFBIG | File too large |
| 28 | ENOSPC | No space left on device |
| 29 | ESPIPE | Illegal seek |
| 30 | EROFS | Read-only file system |
| 31 | EMLINK | Too many links |
| 32 | EPIPE | Broken pipe |
| 33 | EDOM | Numerical argument out of domain |
| 34 | ERANGE | Result too large |
| 35 | EAGAIN | Resource temporarily unavailable |
| 36 | EINPROGRESS | Operation now in progress |
| 37 | EALREADY | Operation already in progress |
| 38 | ENOTSOCK | Socket operation on non-socket |
| 39 | EDESTADDRREQ | Destination address required |
| 40 | EMSGSIZE | Message too long |
| 41 | EPROTOTYPE | Protocol wrong type for socket |
| 42 | ENOPROTOOPT | Protocol not available |
| 43 | EPROTONOSUPPORT | Protocol not supported |
| 44 | ESOCKTNOSUPPORT | Socket type not supported |
| 45 | ENOTSUP | Operation not supported |
| 46 | EPFNOSUPPORT | Protocol family not supported |
| 47 | EAFNOSUPPORT | Address family not supported by protocol family |
| 48 | EADDRINUSE | Address already in use |
| 49 | EADDRNOTAVAIL | Can’t assign requested address |
| 50 | ENETDOWN | Network is down |
| 51 | ENETUNREACH | Network is unreachable |
| 52 | ENETRESET | Network dropped connection on reset |
| 53 | ECONNABORTED | Software caused connection abort |
| 54 | ECONNRESET | Connection reset by peer |
| 55 | ENOBUFS | No buffer space available |
| 56 | EISCONN | Socket is already connected |
| 57 | ENOTCONN | Socket is not connected |
| 58 | ESHUTDOWN | Can’t send after socket shutdown |
| 59 | ETOOMANYREFS | Too many references: can’t splice |
| 60 | ETIMEDOUT | Operation timed out |
| 61 | ECONNREFUSED | Connection refused |
| 62 | ELOOP | Too many levels of symbolic links |
| 63 | ENAMETOOLONG | File name too long |
| 64 | EHOSTDOWN | Host is down |
| 65 | EHOSTUNREACH | No route to host |
| 66 | ENOTEMPTY | Directory not empty |
| 67 | EPROCLIM | Too many processes |
| 68 | EUSERS | Too many users |
| 69 | EDQUOT | Disc quota exceeded |
| 70 | ESTALE | Stale NFS file handle |
| 71 | EREMOTE | Too many levels of remote in path |
| 72 | EBADRPC | RPC struct is bad |
| 73 | ERPCMISMATCH | RPC version wrong |
| 74 | EPROGUNAVAIL | RPC prog. not avail |
| 75 | EPROGMISMATCH | Program version wrong |
| 76 | EPROCUNAVAIL | Bad procedure for program |
| 77 | ENOLCK | No locks available |
| 78 | ENOSYS | Function not implemented |
| 79 | EFTYPE | Inappropriate file type or format |
| 80 | EAUTH | Authentication error |
| 81 | ENEEDAUTH | Need authenticator |
| 82 | EPWROFF | Device power is off |
| 83 | EDEVERR | Device error |
| 84 | EOVERFLOW | Value too large to be stored in data type |
| 85 | EBADEXEC | Bad executable |
| 86 | EBADARCH | Bad CPU type in executable |
| 87 | ESHLIBVERS | Shared library version mismatch |
| 88 | EBADMACHO | Malformed Macho file |
| 89 | ECANCELED | Operation canceled |
| 90 | EIDRM | Identifier removed |
| 91 | ENOMSG | No message of desired type |
| 92 | EILSEQ | Illegal byte sequence |
| 93 | ENOATTR | Attribute not found |
| 94 | EBADMSG | Bad message |
| 95 | EMULTIHOP | EMULTIHOP (Reserved) |
| 96 | ENODATA | No message available on STREAM |
| 97 | ENOLINK | ENOLINK (Reserved) |
| 98 | ENOSR | No STREAM resources |
| 99 | ENOSTR | Not a STREAM |
| 100 | EPROTO | Protocol error |
| 101 | ETIME | STREAM ioctl timeout |
| 102 | EOPNOTSUPP | Operation not supported on socket |
| 103 | ENOPOLICY | Policy not found |
| 104 | ENOTRECOVERABLE | State not recoverable |
| 105 | EOWNERDEAD | Previous owner died |
| 106 | EQFULL | Interface output queue is full |
* [Where to find error codes](https://questdb.com/docs/troubleshooting/os-error-codes/#where-to-find-error-codes)
* [Linux error codes](https://questdb.com/docs/troubleshooting/os-error-codes/#linux-error-codes)
* [Windows error codes](https://questdb.com/docs/troubleshooting/os-error-codes/#windows-error-codes)
* [MacOS error codes](https://questdb.com/docs/troubleshooting/os-error-codes/#macos-error-codes)
---
# ECN scorecard | QuestDB
On this page
When evaluating execution across multiple venues, you often need several metrics side by side: spread conditions, slippage, fill sizes, and order type mix. Rather than running separate queries, this recipe produces a single **ECN scorecard** that summarizes fill quality per venue and symbol.
Problem[](https://questdb.com/docs/cookbook/sql/finance/ecn-scorecard/#problem "Direct link to Problem")
----------------------------------------------------------------------------------------------------------
You want a single dashboard-ready query that ranks venues by execution quality, combining spread at fill time, slippage against mid and top of book, average fill size, and what proportion of fills were passive.
Solution[](https://questdb.com/docs/cookbook/sql/finance/ecn-scorecard/#solution "Direct link to Solution")
-------------------------------------------------------------------------------------------------------------
Use `ASOF JOIN` to pair each fill with the prevailing order book, then aggregate multiple metrics per ECN and symbol:
ECN fill quality scorecard (buy side)[Demo this query](https://demo.questdb.io/?query=SELECT%0A%20%20%20%20t.symbol%2C%0A%20%20%20%20t.ecn%2C%0A%20%20%20%20count()%20AS%20fill_count%2C%0A%20%20%20%20sum(t.quantity)%20AS%20total_volume%2C%0A%20%20%20%20avg(t.quantity)%20AS%20avg_fill_size%2C%0A%20%20%20%20avg((m.best_ask%20-%20m.best_bid)%0A%20%20%20%20%20%20%20%20%2F%20((m.best_bid%20%2B%20m.best_ask)%20%2F%202)%20*%2010000)%20AS%20avg_spread_bps%2C%0A%20%20%20%20avg(((m.best_bid%20%2B%20m.best_ask)%20%2F%202%20-%20t.price)%0A%20%20%20%20%20%20%20%20%2F%20t.price%20*%2010000)%20AS%20avg_slippage_bps%2C%0A%20%20%20%20avg((m.best_ask%20-%20t.price)%0A%20%20%20%20%20%20%20%20%2F%20t.price%20*%2010000)%20AS%20avg_slippage_vs_ask_bps%2C%0A%20%20%20%20avg(CASE%20WHEN%20t.passive%20THEN%201.0%20ELSE%200.0%20END)%20AS%20passive_ratio%0AFROM%20fx_trades%20t%0AASOF%20JOIN%20market_data%20m%20ON%20(symbol)%0AWHERE%20t.side%20%3D%20%27buy%27%0A%20%20%20%20AND%20t.timestamp%20IN%20%27%24yesterday%27%0AGROUP%20BY%20t.symbol%2C%20t.ecn%0AORDER%20BY%20t.symbol%2C%20avg_slippage_bps%3B&executeQuery=true)
SELECT t.symbol, t.ecn, count() AS fill_count, sum(t.quantity) AS total_volume, avg(t.quantity) AS avg_fill_size, avg((m.best_ask - m.best_bid) / ((m.best_bid + m.best_ask) / 2) * 10000) AS avg_spread_bps, avg(((m.best_bid + m.best_ask) / 2 - t.price) / t.price * 10000) AS avg_slippage_bps, avg((m.best_ask - t.price) / t.price * 10000) AS avg_slippage_vs_ask_bps, avg(CASE WHEN t.passive THEN 1.0 ELSE 0.0 END) AS passive_ratioFROM fx_trades tASOF JOIN market_data m ON (symbol)WHERE t.side = 'buy' AND t.timestamp IN '$yesterday'GROUP BY t.symbol, t.ecnORDER BY t.symbol, avg_slippage_bps;
How it works[](https://questdb.com/docs/cookbook/sql/finance/ecn-scorecard/#how-it-works "Direct link to How it works")
-------------------------------------------------------------------------------------------------------------------------
Each row is one symbol-ECN combination. The metrics in each row:
* **`fill_count`** and **`total_volume`** — how much activity the ECN sees for this symbol. Context for statistical significance.
* **`avg_fill_size`** — average quantity per fill. Venues with larger average fills may show more slippage simply due to size.
* **`avg_spread_bps`** — average spread at the time of each fill. Tells you what market conditions looked like when you traded on this venue.
* **`avg_slippage_bps`** — average slippage vs mid. Since this is buy-side, negative means you bought below mid (price improvement), positive means you paid above mid.
* **`avg_slippage_vs_ask_bps`** — average slippage vs the best ask. Isolates how much worse than the quoted ask you actually paid. Negative means you got price improvement vs the ask.
* **`passive_ratio`** — fraction of fills that were passive (limit orders). Higher passive ratio typically correlates with better slippage.
Results are ordered by `avg_slippage_bps` so the best-performing ECN for each symbol appears first.
Buy-side only
This query filters to `side = 'buy'` because the slippage formulas are direction-specific (no `CASE` expression). For a sell-side scorecard, flip the slippage formulas: use `(t.price - mid) / t.price` for slippage vs mid, and `(t.price - m.best_bid) / t.price` for slippage vs bid.
Interpreting results[](https://questdb.com/docs/cookbook/sql/finance/ecn-scorecard/#interpreting-results "Direct link to Interpreting results")
-------------------------------------------------------------------------------------------------------------------------------------------------
Compare rows for the same symbol across different ECNs:
* **Low spread + low slippage**: The best combination — tight market and good fills.
* **Low spread + high slippage**: Tight quotes but fills executing poorly. May indicate latency issues or thin top-of-book liquidity.
* **High passive ratio + negative slippage**: Expected — passive fills provide liquidity and often get price improvement.
* **Large `avg_fill_size` + high slippage**: Size-driven impact. The venue may have less depth, causing larger orders to walk the book.
* **Low `fill_count`**: Treat metrics with caution — small sample sizes can be misleading.
ECN markout curves[](https://questdb.com/docs/cookbook/sql/finance/ecn-scorecard/#ecn-markout-curves "Direct link to ECN markout curves")
-------------------------------------------------------------------------------------------------------------------------------------------
The scorecard above is a static snapshot. To see how fill quality evolves over time after execution, overlay markout curves per ECN. An ECN where markouts go steeply negative is delivering toxic flow — informed traders are picking you off there:
ECN markout curves side by side (buy side)[Demo this query](https://demo.questdb.io/?query=SELECT%0A%20%20%20%20t.symbol%2C%0A%20%20%20%20t.ecn%2C%0A%20%20%20%20h.offset%20%2F%201000000000%20AS%20horizon_sec%2C%0A%20%20%20%20count()%20AS%20n%2C%0A%20%20%20%20avg(((m.best_bid%20%2B%20m.best_ask)%20%2F%202%20-%20t.price)%0A%20%20%20%20%20%20%20%20%2F%20t.price%20*%2010000)%20AS%20avg_markout_bps%2C%0A%20%20%20%20sum(((m.best_bid%20%2B%20m.best_ask)%20%2F%202%20-%20t.price)%0A%20%20%20%20%20%20%20%20*%20t.quantity)%20AS%20total_pnl%0AFROM%20fx_trades%20t%0AHORIZON%20JOIN%20market_data%20m%20ON%20(symbol)%0A%20%20%20%20RANGE%20FROM%200s%20TO%205m%20STEP%205s%20AS%20h%0AWHERE%20t.side%20%3D%20%27buy%27%0A%20%20%20%20AND%20t.timestamp%20IN%20%27%24yesterday%27%0AGROUP%20BY%20t.symbol%2C%20t.ecn%2C%20horizon_sec%0AORDER%20BY%20t.symbol%2C%20t.ecn%2C%20horizon_sec%3B&executeQuery=true)
SELECT t.symbol, t.ecn, h.offset / 1000000000 AS horizon_sec, count() AS n, avg(((m.best_bid + m.best_ask) / 2 - t.price) / t.price * 10000) AS avg_markout_bps, sum(((m.best_bid + m.best_ask) / 2 - t.price) * t.quantity) AS total_pnlFROM fx_trades tHORIZON JOIN market_data m ON (symbol) RANGE FROM 0s TO 5m STEP 5s AS hWHERE t.side = 'buy' AND t.timestamp IN '$yesterday'GROUP BY t.symbol, t.ecn, horizon_secORDER BY t.symbol, t.ecn, horizon_sec;
Plot these curves overlaid per ECN for each symbol. Compare the shapes:
* **Flat near zero**: Neutral flow — no systematic post-trade price movement. This is healthy.
* **Rising (positive)**: Mean-reverting flow — the market comes back after the fill. You're providing liquidity at good levels on this venue.
* **Falling (negative)**: Toxic flow — the market moves against you after fills on this ECN. Informed traders may be concentrated there.
* **Sharp initial drop then flat**: The initial cost is the spread, and the market doesn't move further. Normal for aggressive fills on a well-functioning venue.
Combine with the scorecard's `passive_ratio` and `avg_fill_size` to understand _why_ a venue shows toxicity — it may simply be where your largest aggressive orders execute, rather than a venue-specific problem.
Toxicity by time of day[](https://questdb.com/docs/cookbook/sql/finance/ecn-scorecard/#toxicity-by-time-of-day "Direct link to Toxicity by time of day")
----------------------------------------------------------------------------------------------------------------------------------------------------------
Toxicity isn't static — an ECN may show clean markouts during London hours but turn toxic during Asia when liquidity thins out. Grouping by hour reveals intraday patterns:
ECN toxicity by hour (buy side)[Demo this query](https://demo.questdb.io/?query=SELECT%0A%20%20%20%20t.symbol%2C%0A%20%20%20%20t.ecn%2C%0A%20%20%20%20hour(t.timestamp)%20AS%20hour_utc%2C%0A%20%20%20%20h.offset%2C%0A%20%20%20%20count()%20AS%20n%2C%0A%20%20%20%20avg(((m.best_bid%20%2B%20m.best_ask)%20%2F%202%20-%20t.price)%0A%20%20%20%20%20%20%20%20%2F%20t.price%20*%2010000)%20AS%20markout_5s_bps%2C%0A%20%20%20%20avg((m.best_ask%20-%20m.best_bid)%0A%20%20%20%20%20%20%20%20%2F%20((m.best_bid%20%2B%20m.best_ask)%20%2F%202)%20*%2010000)%20AS%20avg_spread_bps%0AFROM%20fx_trades%20t%0AHORIZON%20JOIN%20market_data%20m%20ON%20(symbol)%0A%20%20%20%20LIST%20(5s)%20AS%20h%0AWHERE%20t.side%20%3D%20%27buy%27%0A%20%20%20%20AND%20t.timestamp%20IN%20%27%24yesterday%27%0AGROUP%20BY%20t.symbol%2C%20t.ecn%2C%20hour(t.timestamp)%2C%20h.offset%0AORDER%20BY%20t.symbol%2C%20t.ecn%2C%20hour_utc%3B&executeQuery=true)
SELECT t.symbol, t.ecn, hour(t.timestamp) AS hour_utc, h.offset, count() AS n, avg(((m.best_bid + m.best_ask) / 2 - t.price) / t.price * 10000) AS markout_5s_bps, avg((m.best_ask - m.best_bid) / ((m.best_bid + m.best_ask) / 2) * 10000) AS avg_spread_bpsFROM fx_trades tHORIZON JOIN market_data m ON (symbol) LIST (5s) AS hWHERE t.side = 'buy' AND t.timestamp IN '$yesterday'GROUP BY t.symbol, t.ecn, hour(t.timestamp), h.offsetORDER BY t.symbol, t.ecn, hour_utc;
The 5-second markout is used as a quick toxicity signal — long enough for informed flow to show up, short enough to stay responsive.
Compare `markout_5s_bps` against `avg_spread_bps` for each hour. If an ECN shows tight spreads but deeply negative markouts during certain hours, the tight spreads are bait — you're earning a small spread but losing much more to adverse selection. Consider reducing or withdrawing liquidity on that venue during those hours.
Passive vs aggressive toxicity[](https://questdb.com/docs/cookbook/sql/finance/ecn-scorecard/#passive-vs-aggressive-toxicity "Direct link to Passive vs aggressive toxicity")
-------------------------------------------------------------------------------------------------------------------------------------------------------------------------------
The aggregate markout curves above blend passive and aggressive fills together. Splitting by `t.passive` reveals a critical distinction — toxicity on passive fills means your resting orders are being picked off, while toxicity on aggressive fills means you're crossing into a market that moves against you immediately:
Passive vs aggressive toxicity per ECN (buy side)[Demo this query](https://demo.questdb.io/?query=SELECT%0A%20%20%20%20t.symbol%2C%0A%20%20%20%20t.ecn%2C%0A%20%20%20%20t.passive%2C%0A%20%20%20%20h.offset%20%2F%201000000000%20AS%20horizon_sec%2C%0A%20%20%20%20count()%20AS%20n%2C%0A%20%20%20%20avg(((m.best_bid%20%2B%20m.best_ask)%20%2F%202%20-%20t.price)%0A%20%20%20%20%20%20%20%20%2F%20t.price%20*%2010000)%20AS%20avg_markout_bps%0AFROM%20fx_trades%20t%0AHORIZON%20JOIN%20market_data%20m%20ON%20(symbol)%0A%20%20%20%20LIST%20(0%2C%201s%2C%205s%2C%2010s%2C%201m)%20AS%20h%0AWHERE%20t.side%20%3D%20%27buy%27%0A%20%20%20%20AND%20t.timestamp%20IN%20%27%24yesterday%27%0AGROUP%20BY%20t.symbol%2C%20t.ecn%2C%20t.passive%2C%20horizon_sec%0AORDER%20BY%20t.symbol%2C%20t.ecn%2C%20t.passive%2C%20horizon_sec%3B&executeQuery=true)
SELECT t.symbol, t.ecn, t.passive, h.offset / 1000000000 AS horizon_sec, count() AS n, avg(((m.best_bid + m.best_ask) / 2 - t.price) / t.price * 10000) AS avg_markout_bpsFROM fx_trades tHORIZON JOIN market_data m ON (symbol) LIST (0, 1s, 5s, 10s, 1m) AS hWHERE t.side = 'buy' AND t.timestamp IN '$yesterday'GROUP BY t.symbol, t.ecn, t.passive, horizon_secORDER BY t.symbol, t.ecn, t.passive, horizon_sec;
Compare the markout curves for `passive = true` vs `passive = false` on each ECN:
* **Healthy passive fills**: Positive markout at offset 0 (you earned the spread), gradually decaying toward zero. You rested at a good level and the market didn't move against you.
* **Toxic passive fills**: Markout turns negative quickly. Someone on that ECN is systematically sniping your resting orders — they trade against you just before the market moves in their direction.
* **Healthy aggressive fills**: Small negative markout at offset 0 (you paid the spread), staying flat or recovering. Normal cost of crossing.
* **Toxic aggressive fills**: Markout becomes increasingly negative. The market continues to move against you after you cross, suggesting you're consistently late or trading against informed flow.
An ECN showing clean aggregate markouts can still have a problem if passive fills are deeply toxic while aggressive fills look fine — the two patterns cancel out in the blend. Always check both sides separately.
Composite toxicity score[](https://questdb.com/docs/cookbook/sql/finance/ecn-scorecard/#composite-toxicity-score "Direct link to Composite toxicity score")
-------------------------------------------------------------------------------------------------------------------------------------------------------------
Rank ECNs by a single toxicity metric — the volume-weighted 5-second markout — alongside an `adverse_fill_ratio` that shows what fraction of fills moved against you:
Composite toxicity score per ECN (buy side)[Demo this query](https://demo.questdb.io/?query=SELECT%0A%20%20%20%20t.symbol%2C%0A%20%20%20%20t.ecn%2C%0A%20%20%20%20h.offset%2C%0A%20%20%20%20count()%20AS%20fill_count%2C%0A%20%20%20%20sum(t.quantity)%20AS%20total_volume%2C%0A%20%20%20%20sum(((m.best_bid%20%2B%20m.best_ask)%20%2F%202%20-%20t.price)%0A%20%20%20%20%20%20%20%20%2F%20t.price%20*%2010000%20*%20t.quantity)%0A%20%20%20%20%20%20%20%20%2F%20sum(t.quantity)%20AS%20vw_markout_5s_bps%2C%0A%20%20%20%20avg(CASE%0A%20%20%20%20%20%20%20%20WHEN%20(m.best_bid%20%2B%20m.best_ask)%20%2F%202%20%3C%20t.price%20THEN%201.0%0A%20%20%20%20%20%20%20%20ELSE%200.0%0A%20%20%20%20END)%20AS%20adverse_fill_ratio%0AFROM%20fx_trades%20t%0AHORIZON%20JOIN%20market_data%20m%20ON%20(symbol)%0A%20%20%20%20LIST%20(5s)%20AS%20h%0AWHERE%20t.side%20%3D%20%27buy%27%0A%20%20%20%20AND%20t.timestamp%20IN%20%27%24yesterday%27%0AGROUP%20BY%20t.symbol%2C%20t.ecn%2C%20h.offset%0AORDER%20BY%20t.symbol%2C%20vw_markout_5s_bps%3B&executeQuery=true)
SELECT t.symbol, t.ecn, h.offset, count() AS fill_count, sum(t.quantity) AS total_volume, sum(((m.best_bid + m.best_ask) / 2 - t.price) / t.price * 10000 * t.quantity) / sum(t.quantity) AS vw_markout_5s_bps, avg(CASE WHEN (m.best_bid + m.best_ask) / 2 < t.price THEN 1.0 ELSE 0.0 END) AS adverse_fill_ratioFROM fx_trades tHORIZON JOIN market_data m ON (symbol) LIST (5s) AS hWHERE t.side = 'buy' AND t.timestamp IN '$yesterday'GROUP BY t.symbol, t.ecn, h.offsetORDER BY t.symbol, vw_markout_5s_bps;
The two metrics complement each other:
* **`vw_markout_5s_bps`** — volume-weighted 5-second markout in basis points. Negative means the market moved against you after fills on this ECN. Volume-weighting ensures large fills dominate the score.
* **`adverse_fill_ratio`** — fraction of fills where the mid-price at 5 seconds was worse than the execution price. Tells you whether toxicity is driven by a few large bad fills or is systemic across the board.
An ECN with a mildly negative `vw_markout_5s_bps` but 80%+ `adverse_fill_ratio` is fundamentally hostile — nearly every fill moves against you, even if the average magnitude is small. Conversely, a deeply negative `vw_markout_5s_bps` with a low `adverse_fill_ratio` suggests a few large toxic fills are dragging down the average, which may be addressable by adjusting size limits on that venue.
Pivoted ECN scorecard[](https://questdb.com/docs/cookbook/sql/finance/ecn-scorecard/#pivoted-ecn-scorecard "Direct link to Pivoted ECN scorecard")
----------------------------------------------------------------------------------------------------------------------------------------------------
The sections above produce one row per ECN per horizon offset. Using `PIVOT`, you can reshape the results into a wide format — one row per symbol-ECN combination with fill count, average size, volume, and markout at each horizon as separate columns:
Pivoted ECN scorecard (buy side)[Demo this query](https://demo.questdb.io/?query=WITH%20markouts%20AS%20(%0A%20%20%20%20SELECT%0A%20%20%20%20%20%20%20%20t.symbol%2C%0A%20%20%20%20%20%20%20%20t.ecn%2C%0A%20%20%20%20%20%20%20%20t.price%2C%0A%20%20%20%20%20%20%20%20t.quantity%2C%0A%20%20%20%20%20%20%20%20h.offset%2C%0A%20%20%20%20%20%20%20%20m.best_bid%2C%0A%20%20%20%20%20%20%20%20m.best_ask%0A%20%20%20%20FROM%20fx_trades%20t%0A%20%20%20%20HORIZON%20JOIN%20market_data%20m%20ON%20(symbol)%0A%20%20%20%20%20%20%20%20LIST%20(0%2C%205s%2C%201m)%20AS%20h%0A%20%20%20%20WHERE%20t.side%20%3D%20%27buy%27%0A%20%20%20%20%20%20%20%20AND%20t.timestamp%20IN%20%27%24yesterday%27%0A)%0ASELECT%20*%20FROM%20markouts%0APIVOT%20(%0A%20%20%20%20count()%20AS%20fills%2C%0A%20%20%20%20avg(quantity)%20AS%20avg_size%2C%0A%20%20%20%20sum(quantity)%20AS%20volume%2C%0A%20%20%20%20avg(((best_bid%20%2B%20best_ask)%20%2F%202%20-%20price)%20%2F%20price%20*%2010000)%20AS%20markout_bps%0A%20%20%20%20FOR%20offset%20IN%20(0%20AS%20at_fill%2C%205000000000%20AS%20t_5s%2C%2060000000000%20AS%20t_1m)%0A%20%20%20%20GROUP%20BY%20symbol%2C%20ecn%0A)%0AORDER%20BY%20t_5s_markout_bps%3B&executeQuery=true)
WITH markouts AS ( SELECT t.symbol, t.ecn, t.price, t.quantity, h.offset, m.best_bid, m.best_ask FROM fx_trades t HORIZON JOIN market_data m ON (symbol) LIST (0, 5s, 1m) AS h WHERE t.side = 'buy' AND t.timestamp IN '$yesterday')SELECT * FROM markoutsPIVOT ( count() AS fills, avg(quantity) AS avg_size, sum(quantity) AS volume, avg(((best_bid + best_ask) / 2 - price) / price * 10000) AS markout_bps FOR offset IN (0 AS at_fill, 5000000000 AS t_5s, 60000000000 AS t_1m) GROUP BY symbol, ecn)ORDER BY t_5s_markout_bps;
The result has columns like `at_fill_fills`, `at_fill_markout_bps`, `t_5s_markout_bps`, `t_1m_markout_bps`, etc. — one set per horizon. This is useful for dashboard views where you want a single wide table rather than long-form output.
Raw markouts can be misleading if an ECN rejects most of your flow and only fills the toxic orders. Compare `at_fill_fills` and `at_fill_avg_size` across ECNs — an ECN that fills fewer, smaller orders but shows clean markouts may simply be rejecting the hard-to-fill flow. A more complete picture requires comparing fill sizes against quoted sizes or incorporating reject rates from an orders table.
Related documentation
* [ASOF JOIN](https://questdb.com/docs/query/sql/asof-join/)
* [HORIZON JOIN](https://questdb.com/docs/query/sql/horizon-join/)
* [Slippage per fill recipe](https://questdb.com/docs/cookbook/sql/finance/slippage/)
* [Markout analysis recipe](https://questdb.com/docs/cookbook/sql/finance/markout/)
* [Bid-ask spread recipe](https://questdb.com/docs/cookbook/sql/finance/bid-ask-spread/)
* [Problem](https://questdb.com/docs/cookbook/sql/finance/ecn-scorecard/#problem)
* [Solution](https://questdb.com/docs/cookbook/sql/finance/ecn-scorecard/#solution)
* [How it works](https://questdb.com/docs/cookbook/sql/finance/ecn-scorecard/#how-it-works)
* [Interpreting results](https://questdb.com/docs/cookbook/sql/finance/ecn-scorecard/#interpreting-results)
* [ECN markout curves](https://questdb.com/docs/cookbook/sql/finance/ecn-scorecard/#ecn-markout-curves)
* [Toxicity by time of day](https://questdb.com/docs/cookbook/sql/finance/ecn-scorecard/#toxicity-by-time-of-day)
* [Passive vs aggressive toxicity](https://questdb.com/docs/cookbook/sql/finance/ecn-scorecard/#passive-vs-aggressive-toxicity)
* [Composite toxicity score](https://questdb.com/docs/cookbook/sql/finance/ecn-scorecard/#composite-toxicity-score)
* [Pivoted ECN scorecard](https://questdb.com/docs/cookbook/sql/finance/ecn-scorecard/#pivoted-ecn-scorecard)
---
# Client configuration string | QuestDB
On this page
You configure a QuestDB ingestion client with a configuration string. The syntax is the same in all clients, and there are a number of common options. There are also language-specific settings.
This document provides a general overview and documents the common options.
Configuration string breakdown[](https://questdb.com/docs/ingestion/clients/configuration-string/#configuration-string-breakdown "Direct link to Configuration string breakdown")
-----------------------------------------------------------------------------------------------------------------------------------------------------------------------------------
These are the common configuration options.
### Protocol Version[](https://questdb.com/docs/ingestion/clients/configuration-string/#protocol-version "Direct link to Protocol Version")
`protocol_version` — sets the line protocol version
Valid options are:
| Value | Behavior | QuestDB Version |
| --- | --- | --- |
| `1` | \- plain-text serialization
\- compatible with InfluxDB servers
\- no array type support | all |
| `2` | \- binary encoding for f64
\- full support for array | \>=9.0.0 |
| `auto` | \- **HTTP/HTTPS**: negotiates the best version with the server
\- **TCP/TCPS**: no negotiation, uses version 1 | |
### HTTP transport authentication[](https://questdb.com/docs/ingestion/clients/configuration-string/#http-transport-authentication "Direct link to HTTP transport authentication")
* `username` — username for HTTP basic authentication
* `password` — password for HTTP basic authentication
* `token` — bearer token for HTTP authentication
### TCP transport authentication[](https://questdb.com/docs/ingestion/clients/configuration-string/#tcp-transport-authentication "Direct link to TCP transport authentication")
* `username` — username for TCP authentication
* `token` — token for TCP authentication
### Auto-flushing[](https://questdb.com/docs/ingestion/clients/configuration-string/#auto-flushing "Direct link to Auto-flushing")
* `auto_flush` — global switch for the auto-flushing behavior. Options are `on` or `off`. Defaults to `on`
* `auto_flush_rows` — number of rows that will trigger a flush. This option is supported for HTTP transport only. Defaults to 75,000
* `auto_flush_interval` — time in milliseconds that will trigger a flush. Defaults to 1000. Used only for HTTP transport
When using the TCP transport, the client automatically flushes when its buffer is full. It uses a fixed-size buffer, whose size you can set with `init_buf_size` (see below).
### Buffer[](https://questdb.com/docs/ingestion/clients/configuration-string/#buffer "Direct link to Buffer")
* `init_buf_size` — initial size of the buffer in bytes. Default: 65536 (64KiB). Also sets the fixed buffer size for TCP transport
* `max_buf_size` — maximum size of the buffer in bytes. Default: 104857600 (100MiB). Used only for HTTP transport
### HTTP Transport[](https://questdb.com/docs/ingestion/clients/configuration-string/#http-transport "Direct link to HTTP Transport")
* `retry_timeout` — time in milliseconds to continue retrying after a failed HTTP request. The interval between retries is an exponential backoff starting at 10ms and doubling after each failed attempt up to a maximum of 1 second. Default: 10000 (10 seconds)
* `request_timeout` — time in milliseconds to wait for a response from the server. This is in addition to the calculation derived from the `request_min_throughput` parameter. Default: 10000 (10 seconds)
* `request_min_throughput` — minimum expected throughput in bytes per second for HTTP requests. If the throughput is lower than this value, the connection will time out. This is used to calculate an additional timeout on top of `request_timeout`. This is useful for large requests. You can set this value to `0` to disable this logic
### TLS encryption[](https://questdb.com/docs/ingestion/clients/configuration-string/#tls-encryption "Direct link to TLS encryption")
To enable TLS, select the `https` or `tcps` protocol.
The following options are available:
* `tls_roots` — path to a Java keystore file containing trusted root certificates. Defaults to the system default trust store
* `tls_roots_password` — password for the keystore file. It's always required when `tls_roots` is set
* `tls_verify` — whether to verify the server's certificate. This should only be used for testing as a last resort and never used in production as it makes the connection vulnerable to man-in-the-middle attacks. Options are `on` or `unsafe_off`. Defaults to `on`
Other considerations[](https://questdb.com/docs/ingestion/clients/configuration-string/#other-considerations "Direct link to Other considerations")
-----------------------------------------------------------------------------------------------------------------------------------------------------
* Please refer to the [ILP overview](https://questdb.com/docs/ingestion/ilp/overview/)
for details about transactions, error control, delivery guarantees, health check, or table and column auto-creation.
* The method `flush()` can be called to force sending the internal buffer to a server, even when the buffer is not full yet.
* [Configuration string breakdown](https://questdb.com/docs/ingestion/clients/configuration-string/#configuration-string-breakdown)
* [Protocol Version](https://questdb.com/docs/ingestion/clients/configuration-string/#protocol-version)
* [HTTP transport authentication](https://questdb.com/docs/ingestion/clients/configuration-string/#http-transport-authentication)
* [TCP transport authentication](https://questdb.com/docs/ingestion/clients/configuration-string/#tcp-transport-authentication)
* [Auto-flushing](https://questdb.com/docs/ingestion/clients/configuration-string/#auto-flushing)
* [Buffer](https://questdb.com/docs/ingestion/clients/configuration-string/#buffer)
* [HTTP Transport](https://questdb.com/docs/ingestion/clients/configuration-string/#http-transport)
* [TLS encryption](https://questdb.com/docs/ingestion/clients/configuration-string/#tls-encryption)
* [Other considerations](https://questdb.com/docs/ingestion/clients/configuration-string/#other-considerations)
---
# QuestDB Enterprise quick start | QuestDB
On this page
QuestDB Enterprise offers the entire feature set of QuestDB open source, with premium additions.
This guide will walk you through a basic Enterprise setup.
Each production configuration will be unique, however these examples will help inform your own unique choices.
* * *
[Requirements](https://questdb.com/docs/getting-started/enterprise-quick-start/#requirements)
[0\. Secure the built in admin](https://questdb.com/docs/getting-started/enterprise-quick-start/#0-secure-the-built-in-admin)
[1\. Setup TLS](https://questdb.com/docs/getting-started/enterprise-quick-start/#1-setup-tls)
[2\. Setup a database administrator](https://questdb.com/docs/getting-started/enterprise-quick-start/#2-setup-a-database-administrator)
[3\. Create interactive user accounts](https://questdb.com/docs/getting-started/enterprise-quick-start/#3-create-interactive-user-accounts)
[4\. Ingest data, InfluxDB Line Protocol](https://questdb.com/docs/getting-started/enterprise-quick-start/#4-ingest-data-influxdb-line-protocol)
[5\. Ingest data, Kafka Connect (optional)](https://questdb.com/docs/getting-started/enterprise-quick-start/#5-ingest-data-kafka-connect-optional)
[6\. Query data, PostgreSQL query](https://questdb.com/docs/getting-started/enterprise-quick-start/#6-query-data-postgresql-query)
[7\. Setup replication](https://questdb.com/docs/getting-started/enterprise-quick-start/#7-setup-replication)
[8\. Enable compression](https://questdb.com/docs/getting-started/enterprise-quick-start/#8-enable-compression)
[9\. Double-check kernel limits](https://questdb.com/docs/getting-started/enterprise-quick-start/#9-double-check-kernel-limits)
[Next steps](https://questdb.com/docs/getting-started/enterprise-quick-start/#next-steps)
[FAQ](https://questdb.com/docs/getting-started/enterprise-quick-start/#faq)
* * *
Requirements[](https://questdb.com/docs/getting-started/enterprise-quick-start/#requirements "Direct link to Requirements")
-----------------------------------------------------------------------------------------------------------------------------
The following are required prior to following this guide:
* QuestDB Enterprise binary with an active license
* No license? [Contact us](https://questdb.com/enterprise/contact/)
for more information.
* Use of a [supported file system](https://questdb.com/docs/getting-started/capacity-planning/#supported-filesystems)
* A [Zettabyte File System (ZFS)](https://openzfs.org/wiki/Main_Page)
is recommended to enable compression
Installation guide[](https://questdb.com/docs/getting-started/enterprise-quick-start/#installation-guide "Direct link to Installation guide")
-----------------------------------------------------------------------------------------------------------------------------------------------
Changes take place in your `conf/server.conf` file, the QuestDB [Web Console](https://questdb.com/docs/getting-started/web-console/overview/)
, your app code or third-party tool.
Check the code snippet's title to see where the command is to be invoked.
If you run into any trouble, please [contact us](mailto:support@questdb.io)
by email or visit the [Community Forum](https://community.questdb.com/)
.
0\. Secure the built in admin[](https://questdb.com/docs/getting-started/enterprise-quick-start/#0-secure-the-built-in-admin "Direct link to 0. Secure the built in admin")
-----------------------------------------------------------------------------------------------------------------------------------------------------------------------------
QuestDB Enterprise provides a built-in administrator account.
By default, it has the login `admin` and the password `quest`.
Before you go any further, please **change the default password**!
Consider changing the name, too.
To change these values, swap your own in place of `myadmin` and `my_very_secure_pwd`:
server.conf - Securing built-in admin account
# the built-in admin's user name and passwordacl.admin.user=myadminacl.admin.password=my_very_secure_pwd
Kubernetes deployments
In Kubernetes, you can read the password from a mounted secret file instead of hardcoding it. Set `QDB_ACL_ADMIN_PASSWORD_FILE` to the path of the mounted secret. See [Secrets from files](https://questdb.com/docs/configuration/overview/#secrets-from-files)
for details.
We will optionally disable this built-in administrator account later.
For more on access control, see [Role-Based Access Control](https://questdb.com/docs/security/rbac/)
.
1\. Setup TLS[](https://questdb.com/docs/getting-started/enterprise-quick-start/#1-setup-tls "Direct link to 1. Setup TLS")
-----------------------------------------------------------------------------------------------------------------------------
QuestDB supports TLS versions 1.2 and 1.3.
To configure TLS on all interfaces, set the following:
server.conf - Changing cert paths
tls.enabled=truetls.cert.path=/path/to/certificate.pemtls.private.key.path=/path/to/private_key
To hot-reload the certificate and private key and update the files on disk, login to your QuestDB [Web Console](https://questdb.com/docs/getting-started/web-console/overview/)
. This is accessible by default at `http://localhost:9000`. Login using the built-in administrator credential.
Then, execute:
Web Console - Reloading TLS
SELECT reload_tls();
TLS is now active.
For more details on TLS see the [TLS operations documentation](https://questdb.com/docs/security/tls/)
.
2\. Setup a database administrator[](https://questdb.com/docs/getting-started/enterprise-quick-start/#2-setup-a-database-administrator "Direct link to 2. Setup a database administrator")
--------------------------------------------------------------------------------------------------------------------------------------------------------------------------------------------
The built-in admin aids in the first mile, and as needed on a recovery basis.
A helpful practice is to have one created admin through which to setup other accounts.
Create a new database admin:
Web Console - Creating an admin; use your own, secure password!
CREATE USER myadmin WITH PASSWORD 'xyz';GRANT all TO myadmin WITH GRANT OPTION;
For emphasis: Please choose a secure password!
After admin creation, we can now disable the built-in `admin`:
server.conf - Disabling service account
acl.admin.user.enabled=false
Can you keep it? If it's secured, it's up to you. Consider different roles. You may be setting up an Enterprise cluster as the infrastructure admin. In this case, the built-in admin is your tool to do infrastructure tasks. The admin we just created may be of a different persona, the one who sets up users, groups, dictates how data can enter and be queried.
However you break it down, remember that it can always be reactivated.
3\. Create interactive user accounts[](https://questdb.com/docs/getting-started/enterprise-quick-start/#3-create-interactive-user-accounts "Direct link to 3. Create interactive user accounts")
--------------------------------------------------------------------------------------------------------------------------------------------------------------------------------------------------
Now that you have an admin account, create interactive users.
Interactive users are those who will ingest into and query your database, and manipulate its data. These are different than administrators, like you, who delegate permissions.
Create and govern users through **role-based access control** and the curation of your **access control list**.
Interactive users may utilize the [Web Console](https://questdb.com/docs/getting-started/web-console/overview/)
and/or the Postgres querying clients. It is common practice to set them up as `readonly`. But how you setup these users or groups is up to you.
For ingestion, we'll cover that in the next section. Consider this first wave of users your "database consumers".
For permissions, the [Web Console](https://questdb.com/docs/getting-started/web-console/overview/)
requires `HTTP`, and the PostgreSQL interface requires `PGWIRE`:
Web Console - Creating multiple users with differing permissions.
-- Read only user, can read all tables:CREATE USER readonly WITH PASSWORD 'xyz';GRANT HTTP, PGWIRE TO readonly;GRANT SELECT ON ALL TABLES TO readonly;-- User with all permissions on a specific table:CREATE USER user1 WITH PASSWORD 'abc';GRANT HTTP, PGWIRE TO user1;GRANT ALL ON table1 TO user1;-- User who can manage access to a specific table:CREATE USER user2 WITH PASSWORD 'abc';GRANT HTTP, PGWIRE TO user2;GRANT ALL ON table2 TO user2 WITH GRANT OPTION;
Permission grants can be specific and fine-tuned.
List the full list of applied permissions with `all_permissions()`.
* For the full role-based access control docs, including group management, see the [RBAC operations guide](https://questdb.com/docs/security/rbac/)
.
* For a full list of available permissions, see the [permissions sub-section in the RBAC operations guide](https://questdb.com/docs/security/rbac/#permissions)
.
4\. Ingest data, InfluxDB Line Protocol[](https://questdb.com/docs/getting-started/enterprise-quick-start/#4-ingest-data-influxdb-line-protocol "Direct link to 4. Ingest data, InfluxDB Line Protocol")
----------------------------------------------------------------------------------------------------------------------------------------------------------------------------------------------------------
The recommended method for high-throughput ingestion is InfluxDB Line Protocol (ILP) over HTTP.
We recommend using a service account for programmatic ingestion. Service accounts apply a cleaner set of access permissions and are less likely to be affected by day-to-day user management.
The process is:
1. Create a service account and grant it permissions.
2. Generate a **REST token** for the service account.
3. Use this token in your client's connection string.
### Step 1: Create the Service Account[](https://questdb.com/docs/getting-started/enterprise-quick-start/#step-1-create-the-service-account "Direct link to Step 1: Create the Service Account")
First, run the following SQL in the web console. This creates a service account named `ingest_http` and grants it the necessary permissions to use HTTP endpoints and manage data.
Web Console - Setup a service account
CREATE SERVICE ACCOUNT ingest_ilp;-- Grant permission to create tables and use HTTP endpointsGRANT HTTP, CREATE TABLE TO ingest_ilp;-- Grant permission to add columns and insert dataGRANT ADD COLUMN, INSERT ON ALL TABLES TO ingest_ilp;-- OR, for more granular control:-- GRANT ADD COLUMN, INSERT ON table1, table2 TO ingest_ilp;
### Step 2: Generate an Authentication Token[](https://questdb.com/docs/getting-started/enterprise-quick-start/#step-2-generate-an-authentication-token "Direct link to Step 2: Generate an Authentication Token")
Next, generate a REST API token for the service account. This token acts as a password, so you must store it securely.
Web Console - Generate a token for the ingest client
ALTER SERVICE ACCOUNT ingest_ilp CREATE TOKEN TYPE REST WITH TTL '3000d' REFRESH;
This command returns a token. **Copy it immediately**, as it's shown only once.
| name | token | expires\_at | refresh |
| --- | --- | --- | --- |
| ingest\_ilp | qt1KAsf1U9YbUVAX1H2IahXEE3-4qBcK-zx\_jsZUzV9bLY | 2033-09-19T15:32:51.628453Z | true |
### Step 3: Use the Token in Your Client[](https://questdb.com/docs/getting-started/enterprise-quick-start/#step-3-use-the-token-in-your-client "Direct link to Step 3: Use the Token in Your Client")
You can now use this token to authenticate your application. The following Java example shows how to use the client library by configuring it from a connection string. This is the recommended approach.
Java - Ingesting data via ILP
import io.questdb.client.Sender;import java.time.temporal.ChronoUnit;public class Ingest { public static void main(String[] args) { try (Sender sender = Sender.fromConfig("https::addr=localhost:9000;token=qt1KAsf1U9YbUVAX1H2IahXEE3-4qBcK-zx_jsZUzV9bLY;")) { sender.table("ilptest"); sender.symbol("sym1", "symval1") .doubleColumn("double1", 100.0) .at(System.currentTimeMillis(), ChronoUnit.MILLIS); } }}
A Note on TLS
The `https::` prefix in the connection string tells the client to connect using TLS. By default, the client will verify the server's certificate. For local testing with self-signed certificates, you can disable this validation by adding `tls.verify=insecure;` to the configuration string. **This is not recommended for production.**
Connecting a client to ILP is a common path.
However, you may use something like [Kafka](https://questdb.com/docs/ingestion/message-brokers/kafka/)
.
For more on ILP ingestion, see:
* [ILP Overview](https://questdb.com/docs/ingestion/ilp/overview/)
— Protocol details and configuration
* [Ingestion Overview](https://questdb.com/docs/ingestion/overview/)
— Client libraries and ingestion methods
5\. Ingest data, Kafka Connect (optional)[](https://questdb.com/docs/getting-started/enterprise-quick-start/#5-ingest-data-kafka-connect-optional "Direct link to 5. Ingest data, Kafka Connect (optional)")
--------------------------------------------------------------------------------------------------------------------------------------------------------------------------------------------------------------
_If you're not using Kafka, you can skip to section 6._
The official **QuestDB Kafka Connect sink** forwards messages from Kafka topics directly to your database using ILP protocol. The setup process is straightforward:
1. Create a dedicated service account in QuestDB.
2. Generate an authentication token for the account.
3. Configure the Kafka sink connector with your QuestDB address and the token.
### **Step 1: Create the Service Account**[](https://questdb.com/docs/getting-started/enterprise-quick-start/#step-1-create-the-service-account-1 "Direct link to step-1-create-the-service-account-1")
In the QuestDB web console, create a service account named `kafka` and grant it the permissions required to connect and write data.
Web Console - Create a Kafka service account
CREATE SERVICE ACCOUNT kafka;-- Grant permissions to use HTTP, create tables, add new columns and insert dataGRANT HTTP, CREATE TABLE TO kafka;GRANT ADD COLUMN, INSERT ON ALL TABLES TO kafka;-- OR, for more granular control:-- GRANT ADD COLUMN, INSERT ON table1, table2 TO ingest_ilp;
### **Step 2: Generate an Authentication Token**[](https://questdb.com/docs/getting-started/enterprise-quick-start/#step-2-generate-an-authentication-token-1 "Direct link to step-2-generate-an-authentication-token-1")
Next, generate a REST API token for the `kafka` service account. This token is a secret credential and should be treated like a password.
Web Console - Generate a token for the service account
-- Creates a token that is valid for 1 year (365 days)ALTER SERVICE ACCOUNT kafka CREATE TOKEN TYPE REST WITH TTL '365d';
The command returns a token. **Copy it immediately**, as it will not be shown again.
| name | token | expires\_at |
| --- | --- | --- |
| kafka | `qt1KAsf1U9YbUVAX1H2IahXEE3-4qBcK-zx_jsZUzV9bLY` | `2026-07-03T18:05:00.000000Z` |
Save the private key in a secure location!
### **Step 3: Configure the Kafka Connect Sink**[](https://questdb.com/docs/getting-started/enterprise-quick-start/#step-3-configure-the-kafka-connect-sink "Direct link to step-3-configure-the-kafka-connect-sink")
Create a configuration file for the QuestDB sink connector. In the `client.conf.string` property, provide your QuestDB server address and paste the token you just generated.
questdb-sink.properties
# --- Connector Identity ---name=QuestDBSinkConnectorconnector.class=io.questdb.kafka.QuestDBSinkConnectortasks.max=1# --- Source Kafka Topic ---topics=your_kafka_topic# --- QuestDB Connection ---# Use https:: if your QuestDB server has TLS enabled.# Replace the placeholder with the token you generated.client.conf.string=https::addr=localhost:9000;token=qt1KAsf1U9YbUVAX1H2IahXEE3-4qBcK-zx_jsZUzV9bLY;# --- Optional: Data Mapping ---# Use a field from the Kafka message key or value as a QuestDB symbol.# symbol.columns=device_id
Once you deploy this configuration, the connector will start sending data from your Kafka topic to QuestDB. If you encounter any issues, check the logs for both your Kafka Connect worker and your QuestDB server for more details.
See the [QuestDB Kafka Connector documentation](https://questdb.com/docs/ingestion/message-brokers/kafka/#questdb-kafka-connect-connector)
for more details on the configuration options and how to set up the connector.
6\. Query data, PostgreSQL query[](https://questdb.com/docs/getting-started/enterprise-quick-start/#6-query-data-postgresql-query "Direct link to 6. Query data, PostgreSQL query")
-------------------------------------------------------------------------------------------------------------------------------------------------------------------------------------
Now onto querying.
We will demonstrate programmatic querying via the PostgreSQL interface.
Again, in this case we recommend a unique user or a service account.
We will create a service account named "dashboard".
We'd assume that this is Grafana or a similar visual data representation application.
To setup the service account:
Web Console - Create a service account called 'dashboard' and grant permissions
CREATE SERVICE ACCOUNT dashboard WITH password 'pwd';GRANT pgwire TO dashboard;GRANT select on all tables TO dashboard;
Applying Java & jdbc, we can setup a client to query.
We're providing a username and password instead of a token:
Java - Querying via JDBC
import java.sql.*;import java.util.Properties;public class App { public static void main(String[] args) throws SQLException { Properties properties = new Properties(); properties.setProperty("user", "dashboard"); properties.setProperty("password", "pwd"); properties.setProperty("sslmode", "require"); final Connection connection = DriverManager.getConnection( "jdbc:postgresql://localhost:8812/qdb", properties); try (PreparedStatement preparedStatement = connection.prepareStatement( "SELECT x, timestamp_sequence('2023-07-20', 1000000) FROM long_sequence(5);")) { try (ResultSet rs = preparedStatement.executeQuery()) { while (rs.next()) { System.out.println(rs.getLong(1)); System.out.println(rs.getTimestamp(2)); } } } connection.close(); }}
This covers the very basics of user creation and service accounts.
We have an `ingest` service account and a `dashboard` service account.
For more on querying, see:
* [PostgreSQL Wire Protocol](https://questdb.com/docs/query/pgwire/overview/)
— Connection details and compatibility
* [Query & SQL Overview](https://questdb.com/docs/query/overview/)
— SQL syntax and functions
> For the full role-based access control docs, including group management, see the [RBAC operations guide](https://questdb.com/docs/security/rbac/)
> .
Next, we will enable Enterprise-specific features.
7\. Setup replication[](https://questdb.com/docs/getting-started/enterprise-quick-start/#7-setup-replication "Direct link to 7. Setup replication")
-----------------------------------------------------------------------------------------------------------------------------------------------------
[Replication](https://questdb.com/docs/high-availability/overview/)
consists of:
* a primary database instance
* an object storage
* any number of replica instances
The primary instance uploads its Write Ahead Log (WAL) to the object storage, and the replica instances apply the same data to their tables by downloading and processing the WAL.
Full instructions can be found within the [replication page](https://questdb.com/docs/high-availability/setup/)
, however the key parts are:
1. _Setup the object storage_: Supported options are Azure Blob Storage, Amazon S3 or Network File Storage (NFS).
2. _Set up a primary node_: Alter the `server.conf` within the primary-to-be and create a snapshot of the database.
3. _Setting up a replica node_: Alter the `server.conf` in the replica(s)-to-be and perform "recovery" from the snapshot of the primary database. The snapshot provides a starting point for the instance, which will soon catch up with the primary node.
8\. Enable compression[](https://questdb.com/docs/getting-started/enterprise-quick-start/#8-enable-compression "Direct link to 8. Enable compression")
--------------------------------------------------------------------------------------------------------------------------------------------------------
Compression requires the [Zettabyte File System (ZFS)](https://openzfs.org/wiki/Main_Page)
.
We'll assume Ubuntu, and demonstrate the basics CLI commands which you'd apply in something like an AWS EC2 to enable ZFS:
Ubuntu - Install ZFS
sudo apt updatesudo apt install zfsutils-linux
To enable compression, create a ZPool with compression enabled:
Ubuntu - Enable compression
zpool create -m legacy -o feature@lz4_compress=enabled autoexpand=on -O compression=lz4 -t volume1 questdb-pool sdf
The exact commands depend on which version of ZFS you are running. Use the [ZFS docs](https://openzfs.github.io/openzfs-docs/man/master/8/zpool-create.8.html)
to customize your ZFS to meet your requirements.
If you are running QuestDB Enterprise in Kubernetes, QuestDB offers a [Container Storage Interface](https://github.com/container-storage-interface/spec/blob/master/spec.md)
(CSI) Driver to create ZFS volumes in your cluster.
Please contact us for more information to see if your version and distribution of Kubernetes is supported.
For more on storage and compression, see [Enable compression with ZFS](https://questdb.com/docs/deployment/compression-zfs/)
.
9\. Double-check kernel limits[](https://questdb.com/docs/getting-started/enterprise-quick-start/#9-double-check-kernel-limits "Direct link to 9. Double-check kernel limits")
--------------------------------------------------------------------------------------------------------------------------------------------------------------------------------
QuestDB works together with your server operating system to achieve maximum performance. Prior to putting your server under heavy loads, consider checking your [kernel-based limitations](https://questdb.com/docs/getting-started/capacity-planning/#os-configuration)
.
Specifically, increase the limits for how many files can be opened by your OS and its users, and the maximum amount of virtual memory allowed. This helps QuestDB operate most effectively.
Next steps[](https://questdb.com/docs/getting-started/enterprise-quick-start/#next-steps "Direct link to Next steps")
-----------------------------------------------------------------------------------------------------------------------
This guide has prepared you for reliable, production-ready usage of QuestDB Enterprise.
If you're new to QuestDB, consider checking out:
* [Ingestion overview](https://questdb.com/docs/ingestion/overview/)
: Learn the various ingestion methods and their benefits and tradeoffs, and pick a language client.
* [Query & SQL overview](https://questdb.com/docs/query/overview/)
: Learn how to query QuestDB.
Otherwise, enjoy!
FAQ[](https://questdb.com/docs/getting-started/enterprise-quick-start/#faq "Direct link to FAQ")
--------------------------------------------------------------------------------------------------
### General Setup and Configuration[](https://questdb.com/docs/getting-started/enterprise-quick-start/#general-setup-and-configuration "Direct link to General Setup and Configuration")
**Q: How do I change the default administrator password?**
A: To change the default administrator password, update your `server.conf` file with the following lines, replacing `myadmin` and `my_very_secure_pwd` with your chosen administrator username and a secure password:
acl.admin.user=myadminacl.admin.password=my_very_secure_pwd
**Q: What should I do if I encounter errors during the TLS setup process?**
A: If you encounter errors during the TLS setup, ensure that the certificate and private key paths are correctly specified in your `server.conf` file. Also, verify that your certificates are valid and not expired. For further troubleshooting, consult the [TLS operations](https://questdb.com/docs/security/tls/)
documentation.
### Security and Access Control[](https://questdb.com/docs/getting-started/enterprise-quick-start/#security-and-access-control "Direct link to Security and Access Control")
**Q: Can I recover a lost private key for a service account?**
A: No, once a private key for a service account is generated, it cannot be retrieved again. It is crucial to store it securely immediately upon creation. If lost, you will need to generate a new token for the service account.
**Q: How do I securely manage service account tokens?**
A: Securely managing service account tokens involves storing them in a safe location, such as a secure secrets management tool. Limit the distribution of these tokens and regularly rotate them to enhance security.
### Ingestion and Querying[](https://questdb.com/docs/getting-started/enterprise-quick-start/#ingestion-and-querying "Direct link to Ingestion and Querying")
**Q: What should I do if data ingestion via Kafka Connect fails?**
A: If data ingestion via Kafka Connect fails, check your service account permissions and ensure the private key used in Kafka's configuration matches the one generated for your service account. Also, verify your network settings and ensure there are no connectivity issues between Kafka and QuestDB.
**Q: How can I troubleshoot issues with querying data using the PostgreSQL interface?**
A: Ensure the service account or user has the correct permissions to query the tables of interest. Verify the connection string and authentication details used in your client application. For issues related to SSL, make sure the SSL mode is appropriately configured in your client connection settings.
### Replication and Compression[](https://questdb.com/docs/getting-started/enterprise-quick-start/#replication-and-compression "Direct link to Replication and Compression")
**Q: What steps should I take if replication is not working as expected?**
A: Verify that the object storage is correctly set up and accessible by the primary instance. Ensure the `server.conf` settings for replication are correctly configured on both the primary and replica nodes. Check the logs for any errors related to replication and ensure there's network connectivity between all involved parties.
**Q: Compression is enabled, but I'm not observing reduced storage usage. What could be the issue?**
A: Ensure that the ZFS filesystem is correctly configured with compression enabled. Note that the actual compression ratio achieved can vary significantly depending on the nature of your data. Some types of data may not compress well. Review the ZFS compression statistics to understand the compression level being achieved. If it seems out of expected range, please contact us.
* [Requirements](https://questdb.com/docs/getting-started/enterprise-quick-start/#requirements)
* [Installation guide](https://questdb.com/docs/getting-started/enterprise-quick-start/#installation-guide)
* [0\. Secure the built in admin](https://questdb.com/docs/getting-started/enterprise-quick-start/#0-secure-the-built-in-admin)
* [1\. Setup TLS](https://questdb.com/docs/getting-started/enterprise-quick-start/#1-setup-tls)
* [2\. Setup a database administrator](https://questdb.com/docs/getting-started/enterprise-quick-start/#2-setup-a-database-administrator)
* [3\. Create interactive user accounts](https://questdb.com/docs/getting-started/enterprise-quick-start/#3-create-interactive-user-accounts)
* [4\. Ingest data, InfluxDB Line Protocol](https://questdb.com/docs/getting-started/enterprise-quick-start/#4-ingest-data-influxdb-line-protocol)
* [Step 1: Create the Service Account](https://questdb.com/docs/getting-started/enterprise-quick-start/#step-1-create-the-service-account)
* [Step 2: Generate an Authentication Token](https://questdb.com/docs/getting-started/enterprise-quick-start/#step-2-generate-an-authentication-token)
* [Step 3: Use the Token in Your Client](https://questdb.com/docs/getting-started/enterprise-quick-start/#step-3-use-the-token-in-your-client)
* [5\. Ingest data, Kafka Connect (optional)](https://questdb.com/docs/getting-started/enterprise-quick-start/#5-ingest-data-kafka-connect-optional)
* [**Step 1: Create the Service Account**](https://questdb.com/docs/getting-started/enterprise-quick-start/#step-1-create-the-service-account-1)
* [**Step 2: Generate an Authentication Token**](https://questdb.com/docs/getting-started/enterprise-quick-start/#step-2-generate-an-authentication-token-1)
* [**Step 3: Configure the Kafka Connect Sink**](https://questdb.com/docs/getting-started/enterprise-quick-start/#step-3-configure-the-kafka-connect-sink)
* [6\. Query data, PostgreSQL query](https://questdb.com/docs/getting-started/enterprise-quick-start/#6-query-data-postgresql-query)
* [7\. Setup replication](https://questdb.com/docs/getting-started/enterprise-quick-start/#7-setup-replication)
* [8\. Enable compression](https://questdb.com/docs/getting-started/enterprise-quick-start/#8-enable-compression)
* [9\. Double-check kernel limits](https://questdb.com/docs/getting-started/enterprise-quick-start/#9-double-check-kernel-limits)
* [Next steps](https://questdb.com/docs/getting-started/enterprise-quick-start/#next-steps)
* [FAQ](https://questdb.com/docs/getting-started/enterprise-quick-start/#faq)
* [General Setup and Configuration](https://questdb.com/docs/getting-started/enterprise-quick-start/#general-setup-and-configuration)
* [Security and Access Control](https://questdb.com/docs/getting-started/enterprise-quick-start/#security-and-access-control)
* [Ingestion and Querying](https://questdb.com/docs/getting-started/enterprise-quick-start/#ingestion-and-querying)
* [Replication and Compression](https://questdb.com/docs/getting-started/enterprise-quick-start/#replication-and-compression)
---
# How UPDATE works | QuestDB
On this page
This page explains how QuestDB implements the [UPDATE statement](https://questdb.com/docs/query/sql/update/)
internally.
tip
UPDATE uses copy-on-write which increases disk usage. For high-frequency modifications, consider [append-oriented alternatives](https://questdb.com/docs/operations/modifying-data/)
that work with QuestDB's storage model.
Storage model[](https://questdb.com/docs/operations/updating-data/#storage-model "Direct link to Storage model")
------------------------------------------------------------------------------------------------------------------
To be able to understand how table rows are updated in QuestDB, first we need to have an idea of how the data is stored. The documentation contains detailed descriptions of the [storage engine](https://questdb.com/docs/architecture/storage-engine/)
and the [directory layout](https://questdb.com/docs/concepts/deep-dive/root-directory-structure/#db-directory)
but if we quickly want to summarize it:
* Each table has its own folder in the db root, the directory is named after the table
* Partitions are manifested as subdirectories under the folder which represents the table
* The actual data is stored in column files inside these subdirectories
* Column files store data **ordered by the designated timestamp** and they are **append-only**. This goes naturally with [time-series data](https://questdb.com/blog/what-is-time-series-data/)
, just think about market data where the price of different financial instruments are tracked during the trading day, for example
Column versions[](https://questdb.com/docs/operations/updating-data/#column-versions "Direct link to Column versions")
------------------------------------------------------------------------------------------------------------------------
Since files are append-only, updating existing data is not straightforward. QuestDB's storage model assumes past data rarely changes, which optimizes read performance. However, sometimes you need to amend data that was recorded incorrectly.
We could break our append-only model and modify column files in place, but this would cause inconsistent reads. Concurrent queries could see partially updated data.
The solution is to make the update **transactional** and **copy-on-write**. Basically a new column file is created when processing the UPDATE statement. All readers are looking at a previous consistent view of the data from an older column file while the UPDATE is in progress. Readers can find the latest committed version of column files based on a record stored in a metadata file. When the update is completed and a new column version is available for the readers, this metadata record gets updated as part of the commit. After metadata has changed newly submitted SELECT queries will see the updated data.
The copy-on-write approach gives us data consistency and good performance at a price, disk usage will increase. When sizing disk space we should account for extra storage to make sure UPDATE statements have enough headroom. Only those column files will get a new version where data is actually changing. For example, if only a single column is updated in a single partition of a table, then only a single column file will be rewritten.
Vacuum updated columns[](https://questdb.com/docs/operations/updating-data/#vacuum-updated-columns "Direct link to Vacuum updated columns")
---------------------------------------------------------------------------------------------------------------------------------------------
When a column is updated, the new version of the column is written to disk and a background task starts to vacuum redundant column files. The term Vacuum originates from Postgres, it means the collection of garbage and release of disk space. The Vacuum task checks periodically if older column versions are still used by readers and deletes unused files. Vacuum runs automatically and there is also a [`VACUUM TABLE`](https://questdb.com/docs/query/sql/vacuum-table/)
SQL command to trigger it.
Limitations[](https://questdb.com/docs/operations/updating-data/#limitations "Direct link to Limitations")
------------------------------------------------------------------------------------------------------------
UPDATE rewrites column files by copying records in their existing order and replacing values as needed. As a result, the **designated timestamp column cannot be updated**.
Modifying the designated timestamp would require reordering records and potentially moving rows between partitions.
* [Storage model](https://questdb.com/docs/operations/updating-data/#storage-model)
* [Column versions](https://questdb.com/docs/operations/updating-data/#column-versions)
* [Vacuum updated columns](https://questdb.com/docs/operations/updating-data/#vacuum-updated-columns)
* [Limitations](https://questdb.com/docs/operations/updating-data/#limitations)
---
# Automating QuestDB Tasks | QuestDB
On this page
QuestDB provides a simple [HTTP API](https://questdb.com/docs/query/rest-api/)
that allows you to interact with the database using SQL queries. This API can be leveraged for automation using Bash scripts and scheduled execution via cron jobs. This is a lightweight approach that requires minimal dependencies.
For a more robust approach, you might want to explore the integration with workflow orchestrators such as [Apache Airflow](https://questdb.com/docs/integrations/orchestration/airflow/)
or [Dagster](https://questdb.com/docs/integrations/orchestration/dagster/)
.
Prerequisites[](https://questdb.com/docs/operations/task-automation/#prerequisites "Direct link to Prerequisites")
--------------------------------------------------------------------------------------------------------------------
* QuestDB running locally or on a server
* `curl` installed (pre-installed on most Linux/macOS systems)
* Basic knowledge of Bash or similar scripting language
Example: Running a Scheduled Query[](https://questdb.com/docs/operations/task-automation/#example-running-a-scheduled-query "Direct link to Example: Running a Scheduled Query")
----------------------------------------------------------------------------------------------------------------------------------------------------------------------------------
The following example demonstrates how to execute a query using the HTTP API:
drop-partitions.sh
#!/bin/bash# QuestDB API URLQUESTDB_URL="http://localhost:9000/exec"# Query: Drop partitions older than 30 daysQUERY="ALTER TABLE my_table DROP PARTITION WHERE timestamp < dateadd('d', -30, now());"# Execute the querycurl -G "$QUESTDB_URL" --data-urlencode "query=$QUERY"
Automating with Cron[](https://questdb.com/docs/operations/task-automation/#automating-with-cron "Direct link to Automating with Cron")
-----------------------------------------------------------------------------------------------------------------------------------------
To execute this script daily at midnight, add the following line to your crontab:
0 0 * * * /path/to/script.sh
Pros & Cons[](https://questdb.com/docs/operations/task-automation/#pros--cons "Direct link to Pros & Cons")
-------------------------------------------------------------------------------------------------------------
✅ Simple to implement
✅ No external dependencies
✅ Works on any Unix-like system \\
❌ No monitoring or logging
❌ No built-in error handling
❌ No backfilling support
Next Steps[](https://questdb.com/docs/operations/task-automation/#next-steps "Direct link to Next Steps")
-----------------------------------------------------------------------------------------------------------
For more advanced automation, consider using a workflow orchestrator like [**Dagster**](https://questdb.com/docs/integrations/orchestration/dagster/)
or [**Apache Airflow**](https://questdb.com/docs/integrations/orchestration/airflow/)
.
* **Full Example Repository**: [https://github.com/questdb/data-orchestration-and-scheduling-samples](https://github.com/questdb/data-orchestration-and-scheduling-samples)
* [Prerequisites](https://questdb.com/docs/operations/task-automation/#prerequisites)
* [Example: Running a Scheduled Query](https://questdb.com/docs/operations/task-automation/#example-running-a-scheduled-query)
* [Automating with Cron](https://questdb.com/docs/operations/task-automation/#automating-with-cron)
* [Pros & Cons](https://questdb.com/docs/operations/task-automation/#pros--cons)
* [Next Steps](https://questdb.com/docs/operations/task-automation/#next-steps)
---
# Logging and metrics | QuestDB
On this page
This page outlines logging in QuestDB. It covers how to configure logs via `log.conf` and expose metrics via Prometheus.
* [Logging](https://questdb.com/docs/operations/logging-metrics/#logging)
* [Metrics](https://questdb.com/docs/operations/logging-metrics/#metrics)
Log location[](https://questdb.com/docs/operations/logging-metrics/#log-location "Direct link to Log location")
-----------------------------------------------------------------------------------------------------------------
QuestDB creates the following file structure in its [root\_directory](https://questdb.com/docs/concepts/deep-dive/root-directory-structure/)
:
questdb├── conf├── db├── log├── public└── snapshot (optional)
Log files are stored in the `log` folder:
├── log│ ├── stdout-2020-04-15T11-59-59.txt│ └── stdout-2020-04-12T13-31-22.txt
Understanding log levels[](https://questdb.com/docs/operations/logging-metrics/#understanding-log-levels "Direct link to Understanding log levels")
-----------------------------------------------------------------------------------------------------------------------------------------------------
QuestDB provides the following types of log information:
| Type | Marker | Details | Default |
| --- | --- | --- | --- |
| Advisory | A | Startup information such as hosts, listening ports, etc. Rarely used after startup | Enabled |
| Critical | C | Internal database errors. Serious issues. Things that should not happen in general operation. | Enabled |
| Error | E | An error, usually (but not always) caused by a user action such as inserting a `symbol` into a `timestamp` column. For context on how this error happened, check for Info-level messages logged before the error. | Enabled |
| Info | I | Logs for activities. Info-level messages often provide context for an error if one is logged later. | Enabled |
| Debug | D | Finer details on what is happening. Useful to debug issues. | Disabled |
For more information, see the [QuestDB source code](https://github.com/questdb/questdb/blob/master/core/src/main/java/io/questdb/log/LogLevel.java)
.
### Example log messages[](https://questdb.com/docs/operations/logging-metrics/#example-log-messages "Direct link to Example log messages")
Advisory:
2023-02-24T14:59:45.076113Z A server-main Config:2023-02-24T14:59:45.076130Z A server-main - http.enabled : true2023-02-24T14:59:45.076144Z A server-main - tcp.enabled : true2023-02-24T14:59:45.076159Z A server-main - pg.enabled : true
Critical:
2022-08-08T11:15:13.040767Z C i.q.c.p.WriterPool could not open [table=`sys.text_import_log`, thread=1, ex=could not open read-write [file=/opt/homebrew/var/questdb/db/sys.text_import_log/_todo_], errno=13]
Error:
2023-02-24T14:59:45.059012Z I i.q.c.t.t.InputFormatConfiguration loading input format config [resource=/text_loader.json]2023-03-20T08:38:17.076744Z E i.q.c.l.u.AbstractLineProtoUdpReceiver could not set receive buffer size [fd=140, size=8388608, errno=55]
Info:
2020-04-15T16:42:32.879970Z I i.q.c.TableReader new transaction [txn=2, transientRowCount=1, fixedRowCount=1, maxTimestamp=1585755801000000, attempts=0]2020-04-15T16:42:32.880051Z I i.q.g.FunctionParser call to_timestamp('2020-05-01:15:43:21','yyyy-MM-dd:HH:mm:ss') -> to_timestamp(Ss)
Debug:
2023-03-31T11:47:05.723715Z D i.q.g.FunctionParser call cast(investmentMill,INT) -> cast(Li)2023-03-31T11:47:05.723729Z D i.q.g.FunctionParser call rnd_symbol(4,4,4,2) -> rnd_symbol(iiii)
Logging[](https://questdb.com/docs/operations/logging-metrics/#logging "Direct link to Logging")
--------------------------------------------------------------------------------------------------
The logging behavior of QuestDB may be set in dedicated configuration files or by environment variables.
This section describes how to configure logging using these methods.
### Enable debug log[](https://questdb.com/docs/operations/logging-metrics/#enable-debug-log "Direct link to Enable debug log")
QuestDB `DEBUG` logging can be set globally.
1. Provide the java option `-Debug` on startup
2. Setting the `QDB_DEBUG=true` as an environment variable
### Configure log.conf[](https://questdb.com/docs/operations/logging-metrics/#configure-logconf "Direct link to Configure log.conf")
Logs may be configured via a dedicated configuration file `log.conf`.
QuestDB will look for `/log.conf` first in `conf/` directory and then on the classpath, unless this name is overridden via a command line property: `-Dout=/something_else.conf`.
QuestDB will create `conf/log.conf` using default values if `-Dout` is not set and file doesn't exist .
On Windows log messages go to depending on run mode :
* interactive session - console and `$dataDir\log\stdout-%Y-%m-%dT%H-%M-%S.txt` (default is `.\log\stdout-%Y-%m-%dT%H-%M-%S.txt` )
* service - `$dataDir\log\service-%Y-%m-%dT%H-%M-%S.txt` (default is `C:\Windows\System32\qdbroot\log\service-%Y-%m-%dT%H-%M-%S.txt` )
The possible values to enable within the `log.conf` appear as such:
log.conf
# list of configured writerswriters=file,stdout,http.min# rolling file writerw.file.class=io.questdb.log.LogRollingFileWriterw.file.location=${log.dir}/questdb-rolling.log.${date:yyyyMMdd}w.file.level=INFO,ERRORw.file.rollEvery=dayw.file.rollSize=1g# Optionally, use a single log# w.file.class=io.questdb.log.LogFileWriter# w.file.location=questdb-docker.log# w.file.level=INFO,ERROR,DEBUG# stdoutw.stdout.class=io.questdb.log.LogConsoleWriterw.stdout.level=INFO# min http server, used for error monitoringw.http.min.class=io.questdb.log.LogConsoleWriterw.http.min.level=ERROR## Scope provides specific context for targeted log parsingw.http.min.scope=http-min-server
#### Log writer types[](https://questdb.com/docs/operations/logging-metrics/#log-writer-types "Direct link to Log writer types")
There are four types of writer.
Which one you need depends on your use case.
| Available writers | Description |
| --- | --- |
| file | Select from one of the two above patterns. Write to a single log that will grow indefinitely, or write a rolling log. Rolling logs can be split into `minute`, `hour`, `day`, `month` or `year`. |
| stdout | Writes logs to standard output. |
| http.min | Enabled at port `9003` by default. For more information, see the next section: [minimal HTTP server](https://questdb.com/docs/operations/logging-metrics/#minimal-http-server)
. |
### Minimal HTTP server[](https://questdb.com/docs/operations/logging-metrics/#minimal-http-server "Direct link to Minimal HTTP server")
To provide a dedicated health check feature that would have no performance knock on other system components, QuestDB decouples health checks from the REST endpoints used for querying and ingesting data. For this purpose, a `min` HTTP server runs embedded in a QuestDB instance and has a separate log and thread pool configuration.
The `min` server is enabled by default and will reply to any `HTTP GET` request to port `9003`:
GET health status of local instance
curl -v http://127.0.0.1:9003
The server will respond with an HTTP status code of `200`, indicating that the system is operational:
200 'OK' response
* Trying 127.0.0.1...* TCP_NODELAY set* Connected to 127.0.0.1 (127.0.0.1) port 9003 (#0)> GET / HTTP/1.1> Host: 127.0.0.1:9003> User-Agent: curl/7.64.1> Accept: */*>< HTTP/1.1 200 OK< Server: questDB/1.0< Date: Tue, 26 Jan 2021 12:31:03 GMT< Transfer-Encoding: chunked< Content-Type: text/plain<* Connection #0 to host 127.0.0.1 left intact
Path segments are ignored which means that optional paths may be used in the URL and the server will respond with identical results, e.g.:
GET health status with arbitrary path
curl -v http://127.0.0.1:9003/status
The following configuration options can be set in your `server.conf`:
| Property | Default | Reloadable | Description |
| --- | --- | --- | --- |
| http.min.enabled | true | No | Enable or disable Minimal HTTP server. |
| http.min.bind.to | 0.0.0.0:9003 | No | IPv4 address and port of the server. `0` means it will bind to all network interfaces, otherwise the IP address must be one of the existing network adapters. |
| http.min.net.connection.limit | 4 | No | Active connection limit. |
| http.min.net.connection.timeout | 300000 | No | Idle connection timeout in milliseconds. |
| http.min.net.connection.hint | false | No | Windows specific flag to overcome OS limitations on TCP backlog size. |
| http.min.worker.count | | No | By default, minimal HTTP server uses shared thread pool for CPU core count 16 and below. It will use dedicated thread for core count above 16. When `0`, the server will use the shared pool. Do not set pool size to more than `1`. |
| http.min.worker.affinity | | No | Core number to pin thread to. |
| http.min.worker.haltOnError | false | No | Flag that indicates if the worker thread must stop when an unexpected error occurs. |
warning
On systems with [8 Cores and less](https://questdb.com/docs/getting-started/capacity-planning/#cpu-cores)
, contention for threads might increase the latency of health check service responses. If you use a load balancer, and it thinks the QuestDB service is dead with nothing apparent in the QuestDB logs, you may need to configure a dedicated thread pool for the health check service. To do so, increase `http.min.worker.count` to `1`.
### Environment variables[](https://questdb.com/docs/operations/logging-metrics/#environment-variables "Direct link to Environment variables")
Values in the log configuration file can be overridden with environment variables. All configuration keys must be formatted as described in the [environment variables](https://questdb.com/docs/operations/logging-metrics/#environment-variables)
section above.
For example, to set logging on `ERROR` level only:
Setting log level to ERROR in log-stdout.conf
w.stdout.level=ERROR
This can be passed as an environment variable as follows:
Setting log level to ERROR via environment variable
export QDB_LOG_W_STDOUT_LEVEL=ERROR
### Docker logging[](https://questdb.com/docs/operations/logging-metrics/#docker-logging "Direct link to Docker logging")
When mounting a volume to a Docker container, a logging configuration file may be provided in the container located at `./conf/log.conf`. For example, a file with the following contents can be created:
./conf/log.conf
# list of configured writerswriters=file,stdout,http.min# file writerw.file.class=io.questdb.log.LogFileWriterw.file.location=questdb-docker.logw.file.level=INFO,ERROR,DEBUG# stdoutw.stdout.class=io.questdb.log.LogConsoleWriterw.stdout.level=INFO# min http server, used for monitoringw.http.min.class=io.questdb.log.LogConsoleWriterw.http.min.level=ERROR## Scope provides specific context for targeted log parsingw.http.min.scope=http-min-server
The current directory can be mounted:
Mount the current directory to a QuestDB container
docker run -p 9000:9000 -v "$(pwd):/var/lib/questdb/" questdb/questdb
The container logs will be written to disk using the logging level and file name provided in the `./conf/log.conf` file, in this case in `./questdb-docker.log`.
### Windows log locations[](https://questdb.com/docs/operations/logging-metrics/#windows-log-locations "Direct link to Windows log locations")
When running QuestDB as Windows service you can check status in both:
* Windows Event Viewer: Look for events with "QuestDB" source in `Windows Logs | Application`
* The service log file: `$dataDir\log\service-%Y-%m-%dT%H-%M-%S.txt`
* Default: `C:\Windows\System32\qdbroot\log\service-%Y-%m-%dT%H-%M-%S.txt`
Metrics[](https://questdb.com/docs/operations/logging-metrics/#metrics "Direct link to Metrics")
--------------------------------------------------------------------------------------------------
QuestDB exposes a `/metrics` endpoint on port `9003` for internal system metrics in the Prometheus format. To use this functionality and get started with an example configuration, enable it in within your `server.conf`:
| Property | Default | Description |
| --- | --- | --- |
| metrics.enabled | false | Enable or disable metrics endpoint. |
For an example on how to setup Prometheus, see the [QuestDB and Prometheus documentation](https://questdb.com/docs/integrations/other/prometheus/)
.
### Prometheus Alertmanager[](https://questdb.com/docs/operations/logging-metrics/#prometheus-alertmanager "Direct link to Prometheus Alertmanager")
QuestDB includes a log writer that sends any message logged at critical level (logger.critical("may-day")) to Prometheus Alertmanager over a TCP/IP socket. To configure this writer, add it to the `writers` config alongside other log writers:
log.conf
# Which writers to enablewriters=stdout,alert# stdoutw.stdout.class=io.questdb.log.LogConsoleWriterw.stdout.level=INFO# Prometheus Alertingw.alert.class=io.questdb.log.LogAlertSocketWriterw.alert.level=CRITICALw.alert.location=/alert-manager-tpt.jsonw.alert.alertTargets=localhost:9093,localhost:9096,otherhost:9093w.alert.defaultAlertHost=localhostw.alert.defaultAlertPort=9093# The `inBufferSize` and `outBufferSize` properties are the size in bytes for the# socket write buffers.w.alert.inBufferSize=2mw.alert.outBufferSize=4m# Delay in milliseconds between two consecutive attempts to alert when# there is only one target configuredw.alert.reconnectDelay=250
Of all properties, only `w.alert.class` and `w.alert.level` are required, the rest assume default values as stated above (except for `w.alert.alertTargets` which is empty by default).
Alert targets are specified using `w.alert.alertTargets` as a comma-separated list of up to 12 `host:port` TCP/IP addresses. Specifying a port is optional and defaults to the value of `defaultAlertHost`. One of these alert managers is picked at random when QuestDB starts, and a connection is created.
All alerts will be sent to the chosen server unless it becomes unavailable. If it is unavailable, the next server is chosen. If there is only one server configured and a fail-over cannot occur, a delay of 250 milliseconds is added between send attempts.
The `w.alert.location` property refers to the path (absolute, otherwise relative to `-d database-root`) of a template file. By default, it is a resource file which contains:
/alert-manager-tpt.json
[ { "Status": "firing", "Labels": { "alertname": "QuestDbInstanceLogs", "service": "QuestDB", "category": "application-logs", "severity": "critical", "version": "${QDB_VERSION}", "cluster": "${CLUSTER_NAME}", "orgid": "${ORGID}", "namespace": "${NAMESPACE}", "instance": "${INSTANCE_NAME}", "alertTimestamp": "${date: yyyy/MM/ddTHH:mm:ss.SSS}" }, "Annotations": { "description": "ERROR/cl:${CLUSTER_NAME}/org:${ORGID}/ns:${NAMESPACE}/db:${INSTANCE_NAME}", "message": "${ALERT_MESSAGE}" } }]
Four environment variables can be defined, and referred to with the `${VAR_NAME}` syntax:
* _ORGID_
* _NAMESPACE_
* _CLUSTER\_NAME_
* _INSTANCE\_NAME_
Their default value is `GLOBAL`, they mean nothing outside a cloud environment.
In addition, `ALERT_MESSAGE` is a placeholder for the actual `critical` message being sent, and `QDB_VERSION` is the runtime version of the QuestDB instance sending the alert. The `${date: }` syntax can be used to produce a timestamp at the time of sending the alert.
### Unhandled error detection[](https://questdb.com/docs/operations/logging-metrics/#unhandled-error-detection "Direct link to Unhandled error detection")
When the metrics subsystem is enabled, the health endpoint may be configured to check the occurrences of any unhandled errors since the database started. For any errors detected, it returns the HTTP 500 status code. The check is based on the `questdb_unhandled_errors_total` metric.
To enable this setting, set the following in `server.conf`:
server.conf to enable critical error checks in the health check endpoint
metrics.enabled=truehttp.pessimistic.health.check.enabled=true
When the metrics subsystem is disabled, the health check endpoint always returns the HTTP 200 status code.
* [Log location](https://questdb.com/docs/operations/logging-metrics/#log-location)
* [Understanding log levels](https://questdb.com/docs/operations/logging-metrics/#understanding-log-levels)
* [Example log messages](https://questdb.com/docs/operations/logging-metrics/#example-log-messages)
* [Logging](https://questdb.com/docs/operations/logging-metrics/#logging)
* [Enable debug log](https://questdb.com/docs/operations/logging-metrics/#enable-debug-log)
* [Configure log.conf](https://questdb.com/docs/operations/logging-metrics/#configure-logconf)
* [Minimal HTTP server](https://questdb.com/docs/operations/logging-metrics/#minimal-http-server)
* [Environment variables](https://questdb.com/docs/operations/logging-metrics/#environment-variables)
* [Docker logging](https://questdb.com/docs/operations/logging-metrics/#docker-logging)
* [Windows log locations](https://questdb.com/docs/operations/logging-metrics/#windows-log-locations)
* [Metrics](https://questdb.com/docs/operations/logging-metrics/#metrics)
* [Prometheus Alertmanager](https://questdb.com/docs/operations/logging-metrics/#prometheus-alertmanager)
* [Unhandled error detection](https://questdb.com/docs/operations/logging-metrics/#unhandled-error-detection)
---
# Post-trade markout analysis | QuestDB
On this page
Markout analysis measures how the market mid-price moves **after** a trade executes. It is the natural complement to [slippage](https://questdb.com/docs/cookbook/sql/finance/slippage/)
:
* **Slippage** tells you how much you paid at the moment of execution.
* **Markout** tells you what happened next — did the market move in your favor (reversion) or against you (adverse selection)?
A positive markout means the trade was profitable in hindsight: for buys, the mid-price rose; for sells, it fell. A negative markout means the market moved against you, which may indicate you were trading against informed flow.
By computing markouts at multiple time horizons (e.g., every second for 5 minutes), you build a **markout curve** — the standard tool for evaluating execution quality over time.
Problem[](https://questdb.com/docs/cookbook/sql/finance/markout/#problem "Direct link to Problem")
----------------------------------------------------------------------------------------------------
You want to evaluate whether your fills are subject to adverse selection. For each trade, you need to know how the mid-price evolved over the seconds and minutes following execution, broken down by venue, counterparty, and passive/aggressive.
Solution[](https://questdb.com/docs/cookbook/sql/finance/markout/#solution "Direct link to Solution")
-------------------------------------------------------------------------------------------------------
Use `HORIZON JOIN` to compute the mid-price at multiple time offsets after each trade, then aggregate into a markout curve:
Post-trade markout curve by venue and counterparty[Demo this query](https://demo.questdb.io/?query=SELECT%0A%20%20%20%20t.symbol%2C%0A%20%20%20%20t.ecn%2C%0A%20%20%20%20t.counterparty%2C%0A%20%20%20%20t.passive%2C%0A%20%20%20%20h.offset%20%2F%201000000000%20AS%20horizon_sec%2C%0A%20%20%20%20count()%20AS%20n%2C%0A%20%20%20%20avg(%0A%20%20%20%20%20%20%20%20CASE%20t.side%0A%20%20%20%20%20%20%20%20%20%20%20%20WHEN%20%27buy%27%20%20THEN%20((m.best_bid%20%2B%20m.best_ask)%20%2F%202%20-%20t.price)%0A%20%20%20%20%20%20%20%20%20%20%20%20%20%20%20%20%20%20%20%20%20%20%20%20%20%20%20%20%20%2F%20t.price%20*%2010000%0A%20%20%20%20%20%20%20%20%20%20%20%20WHEN%20%27sell%27%20THEN%20(t.price%20-%20(m.best_bid%20%2B%20m.best_ask)%20%2F%202)%0A%20%20%20%20%20%20%20%20%20%20%20%20%20%20%20%20%20%20%20%20%20%20%20%20%20%20%20%20%20%2F%20t.price%20*%2010000%0A%20%20%20%20%20%20%20%20END%0A%20%20%20%20)%20AS%20avg_markout_bps%2C%0A%20%20%20%20sum(%0A%20%20%20%20%20%20%20%20CASE%20t.side%0A%20%20%20%20%20%20%20%20%20%20%20%20WHEN%20%27buy%27%20%20THEN%20((m.best_bid%20%2B%20m.best_ask)%20%2F%202%20-%20t.price)%0A%20%20%20%20%20%20%20%20%20%20%20%20%20%20%20%20%20%20%20%20%20%20%20%20%20%20%20%20%20*%20t.quantity%0A%20%20%20%20%20%20%20%20%20%20%20%20WHEN%20%27sell%27%20THEN%20(t.price%20-%20(m.best_bid%20%2B%20m.best_ask)%20%2F%202)%0A%20%20%20%20%20%20%20%20%20%20%20%20%20%20%20%20%20%20%20%20%20%20%20%20%20%20%20%20%20*%20t.quantity%0A%20%20%20%20%20%20%20%20END%0A%20%20%20%20)%20AS%20total_pnl%0AFROM%20fx_trades%20t%0AHORIZON%20JOIN%20market_data%20m%20ON%20(symbol)%0A%20%20%20%20RANGE%20FROM%200s%20TO%2030s%20STEP%205s%20AS%20h%0AWHERE%20t.timestamp%20IN%20%27%24now-1h..%24now%27%0AGROUP%20BY%20t.symbol%2C%20t.ecn%2C%20t.counterparty%2C%20t.passive%2C%20horizon_sec%0AORDER%20BY%20t.symbol%2C%20t.ecn%2C%20t.counterparty%2C%20t.passive%2C%20horizon_sec%3B&executeQuery=true)
SELECT t.symbol, t.ecn, t.counterparty, t.passive, h.offset / 1000000000 AS horizon_sec, count() AS n, avg( CASE t.side WHEN 'buy' THEN ((m.best_bid + m.best_ask) / 2 - t.price) / t.price * 10000 WHEN 'sell' THEN (t.price - (m.best_bid + m.best_ask) / 2) / t.price * 10000 END ) AS avg_markout_bps, sum( CASE t.side WHEN 'buy' THEN ((m.best_bid + m.best_ask) / 2 - t.price) * t.quantity WHEN 'sell' THEN (t.price - (m.best_bid + m.best_ask) / 2) * t.quantity END ) AS total_pnlFROM fx_trades tHORIZON JOIN market_data m ON (symbol) RANGE FROM 0s TO 30s STEP 5s AS hWHERE t.timestamp IN '$now-1h..$now'GROUP BY t.symbol, t.ecn, t.counterparty, t.passive, horizon_secORDER BY t.symbol, t.ecn, t.counterparty, t.passive, horizon_sec;
How it works[](https://questdb.com/docs/cookbook/sql/finance/markout/#how-it-works "Direct link to How it works")
-------------------------------------------------------------------------------------------------------------------
[`HORIZON JOIN`](https://questdb.com/docs/query/sql/horizon-join/)
is the key construct. For each trade and each time offset in the range, it performs an ASOF match against `market_data` at `trade_timestamp + offset`. The `RANGE FROM 0s TO 30s STEP 5s` generates 7 offsets (0s, 5s, 10s, ... 30s), giving you a markout reading every 5 seconds for 30 seconds after each trade.
The two metrics:
* **`avg_markout_bps`** — average price movement in basis points, normalized by fill price. Positive means the market moved in your favor. At offset 0, this is simply the negative of slippage-vs-mid.
* **`total_pnl`** — actual P&L in currency terms (price difference × quantity). This captures the dollar impact, not just the rate — 0.1 bps on 100Mofvolumeisverydifferentfrom0.1bpson100M of volume is very different from 0.1 bps on 100Mofvolumeisverydifferentfrom0.1bpson1M.
The markout formula flips the sign convention compared to slippage:
* **For buys**: positive if mid rose after the fill (profit)
* **For sells**: positive if mid fell after the fill (profit)
As the offset increases, you see how the market evolved after each trade.
Variations[](https://questdb.com/docs/cookbook/sql/finance/markout/#variations "Direct link to Variations")
-------------------------------------------------------------------------------------------------------------
### Markout at specific horizons[](https://questdb.com/docs/cookbook/sql/finance/markout/#markout-at-specific-horizons "Direct link to Markout at specific horizons")
Use `LIST` instead of `RANGE` for non-uniform time points — useful when you care about specific benchmarks (e.g., -30s, -5s, 0, 5s, 30s):
Markout at key horizons[Demo this query](https://demo.questdb.io/?query=SELECT%0A%20%20%20%20t.ecn%2C%0A%20%20%20%20t.passive%2C%0A%20%20%20%20h.offset%20%2F%201000000000%20AS%20horizon_sec%2C%0A%20%20%20%20count()%20AS%20n%2C%0A%20%20%20%20round(avg(%0A%20%20%20%20%20%20%20%20CASE%20t.side%0A%20%20%20%20%20%20%20%20%20%20%20%20WHEN%20%27buy%27%20%20THEN%20((m.best_bid%20%2B%20m.best_ask)%20%2F%202%20-%20t.price)%0A%20%20%20%20%20%20%20%20%20%20%20%20%20%20%20%20%20%20%20%20%20%20%20%20%20%20%20%20%20%2F%20t.price%20*%2010000%0A%20%20%20%20%20%20%20%20%20%20%20%20WHEN%20%27sell%27%20THEN%20(t.price%20-%20(m.best_bid%20%2B%20m.best_ask)%20%2F%202)%0A%20%20%20%20%20%20%20%20%20%20%20%20%20%20%20%20%20%20%20%20%20%20%20%20%20%20%20%20%20%2F%20t.price%20*%2010000%0A%20%20%20%20%20%20%20%20END%0A%20%20%20%20)%2C%203)%20AS%20avg_markout_bps%0AFROM%20fx_trades%20t%0AHORIZON%20JOIN%20market_data%20m%20ON%20(symbol)%0A%20%20%20%20LIST%20(-30s%2C%20-5s%2C%200%2C%205s%2C%2030s)%20AS%20h%0AWHERE%20t.timestamp%20IN%20%27%24now-1h..%24now%27%0AGROUP%20BY%20t.ecn%2C%20t.passive%2C%20horizon_sec%0AORDER%20BY%20t.ecn%2C%20t.passive%2C%20horizon_sec%3B&executeQuery=true)
SELECT t.ecn, t.passive, h.offset / 1000000000 AS horizon_sec, count() AS n, round(avg( CASE t.side WHEN 'buy' THEN ((m.best_bid + m.best_ask) / 2 - t.price) / t.price * 10000 WHEN 'sell' THEN (t.price - (m.best_bid + m.best_ask) / 2) / t.price * 10000 END ), 3) AS avg_markout_bpsFROM fx_trades tHORIZON JOIN market_data m ON (symbol) LIST (-30s, -5s, 0, 5s, 30s) AS hWHERE t.timestamp IN '$now-1h..$now'GROUP BY t.ecn, t.passive, horizon_secORDER BY t.ecn, t.passive, horizon_sec;
### Pre- and post-trade analysis[](https://questdb.com/docs/cookbook/sql/finance/markout/#pre--and-post-trade-analysis "Direct link to Pre- and post-trade analysis")
Use negative offsets to detect information leakage — whether the market was already moving before your trade:
Price movement around trade events[Demo this query](https://demo.questdb.io/?query=SELECT%0A%20%20%20%20h.offset%20%2F%201000000000%20AS%20horizon_sec%2C%0A%20%20%20%20count()%20AS%20n%2C%0A%20%20%20%20round(avg(%0A%20%20%20%20%20%20%20%20CASE%20t.side%0A%20%20%20%20%20%20%20%20%20%20%20%20WHEN%20%27buy%27%20%20THEN%20((m.best_bid%20%2B%20m.best_ask)%20%2F%202%20-%20t.price)%0A%20%20%20%20%20%20%20%20%20%20%20%20%20%20%20%20%20%20%20%20%20%20%20%20%20%20%20%20%20%2F%20t.price%20*%2010000%0A%20%20%20%20%20%20%20%20%20%20%20%20WHEN%20%27sell%27%20THEN%20(t.price%20-%20(m.best_bid%20%2B%20m.best_ask)%20%2F%202)%0A%20%20%20%20%20%20%20%20%20%20%20%20%20%20%20%20%20%20%20%20%20%20%20%20%20%20%20%20%20%2F%20t.price%20*%2010000%0A%20%20%20%20%20%20%20%20END%0A%20%20%20%20)%2C%203)%20AS%20avg_markout_bps%0AFROM%20fx_trades%20t%0AHORIZON%20JOIN%20market_data%20m%20ON%20(symbol)%0A%20%20%20%20RANGE%20FROM%20-30s%20TO%2030s%20STEP%201s%20AS%20h%0AWHERE%20t.timestamp%20IN%20%27%24now-1h..%24now%27%0AGROUP%20BY%20horizon_sec%0AORDER%20BY%20horizon_sec%3B&executeQuery=true)
SELECT h.offset / 1000000000 AS horizon_sec, count() AS n, round(avg( CASE t.side WHEN 'buy' THEN ((m.best_bid + m.best_ask) / 2 - t.price) / t.price * 10000 WHEN 'sell' THEN (t.price - (m.best_bid + m.best_ask) / 2) / t.price * 10000 END ), 3) AS avg_markout_bpsFROM fx_trades tHORIZON JOIN market_data m ON (symbol) RANGE FROM -30s TO 30s STEP 1s AS hWHERE t.timestamp IN '$now-1h..$now'GROUP BY horizon_secORDER BY horizon_sec;
If the markout is already trending before offset 0, it suggests the market was moving before your order — a sign of information leakage or that you are reacting to stale signals.
### Markout by side[](https://questdb.com/docs/cookbook/sql/finance/markout/#markout-by-side "Direct link to Markout by side")
Add `t.side` to the grouping to detect asymmetry between buy and sell execution. A counterparty might look fine on average but show adverse selection on one side only:
Markout curve by side[Demo this query](https://demo.questdb.io/?query=SELECT%0A%20%20%20%20t.ecn%2C%0A%20%20%20%20t.side%2C%0A%20%20%20%20h.offset%20%2F%201000000000%20AS%20horizon_sec%2C%0A%20%20%20%20count()%20AS%20n%2C%0A%20%20%20%20round(avg(%0A%20%20%20%20%20%20%20%20CASE%20t.side%0A%20%20%20%20%20%20%20%20%20%20%20%20WHEN%20%27buy%27%20%20THEN%20((m.best_bid%20%2B%20m.best_ask)%20%2F%202%20-%20t.price)%0A%20%20%20%20%20%20%20%20%20%20%20%20%20%20%20%20%20%20%20%20%20%20%20%20%20%20%20%20%20%2F%20t.price%20*%2010000%0A%20%20%20%20%20%20%20%20%20%20%20%20WHEN%20%27sell%27%20THEN%20(t.price%20-%20(m.best_bid%20%2B%20m.best_ask)%20%2F%202)%0A%20%20%20%20%20%20%20%20%20%20%20%20%20%20%20%20%20%20%20%20%20%20%20%20%20%20%20%20%20%2F%20t.price%20*%2010000%0A%20%20%20%20%20%20%20%20END%0A%20%20%20%20)%2C%203)%20AS%20avg_markout_bps%0AFROM%20fx_trades%20t%0AHORIZON%20JOIN%20market_data%20m%20ON%20(symbol)%0A%20%20%20%20LIST%20(-30s%2C%20-5s%2C%200%2C%205s%2C%2030s)%20AS%20h%0AWHERE%20t.timestamp%20IN%20%27%24now-1h..%24now%27%0AGROUP%20BY%20t.ecn%2C%20t.side%2C%20horizon_sec%0AORDER%20BY%20t.ecn%2C%20t.side%2C%20horizon_sec%3B&executeQuery=true)
SELECT t.ecn, t.side, h.offset / 1000000000 AS horizon_sec, count() AS n, round(avg( CASE t.side WHEN 'buy' THEN ((m.best_bid + m.best_ask) / 2 - t.price) / t.price * 10000 WHEN 'sell' THEN (t.price - (m.best_bid + m.best_ask) / 2) / t.price * 10000 END ), 3) AS avg_markout_bpsFROM fx_trades tHORIZON JOIN market_data m ON (symbol) LIST (-30s, -5s, 0, 5s, 30s) AS hWHERE t.timestamp IN '$now-1h..$now'GROUP BY t.ecn, t.side, horizon_secORDER BY t.ecn, t.side, horizon_sec;
If buy markouts diverge significantly from sell markouts at the same venue, it may indicate directional information leakage or asymmetric adverse selection.
### Single-side markout[](https://questdb.com/docs/cookbook/sql/finance/markout/#single-side-markout "Direct link to Single-side markout")
When analyzing one side at a time, you can drop the `CASE` entirely for a simpler formula:
Buy-side markout — positive means price moved up after you bought[Demo this query](https://demo.questdb.io/?query=SELECT%0A%20%20%20%20t.symbol%2C%0A%20%20%20%20h.offset%20%2F%201000000000%20AS%20horizon_sec%2C%0A%20%20%20%20count()%20AS%20n%2C%0A%20%20%20%20avg(((m.best_bid%20%2B%20m.best_ask)%20%2F%202%20-%20t.price)%20%2F%20t.price%20*%2010000)%20AS%20avg_markout_bps%2C%0A%20%20%20%20sum(((m.best_bid%20%2B%20m.best_ask)%20%2F%202%20-%20t.price)%20*%20t.quantity)%20AS%20total_pnl%0AFROM%20fx_trades%20t%0AHORIZON%20JOIN%20market_data%20m%20ON%20(symbol)%0A%20%20%20%20RANGE%20FROM%200s%20TO%2010m%20STEP%2010s%20AS%20h%0AWHERE%20t.side%20%3D%20%27buy%27%0A%20%20%20%20AND%20t.timestamp%20IN%20%27%24now-1h..%24now%27%0AGROUP%20BY%20t.symbol%2C%20horizon_sec%0AORDER%20BY%20t.symbol%2C%20horizon_sec%3B&executeQuery=true)
SELECT t.symbol, h.offset / 1000000000 AS horizon_sec, count() AS n, avg(((m.best_bid + m.best_ask) / 2 - t.price) / t.price * 10000) AS avg_markout_bps, sum(((m.best_bid + m.best_ask) / 2 - t.price) * t.quantity) AS total_pnlFROM fx_trades tHORIZON JOIN market_data m ON (symbol) RANGE FROM 0s TO 10m STEP 10s AS hWHERE t.side = 'buy' AND t.timestamp IN '$now-1h..$now'GROUP BY t.symbol, horizon_secORDER BY t.symbol, horizon_sec;
Sell-side markout — positive means price moved down after you sold[Demo this query](https://demo.questdb.io/?query=SELECT%0A%20%20%20%20t.symbol%2C%0A%20%20%20%20h.offset%20%2F%201000000000%20AS%20horizon_sec%2C%0A%20%20%20%20count()%20AS%20n%2C%0A%20%20%20%20avg((t.price%20-%20(m.best_bid%20%2B%20m.best_ask)%20%2F%202)%20%2F%20t.price%20*%2010000)%20AS%20avg_markout_bps%2C%0A%20%20%20%20sum((t.price%20-%20(m.best_bid%20%2B%20m.best_ask)%20%2F%202)%20*%20t.quantity)%20AS%20total_pnl%0AFROM%20fx_trades%20t%0AHORIZON%20JOIN%20market_data%20m%20ON%20(symbol)%0A%20%20%20%20RANGE%20FROM%200s%20TO%2010m%20STEP%2010s%20AS%20h%0AWHERE%20t.side%20%3D%20%27sell%27%0A%20%20%20%20AND%20t.timestamp%20IN%20%27%24now-1h..%24now%27%0AGROUP%20BY%20t.symbol%2C%20horizon_sec%0AORDER%20BY%20t.symbol%2C%20horizon_sec%3B&executeQuery=true)
SELECT t.symbol, h.offset / 1000000000 AS horizon_sec, count() AS n, avg((t.price - (m.best_bid + m.best_ask) / 2) / t.price * 10000) AS avg_markout_bps, sum((t.price - (m.best_bid + m.best_ask) / 2) * t.quantity) AS total_pnlFROM fx_trades tHORIZON JOIN market_data m ON (symbol) RANGE FROM 0s TO 10m STEP 10s AS hWHERE t.side = 'sell' AND t.timestamp IN '$now-1h..$now'GROUP BY t.symbol, horizon_secORDER BY t.symbol, horizon_sec;
This approach is useful when you want to run separate analyses per side, or when feeding results into dashboards that track buy and sell P&L independently.
### Counterparty toxicity[](https://questdb.com/docs/cookbook/sql/finance/markout/#counterparty-toxicity "Direct link to Counterparty toxicity")
Group by counterparty to identify which LPs are sending you toxic flow — trades that consistently move against you shortly after execution:
Counterparty toxicity markout (buy side)[Demo this query](https://demo.questdb.io/?query=SELECT%0A%20%20%20%20t.symbol%2C%0A%20%20%20%20t.counterparty%2C%0A%20%20%20%20h.offset%20%2F%201000000000%20AS%20horizon_sec%2C%0A%20%20%20%20count()%20AS%20n%2C%0A%20%20%20%20avg(((m.best_bid%20%2B%20m.best_ask)%20%2F%202%20-%20t.price)%20%2F%20t.price%20*%2010000)%20AS%20avg_markout_bps%2C%0A%20%20%20%20sum(t.quantity)%20AS%20total_volume%0AFROM%20fx_trades%20t%0AHORIZON%20JOIN%20market_data%20m%20ON%20(symbol)%0A%20%20%20%20LIST%20(0%2C%201s%2C%205s%2C%2010s%2C%2030s%2C%201m%2C%205m)%20AS%20h%0AWHERE%20t.side%20%3D%20%27buy%27%0A%20%20%20%20AND%20t.timestamp%20IN%20%27%24now-1h..%24now%27%0AGROUP%20BY%20t.symbol%2C%20t.counterparty%2C%20horizon_sec%0AORDER%20BY%20t.symbol%2C%20t.counterparty%2C%20horizon_sec%3B&executeQuery=true)
SELECT t.symbol, t.counterparty, h.offset / 1000000000 AS horizon_sec, count() AS n, avg(((m.best_bid + m.best_ask) / 2 - t.price) / t.price * 10000) AS avg_markout_bps, sum(t.quantity) AS total_volumeFROM fx_trades tHORIZON JOIN market_data m ON (symbol) LIST (0, 1s, 5s, 10s, 30s, 1m, 5m) AS hWHERE t.side = 'buy' AND t.timestamp IN '$now-1h..$now'GROUP BY t.symbol, t.counterparty, horizon_secORDER BY t.symbol, t.counterparty, horizon_sec;
A counterparty whose markout is persistently negative across horizons is likely trading on information you don't have. Compare `total_volume` alongside markout — a small counterparty with terrible markout may not matter, but a large one warrants flow management.
### Passive vs aggressive with spread context[](https://questdb.com/docs/cookbook/sql/finance/markout/#passive-vs-aggressive-with-spread-context "Direct link to Passive vs aggressive with spread context")
Compare markout between passive (limit) and aggressive (market) orders, with the half-spread as a baseline. Aggressive fills should cost roughly half the spread; if the markout is worse than that, execution quality needs attention:
Passive vs aggressive markout with half-spread baseline (buy side)[Demo this query](https://demo.questdb.io/?query=SELECT%0A%20%20%20%20t.symbol%2C%0A%20%20%20%20t.ecn%2C%0A%20%20%20%20t.passive%2C%0A%20%20%20%20h.offset%20%2F%201000000000%20AS%20horizon_sec%2C%0A%20%20%20%20count()%20AS%20n%2C%0A%20%20%20%20avg(((m.best_bid%20%2B%20m.best_ask)%20%2F%202%20-%20t.price)%0A%20%20%20%20%20%20%20%20%2F%20t.price%20*%2010000)%20AS%20avg_markout_bps%2C%0A%20%20%20%20avg((m.best_ask%20-%20m.best_bid)%0A%20%20%20%20%20%20%20%20%2F%20((m.best_bid%20%2B%20m.best_ask)%20%2F%202)%20*%2010000)%20%2F%202%20AS%20avg_half_spread_bps%0AFROM%20fx_trades%20t%0AHORIZON%20JOIN%20market_data%20m%20ON%20(symbol)%0A%20%20%20%20RANGE%20FROM%200s%20TO%205m%20STEP%205s%20AS%20h%0AWHERE%20t.side%20%3D%20%27buy%27%0A%20%20%20%20AND%20t.timestamp%20IN%20%27%24now-1h..%24now%27%0AGROUP%20BY%20t.symbol%2C%20t.ecn%2C%20t.passive%2C%20horizon_sec%0AORDER%20BY%20t.symbol%2C%20t.ecn%2C%20t.passive%2C%20horizon_sec%3B&executeQuery=true)
SELECT t.symbol, t.ecn, t.passive, h.offset / 1000000000 AS horizon_sec, count() AS n, avg(((m.best_bid + m.best_ask) / 2 - t.price) / t.price * 10000) AS avg_markout_bps, avg((m.best_ask - m.best_bid) / ((m.best_bid + m.best_ask) / 2) * 10000) / 2 AS avg_half_spread_bpsFROM fx_trades tHORIZON JOIN market_data m ON (symbol) RANGE FROM 0s TO 5m STEP 5s AS hWHERE t.side = 'buy' AND t.timestamp IN '$now-1h..$now'GROUP BY t.symbol, t.ecn, t.passive, horizon_secORDER BY t.symbol, t.ecn, t.passive, horizon_sec;
At offset 0, aggressive fills typically show `avg_markout_bps` close to negative `avg_half_spread_bps` (you crossed the spread). If markout recovers toward zero over subsequent offsets, execution is healthy — you paid the spread but the market didn't move further against you. If markout stays flat or worsens, it signals adverse selection beyond the spread cost.
Interpreting the markout curve[](https://questdb.com/docs/cookbook/sql/finance/markout/#interpreting-the-markout-curve "Direct link to Interpreting the markout curve")
-------------------------------------------------------------------------------------------------------------------------------------------------------------------------
* **Flat near zero**: No significant post-trade price impact. Fills are neutral.
* **Rising markout (positive trend)**: Price reverts in your favor after the fill. This is the ideal scenario — it suggests you are capturing spread or providing liquidity at good levels.
* **Falling markout (negative trend)**: Adverse selection — the market moves against you after the fill. This may indicate you are being picked off by informed counterparties or reacting too slowly.
* **Passive vs aggressive**: Passive fills typically show better markouts because they provide liquidity. Aggressive fills often show initial negative markout equal to the spread cost, which may or may not revert.
* **Counterparty differences**: Persistent negative markout against specific counterparties is a strong signal of adverse selection and may warrant flow management.
Related documentation
* [HORIZON JOIN](https://questdb.com/docs/query/sql/horizon-join/)
* [ASOF JOIN](https://questdb.com/docs/query/sql/asof-join/)
* [Slippage per fill recipe](https://questdb.com/docs/cookbook/sql/finance/slippage/)
* [Slippage (aggregated) recipe](https://questdb.com/docs/cookbook/sql/finance/slippage-aggregated/)
* [Problem](https://questdb.com/docs/cookbook/sql/finance/markout/#problem)
* [Solution](https://questdb.com/docs/cookbook/sql/finance/markout/#solution)
* [How it works](https://questdb.com/docs/cookbook/sql/finance/markout/#how-it-works)
* [Variations](https://questdb.com/docs/cookbook/sql/finance/markout/#variations)
* [Markout at specific horizons](https://questdb.com/docs/cookbook/sql/finance/markout/#markout-at-specific-horizons)
* [Pre- and post-trade analysis](https://questdb.com/docs/cookbook/sql/finance/markout/#pre--and-post-trade-analysis)
* [Markout by side](https://questdb.com/docs/cookbook/sql/finance/markout/#markout-by-side)
* [Single-side markout](https://questdb.com/docs/cookbook/sql/finance/markout/#single-side-markout)
* [Counterparty toxicity](https://questdb.com/docs/cookbook/sql/finance/markout/#counterparty-toxicity)
* [Passive vs aggressive with spread context](https://questdb.com/docs/cookbook/sql/finance/markout/#passive-vs-aggressive-with-spread-context)
* [Interpreting the markout curve](https://questdb.com/docs/cookbook/sql/finance/markout/#interpreting-the-markout-curve)
---
# SQLAlchemy | QuestDB
On this page
[SQLAlchemy](https://www.sqlalchemy.org/)
is an open-source SQL toolkit and ORM library for Python. It provides a high-level API for communicating with [relational databases](https://questdb.com/glossary/relational-database/)
, including schema creation and modification, an SQL expression language, and database connection management. The ORM layer abstracts away the complexities of the database, allowing developers to work with Python objects instead of raw SQL statements.
QuestDB implements a dialect for SQLAlchemy using the [QuestDB Connect](https://github.com/questdb/questdb-connect)
Python package.
Please note that the SQLAlchemy ORM and metadata operations are only partially supported.
Prerequisites[](https://questdb.com/docs/integrations/other/sqlalchemy/#prerequisites "Direct link to Prerequisites")
-----------------------------------------------------------------------------------------------------------------------
* Python from 3.9 to 3.11
* Psycopg2
* SQLAlchemy `<=` 1.4.47
* A QuestDB instance
Installation[](https://questdb.com/docs/integrations/other/sqlalchemy/#installation "Direct link to Installation")
--------------------------------------------------------------------------------------------------------------------
You can install this package using `pip`:
pip install questdb-connect
Example usage[](https://questdb.com/docs/integrations/other/sqlalchemy/#example-usage "Direct link to Example usage")
-----------------------------------------------------------------------------------------------------------------------
import sqlalchemyfrom sqlalchemy import create_enginefrom sqlalchemy import textfrom sqlalchemy import MetaDatafrom sqlalchemy import Tablefrom pprint import pprintengine = create_engine("questdb://admin:quest@localhost:8812/qdb")with engine.connect() as conn: # SQL statements with no parameters conn.execute(text("CREATE TABLE IF NOT EXISTS some_table (x int, y int)")) result=conn.execute(text("SHOW TABLES")) print(result.all()) # results can be iterated in many ways. Check SQLAlchemy docs for details # passing parameters to your statements conn.execute( text("INSERT INTO some_table (x, y) VALUES (:x, :y)"), [{"x": 11, "y": 12}, {"x": 13, "y": 14}], ) # basic select, no parameters result = conn.execute(text("select * from some_table")) print(result.all()) # select with parameters result = conn.execute(text("SELECT x, y FROM some_table WHERE y > :y"), {"y": 2}) print(result.all()) # partial support for metadata metadata_obj = MetaData() some_table = Table("some_table", metadata_obj, autoload_with=engine) pprint(some_table) # cleaning up conn.execute(text("DROP TABLE some_table"))
See also[](https://questdb.com/docs/integrations/other/sqlalchemy/#see-also "Direct link to See also")
--------------------------------------------------------------------------------------------------------
* The [SQLAlchemy tutorial](https://docs.sqlalchemy.org/en/14/tutorial/index.html)
* The [QuestDB Connect](https://pypi.org/project/questdb-connect/)
GitHub
* [Prerequisites](https://questdb.com/docs/integrations/other/sqlalchemy/#prerequisites)
* [Installation](https://questdb.com/docs/integrations/other/sqlalchemy/#installation)
* [Example usage](https://questdb.com/docs/integrations/other/sqlalchemy/#example-usage)
* [See also](https://questdb.com/docs/integrations/other/sqlalchemy/#see-also)
---
# CSV Import | QuestDB
On this page
tip
CSV import is for bulk/batch loading. For streaming data, use [InfluxDB Line Protocol (ILP)](https://questdb.com/docs/ingestion/overview/)
instead.
There are three methods for CSV import:
1. [COPY SQL](https://questdb.com/docs/ingestion/import-csv/#import-csv-via-copy-sql)
- Best for large files and migrations
2. [REST API](https://questdb.com/docs/ingestion/import-csv/#import-csv-via-rest)
- For programmatic uploads of smaller files
3. [Web Console](https://questdb.com/docs/getting-started/web-console/import-csv/)
- Interactive uploads via browser
Import CSV via COPY SQL[](https://questdb.com/docs/ingestion/import-csv/#import-csv-via-copy-sql "Direct link to Import CSV via COPY SQL")
--------------------------------------------------------------------------------------------------------------------------------------------
The [COPY](https://questdb.com/docs/query/sql/copy/)
SQL command is the preferred way to import large CSV files into partitioned tables. Use it for bulk data migrations from other databases.
For partitioned tables, the best `COPY` performance can be achieved only on a machine with a local, physically attached SSD. It is possible to use a network block storage, such as an AWS EBS volume to perform the operation, with the following impact:
* Users need to configure the maximum IOPS and throughput setting values for the volume.
* The required import time is likely to be 5-10x longer.
### Prepare the import[](https://questdb.com/docs/ingestion/import-csv/#prepare-the-import "Direct link to Prepare the import")
Preparation is key. Import is a multi-step process, which consists of:
* Export the existing database as CSV files
* Enable and configure `COPY` command to be optimal for the system
* Prepare target schema in QuestDB
#### Export the existing database[](https://questdb.com/docs/ingestion/import-csv/#export-the-existing-database "Direct link to Export the existing database")
Export data using one CSV file per table. Include a column that can be used as the designated timestamp. Data in CSV is not expected to be in any particular order. If it is not possible to export the table as one CSV, export multiple files and concatenate these files before importing into QuestDB.
##### Concatenate multiple CSV files[](https://questdb.com/docs/ingestion/import-csv/#concatenate-multiple-csv-files "Direct link to Concatenate multiple CSV files")
The way to concatenate files depends on whether the CSV files have headers.
For CSV files without headers, concatenation is straightforward:
* Linux
* macOS
* Windows PowerShell
ls *.csv | xargs cat > singleFile.csv
ls *.csv | xargs cat > singleFile.csv
$TextFiles = Get-Item C:\Users\path\to\csv\*.csv# The files are moved to the same folder.$TextFiles foreach { Add-Content -Value $(Get-Content $_) -Path C:\Users\path\to\csv\singleFile.csv}
For CSV files with headers, concatenation can be tricky. You could manually remove the first line of the files before concatenating, or use some smart command line to concatenate and remove the headers. A good alternative is using the open source tool [csvstack](https://csvkit.readthedocs.io/en/latest/scripts/csvstack.html)
.
This is how you can concatenate multiple CSV files using _csvstack_:
csvstack *.csv > singleFile.csv
#### Things to know about `COPY`[](https://questdb.com/docs/ingestion/import-csv/#things-to-know-about-copy "Direct link to things-to-know-about-copy")
* `COPY` is disabled by default, as a security precaution. Configuration is required.
* `COPY` is more efficient when source and target disks are different.
* `COPY` is parallel when target table is partitioned.
* `COPY` is _serial_ when target table is non-partitioned. Out-of-order timestamps are rejected.
* `COPY` cannot import data into non-empty table.
* `COPY` indexes CSV file; reading indexed CSV file benefits hugely from disk IOPS. We recommend using NVME.
* `COPY` imports one file at a time; there is no internal queuing system yet.
* [COPY reference](https://questdb.com/docs/query/sql/copy/)
#### Configure `COPY`[](https://questdb.com/docs/ingestion/import-csv/#configure-copy "Direct link to configure-copy")
* Enable `COPY` and [configure](https://questdb.com/docs/configuration/overview/#copy-settings)
the `COPY` directories to suit your server.
* `cairo.sql.copy.root` must be set for `COPY` to work.
### Create the target table schema[](https://questdb.com/docs/ingestion/import-csv/#create-the-target-table-schema "Direct link to Create the target table schema")
If you know the target table schema already, you can [skip this section](https://questdb.com/docs/ingestion/import-csv/#import-csv)
.
QuestDB can analyze the input file and infer the schema. This happens automatically when the target table does not exist.
To have QuestDB help with determining file schema, it is best to work with a sub-set of CSV. A smaller file allows us to iterate faster if iteration is required.
Let's assume we have the following CSV:
"locationId","timestamp","windDir","windSpeed","windGust","cloudCeiling","skyCover","visMiles","tempF","dewpF","rain1H","rain6H","rain24H","snowDepth"1,"2010-07-05T00:23:58.981263Z",3050,442,512,,"OBS",11.774906006761,-5,-31,58.228032196984,70.471606345673,77.938252342637,582,"2017-10-10T10:13:55.246046Z",900,63,428,5487,"BKN",4.958601701089,-19,-7,4.328016420894,36.020659549374,97.821114441800,413,"2010-03-12T11:17:13.727137Z",2880,299,889,371,"BKN",10.342717709226,46,81,9.149518425127,20.229637391479,20.074738007931,804,"2018-08-21T15:42:23.107543Z",930,457,695,4540,"OBS",13.359184086767,90,-47,33.346163208862,37.501996055160,58.316836760009,13...
1. Extract the first 1000 line to `test_file.csv` (assuming both files are in the `cairo.sql.copy.root` directory):
head -1000 weather.csv > test_file.csv
2. Use a simple `COPY` command to import `test_file.csv` and define the table name:
COPY weather from 'test_file.csv' WITH HEADER true;
This creates the `weather` table and returns the ID of the background import process:
| id |
| --- |
| 5179978a6d7a1772 |
3. In the [Web Console](https://questdb.com/docs/getting-started/web-console/overview/)
right click table and select `Copy Schema to Clipboard` - this copies the schema generated by the input file analysis.
4. Paste the table schema to the code editor:
CREATE TABLE 'weather' ( timestamp TIMESTAMP, windDir INT, windSpeed INT, windGust INT, cloudCeiling INT, skyCover VARCHAR, visMiles DOUBLE, tempF INT, dewpF INT, rain1H DOUBLE, rain6H DOUBLE, rain24H DOUBLE, snowDepth INT);
5. Identify the correct schema:
5.1. The generated schema may not be completely correct. Check the log table and log file to resolve common errors using the id (see also [Track import progress](https://questdb.com/docs/ingestion/import-csv/#track-import-progress)
and [FAQ](https://questdb.com/docs/ingestion/import-csv/#faq)
):
SELECT * FROM sys.text_import_log WHERE id = '5179978a6d7a1772' ORDER BY ts DESC;
| ts | id | table | file | phase | status | message | rows\_handled | rows\_imported | errors |
| --- | --- | --- | --- | --- | --- | --- | --- | --- | --- |
| 2022-08-08T16:38:06.262706Z | 5179978a6d7a1772 | weather | test\_file.csvtest\_file.csv | | finished | | 999 | 999 | 0 |
| 2022-08-08T16:38:06.226162Z | 5179978a6d7a1772 | weather | test\_file.csvtest\_file.csv | | started | | | | 0 |
Check `rows_handled`, `rows_imported`, and `message` for any errors and amend the schema as required.
5.2. Drop the table and re-import `test_file.csv` using the updated schema.
6. Repeat the steps to narrow down to a correct schema.
The process may require either truncating:
TRUNCATE TABLE table_name;
or dropping the target table:
DROP TABLE table_name;
7. Clean up: Once all the errors are resolved, copy the final schema, drop the small table.
8. Make sure table is correctly partitioned. The final schema in our example should look like this:
CREATE TABLE 'weather' ( timestamp TIMESTAMP, windDir INT, windSpeed INT, windGust INT, cloudCeiling INT, skyCover VARCHAR, visMiles DOUBLE, tempF INT, dewpF INT, rain1H DOUBLE, rain6H DOUBLE, rain24H DOUBLE, snowDepth INT) TIMESTAMP (timestamp) partition by DAY;
9. Ready for import: Create an empty table using the final schema.
### Import CSV[](https://questdb.com/docs/ingestion/import-csv/#import-csv "Direct link to Import CSV")
Once an empty table is created in QuestDB using the correct schema, import can be initiated with:
COPY weather FROM 'weather.csv' WITH HEADER true TIMESTAMP 'timestamp' FORMAT 'yyyy-MM-ddTHH:mm:ss.SSSUUUZ';
It quickly returns id of asynchronous import process running in the background:
| id |
| --- |
| 55020329020b446a |
### Track import progress[](https://questdb.com/docs/ingestion/import-csv/#track-import-progress "Direct link to Track import progress")
`COPY` returns an id for querying the log table (`sys.text_import_log`), to monitor the progress of ongoing import:
SELECT * FROM sys.text_import_log WHERE id = '55020329020b446a';
| ts | id | table | file | phase | status | message | rows\_handled | rows\_imported | errors |
| --- | --- | --- | --- | --- | --- | --- | --- | --- | --- |
| 2022-08-03T14:00:40.907224Z | 55020329020b446a | weather | weather.csv | null | started | null | null | null | 0 |
| 2022-08-03T14:00:40.910709Z | 55020329020b446a | weather | weather.csv | analyze\_file\_structure | started | null | null | null | 0 |
| 2022-08-03T14:00:42.370563Z | 55020329020b446a | weather | weather.csv | analyze\_file\_structure | finished | null | null | null | 0 |
| 2022-08-03T14:00:42.370793Z | 55020329020b446a | weather | weather.csv | boundary\_check | started | null | null | null | 0 |
Looking at the log from the newest to the oldest might be more convenient:
SELECT * FROM sys.text_import_log WHERE id = '55020329020b446a' ORDER BY ts DESC;
Once import successfully ends the log table should contain a row with a 'null' phase and 'finished' status :
| ts | id | table | file | phase | status | message | rows\_handled | rows\_imported | errors |
| --- | --- | --- | --- | --- | --- | --- | --- | --- | --- |
| 2022-08-03T14:10:59.198672Z | 55020329020b446a | weather | weather.csv | null | finished | | 300000000 | 300000000 | 0 |
Import into non-partitioned tables uses single-threaded implementation (serial import) that reports only start and finish records in the status table. Given an ordered CSV file `weather1mil.csv`, when importing, the log table shows:
| ts | id | table | file | phase | status | message | rows\_handled | rows\_imported | errors |
| --- | --- | --- | --- | --- | --- | --- | --- | --- | --- |
| 2022-08-03T15:00:40.907224Z | 42d31603842f771a | weather | weather1mil.csv | null | started | null | null | null | 0 |
| 2022-08-03T15:01:20.000709Z | 42d31603842f771a | weather | weather1mil.csv | null | finished | null | 999999 | 999999 | 0 |
The log table contains only coarse-grained, top-level data. Import phase run times vary a lot (e.g. `partition_import` often takes 80% of the whole import execution time), and therefore [the server log](https://questdb.com/docs/operations/logging-metrics/#logging)
provides an alternative to follow more details of import:
import log
2022-08-03T14:00:40.907224Z I i.q.c.t.ParallelCsvFileImporter started [importId=5502031634e923b2, phase=analyze_file_structure, file=`C:\dev\tmp\weather.csv`, workerCount=10]2022-08-03T14:00:40.917224Z I i.q.c.p.WriterPool >> [table=`weather`, thread=43]2022-08-03T14:00:41.440049Z I i.q.c.t.ParallelCsvFileImporter finished [importId=5502031634e923b2, phase=analyze_file_structure, file=`C:\dev\tmp\weather.csv`, duration=0s, errors=0]2022-08-03T14:00:41.440196Z I i.q.c.t.ParallelCsvFileImporter started [importId=5502031634e923b2, phase=boundary_check, file=`C:\dev\tmp\weather.csv`, workerCount=10]2022-08-03T14:01:18.853212Z I i.q.c.t.ParallelCsvFileImporter finished [importId=5502031634e923b2, phase=boundary_check, file=`C:\dev\tmp\weather.csv`, duration=6s, errors=0]2022-08-03T14:01:18.853303Z I i.q.c.t.ParallelCsvFileImporter started [importId=5502031634e923b2, phase=indexing, file=`C:\dev\tmp\weather.csv`, workerCount=10]2022-08-03T14:01:18.853516Z I i.q.c.t.ParallelCsvFileImporter temporary import directory [path='E:\dev\tmp\weather\]2022-08-03T14:01:42.612302Z I i.q.c.t.CsvFileIndexer finished chunk [chunkLo=23099021813, chunkHi=26948858785, lines=29999792, errors=0]2022-08-03T14:01:42.791789Z I i.q.c.t.CsvFileIndexer finished chunk [chunkLo=11549510915, chunkHi=15399347885, lines=30000011, errors=0]
If the [`ON ERROR` option](https://questdb.com/docs/query/sql/copy/#options)
is set to `ABORT`, import stops on the first error and the error is logged. Otherwise, all errors are listed in the log.
The reference to the error varies depending on the phase of an import:
* In the indexing phase, if an error occurs, the absolute input file line is referenced:
2022-08-08T11:50:24.319675Z E i.q.c.t.CsvFileIndexer could not parse timestamp [line=999986, column=1]
* In the data import phase, if an error occurs, the log references the offset as related to the start of the file.
2022-08-08T12:19:56.828792Z E i.q.c.t.TextImportTask type syntax [type=INT, offset=5823, column=0, value='CMP2']
The errored rows can then be extracted for further investigation.
### FAQ[](https://questdb.com/docs/ingestion/import-csv/#faq "Direct link to FAQ")
COPY on a table with symbol columns is very slow. How can I speed it up?
QuestDB uses `256` as the default symbol capacity. If the number of distinct symbol values exceeds this default significantly, the `COPY` performance will suffer. Make sure that you specify symbol capacities when creating the table before running the `COPY` command.
Here is an example:
CREATE TABLE table_name ( ts TIMESTAMP, sym SYMBOL CAPACITY 100000) TIMESTAMP(ts) PARTITION BY DAY;
Refer to the [symbol type documentation](https://questdb.com/docs/concepts/symbol/)
for more information on configuring the symbol capacity.
What happens in a database crash or OS reboot?
If reboot/power loss happens while partitions are being attached, the table may be left with incomplete data. Truncate the table before re-importing with:
TRUNCATE TABLE table_name;
If reboot/power loss happens before any partitions being attached, the import should not be affected.
I'm getting "COPY is disabled \['cairo.sql.copy.root' is not set?\]" error message
Please set `cairo.sql.copy.root` setting, restart the instance and try again.
I'm getting "could not create temporary import work directory \[path='somepath', errno=-1\]" error message
Please make sure that the `cairo.sql.copy.root` and `cairo.sql.copy.work.root` are valid paths pointing to existing directories.
I'm getting "\[2\] could not open read-only \[file=somepath\]" error message
Please check that import file path is valid and accessible to QuestDB instance users.
If you are running QuestDB using Docker, please check if the directory mounted for storing source CSV files is identical to the one `cairo.sql.copy.root` property or `QDB_CAIRO_SQL_COPY_ROOT` environment variable points to.
For example, the following command can start a QuestDB instance:
docker run -p 9000:9000 \-v "/tmp/questdb:/var/lib/questdb" \-v "/tmp/questdb/my_input_root:/tmp/questdb_import" \-e QDB_CAIRO_SQL_COPY_ROOT=/tmp/questdb_wrong \questdb/questdb
However, running:
COPY weather from 'weather_example.csv' WITH HEADER true;
Results in the "\[2\] could not open read-only \[file=/tmp/questdb\_wrong/weather\_example.csv\]" error message.
I'm getting "column count mismatch \[textColumnCount=4, tableColumnCount=3, table=someTable\]" error message
There are more columns in input file than in the existing target table. Please remove column(s) from input file or add them to the target table schema.
I'm getting "timestamp column 'ts2' not found in file header" error message
Either input file is missing header or timestamp column name given in `COPY` command is invalid. Please add file header or fix timestamp option.
I'm getting "column is not a timestamp \[no=0, name='ts'\]" error message
Timestamp column given by the user or (if header is missing) assumed based on target table schema is of a different type. Please check timestamp column name in input file header or make sure input file column order matches that of target table.
I'm getting "target table must be empty \[table=t\]" error message
`COPY` doesn't yet support importing into partitioned table with existing data.
Please truncate table before re-importing with:
TRUNCATE TABLE table_name;
or import into another empty table and then use `INSERT INTO SELECT`:
INSERT BATCH 100000 INTO table_nameSELECT * FROM other_table;
to copy data into original target table.
I'm getting "io\_uring error" error message
It's possible that you've hit a IO\_URING-related kernel error. Please set `cairo.iouring.enabled` setting to false, restart QuestDB instance, and try again.
I'm getting "name is reserved" error message
The table you're trying to import into is in a bad state (incomplete metadata).
Please either drop the table with:
DROP TABLE table_name;
and recreate the table or change the table name in the `COPY` command.
I'm getting "Unable to process the import request. Another import request may be in progress." error message
Only one import can be running at a time.
Either cancel running import with:
COPY 'paste_import_id_here' CANCEL;
or wait until the current import is finished.
Import finished but table is (almost) empty
Please check the latest entries in log table:
SELECT * FROM sys.text_import_log LIMIT -10;
If "errors" column is close to number of records in the input file then it may mean:
* `FORMAT` option of `COPY` command or auto-detected format doesn't match timestamp column data in file
* Other column(s) can't be parsed and `ON ERROR SKIP_ROW` option was used
* Input file is unordered and target table has designated timestamp but is not partitioned
If none of the above causes the error, please check the log file for messages like:
2022-08-08T11:50:24.319675Z E i.q.c.t.CsvFileIndexer could not parse timestamp [line=999986, column=1]
or
2022-08-08T12:19:56.828792Z E i.q.c.t.TextImportTask type syntax [type=INT, offset=5823, column=0, value='CMP2']
that should explain why rows were rejected. Note that in these examples, the former log message mentions the absolute input file line while the latter is referencing the offset as related to the start of the file.
Import finished but table column names are `f0`, `f1`, ...
The input file has no header and the target table does not exist, so columns received synthetic names. You can rename them with `ALTER TABLE`:
ALTER TABLE table_name RENAME COLUMN f0 TO ts;
Import CSV via Rest[](https://questdb.com/docs/ingestion/import-csv/#import-csv-via-rest "Direct link to Import CSV via Rest")
--------------------------------------------------------------------------------------------------------------------------------
The REST API provides an `/imp` endpoint exposed on port `9000` by default. This endpoint allows streaming tabular text data directly into a table, supporting CSV, TAB and pipe (`|`) delimited inputs with optional headers. Data types and structures are detected automatically, but additional configurations can be provided to improve automatic detection.
note
The REST API is better suited when the following conditions are true:
* Regular uploads of small batches of data into the same table.
* The file batches do not contain overlapping periods (they contain distinct days/weeks/months). Otherwise, the import performance will be impacted.
For database migrations, or uploading one large CSV file into QuestDB, users may consider using the `COPY` SQL command. See [COPY command documentation](https://questdb.com/docs/query/sql/copy/)
and [Guide on CSV import](https://questdb.com/docs/ingestion/import-csv/#import-csv-via-copy-sql)
for more details.
### Importing compressed files[](https://questdb.com/docs/ingestion/import-csv/#importing-compressed-files "Direct link to Importing compressed files")
It is possible to upload compressed files directly without decompression:
gzip -cd compressed_data.tsv.gz | curl -v -F data=@- 'http://localhost:9000/imp'
The `data=@-` value instructs `curl` to read the file contents from `stdin`.
### Specifying a schema during CSV import[](https://questdb.com/docs/ingestion/import-csv/#specifying-a-schema-during-csv-import "Direct link to Specifying a schema during CSV import")
A `schema` JSON object can be provided with POST requests to `/imp` while creating tables via CSV import. This allows for more control over user-defined patterns for timestamps, or for explicitly setting types during column-creation. The following example demonstrates basic usage, in this case, that the `ticker_name` column should be parsed as `SYMBOL` type instead of `VARCHAR`:
curl \ -F schema='[{"name":"ticker_name", "type": "SYMBOL"}]' \ -F data=@trades.csv 'http://localhost:9000/imp'
If a timestamp column (`ts`) in this CSV file has a custom or non-standard timestamp format, this may be included with the call as follows:
curl \ -F schema='[ \ {"name":"ts", "type": "TIMESTAMP", "pattern": "yyyy-MM-dd - HH:mm:ss"}, \ {"name":"ticker_name", "type": "SYMBOL"} \ ]' \ -F data=@trades.csv 'http://localhost:9000/imp'
For **nanosecond-precision** timestamps such as `2021-06-22T12:08:41.077338934Z`, a pattern can be provided in the following way:
curl \ -F schema='[ \ {"name":"ts", "type": "TIMESTAMP", "pattern": "yyyy-MM-ddTHH:mm:ss.SSSUUUNNNZ"} \ ]' \ -F data=@my_file.csv \ http://localhost:9000/imp
More information on the patterns for timestamps can be found on the [date and time functions](https://questdb.com/docs/query/functions/date-time/#timestamp-format)
page.
note
The `schema` object must precede the `data` object in calls to this REST endpoint. For example:
# correct ordercurl -F schema='{my_schema_obj}' -F data=@my_file.csv http://localhost:9000/imp# incorrect ordercurl -F data=@my_file.csv -F schema='{my_schema_obj}' http://localhost:9000/imp
### Text loader configuration[](https://questdb.com/docs/ingestion/import-csv/#text-loader-configuration "Direct link to Text loader configuration")
QuestDB uses a `text_loader.json` configuration file which can be placed in the server's `conf` directory. This file does not exist by default, but has the following implicit settings:
conf/text\_loader.json
{ "date": [ { "format": "dd/MM/y" }, { "format": "yyyy-MM-dd HH:mm:ss" }, { "format": "yyyy-MM-ddTHH:mm:ss.SSSz", "locale": "en-US", "utf8": false }, { "format": "MM/dd/y" } ], "timestamp": [ { "format": "yyyy-MM-ddTHH:mm:ss.SSSUUUz", "utf8": false } ]}
#### Example[](https://questdb.com/docs/ingestion/import-csv/#example "Direct link to Example")
Given a CSV file which contains timestamps in the format `yyyy-MM-dd - HH:mm:ss.SSSUUU`, the following text loader configuration will provide the correct timestamp parsing:
conf/text\_loader.json
{ "date": [ { "format": "dd/MM/y" }, { "format": "yyyy-MM-dd HH:mm:ss" }, { "format": "yyyy-MM-ddTHH:mm:ss.SSSz", "locale": "en-US", "utf8": false }, { "format": "MM/dd/y" } ], "timestamp": [ { "format": "yyyy-MM-ddTHH:mm:ss.SSSUUUz", "utf8": false }, { "format": "yyyy-MM-dd - HH:mm:ss.SSSUUU", "utf8": false } ]}
The CSV data can then be loaded via POST request, for example, using cURL:
curl -F data=@weather.csv 'http://localhost:9000/imp'
For more information on the `/imp` entry point, refer to the [REST API documentation](https://questdb.com/docs/query/rest-api/#imp---import-data)
.
* [Import CSV via COPY SQL](https://questdb.com/docs/ingestion/import-csv/#import-csv-via-copy-sql)
* [Prepare the import](https://questdb.com/docs/ingestion/import-csv/#prepare-the-import)
* [Create the target table schema](https://questdb.com/docs/ingestion/import-csv/#create-the-target-table-schema)
* [Import CSV](https://questdb.com/docs/ingestion/import-csv/#import-csv)
* [Track import progress](https://questdb.com/docs/ingestion/import-csv/#track-import-progress)
* [FAQ](https://questdb.com/docs/ingestion/import-csv/#faq)
* [Import CSV via Rest](https://questdb.com/docs/ingestion/import-csv/#import-csv-via-rest)
* [Importing compressed files](https://questdb.com/docs/ingestion/import-csv/#importing-compressed-files)
* [Specifying a schema during CSV import](https://questdb.com/docs/ingestion/import-csv/#specifying-a-schema-during-csv-import)
* [Text loader configuration](https://questdb.com/docs/ingestion/import-csv/#text-loader-configuration)
---
# Using Docker with QuestDB | QuestDB
On this page
QuestDB has images for both Linux/macOS and Windows on [Docker Hub](https://hub.docker.com/r/questdb/questdb)
.
Install Docker[](https://questdb.com/docs/deployment/docker/#install-docker "Direct link to Install Docker")
--------------------------------------------------------------------------------------------------------------
To begin, install Docker. You can find guides for your platform on the [official documentation](https://docs.docker.com/get-docker/)
.
Run QuestDB image[](https://questdb.com/docs/deployment/docker/#run-questdb-image "Direct link to Run QuestDB image")
-----------------------------------------------------------------------------------------------------------------------
Once Docker is installed, you will need to pull QuestDB's image from [Docker Hub](https://hub.docker.com/r/questdb/questdb)
and create a container.
This can be done with a single command using:
docker run \-p 9000:9000 -p 9009:9009 -p 8812:8812 -p 9003:9003 \questdb/questdb:9.3.3
This command starts a Docker container from `questdb/questdb` image. In addition, it exposes some ports, allowing you to explore QuestDB.
In order to configure QuestDB, it is recommended to mount a [volume](https://questdb.com/docs/deployment/docker/#-v-parameter-to-mount-storage)
to allow data persistance. This can be done by adding a `-v` flag to the above command:
-v "/host/volume/location:/var/lib/questdb"
Below each parameter is described in detail.
### `-p` parameter to expose ports[](https://questdb.com/docs/deployment/docker/#-p-parameter-to-expose-ports "Direct link to -p-parameter-to-expose-ports")
This parameter will expose a port to the host. You can specify:
* `-p 9000:9000` - [REST API](https://questdb.com/docs/query/rest-api/)
and [Web Console](https://questdb.com/docs/getting-started/web-console/overview/)
* `-p 9009:9009` - [InfluxDB line protocol](https://questdb.com/docs/ingestion/ilp/overview/)
* `-p 8812:8812` - [Postgres wire protocol](https://questdb.com/docs/query/pgwire/overview/)
* `-p 9003:9003` - [Min health server](https://questdb.com/docs/operations/logging-metrics/#minimal-http-server)
All ports are optional, you can pick only the ones you need. For example, it is enough to expose `8812` if you only plan to use [Postgres wire protocol](https://questdb.com/docs/query/pgwire/overview/)
.
### `-v` parameter to mount storage[](https://questdb.com/docs/deployment/docker/#-v-parameter-to-mount-storage "Direct link to -v-parameter-to-mount-storage")
This parameter will make a local directory available to QuestDB Docker container. It will have all data ingested to QuestDB, server logs and configuration.
The QuestDB [root\_directory](https://questdb.com/docs/concepts/deep-dive/root-directory-structure/)
is located at the `/var/lib/questdb` path in the container.
### Docker image version[](https://questdb.com/docs/deployment/docker/#docker-image-version "Direct link to Docker image version")
By default, `questdb/questdb` points to the latest QuestDB version available on Docker. However, it is recommended to define the version used.
questdb/questdb:9.3.3
Environment variables[](https://questdb.com/docs/deployment/docker/#environment-variables "Direct link to Environment variables")
-----------------------------------------------------------------------------------------------------------------------------------
Server configuration can be passed to QuestDB running in Docker by using the `-e` flag to pass an environment variable to a container:
docker run -p 4000:4000 -e QDB_HTTP_BIND_TO=0.0.0.0:4000 questdb/questdb
For a list of configuration options, see [Configuration](https://questdb.com/docs/configuration/overview/)
.
Container status[](https://questdb.com/docs/deployment/docker/#container-status "Direct link to Container status")
--------------------------------------------------------------------------------------------------------------------
You can check the status of your container with `docker ps`.
It also lists the exposed ports, container name, uptime and more:
Finding container status with docker ps
docker ps
Result of docker ps
CONTAINER ID IMAGE COMMAND CREATED STATUS PORTS NAMESdd363939f261 questdb/questdb "/app/bin/java -m io…" 3 seconds ago Up 2 seconds 8812/tcp, 9000/tcp frosty_gauss
This container:
* has an id of `dd363939f261`
* uses ports `8812` & `9000`, for Postgres wire protocol and HTTP respectively
* is using a `questdb/questdb` image
* ran java to start the binary
* is 3 seconds old
* has been up for 2 seconds
* has the unfortunate name of `frosty_gauss`
For full container status information, see the [`docker ps` manual](https://docs.docker.com/engine/reference/commandline/ps/)
.
### Debugging container logs[](https://questdb.com/docs/deployment/docker/#debugging-container-logs "Direct link to Debugging container logs")
Docker may generate a runtime error.
The error may not be accurate, as the true culprit is often indicated higher up in the logs.
To see the full log, retrieve the UUID - also known as the `CONTAINER ID` - using `docker ps`:
Finding the CONTAINER ID
CONTAINER ID IMAGE ...dd363939f261 questdb/questdb ...
Now pass the `CONTAINER ID` - or `dd363939f261` - to the `docker logs` command:
Generating a docker log from a CONTAINER ID
$ docker logs dd363939f261No arguments found, start with default argumentsRunning as questdb userLog configuration loaded from: /var/lib/questdb/conf/log.conf......
Note that the log will pull from `/var/lib/questdb/conf/log.conf` by default.
Sharing this log when seeking support for Docker deployments will help us find the root cause.
Importing data and sending queries[](https://questdb.com/docs/deployment/docker/#importing-data-and-sending-queries "Direct link to Importing data and sending queries")
--------------------------------------------------------------------------------------------------------------------------------------------------------------------------
When QuestDB is running, you can start interacting with it:
* Port `9000` is for REST. More info is available on the [REST documentation page](https://questdb.com/docs/query/rest-api/)
.
* Port `8812` is used for Postgres. Check our [Postgres reference page](https://questdb.com/docs/query/pgwire/overview/)
.
* Port `9009` is dedicated to InfluxDB Line Protocol. Consult our [InfluxDB protocol page](https://questdb.com/docs/ingestion/ilp/overview/)
.
Data persistence[](https://questdb.com/docs/deployment/docker/#data-persistence "Direct link to Data persistence")
--------------------------------------------------------------------------------------------------------------------
### Mounting a volume[](https://questdb.com/docs/deployment/docker/#mounting-a-volume "Direct link to Mounting a volume")
Volumes can be mounted to the QuestDB Docker container so that data may be persisted or server configuration settings may be passed to an instance. The following example demonstrated how to mount the current directory to a QuestDB container using the `-v` flag in a Docker `run` command:
Mounting a volume
docker run -p 9000:9000 \-p 9009:9009 \-p 8812:8812 \-p 9003:9003 \-v "$(pwd):/var/lib/questdb" \questdb/questdb:9.3.3
The current directory will then have data persisted to disk for convenient migration or backups:
Current directory contents
├── conf│ └── server.conf├── db├── log├── public└── snapshot (optional)
A server configuration file can also be provided by mounting a local directory in a QuestDB container. Given the following configuration file which overrides the default HTTP bind property:
./server.conf
http.bind.to=0.0.0.0:4000
Running the container with the `-v` flag allows for mounting the current directory to QuestDB's `conf` directory in the container. With the server configuration above, HTTP ports for the [Web Console](https://questdb.com/docs/getting-started/web-console/overview/)
and REST API will be available on `http://localhost:4000`:
docker run -v "$(pwd):/var/lib/questdb/conf" -p 4000:4000 questdb/questdb
note
If you wish to use ZFS for your QuestDB deployment, with Docker, then you will need to enable ZFS on the host volume that Docker uses.
Please see the [docker documentation](https://docs.docker.com/storage/storagedriver/zfs-driver/)
for more information.
### Upgrade QuestDB version[](https://questdb.com/docs/deployment/docker/#upgrade-questdb-version "Direct link to Upgrade QuestDB version")
It is possible to upgrade your QuestDB instance on Docker when a volume is mounted to maintain data persistence.
note
* Check the [release notes](https://github.com/questdb/questdb/releases)
and ensure that necessary [backup](https://questdb.com/docs/operations/backup/)
is completed.
* Upgrading an instance is possible only when the original instance has a volume mounted. Without mounting a volume for the original instance, the following steps create a new instance and data in the old instance cannot be retrieved.
1. Run `docker ps` to copy the container name or ID:
Container status
# The existing QuestDB version is 6.5.2:CONTAINER ID IMAGE COMMAND CREATED STATUS PORTS NAMESdd363939f261 questdb/questdb:6.5.2 "/app/bin/java -m io…" 3 seconds ago Up 2 seconds 8812/tcp, 9000/tcp frosty_gauss
2. Stop the instance and then remove the container:
docker stop dd363939f261docker rm dd363939f261
3. Download the latest QuestDB image:
docker pull questdb/questdb:9.3.3
4. Start a new container with the new version and the same volume mounted:
docker run -p 8812:8812 -p 9000:9000 -v "$(pwd):/var/lib/questdb" questdb/questdb:9.3.3
### Writing logs to disk[](https://questdb.com/docs/deployment/docker/#writing-logs-to-disk "Direct link to Writing logs to disk")
When mounting a volume to a Docker container, a logging configuration file may be provided in the container located at `/conf/log.conf`:
Current directory contents
└── conf ├── log.conf └── server.conf
For example, a file with the following contents can be created:
./conf/log.conf
# list of configured writerswriters=file,stdout,http.min# file writerw.file.class=io.questdb.log.LogFileWriterw.file.location=questdb-docker.logw.file.level=INFO,ERROR,DEBUG# stdoutw.stdout.class=io.questdb.log.LogConsoleWriterw.stdout.level=INFO# min http server, used monitoringw.http.min.class=io.questdb.log.LogConsoleWriterw.http.min.level=ERRORw.http.min.scope=http-min-server
The current directory can be mounted:
Mounting the current directory to a QuestDB container
docker run -p 9000:9000 \ -p 9009:9009 \ -p 8812:8812 \ -p 9003:9003 \ -v "$(pwd):/root/.questdb/" questdb/questdb
The container logs will be written to disk using the logging level and file name provided in the `conf/log.conf` file, in this case in `./questdb-docker.log`:
Current directory tree
├── conf│ ├── log.conf│ └── server.conf├── db│ ├── table1│ └── table2├── public│ ├── ui / assets│ ├── ...│ └── version.txt└── questdb-docker.log
For more information on logging, see the [configuration reference documentation](https://questdb.com/docs/operations/logging-metrics/#docker-logging)
.
### Restart an existing container[](https://questdb.com/docs/deployment/docker/#restart-an-existing-container "Direct link to Restart an existing container")
Running the following command will create a new container for the QuestDB image:
docker run -p 9000:9000 \ -p 9009:9009 \ -p 8812:8812 \ -p 9003:9003 \ questdb/questdb
By giving the container a name with `--name container_name`, we have an easy way to refer to the container created by run later on:
docker run -p 9000:9000 \ -p 9009:9009 \ -p 8812:8812 \ -p 9003:9003 \ --name docker_questdb \ questdb/questdb
If we want to re-use this container and its data after it has been stopped, we can use the following commands:
# bring the container updocker start docker_questdb# shut the container downdocker stop docker_questdb
Alternatively, restart it using the `CONTAINER ID`:
Starting a container by CONTAINER ID
docker start dd363939f261
* [Install Docker](https://questdb.com/docs/deployment/docker/#install-docker)
* [Run QuestDB image](https://questdb.com/docs/deployment/docker/#run-questdb-image)
* [`-p` parameter to expose ports](https://questdb.com/docs/deployment/docker/#-p-parameter-to-expose-ports)
* [`-v` parameter to mount storage](https://questdb.com/docs/deployment/docker/#-v-parameter-to-mount-storage)
* [Docker image version](https://questdb.com/docs/deployment/docker/#docker-image-version)
* [Environment variables](https://questdb.com/docs/deployment/docker/#environment-variables)
* [Container status](https://questdb.com/docs/deployment/docker/#container-status)
* [Debugging container logs](https://questdb.com/docs/deployment/docker/#debugging-container-logs)
* [Importing data and sending queries](https://questdb.com/docs/deployment/docker/#importing-data-and-sending-queries)
* [Data persistence](https://questdb.com/docs/deployment/docker/#data-persistence)
* [Mounting a volume](https://questdb.com/docs/deployment/docker/#mounting-a-volume)
* [Upgrade QuestDB version](https://questdb.com/docs/deployment/docker/#upgrade-questdb-version)
* [Writing logs to disk](https://questdb.com/docs/deployment/docker/#writing-logs-to-disk)
* [Restart an existing container](https://questdb.com/docs/deployment/docker/#restart-an-existing-container)
---
# Create a sample database | QuestDB
On this page
This guide walks you through creating a sample dataset.
It utilizes `rnd_` functions and basic SQL grammar to generate 'mock' data of specific types.
For most applications, you will import your data using methods like the InfluxDB Line Protocol, CSV imports, or integration with third-party tools such as Telegraf, [Kafka](https://questdb.com/docs/ingestion/message-brokers/kafka/)
, or Prometheus. If your interest lies in data ingestion rather than generation, refer to our [ingestion overview](https://questdb.com/docs/ingestion/overview/)
. Alternatively, the [QuestDB demo instance](https://demo.questdb.io/)
offers a practical way to explore data creation and manipulation without setting up your dataset.
All that said, in this tutorial you will learn how to:
1. [Create tables](https://questdb.com/docs/getting-started/create-database/#creating-a-table)
2. [Populate tables with sample data](https://questdb.com/docs/getting-started/create-database/#inserting-data)
3. [Run simple and advanced queries](https://questdb.com/docs/getting-started/create-database/#running-queries)
4. [Delete tables](https://questdb.com/docs/getting-started/create-database/#deleting-tables)
### Before we begin...[](https://questdb.com/docs/getting-started/create-database/#before-we-begin "Direct link to Before we begin...")
All commands are run through the [Web Console](https://questdb.com/docs/getting-started/web-console/overview/)
accessible at `http://localhost:9000`.
You can also run the same SQL via the [Postgres endpoint](https://questdb.com/docs/query/pgwire/overview/)
or the [REST API](https://questdb.com/docs/query/rest-api/)
.
If QuestDB is not running locally, checkout the [quick start](https://questdb.com/docs/getting-started/quick-start/)
.
### Creating a table[](https://questdb.com/docs/getting-started/create-database/#creating-a-table "Direct link to Creating a table")
With QuestDB running, the first step is to create a table.
We'll start with one representing financial market data. Then in the insert section, we'll create another pair of tables representing temperature sensors and their readings.
Let's start by creating the `trades` table:
CREATE TABLE trades ( timestamp TIMESTAMP, symbol SYMBOL, side SYMBOL, price DOUBLE, amount DOUBLE) TIMESTAMP(timestamp) PARTITION BY DAYDEDUP UPSERT KEYS(timestamp, symbol);
This table uses QuestDB's key time-series features:
* **`TIMESTAMP(timestamp)`** — Designates the time column. QuestDB physically sorts data by this column, enabling sub-millisecond time-range queries.
* **`PARTITION BY DAY`** — Splits data into daily partitions for efficient queries and data lifecycle management.
* **`SYMBOL`** — Optimized type for repeated strings like tickers.
* **`DEDUP UPSERT KEYS`** — Prevents duplicate rows.
For a deeper understanding, see [Schema design](https://questdb.com/docs/schema-design-essentials/)
.
We've done all of this to match the nature of how we'll query this data. We're focused on a the flow of the market, the pulse of the market's day-to-day, hence we've partitioned it as such. We're also leery of duplicates, for accuracy of data, so we'll ensure that if timestamps are identical that we do not create a duplicate. Timestamps are essential for time-series analysis.
We'll proceed forward to INSERT.
### Inserting data[](https://questdb.com/docs/getting-started/create-database/#inserting-data "Direct link to Inserting data")
#### Financial market data[](https://questdb.com/docs/getting-started/create-database/#financial-market-data "Direct link to Financial market data")
Let's populate our `trades` table with procedurally-generated data:
Insert as SELECT
INSERT INTO trades SELECT timestamp_sequence('2024-01-01T00:00:00', 60000L * x) timestamp, -- Generate a timestamp every minute starting from Jan 1, 2024 rnd_str('ETH-USD', 'BTC-USD', 'SOL-USD', 'LTC-USD', 'UNI-USD') symbol, -- Random ticker symbols rnd_str('buy', 'sell') side, -- Random side (BUY or SELL) rnd_double() * 1000 + 100 price, -- Random price between 100.0 and 1100.0, rnd_double() * 2000 + 0.1 amount -- Random price between 0.1 and 2000.1 FROM long_sequence(10000) x;
Our `trades` table now contains 10,000 randomly-generated trades. The comments indicate how we've structured our random data. We picked a few companies, BUY vs. SELL, and created a timestamp every minute. We've dictated the overall number of rows generated via `long_sequence(10000)`. We can bump that up, if we want.
We've also conservatively generated a timestamp per minute, even though in reality trades against these companies are likely much more frequent. This helps keep our basic examples basic.
Now let's look at the table and its data:
'trades';
It will look similar to this, albeit with alternative randomized values.
| timestamp | symbol | side | price | amount |
| --- | --- | --- | --- | --- |
| 2024-01-01T00:00:00.000000Z | BTC-USD | sell | 483.904143675277 | 139.449481016294 |
| 2024-01-01T00:00:00.060000Z | ETH-USD | sell | 920.296245196274 | 920.296245196274 |
| 2024-01-01T00:00:00.180000Z | UNI-USD | sell | 643.277468441839 | 643.277468441839 |
| 2024-01-01T00:00:00.360000Z | LTC-USD | buy | 218.0920768859 | 729.81119178972 |
| 2024-01-01T00:00:00.600000Z | BTC-USD | sell | 157.596416931116 | 691.081778396176 |
That's some fake market data. Let's create more tables to demonstrate joins.
### Quotes and instruments[](https://questdb.com/docs/getting-started/create-database/#quotes-and-instruments "Direct link to Quotes and instruments")
This next example will create and populate two more tables. One table will contain price quotes, and the other will contain instrument metadata. In both cases, we will create the table and generate the data at the same time.
This combines the CREATE & SELECT operations to perform a create-and-insert:
Create table as, quotes
CREATE TABLE quotesAS( SELECT x ID, timestamp_sequence(to_timestamp('2019-10-17T00:00:00', 'yyyy-MM-ddTHH:mm:ss'), rnd_long(1,10,0) * 100000L) ts, rnd_double(0)*80 + 100 price, rnd_long(0, 10000, 0) instrument_id FROM long_sequence(10000000) x)TIMESTAMP(ts)PARTITION BY MONTH DEDUP UPSERT KEYS(ts, instrument_id);
This table uses the same time-series features:
* **`TIMESTAMP(ts)`** — Designates the time column for fast time-range queries.
* **`PARTITION BY MONTH`** — Monthly partitions (use larger partitions for lower-volume data).
* **`DEDUP UPSERT KEYS(ts, instrument_id)`** — One quote per timestamp per instrument.
The generated data will look like the following:
| ID | ts | price | instrument\_id |
| --- | --- | --- | --- |
| 1 | 2019-10-17T00:00:00.000000Z | 145.37 | 9160 |
| 2 | 2019-10-17T00:00:00.600000Z | 162.91 | 9671 |
| 3 | 2019-10-17T00:00:01.400000Z | 128.58 | 8731 |
| 4 | 2019-10-17T00:00:01.500000Z | 131.69 | 3447 |
| 5 | 2019-10-17T00:00:01.600000Z | 155.68 | 7985 |
| ... | ... | ... | ... |
Nice - and our next table, which includes the instruments themselves and their detail:
Create table as, instruments
CREATE TABLE instrumentsAS( SELECT x ID, -- Increasing integer rnd_str('NYSE', 'NASDAQ', 'LSE', 'TSE', 'HKEX') exchange, -- Random exchange rnd_str('Tech', 'Finance', 'Energy', 'Healthcare', 'Consumer') sector -- Random sector FROM long_sequence(10000) x)
This `instruments` table has no designated timestamp — it's a static lookup table with no time dimension. This is the exception; most QuestDB tables should have a designated timestamp to enable time-series optimizations.
With these two new tables, and our prior financial market data table, we've got a lot of useful queries we can test.
### Running queries[](https://questdb.com/docs/getting-started/create-database/#running-queries "Direct link to Running queries")
Our financial market data table is a great place to test various [aggregate functions](https://questdb.com/docs/query/functions/aggregation/)
, to compute price over time intervals, and similar analysis.
Let's expand on the `quotes` and `instruments` tables.
First, let's look at `quotes`, running our shorthand for `SELECT * FROM quotes;`:
quotes;
Let's then select the `count` of records from `quotes`:
SELECT count() FROM quotes;
| count |
| --- |
| 10,000,000 |
And then the average price:
SELECT avg(price) FROM quotes;
| average |
| --- |
| 139.99217780895 |
We can now use the `instruments` table alongside the `quotes` table to get more interesting results using a `JOIN`:
SELECT *FROM quotesJOIN( SELECT ID inst_id, exchange, sector FROM instruments)ON quotes.instrument_id = inst_id;
The results should look like the table below:
| ID | ts | price | instrument\_id | inst\_id | exchange | sector |
| --- | --- | --- | --- | --- | --- | --- |
| 1 | 2019-10-17T00:00:00.000000Z | 146.47 | 3211 | 3211 | LSE | Tech |
| 2 | 2019-10-17T00:00:00.100000Z | 136.59 | 2319 | 2319 | NASDAQ | Finance |
| 3 | 2019-10-17T00:00:00.100000Z | 160.29 | 8723 | 8723 | NYSE | Tech |
| 4 | 2019-10-17T00:00:00.100000Z | 170.94 | 885 | 885 | HKEX | Healthcare |
| 5 | 2019-10-17T00:00:00.200000Z | 149.34 | 3200 | 3200 | NASDAQ | Energy |
| 6 | 2019-10-17T00:00:01.100000Z | 160.95 | 4053 | 4053 | TSE | Consumer |
Note the timestamps returned as we've JOIN'd the tables together.
Let's try another type of aggregation:
Aggregation keyed by sector
SELECT sector, max(price)FROM quotesJOIN( SELECT ID inst_id, sector FROM instruments) aON quotes.instrument_id = a.inst_id;
The results should look like the table below:
| sector | max |
| --- | --- |
| Tech | 179.99998786398 |
| Finance | 179.99998138348 |
| Energy | 179.9999994818 |
| Healthcare | 179.99991705861 |
| Consumer | 179.99999233377 |
Back to time, given we have one table (`quotes`) partitioned by time, let's see what we can do when we JOIN the tables together to perform an aggregation based on an hour of time:
Aggregation by hourly time buckets
SELECT ts, sector, exchange, avg(price)FROM quotes timestamp(ts)JOIN (SELECT ID inst_id, sector, exchange FROM instruments WHERE sector='Tech' AND exchange='NYSE') aON quotes.instrument_id = a.inst_idWHERE ts IN '2019-10-21;1d' -- this is an interval between 2019/10/21 and the next daySAMPLE BY 1h -- aggregation by hourly time bucketsALIGN TO CALENDAR; -- align the ts with the start of the hour (hh:00:00)
The results should look like the table below:
| ts | sector | exchange | average |
| --- | --- | --- | --- |
| 2019-10-21T00:00:00.000000Z | Tech | NYSE | 140.004285872 |
| 2019-10-21T00:01:00.000000Z | Tech | NYSE | 136.68436714 |
| 2019-10-21T00:02:00.000000Z | Tech | NYSE | 135.24368409 |
| 2019-10-21T00:03:00.000000Z | Tech | NYSE | 137.19398410 |
| 2019-10-21T00:04:00.000000Z | Tech | NYSE | 150.77868682 |
| ... | ... | ... | ... |
For more information about these statements, please refer to the [SELECT](https://questdb.com/docs/query/sql/select/)
, [JOIN](https://questdb.com/docs/query/sql/join/)
and [SAMPLE BY](https://questdb.com/docs/query/sql/sample-by/)
pages.
### Deleting tables[](https://questdb.com/docs/getting-started/create-database/#deleting-tables "Direct link to Deleting tables")
We can now clean up the demo data by using [`DROP TABLE`](https://questdb.com/docs/query/sql/drop/)
SQL. Be careful using this statement as QuestDB cannot recover data that is deleted in this way:
DROP TABLE quotes;DROP TABLE instruments;DROP TABLE trades;
* [Before we begin...](https://questdb.com/docs/getting-started/create-database/#before-we-begin)
* [Creating a table](https://questdb.com/docs/getting-started/create-database/#creating-a-table)
* [Inserting data](https://questdb.com/docs/getting-started/create-database/#inserting-data)
* [Quotes and instruments](https://questdb.com/docs/getting-started/create-database/#quotes-and-instruments)
* [Running queries](https://questdb.com/docs/getting-started/create-database/#running-queries)
* [Deleting tables](https://questdb.com/docs/getting-started/create-database/#deleting-tables)
---
# Order-level implementation shortfall | QuestDB
On this page
The [fill-level IS decomposition](https://questdb.com/docs/cookbook/sql/finance/implementation-shortfall/)
breaks down cost into spread, permanent, and temporary components per symbol. This recipe calculates **total implementation shortfall per order** — comparing the volume-weighted average execution price across all fills against the mid-price at the time the first fill arrived.
This is the headline TCA metric: how much did the entire order cost relative to where the market was when you started executing?
Problem[](https://questdb.com/docs/cookbook/sql/finance/implementation-shortfall-order/#problem "Direct link to Problem")
---------------------------------------------------------------------------------------------------------------------------
Orders in `fx_trades` are often split into multiple partial fills (rows sharing the same `order_id`). You want to compute a single cost metric per order that accounts for all fills, weighted by size, and benchmarked against the arrival price (the mid at the time of the first fill).
Solution[](https://questdb.com/docs/cookbook/sql/finance/implementation-shortfall-order/#solution "Direct link to Solution")
------------------------------------------------------------------------------------------------------------------------------
Use `ASOF JOIN` to capture the mid-price at each fill, then aggregate by `order_id` to get the volume-weighted average execution price and arrival mid:
Total implementation shortfall per order[Demo this query](https://demo.questdb.io/?query=WITH%20fills_enriched%20AS%20(%0A%20%20%20%20SELECT%0A%20%20%20%20%20%20%20%20f.order_id%2C%0A%20%20%20%20%20%20%20%20f.symbol%2C%0A%20%20%20%20%20%20%20%20f.side%2C%0A%20%20%20%20%20%20%20%20f.price%2C%0A%20%20%20%20%20%20%20%20f.quantity%2C%0A%20%20%20%20%20%20%20%20f.timestamp%2C%0A%20%20%20%20%20%20%20%20(m.best_bid%20%2B%20m.best_ask)%20%2F%202%20AS%20mid_at_fill%0A%20%20%20%20FROM%20fx_trades%20f%0A%20%20%20%20ASOF%20JOIN%20market_data%20m%20ON%20(symbol)%0A%20%20%20%20WHERE%20f.timestamp%20IN%20%27%24yesterday%27%0A)%2C%0Aorder_summary%20AS%20(%0A%20%20%20%20SELECT%0A%20%20%20%20%20%20%20%20order_id%2C%0A%20%20%20%20%20%20%20%20symbol%2C%0A%20%20%20%20%20%20%20%20side%2C%0A%20%20%20%20%20%20%20%20first(mid_at_fill)%20AS%20arrival_mid%2C%0A%20%20%20%20%20%20%20%20sum(price%20*%20quantity)%20%2F%20sum(quantity)%20AS%20avg_exec_price%2C%0A%20%20%20%20%20%20%20%20sum(quantity)%20AS%20total_qty%2C%0A%20%20%20%20%20%20%20%20count()%20AS%20n_fills%2C%0A%20%20%20%20%20%20%20%20min(timestamp)%20AS%20first_fill_ts%2C%0A%20%20%20%20%20%20%20%20max(timestamp)%20AS%20last_fill_ts%0A%20%20%20%20FROM%20fills_enriched%0A%20%20%20%20GROUP%20BY%20order_id%2C%20symbol%2C%20side%0A)%0ASELECT%0A%20%20%20%20order_id%2C%0A%20%20%20%20symbol%2C%0A%20%20%20%20side%2C%0A%20%20%20%20n_fills%2C%0A%20%20%20%20total_qty%2C%0A%20%20%20%20CASE%20WHEN%20side%20%3D%20%27buy%27%20THEN%201%20ELSE%20-1%20END%0A%20%20%20%20%20%20%20%20*%20(avg_exec_price%20-%20arrival_mid)%0A%20%20%20%20%20%20%20%20%2F%20arrival_mid%20*%2010000%20AS%20total_is_bps%0AFROM%20order_summary%0AORDER%20BY%20total_is_bps%20DESC%3B&executeQuery=true)
WITH fills_enriched AS ( SELECT f.order_id, f.symbol, f.side, f.price, f.quantity, f.timestamp, (m.best_bid + m.best_ask) / 2 AS mid_at_fill FROM fx_trades f ASOF JOIN market_data m ON (symbol) WHERE f.timestamp IN '$yesterday'),order_summary AS ( SELECT order_id, symbol, side, first(mid_at_fill) AS arrival_mid, sum(price * quantity) / sum(quantity) AS avg_exec_price, sum(quantity) AS total_qty, count() AS n_fills, min(timestamp) AS first_fill_ts, max(timestamp) AS last_fill_ts FROM fills_enriched GROUP BY order_id, symbol, side)SELECT order_id, symbol, side, n_fills, total_qty, CASE WHEN side = 'buy' THEN 1 ELSE -1 END * (avg_exec_price - arrival_mid) / arrival_mid * 10000 AS total_is_bpsFROM order_summaryORDER BY total_is_bps DESC;
How it works[](https://questdb.com/docs/cookbook/sql/finance/implementation-shortfall-order/#how-it-works "Direct link to How it works")
------------------------------------------------------------------------------------------------------------------------------------------
### Step 1: Enrich fills with market state[](https://questdb.com/docs/cookbook/sql/finance/implementation-shortfall-order/#step-1-enrich-fills-with-market-state "Direct link to Step 1: Enrich fills with market state")
The `ASOF JOIN` pairs each fill with the most recent order book snapshot to compute the mid-price at execution time.
### Step 2: Aggregate to order level[](https://questdb.com/docs/cookbook/sql/finance/implementation-shortfall-order/#step-2-aggregate-to-order-level "Direct link to Step 2: Aggregate to order level")
The `order_summary` CTE groups fills by `order_id` and computes:
* **`arrival_mid`** — `first(mid_at_fill)` gives the mid at the time of the earliest fill, which serves as the arrival price benchmark
* **`avg_exec_price`** — volume-weighted average price across all fills: `sum(price * quantity) / sum(quantity)`
* **`n_fills`** and **`total_qty`** — order size context
### Step 3: Compute IS[](https://questdb.com/docs/cookbook/sql/finance/implementation-shortfall-order/#step-3-compute-is "Direct link to Step 3: Compute IS")
The final SELECT calculates the shortfall in basis points:
IS = direction * (avg_exec_price - arrival_mid) / arrival_mid * 10000
Where `direction` is +1 for buys, -1 for sells — so positive IS always means you paid more than the arrival benchmark.
Results are ordered worst-first (`DESC`) so the most expensive orders appear at the top.
Interpreting results[](https://questdb.com/docs/cookbook/sql/finance/implementation-shortfall-order/#interpreting-results "Direct link to Interpreting results")
------------------------------------------------------------------------------------------------------------------------------------------------------------------
* **Near-zero IS**: The order executed close to the arrival price. Good execution for the order size.
* **Positive IS (cost)**: The order executed worse than the arrival mid. For multi-fill orders, later fills may have walked the book or the market moved during execution.
* **Negative IS (savings)**: The order beat the arrival benchmark. Can happen with patient limit orders or favorable market movement during execution.
* **High `n_fills`**: Orders with many partial fills are more likely to show IS due to market movement between fills. Compare IS against `n_fills` and `last_fill_ts - first_fill_ts` to understand whether cost came from market impact or execution duration.
Execution drift (delay cost)[](https://questdb.com/docs/cookbook/sql/finance/implementation-shortfall-order/#execution-drift-delay-cost "Direct link to Execution drift (delay cost)")
----------------------------------------------------------------------------------------------------------------------------------------------------------------------------------------
Total IS tells you _how much_ an order cost, but not _when_ that cost accrued. Execution drift measures how much the mid-price moved against you between the first and last fill — isolating the cost of taking time to complete the order:
Mid-price drift during order execution[Demo this query](https://demo.questdb.io/?query=WITH%20fills_enriched%20AS%20(%0A%20%20%20%20SELECT%0A%20%20%20%20%20%20%20%20f.order_id%2C%0A%20%20%20%20%20%20%20%20f.symbol%2C%0A%20%20%20%20%20%20%20%20f.side%2C%0A%20%20%20%20%20%20%20%20f.price%2C%0A%20%20%20%20%20%20%20%20f.quantity%2C%0A%20%20%20%20%20%20%20%20f.timestamp%2C%0A%20%20%20%20%20%20%20%20(m.best_bid%20%2B%20m.best_ask)%20%2F%202%20AS%20mid_at_fill%0A%20%20%20%20FROM%20fx_trades%20f%0A%20%20%20%20ASOF%20JOIN%20market_data%20m%20ON%20(symbol)%0A%20%20%20%20WHERE%20f.timestamp%20IN%20%27%24yesterday%27%0A)%2C%0Aorder_bounds%20AS%20(%0A%20%20%20%20SELECT%0A%20%20%20%20%20%20%20%20order_id%2C%0A%20%20%20%20%20%20%20%20symbol%2C%0A%20%20%20%20%20%20%20%20side%2C%0A%20%20%20%20%20%20%20%20first(mid_at_fill)%20AS%20arrival_mid%2C%0A%20%20%20%20%20%20%20%20last(mid_at_fill)%20AS%20mid_at_last_fill%2C%0A%20%20%20%20%20%20%20%20min(timestamp)%20AS%20first_fill_ts%2C%0A%20%20%20%20%20%20%20%20max(timestamp)%20AS%20last_fill_ts%0A%20%20%20%20FROM%20fills_enriched%0A%20%20%20%20GROUP%20BY%20order_id%2C%20symbol%2C%20side%0A)%0ASELECT%0A%20%20%20%20order_id%2C%0A%20%20%20%20symbol%2C%0A%20%20%20%20side%2C%0A%20%20%20%20CASE%20WHEN%20side%20%3D%20%27buy%27%20THEN%201%20ELSE%20-1%20END%0A%20%20%20%20%20%20%20%20*%20(mid_at_last_fill%20-%20arrival_mid)%0A%20%20%20%20%20%20%20%20%2F%20arrival_mid%20*%2010000%20AS%20execution_drift_bps%2C%0A%20%20%20%20last_fill_ts%20-%20first_fill_ts%20AS%20execution_duration%0AFROM%20order_bounds%0AORDER%20BY%20execution_drift_bps%20DESC%3B&executeQuery=true)
WITH fills_enriched AS ( SELECT f.order_id, f.symbol, f.side, f.price, f.quantity, f.timestamp, (m.best_bid + m.best_ask) / 2 AS mid_at_fill FROM fx_trades f ASOF JOIN market_data m ON (symbol) WHERE f.timestamp IN '$yesterday'),order_bounds AS ( SELECT order_id, symbol, side, first(mid_at_fill) AS arrival_mid, last(mid_at_fill) AS mid_at_last_fill, min(timestamp) AS first_fill_ts, max(timestamp) AS last_fill_ts FROM fills_enriched GROUP BY order_id, symbol, side)SELECT order_id, symbol, side, CASE WHEN side = 'buy' THEN 1 ELSE -1 END * (mid_at_last_fill - arrival_mid) / arrival_mid * 10000 AS execution_drift_bps, last_fill_ts - first_fill_ts AS execution_durationFROM order_boundsORDER BY execution_drift_bps DESC;
`execution_drift_bps` measures how much the mid moved against you from first fill to last fill. `execution_duration` shows how long the order took to complete.
Arrival price vs first fill
In this dataset, the arrival price and first fill are effectively the same moment. In a real trading system, the arrival price would be the mid at decision time (before the order was sent), and **delay cost** would be the drift from decision to first fill. With `fx_trades`, the best available proxy is drift during execution — from first fill to last fill.
High drift on long-duration orders suggests the market is moving against you while you execute. This can indicate that order sizes are too large for the available liquidity, or that execution is too slow. Compare with total IS — if drift accounts for most of the IS, faster execution would reduce costs.
Spread cost per order[](https://questdb.com/docs/cookbook/sql/finance/implementation-shortfall-order/#spread-cost-per-order "Direct link to Spread cost per order")
---------------------------------------------------------------------------------------------------------------------------------------------------------------------
Isolate the spread component of execution cost — the quantity-weighted half-spread paid across all fills in an order:
Spread cost per order[Demo this query](https://demo.questdb.io/?query=WITH%20fills_enriched%20AS%20(%0A%20%20%20%20SELECT%0A%20%20%20%20%20%20%20%20f.order_id%2C%0A%20%20%20%20%20%20%20%20f.symbol%2C%0A%20%20%20%20%20%20%20%20f.side%2C%0A%20%20%20%20%20%20%20%20f.price%2C%0A%20%20%20%20%20%20%20%20f.quantity%2C%0A%20%20%20%20%20%20%20%20m.best_ask%20-%20m.best_bid%20AS%20spread_at_fill%0A%20%20%20%20FROM%20fx_trades%20f%0A%20%20%20%20ASOF%20JOIN%20market_data%20m%20ON%20(symbol)%0A%20%20%20%20WHERE%20f.timestamp%20IN%20%27%24yesterday%27%0A)%0ASELECT%0A%20%20%20%20order_id%2C%0A%20%20%20%20symbol%2C%0A%20%20%20%20sum(0.5%20*%20spread_at_fill%20*%20quantity)%0A%20%20%20%20%20%20%20%20%2F%20sum(quantity)%20AS%20avg_halfspread%2C%0A%20%20%20%20sum(0.5%20*%20spread_at_fill%20%2F%20price%20*%2010000%20*%20quantity)%0A%20%20%20%20%20%20%20%20%2F%20sum(quantity)%20AS%20spread_cost_bps%2C%0A%20%20%20%20sum(quantity)%20AS%20total_qty%0AFROM%20fills_enriched%0AGROUP%20BY%20order_id%2C%20symbol%0AORDER%20BY%20spread_cost_bps%20DESC%3B&executeQuery=true)
WITH fills_enriched AS ( SELECT f.order_id, f.symbol, f.side, f.price, f.quantity, m.best_ask - m.best_bid AS spread_at_fill FROM fx_trades f ASOF JOIN market_data m ON (symbol) WHERE f.timestamp IN '$yesterday')SELECT order_id, symbol, sum(0.5 * spread_at_fill * quantity) / sum(quantity) AS avg_halfspread, sum(0.5 * spread_at_fill / price * 10000 * quantity) / sum(quantity) AS spread_cost_bps, sum(quantity) AS total_qtyFROM fills_enrichedGROUP BY order_id, symbolORDER BY spread_cost_bps DESC;
Two spread metrics per order:
* **`avg_halfspread`** — quantity-weighted average half-spread in price terms. This is the baseline cost of crossing the spread, weighted by how much volume went through at each spread level.
* **`spread_cost_bps`** — the same in basis points, normalized by fill price.
Compare `spread_cost_bps` against total IS to understand how much of the execution cost was simply the spread vs. market impact. If spread cost accounts for most of the IS, execution quality is reasonable — you're paying the market price for immediacy. If total IS significantly exceeds spread cost, the excess is market impact or adverse drift.
Permanent vs temporary impact per order[](https://questdb.com/docs/cookbook/sql/finance/implementation-shortfall-order/#permanent-vs-temporary-impact-per-order "Direct link to Permanent vs temporary impact per order")
---------------------------------------------------------------------------------------------------------------------------------------------------------------------------------------------------------------------------
Decompose each order's total IS into permanent impact (information content) and temporary impact (transient dislocation that reverts). This uses `HORIZON JOIN` to capture the mid at fill time and 30 minutes later, then `PIVOT` to reshape into columns:
Order-level IS decomposition into permanent and temporary impact[Demo this query](https://demo.questdb.io/?query=WITH%20order_markouts%20AS%20(%0A%20%20%20%20SELECT%0A%20%20%20%20%20%20%20%20f.order_id%2C%0A%20%20%20%20%20%20%20%20f.symbol%2C%0A%20%20%20%20%20%20%20%20f.side%2C%0A%20%20%20%20%20%20%20%20h.offset%2C%0A%20%20%20%20%20%20%20%20sum((m.best_bid%20%2B%20m.best_ask)%20%2F%202%20*%20f.quantity)%0A%20%20%20%20%20%20%20%20%20%20%20%20%2F%20sum(f.quantity)%20AS%20weighted_mid%2C%0A%20%20%20%20%20%20%20%20sum(f.price%20*%20f.quantity)%20%2F%20sum(f.quantity)%20AS%20avg_exec_price%2C%0A%20%20%20%20%20%20%20%20sum(f.quantity)%20AS%20total_qty%0A%20%20%20%20FROM%20fx_trades%20f%0A%20%20%20%20HORIZON%20JOIN%20market_data%20m%20ON%20(f.symbol%20%3D%20m.symbol)%0A%20%20%20%20%20%20%20%20LIST%20(0s%2C%2030m)%20AS%20h%0A%20%20%20%20WHERE%20f.timestamp%20IN%20%27%24yesterday%27%0A)%2C%0Apivoted%20AS%20(%0A%20%20%20%20SELECT%20*%20FROM%20order_markouts%0A%20%20%20%20PIVOT%20(%0A%20%20%20%20%20%20%20%20first(weighted_mid)%20AS%20mid%0A%20%20%20%20%20%20%20%20FOR%20offset%20IN%20(%0A%20%20%20%20%20%20%20%20%20%20%20%200%20%20%20%20%20%20%20%20%20%20%20%20%20%20%20AS%20at_fill%2C%0A%20%20%20%20%20%20%20%20%20%20%20%201800000000000%20%20%20AS%20at_30m%0A%20%20%20%20%20%20%20%20)%0A%20%20%20%20%20%20%20%20GROUP%20BY%20order_id%2C%20symbol%2C%20side%2C%20avg_exec_price%2C%20total_qty%0A%20%20%20%20)%0A)%0ASELECT%0A%20%20%20%20order_id%2C%0A%20%20%20%20symbol%2C%0A%20%20%20%20side%2C%0A%20%20%20%20total_qty%2C%0A%20%20%20%20CASE%20WHEN%20side%20%3D%20%27buy%27%20THEN%201%20ELSE%20-1%20END%0A%20%20%20%20%20%20%20%20*%20(avg_exec_price%20-%20at_fill_mid)%0A%20%20%20%20%20%20%20%20%2F%20at_fill_mid%20*%2010000%20AS%20total_is_bps%2C%0A%20%20%20%20CASE%20WHEN%20side%20%3D%20%27buy%27%20THEN%201%20ELSE%20-1%20END%0A%20%20%20%20%20%20%20%20*%20(at_30m_mid%20-%20at_fill_mid)%0A%20%20%20%20%20%20%20%20%2F%20at_fill_mid%20*%2010000%20AS%20permanent_bps%2C%0A%20%20%20%20CASE%20WHEN%20side%20%3D%20%27buy%27%20THEN%201%20ELSE%20-1%20END%0A%20%20%20%20%20%20%20%20*%20(avg_exec_price%20-%20at_30m_mid)%0A%20%20%20%20%20%20%20%20%2F%20at_fill_mid%20*%2010000%20AS%20temporary_bps%0AFROM%20pivoted%0AORDER%20BY%20total_is_bps%20DESC%3B&executeQuery=true)
WITH order_markouts AS ( SELECT f.order_id, f.symbol, f.side, h.offset, sum((m.best_bid + m.best_ask) / 2 * f.quantity) / sum(f.quantity) AS weighted_mid, sum(f.price * f.quantity) / sum(f.quantity) AS avg_exec_price, sum(f.quantity) AS total_qty FROM fx_trades f HORIZON JOIN market_data m ON (f.symbol = m.symbol) LIST (0s, 30m) AS h WHERE f.timestamp IN '$yesterday'),pivoted AS ( SELECT * FROM order_markouts PIVOT ( first(weighted_mid) AS mid FOR offset IN ( 0 AS at_fill, 1800000000000 AS at_30m ) GROUP BY order_id, symbol, side, avg_exec_price, total_qty ))SELECT order_id, symbol, side, total_qty, CASE WHEN side = 'buy' THEN 1 ELSE -1 END * (avg_exec_price - at_fill_mid) / at_fill_mid * 10000 AS total_is_bps, CASE WHEN side = 'buy' THEN 1 ELSE -1 END * (at_30m_mid - at_fill_mid) / at_fill_mid * 10000 AS permanent_bps, CASE WHEN side = 'buy' THEN 1 ELSE -1 END * (avg_exec_price - at_30m_mid) / at_fill_mid * 10000 AS temporary_bpsFROM pivotedORDER BY total_is_bps DESC;
The first CTE does the heavy lifting — it computes the quantity-weighted mid and quantity-weighted average execution price per order _at each horizon offset_, so the aggregation happens before the PIVOT. The PIVOT then simply reshapes the two offsets (0s and 30m) into columns.
This gives you three metrics per order:
* **`total_is_bps`** — same as the headline IS above, for reference
* **`permanent_bps`** — how much the mid moved permanently (arrival mid vs mid 30 minutes after execution). High permanent impact suggests your order carried information or was perceived as informed.
* **`temporary_bps`** — how much of the cost reverted (fill price vs post-execution mid). High temporary impact means you moved the market but it bounced back — you paid for liquidity consumption, not information.
The identity holds: **total IS = permanent + temporary**. An order with mostly permanent impact is genuinely moving the market. An order with mostly temporary impact is just paying for immediacy.
Related documentation
* [ASOF JOIN](https://questdb.com/docs/query/sql/asof-join/)
* [HORIZON JOIN](https://questdb.com/docs/query/sql/horizon-join/)
* [PIVOT](https://questdb.com/docs/query/sql/pivot/)
* [GROUP BY](https://questdb.com/docs/query/sql/group-by/)
* [Implementation shortfall decomposition recipe](https://questdb.com/docs/cookbook/sql/finance/implementation-shortfall/)
* [Slippage per fill recipe](https://questdb.com/docs/cookbook/sql/finance/slippage/)
* [Problem](https://questdb.com/docs/cookbook/sql/finance/implementation-shortfall-order/#problem)
* [Solution](https://questdb.com/docs/cookbook/sql/finance/implementation-shortfall-order/#solution)
* [How it works](https://questdb.com/docs/cookbook/sql/finance/implementation-shortfall-order/#how-it-works)
* [Step 1: Enrich fills with market state](https://questdb.com/docs/cookbook/sql/finance/implementation-shortfall-order/#step-1-enrich-fills-with-market-state)
* [Step 2: Aggregate to order level](https://questdb.com/docs/cookbook/sql/finance/implementation-shortfall-order/#step-2-aggregate-to-order-level)
* [Step 3: Compute IS](https://questdb.com/docs/cookbook/sql/finance/implementation-shortfall-order/#step-3-compute-is)
* [Interpreting results](https://questdb.com/docs/cookbook/sql/finance/implementation-shortfall-order/#interpreting-results)
* [Execution drift (delay cost)](https://questdb.com/docs/cookbook/sql/finance/implementation-shortfall-order/#execution-drift-delay-cost)
* [Spread cost per order](https://questdb.com/docs/cookbook/sql/finance/implementation-shortfall-order/#spread-cost-per-order)
* [Permanent vs temporary impact per order](https://questdb.com/docs/cookbook/sql/finance/implementation-shortfall-order/#permanent-vs-temporary-impact-per-order)
---
# Import CSV Using Web Console | QuestDB
On this page
The **Import CSV** functionality in the Web Console provides a user-friendly interface to upload and import CSV files into QuestDB. You can create new tables or append data to existing tables with automatic schema detection and flexible configuration options.
Accessing the Import Interface[](https://questdb.com/docs/getting-started/web-console/import-csv/#accessing-the-import-interface "Direct link to Accessing the Import Interface")
-----------------------------------------------------------------------------------------------------------------------------------------------------------------------------------
You can access the import tab by clicking the import icon in the left-side navigation menu of the Web Console.

Import Process[](https://questdb.com/docs/getting-started/web-console/import-csv/#import-process "Direct link to Import Process")
-----------------------------------------------------------------------------------------------------------------------------------
### Upload Queue[](https://questdb.com/docs/getting-started/web-console/import-csv/#upload-queue "Direct link to Upload Queue")
Once a file is added to the upload queue, the following configurations will be displayed:

### Configuration Options[](https://questdb.com/docs/getting-started/web-console/import-csv/#configuration-options "Direct link to Configuration Options")
* **File**: The file name, size, and import status
* **Table name**: The name of the table to be created or updated. By default, this is the name of the imported file
* **Schema**: The column name and data type. The schema is automatically detected but can be set manually
* **Write mode**:
* `Append`: Uploaded data will be appended to the end of the table
* `Overwrite`: Uploaded data will override existing data in the table
* **Actions**:
* `Settings`: Additional configuration for the import
* `Upload`: Start the upload
* `X`: Delete the file from the upload queue
Table Schema Configuration[](https://questdb.com/docs/getting-started/web-console/import-csv/#table-schema-configuration "Direct link to Table Schema Configuration")
-----------------------------------------------------------------------------------------------------------------------------------------------------------------------
### For Existing Tables[](https://questdb.com/docs/getting-started/web-console/import-csv/#for-existing-tables "Direct link to For Existing Tables")
To update the schema of an existing table, select `Overwrite` write mode to replace the existing rows and partition unit with data from the CSV file.
For an existing table, changing the table name allows you to import the data as a new separate table.
### For New Tables[](https://questdb.com/docs/getting-started/web-console/import-csv/#for-new-tables "Direct link to For New Tables")
The following settings are available for configuration:
| Setting | Description |
| --- | --- |
| Partition | Change the partition setting of the table |
| Designated timestamp | Selecting a designated timestamp. This is mandatory if the partition unit is not `NONE` |
| Data type | Define the data type. For timestamp, the timestamp format is mandatory and there is the option to select the column as the designated timestamp |
| Delete column | Click `x` to delete the column from the table |
| Add column | At the end of the column list, select "Add column" to insert a new column into the table |
The following table schema details are imported based on the CSV file:
* The column order
* The column name
Import Settings[](https://questdb.com/docs/getting-started/web-console/import-csv/#import-settings "Direct link to Import Settings")
--------------------------------------------------------------------------------------------------------------------------------------
The Settings panel displays the following configurations:
| Setting | Description | Default value |
| --- | --- | --- |
| Maximum number of uncommitted rows | The size of the commit batch. A commit will be issued when this number is reached in the buffer. This setting is the same as `cairo.max.uncommitted.rows`. To avoid running out of memory during an import, set this value based on the RAM size of the machine | 500000 |
| Delimiter | The delimiter character to parse the CSV file | Automatic |
| Atomicity | Error behavior. Rejected rows or columns will be reported in the Details panel after the import is completed | Skip column |
| Force header | Whether to interpret the first line as the header. The result will be reported in the Details panel after the import is completed | FALSE |
| Skip line extra values | Whether the parser should ignore extra values by skipping the entire line. An extra value is something in addition to what is defined by the header | FALSE |
Import Results and Details[](https://questdb.com/docs/getting-started/web-console/import-csv/#import-results-and-details "Direct link to Import Results and Details")
-----------------------------------------------------------------------------------------------------------------------------------------------------------------------
### Status Display[](https://questdb.com/docs/getting-started/web-console/import-csv/#status-display "Direct link to Status Display")
The import status is displayed in the file column. Once the action is completed, the number of rows inserted is displayed alongside the `Details` tab:

### Details Panel[](https://questdb.com/docs/getting-started/web-console/import-csv/#details-panel "Direct link to Details Panel")
The `Details` panel lists rejected rows and import errors for each column:

The details such as forced header, table name, and rejected rows are related to the import settings you defined. For example, setting Atomicity in Settings to "Skip row" will result in skipped rows being reported under Rejected rows after the import.
* [Accessing the Import Interface](https://questdb.com/docs/getting-started/web-console/import-csv/#accessing-the-import-interface)
* [Import Process](https://questdb.com/docs/getting-started/web-console/import-csv/#import-process)
* [Upload Queue](https://questdb.com/docs/getting-started/web-console/import-csv/#upload-queue)
* [Configuration Options](https://questdb.com/docs/getting-started/web-console/import-csv/#configuration-options)
* [Table Schema Configuration](https://questdb.com/docs/getting-started/web-console/import-csv/#table-schema-configuration)
* [For Existing Tables](https://questdb.com/docs/getting-started/web-console/import-csv/#for-existing-tables)
* [For New Tables](https://questdb.com/docs/getting-started/web-console/import-csv/#for-new-tables)
* [Import Settings](https://questdb.com/docs/getting-started/web-console/import-csv/#import-settings)
* [Import Results and Details](https://questdb.com/docs/getting-started/web-console/import-csv/#import-results-and-details)
* [Status Display](https://questdb.com/docs/getting-started/web-console/import-csv/#status-display)
* [Details Panel](https://questdb.com/docs/getting-started/web-console/import-csv/#details-panel)
---
# Databento | QuestDB
On this page
[Databento](https://questdb.com/docs/integrations/other/databento/)
is a market data aggregator that provides a single, normalized feed covering multiple venues, simplifying the process of ingesting live market data. It interfaces well with QuestDB for real-time data analysis and visualization in Grafana.
This guide will show how to ingest live market data from [Databento](https://questdb.com/docs/integrations/other/databento/)
into QuestDB and visualize it using Grafana.
For a deeper dive, see our [Databento & QuestDB blog](https://questdb.com/blog/ingesting-live-market-data-data-bento/)
.
Prerequisites[](https://questdb.com/docs/integrations/other/databento/#prerequisites "Direct link to Prerequisites")
----------------------------------------------------------------------------------------------------------------------
* [QuestDB](https://questdb.com/download/)
* [Databento Python client](https://pypi.org/project/databento/)
* [QuestDB Python client](https://questdb.com/docs/ingestion/clients/python/)
* [Grafana](https://questdb.com/docs/integrations/visualization/grafana/)
(Optional)
Install the required Python libraries:
pip3 install questdbpip3 install databento
Ingest Data from Databento into QuestDB[](https://questdb.com/docs/integrations/other/databento/#ingest-data-from-databento-into-questdb "Direct link to Ingest Data from Databento into QuestDB")
----------------------------------------------------------------------------------------------------------------------------------------------------------------------------------------------------
### Create Databento Client[](https://questdb.com/docs/integrations/other/databento/#create-databento-client "Direct link to Create Databento Client")
Set up a Databento client with your API key:
import databento as dbdb_client = db.Live(key="YOUR_API_KEY")
### Subscribe to Market Data[](https://questdb.com/docs/integrations/other/databento/#subscribe-to-market-data "Direct link to Subscribe to Market Data")
Subscribe to a data feed, such as the CME S&P 500 E-Mini futures:
db_client.subscribe(dataset="GLBX.MDP3",schema="mbp-1",stype_in="raw_symbol",symbols="ESM4")
### Ingest Data into QuestDB[](https://questdb.com/docs/integrations/other/databento/#ingest-data-into-questdb "Direct link to Ingest Data into QuestDB")
Ingest the data into QuestDB using the Sender class:
from questdb.ingress import Senderimport numpy as npquestdb_conf = "http::addr=localhost:9000;username=admin;password=quest;"with Sender.from_conf(questdb_conf) as sender:sender.row('top_of_book',symbols={'instrument': 'ESM4'},columns={'bid_size': record.levels[0].bid_sz,'bid': record.levels[0].bid_px*0.000000001,'ask': record.levels[0].ask_px*0.000000001,'ask_size': record.levels[0].ask_sz},at=np.datetime64(record.ts_event, 'ns').astype('datetime64[ms]').astype(object))sender.flush()
Query QuestDB[](https://questdb.com/docs/integrations/other/databento/#query-questdb "Direct link to Query QuestDB")
----------------------------------------------------------------------------------------------------------------------
Now that data is flowing, you can visit QuestDB at `http://localhost:9000` to try some queries.
Read our [SQL Overview](https://questdb.com/docs/query/overview/)
to learn more about the power and depth of querying.
Visualize in Grafana[](https://questdb.com/docs/integrations/other/databento/#visualize-in-grafana "Direct link to Visualize in Grafana")
-------------------------------------------------------------------------------------------------------------------------------------------
After ingesting the data, you can visualize it in Grafana by creating a dashboard with SQL queries such as:
SELECT timestamp, instrument, bid, askFROM top_of_bookWHERE $\_\_timeFilter(timestamp) AND instrument = $symbol
For more detailed analysis, create multiple charts using Grafana's variable and repeat options.
To learn the basics of QuestDB and Grafana, see [our blog](https://questdb.com/blog/time-series-monitoring-dashboard-grafana-questdb/)
.
You can substitute the demonstration queries with your own!
Summary[](https://questdb.com/docs/integrations/other/databento/#summary "Direct link to Summary")
----------------------------------------------------------------------------------------------------
In this guide, we set up a pipeline to ingest live market data from Databento into QuestDB and optionally created a visualization using Grafana. This setup allows you to build powerful dashboards and analyze market data efficiently.
For more information, check out [Databento’s documentation](https://databento.com/docs/)
.
* [Prerequisites](https://questdb.com/docs/integrations/other/databento/#prerequisites)
* [Ingest Data from Databento into QuestDB](https://questdb.com/docs/integrations/other/databento/#ingest-data-from-databento-into-questdb)
* [Create Databento Client](https://questdb.com/docs/integrations/other/databento/#create-databento-client)
* [Subscribe to Market Data](https://questdb.com/docs/integrations/other/databento/#subscribe-to-market-data)
* [Ingest Data into QuestDB](https://questdb.com/docs/integrations/other/databento/#ingest-data-into-questdb)
* [Query QuestDB](https://questdb.com/docs/integrations/other/databento/#query-questdb)
* [Visualize in Grafana](https://questdb.com/docs/integrations/other/databento/#visualize-in-grafana)
* [Summary](https://questdb.com/docs/integrations/other/databento/#summary)
---
# Web Console Overview | QuestDB
On this page
Web Console is a client that allows you to interact with QuestDB. It provides UI tools to query and explore the data, visualize the results in a table or plot.
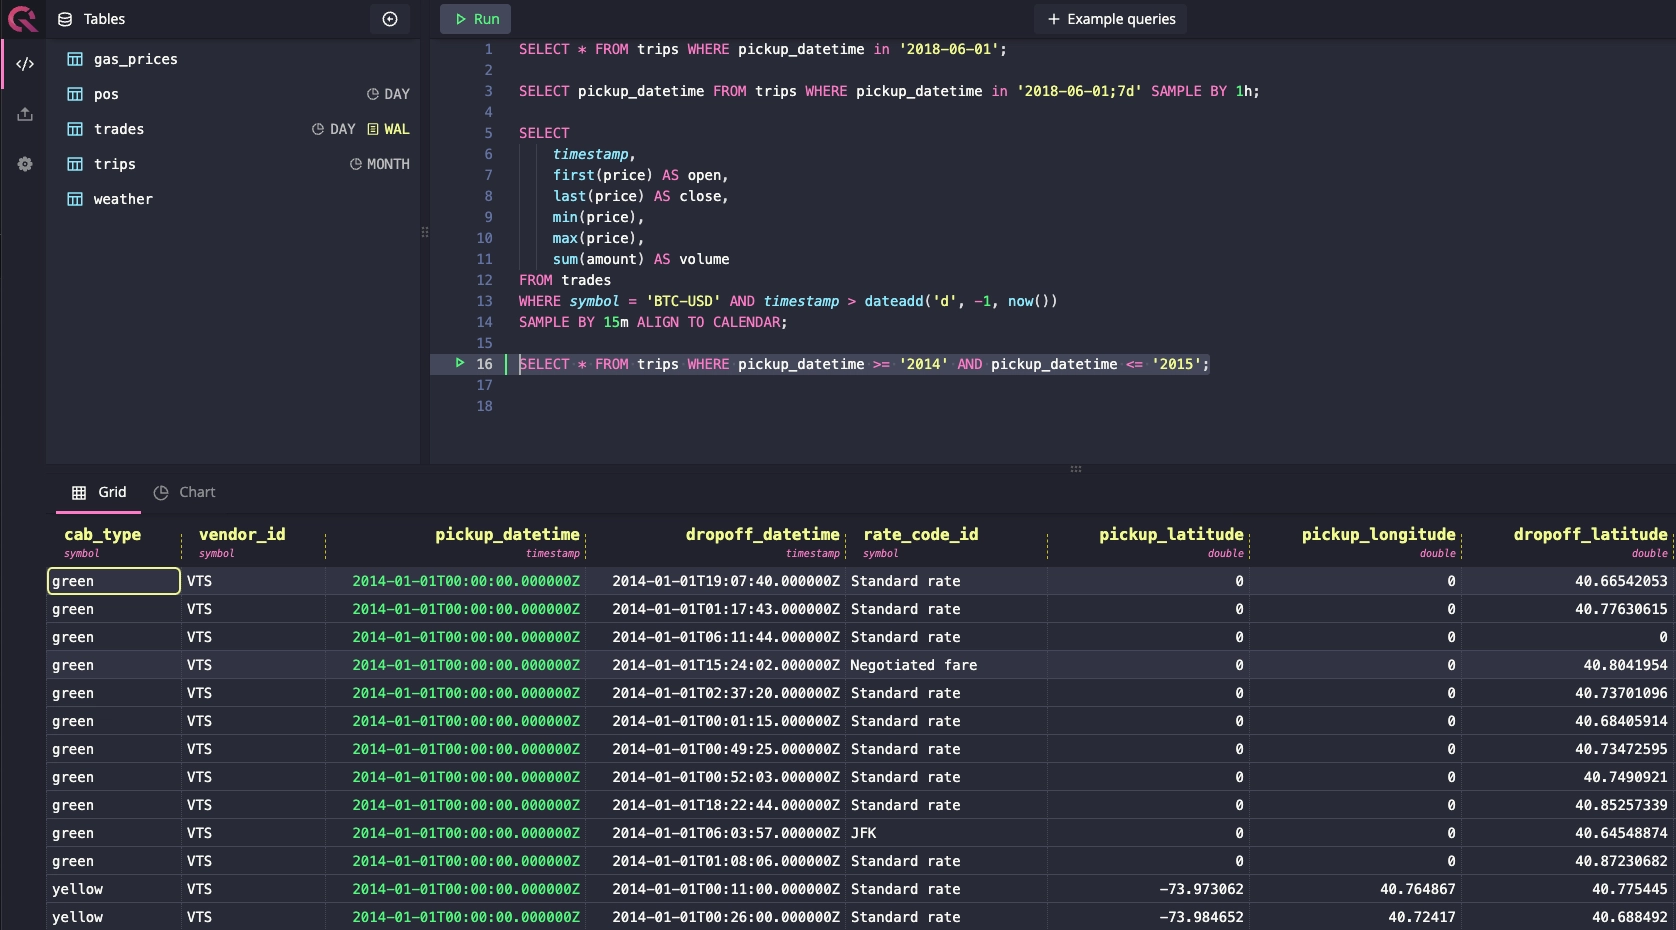
### Accessing the Web Console[](https://questdb.com/docs/getting-started/web-console/overview/#accessing-the-web-console "Direct link to Accessing the Web Console")
Web Console will be available at `http://[server-address]:9000`. When running locally, this will be `http://localhost:9000`.
### Layout[](https://questdb.com/docs/getting-started/web-console/overview/#layout "Direct link to Layout")
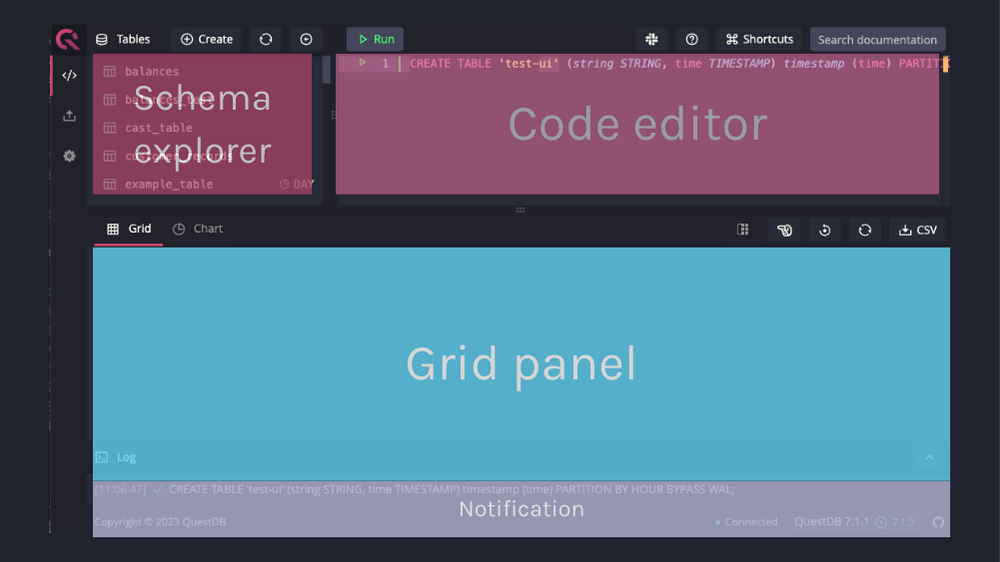
The Web Console is organized into the following main sections that work together to provide a complete workflow:
### Code Editor[](https://questdb.com/docs/getting-started/web-console/overview/#code-editor "Direct link to Code Editor")
The **Code Editor** is where you write and execute SQL queries with features like syntax highlighting, auto-completion, and error tracing. It supports executing queries by selection, multiple query execution, and query planning.
[Learn more about Code Editor →](https://questdb.com/docs/getting-started/web-console/code-editor/)
### AI Assistant[](https://questdb.com/docs/getting-started/web-console/overview/#ai-assistant "Direct link to AI Assistant")
The **AI Assistant** provides intelligent query assistance directly in the Web Console using AI-powered explanations and suggestions. It helps you write, understand, and fix SQL queries while maintaining complete control over your data and API keys through a Bring Your Own Key (BYOK) model.
[Learn more about AI Assistant →](https://questdb.com/docs/getting-started/web-console/questdb-ai/)
### Metrics View[](https://questdb.com/docs/getting-started/web-console/overview/#metrics-view "Direct link to Metrics View")
The **Metrics View** provides real-time monitoring and telemetry capabilities for your QuestDB instance. It displays interactive charts and widgets to track database performance, WAL operations, and table-specific metrics.
[Learn more about Metrics View →](https://questdb.com/docs/getting-started/web-console/metrics-view/)
### Schema Explorer[](https://questdb.com/docs/getting-started/web-console/overview/#schema-explorer "Direct link to Schema Explorer")
The **Schema Explorer** is the navigation hub for exploring tables and materialized views. It provides detailed information about each database object including columns with data types, storage configuration (partitioning and WAL status), and for materialized views, their base tables.
[Learn more about Schema Explorer →](https://questdb.com/docs/getting-started/web-console/schema-explorer/)
### Result Grid[](https://questdb.com/docs/getting-started/web-console/overview/#result-grid "Direct link to Result Grid")
The **Result Grid** displays your query results in an interactive table format with features for data navigation, export, and visualization.
[Learn more about Result Grid →](https://questdb.com/docs/getting-started/web-console/result-grid/)
### Query Log[](https://questdb.com/docs/getting-started/web-console/overview/#query-log "Direct link to Query Log")
The **Query Log** monitors query execution status and performance metrics, providing real-time feedback and maintaining a history of recent operations. It shows execution times, row counts, and detailed error information to help optimize your queries.
[Learn more about Query Log →](https://questdb.com/docs/getting-started/web-console/query-log/)
### Import CSV[](https://questdb.com/docs/getting-started/web-console/overview/#import-csv "Direct link to Import CSV")
The **Import CSV** interface allows you to upload and import CSV files into QuestDB with automatic schema detection, flexible configuration options, and detailed progress tracking. You can create new tables or append to existing ones with full control over the import process.
[Learn more about Import CSV →](https://questdb.com/docs/getting-started/web-console/import-csv/)
### Right Sidebar[](https://questdb.com/docs/getting-started/web-console/overview/#right-sidebar "Direct link to Right Sidebar")
The **Right Sidebar** provides quick access to essential tools and information:
* **Help**: Access quick links and contact options through a convenient help menu
* **QuestDB News**: Stay up-to-date with the latest QuestDB announcements and updates
* **Create Table**: Build new tables visually using an intuitive interface. Define table structure, configure partitioning, enable WAL, and add columns with their data types—all without writing SQL code. [Learn more about Create Table →](https://questdb.com/docs/getting-started/web-console/create-table/)
### Instance Naming[](https://questdb.com/docs/getting-started/web-console/overview/#instance-naming "Direct link to Instance Naming")
Web Console allows you to set the instance name, type, and color. This functionality is particularly useful for production users who manage multiple deployments and frequently navigate between them. This feature makes it easier to keep track of instance information and label instances with meaningful names for their users.
The instance name, instance type, and description are displayed when hovering over the icon in the instance information badge.
Instance information can be modified through the dialog that opens when clicking the edit icon:
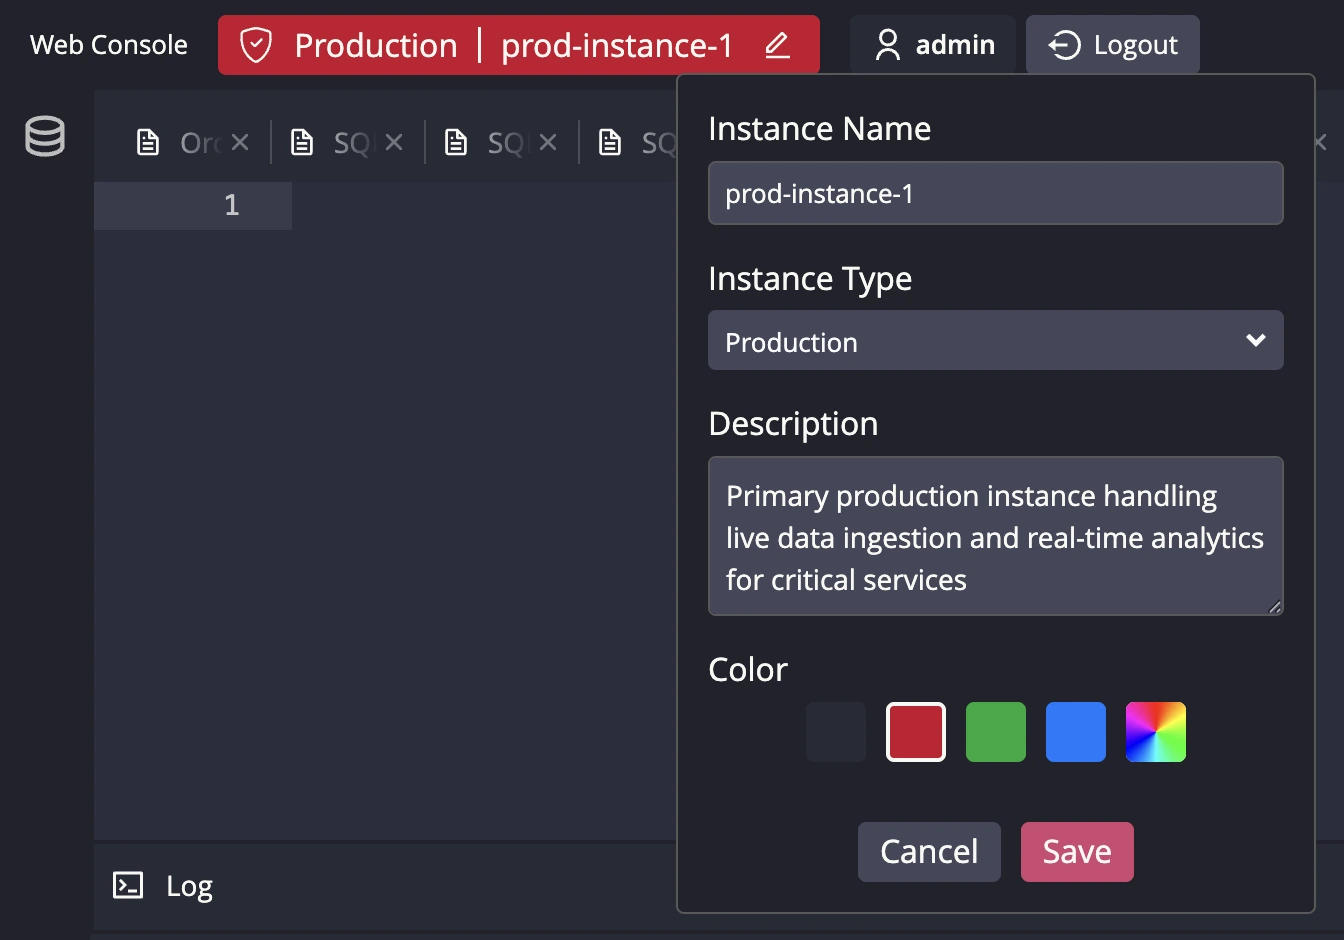
info
If `http.settings.readonly` configuration is set to true, instance information is not editable.
info
When using QuestDB Enterprise with Role-Based Access Control (RBAC), only the users with `SETTINGS` or `DATABASE ADMIN` permission can edit the instance information. See [Database Permissions](https://questdb.com/docs/security/rbac/#database-permissions)
for more details.
* [Accessing the Web Console](https://questdb.com/docs/getting-started/web-console/overview/#accessing-the-web-console)
* [Layout](https://questdb.com/docs/getting-started/web-console/overview/#layout)
* [Code Editor](https://questdb.com/docs/getting-started/web-console/overview/#code-editor)
* [AI Assistant](https://questdb.com/docs/getting-started/web-console/overview/#ai-assistant)
* [Metrics View](https://questdb.com/docs/getting-started/web-console/overview/#metrics-view)
* [Schema Explorer](https://questdb.com/docs/getting-started/web-console/overview/#schema-explorer)
* [Result Grid](https://questdb.com/docs/getting-started/web-console/overview/#result-grid)
* [Query Log](https://questdb.com/docs/getting-started/web-console/overview/#query-log)
* [Import CSV](https://questdb.com/docs/getting-started/web-console/overview/#import-csv)
* [Right Sidebar](https://questdb.com/docs/getting-started/web-console/overview/#right-sidebar)
* [Instance Naming](https://questdb.com/docs/getting-started/web-console/overview/#instance-naming)
---
# Query Log | QuestDB
On this page
The **Query Log** displays execution status, performance metrics, and detailed information about your query operations in the bottom panel of the Web Console. It provides real-time feedback on query execution and maintains a history of operations for each tab.
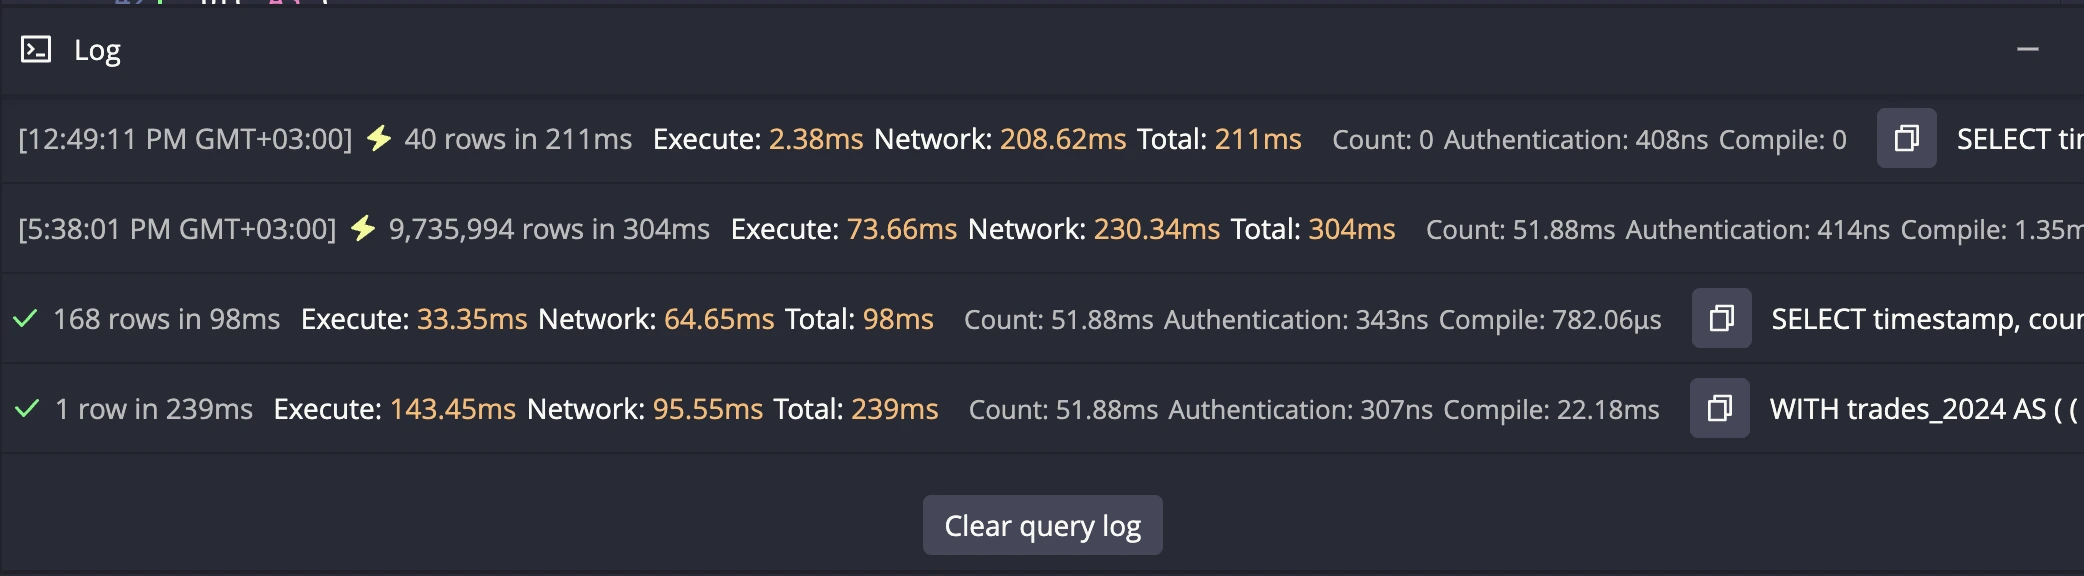
Expansion and Collapse[](https://questdb.com/docs/getting-started/web-console/query-log/#expansion-and-collapse "Direct link to Expansion and Collapse")
----------------------------------------------------------------------------------------------------------------------------------------------------------
The Query Log can be toggled between two display modes:
### Collapsed Mode (Default)[](https://questdb.com/docs/getting-started/web-console/query-log/#collapsed-mode-default "Direct link to Collapsed Mode (Default)")
* Shows the status for the [query in cursor](https://questdb.com/docs/getting-started/web-console/query-log/#active-item-and-cursor-position)
* Displays as a compact single-line summary
### Expanded Mode[](https://questdb.com/docs/getting-started/web-console/query-log/#expanded-mode "Direct link to Expanded Mode")
* Shows the complete history of executed queries for the current tab
* Displays detailed execution information for each query
* Provides access to the "Clear query log" button
Click the button in the top-right corner to switch between modes.
Active Item and Cursor Position[](https://questdb.com/docs/getting-started/web-console/query-log/#active-item-and-cursor-position "Direct link to Active Item and Cursor Position")
-------------------------------------------------------------------------------------------------------------------------------------------------------------------------------------
The Query Log is dynamically connected to your editor cursor position:
* **Active Query**: The highlighted query in the log changes based on where your cursor is positioned in the editor
* **Error Markers**: Error indicators in the editor are synchronized with the query log entries
* **Status Updates**: Moving your cursor between different queries automatically updates the active notification
This integration ensures that the Query Log always shows relevant information for the query you're currently working on, making debugging and performance analysis more efficient.
Execution Details[](https://questdb.com/docs/getting-started/web-console/query-log/#execution-details "Direct link to Execution Details")
-------------------------------------------------------------------------------------------------------------------------------------------
The Query Log provides comprehensive performance metrics for each executed query:
* **Row Count**: Number of rows returned by SELECT queries
* **Execution Time**: Time spent by QuestDB processing your query
* **Network Time**: Time spent transferring data between client and server
* **Total Time**: Complete end-to-end time from query submission to result display
**Example**: `9,735,994 rows in 304ms Execute: 73.66ms Network: 230.34ms Total: 304ms`
Additional timing details include:
* **Count**: Time spent counting rows
* **Authentication**: Time spent on authentication
* **Compile**: Time spent compiling the query
Copy Query Text[](https://questdb.com/docs/getting-started/web-console/query-log/#copy-query-text "Direct link to Copy Query Text")
-------------------------------------------------------------------------------------------------------------------------------------
Each query log entry includes a copy button that allows you to copy the executed SQL query text to your clipboard.
Clear Query Log[](https://questdb.com/docs/getting-started/web-console/query-log/#clear-query-log "Direct link to Clear Query Log")
-------------------------------------------------------------------------------------------------------------------------------------
The "Clear query log" button removes all query execution history for the current tab. This action:
* Removes all notifications and execution history
* Clears error markers from the editor
* Operates **per tab** - each tab maintains its own independent query log
* [Expansion and Collapse](https://questdb.com/docs/getting-started/web-console/query-log/#expansion-and-collapse)
* [Collapsed Mode (Default)](https://questdb.com/docs/getting-started/web-console/query-log/#collapsed-mode-default)
* [Expanded Mode](https://questdb.com/docs/getting-started/web-console/query-log/#expanded-mode)
* [Active Item and Cursor Position](https://questdb.com/docs/getting-started/web-console/query-log/#active-item-and-cursor-position)
* [Execution Details](https://questdb.com/docs/getting-started/web-console/query-log/#execution-details)
* [Copy Query Text](https://questdb.com/docs/getting-started/web-console/query-log/#copy-query-text)
* [Clear Query Log](https://questdb.com/docs/getting-started/web-console/query-log/#clear-query-log)
---
# Schema Explorer | QuestDB
On this page
The **Schema Explorer** is the navigation panel on the left side of the Web Console that helps you browse and understand your database structure. It provides a hierarchical view of all tables and materialized views with detailed information about their columns, data types, storage configuration, and relationships.
You can toggle the Schema Explorer by using the database icon on the left.

Tree View[](https://questdb.com/docs/getting-started/web-console/schema-explorer/#tree-view "Direct link to Tree View")
-------------------------------------------------------------------------------------------------------------------------
The Schema Explorer displays database objects in an expandable tree structure. When you expand a table or materialized view, the following information is available:
### Folders[](https://questdb.com/docs/getting-started/web-console/schema-explorer/#folders "Direct link to Folders")
#### Columns[](https://questdb.com/docs/getting-started/web-console/schema-explorer/#columns "Direct link to Columns")
All table columns are displayed with their names and data types, each represented by type-specific icons:
* **Designated Timestamp**: The designated timestamp column is highlighted with a distinctive green-colored icon
* **Symbol Columns**: Distinguished by tag icons, these can be further expanded to reveal:
* **Indexed**: Indicates whether the symbol column has an index for faster filtering
* **Symbol Capacity**: The maximum number of distinct symbols that can be stored (e.g., 256)
* **Cached**: Shows whether symbol values are cached in memory for improved performance
#### Storage Details[](https://questdb.com/docs/getting-started/web-console/schema-explorer/#storage-details "Direct link to Storage Details")
* **Partitioning**: Displays the table's partitioning approach (e.g., "By day", "By week", "None")
* **WAL**: Indicates whether Write-Ahead Log is enabled or disabled for the table
tip
Table and materialized view icons visually indicate key storage details such as partitioning and WAL status. Hover over these icons to see detailed information including partitioning strategy, ordering configuration, and WAL status, allowing you to quickly assess critical storage details without expanding the full table structure.
#### Base Tables[](https://questdb.com/docs/getting-started/web-console/schema-explorer/#base-tables "Direct link to Base Tables")
For materialized views, shows the underlying source tables
### Context Menu[](https://questdb.com/docs/getting-started/web-console/schema-explorer/#context-menu "Direct link to Context Menu")
Right-clicking on any table or materialized view opens a context menu with the following actions:
* **Copy schema**: Copies the schema of the table to the clipboard
* **Resume WAL**: If WAL is suspended for a table, a warning icon is shown to the right of the table name. You can resume WAL from a specific transaction number by clicking on the context menu item.
info
When a materialized view is invalid, a warning icon is shown to the right of the materialized view name. You can see the invalidation reason by hovering over the icon.
### Keyboard Navigation[](https://questdb.com/docs/getting-started/web-console/schema-explorer/#keyboard-navigation "Direct link to Keyboard Navigation")
You can navigate in the tree view using arrow keys, Home, End, Page Up, and Page Down.
Toolbar[](https://questdb.com/docs/getting-started/web-console/schema-explorer/#toolbar "Direct link to Toolbar")
-------------------------------------------------------------------------------------------------------------------
The toolbar provides essential actions for filtering, managing, and interacting with your database objects.

### Filter[](https://questdb.com/docs/getting-started/web-console/schema-explorer/#filter "Direct link to Filter")
Type to filter tables and materialized views by name.
### Suspended Tables[](https://questdb.com/docs/getting-started/web-console/schema-explorer/#suspended-tables "Direct link to Suspended Tables")
When tables have suspended WAL operations, an error icon with a count of suspended tables appears. Click to filter and show only suspended tables.
### Table Management Actions[](https://questdb.com/docs/getting-started/web-console/schema-explorer/#table-management-actions "Direct link to Table Management Actions")
* **Add Metrics**: Chart icon button to add metrics for monitoring database performance. See [Metrics View](https://questdb.com/docs/getting-started/web-console/metrics-view/)
for details.
* **Select Mode**: Checkbox circle icon to enter table selection mode for copying multiple schemas to the clipboard.
* **Auto Refresh**: Refresh icon to toggle automatic updates of the schema explorer when database structure changes. Disabling auto refresh is recommended only for development purposes.
* [Tree View](https://questdb.com/docs/getting-started/web-console/schema-explorer/#tree-view)
* [Folders](https://questdb.com/docs/getting-started/web-console/schema-explorer/#folders)
* [Context Menu](https://questdb.com/docs/getting-started/web-console/schema-explorer/#context-menu)
* [Keyboard Navigation](https://questdb.com/docs/getting-started/web-console/schema-explorer/#keyboard-navigation)
* [Toolbar](https://questdb.com/docs/getting-started/web-console/schema-explorer/#toolbar)
* [Filter](https://questdb.com/docs/getting-started/web-console/schema-explorer/#filter)
* [Suspended Tables](https://questdb.com/docs/getting-started/web-console/schema-explorer/#suspended-tables)
* [Table Management Actions](https://questdb.com/docs/getting-started/web-console/schema-explorer/#table-management-actions)
---
# QuestDB AI | QuestDB
On this page
The **QuestDB AI Assistant** provides intelligent query assistance directly within the Web Console. You can generate, explain, and fix SQL queries, and ask questions about your schema and QuestDB using models from OpenAI and Anthropic, all while maintaining complete control over your data and API keys.
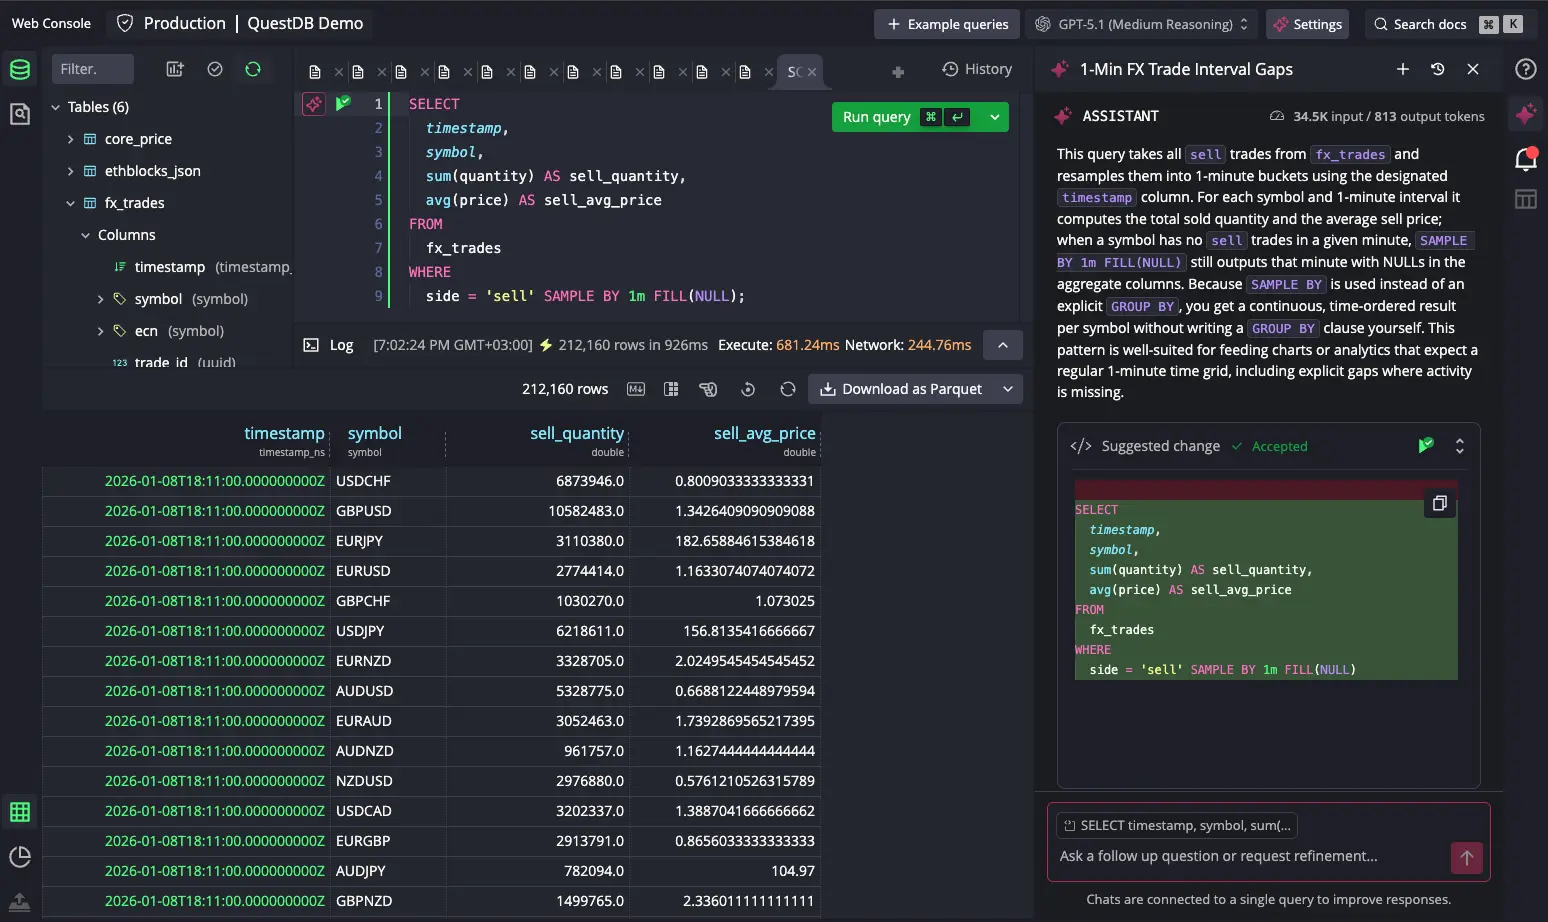
Configuration[](https://questdb.com/docs/getting-started/web-console/questdb-ai/#configuration "Direct link to Configuration")
--------------------------------------------------------------------------------------------------------------------------------
Before using the AI Assistant, you need to configure at least one AI provider with your own API key.
Additional providers will be available in future releases.
### Adding a model provider[](https://questdb.com/docs/getting-started/web-console/questdb-ai/#adding-a-model-provider "Direct link to Adding a model provider")
The AI Assistant follows a Bring Your Own Key (BYOK) model for security and privacy. Currently, **OpenAI** and **Anthropic** models are available:
To add a model provider:
1. Click the **Configure** button in the top bar
2. Select your preferred AI provider
3. Enter your API key from the provider's platform:
* [OpenAI Platform](https://platform.openai.com/api-keys)
* [Anthropic Console](https://console.anthropic.com/settings/keys)
4. Click **Next** to validate your key
info
Your API keys are stored only in your browser's local storage and are never transmitted to QuestDB servers. They are sent directly to your chosen AI provider when making requests.
### Setting up model preferences[](https://questdb.com/docs/getting-started/web-console/questdb-ai/#setting-up-model-preferences "Direct link to Setting up model preferences")
After validating your API key, you can configure the provider settings:
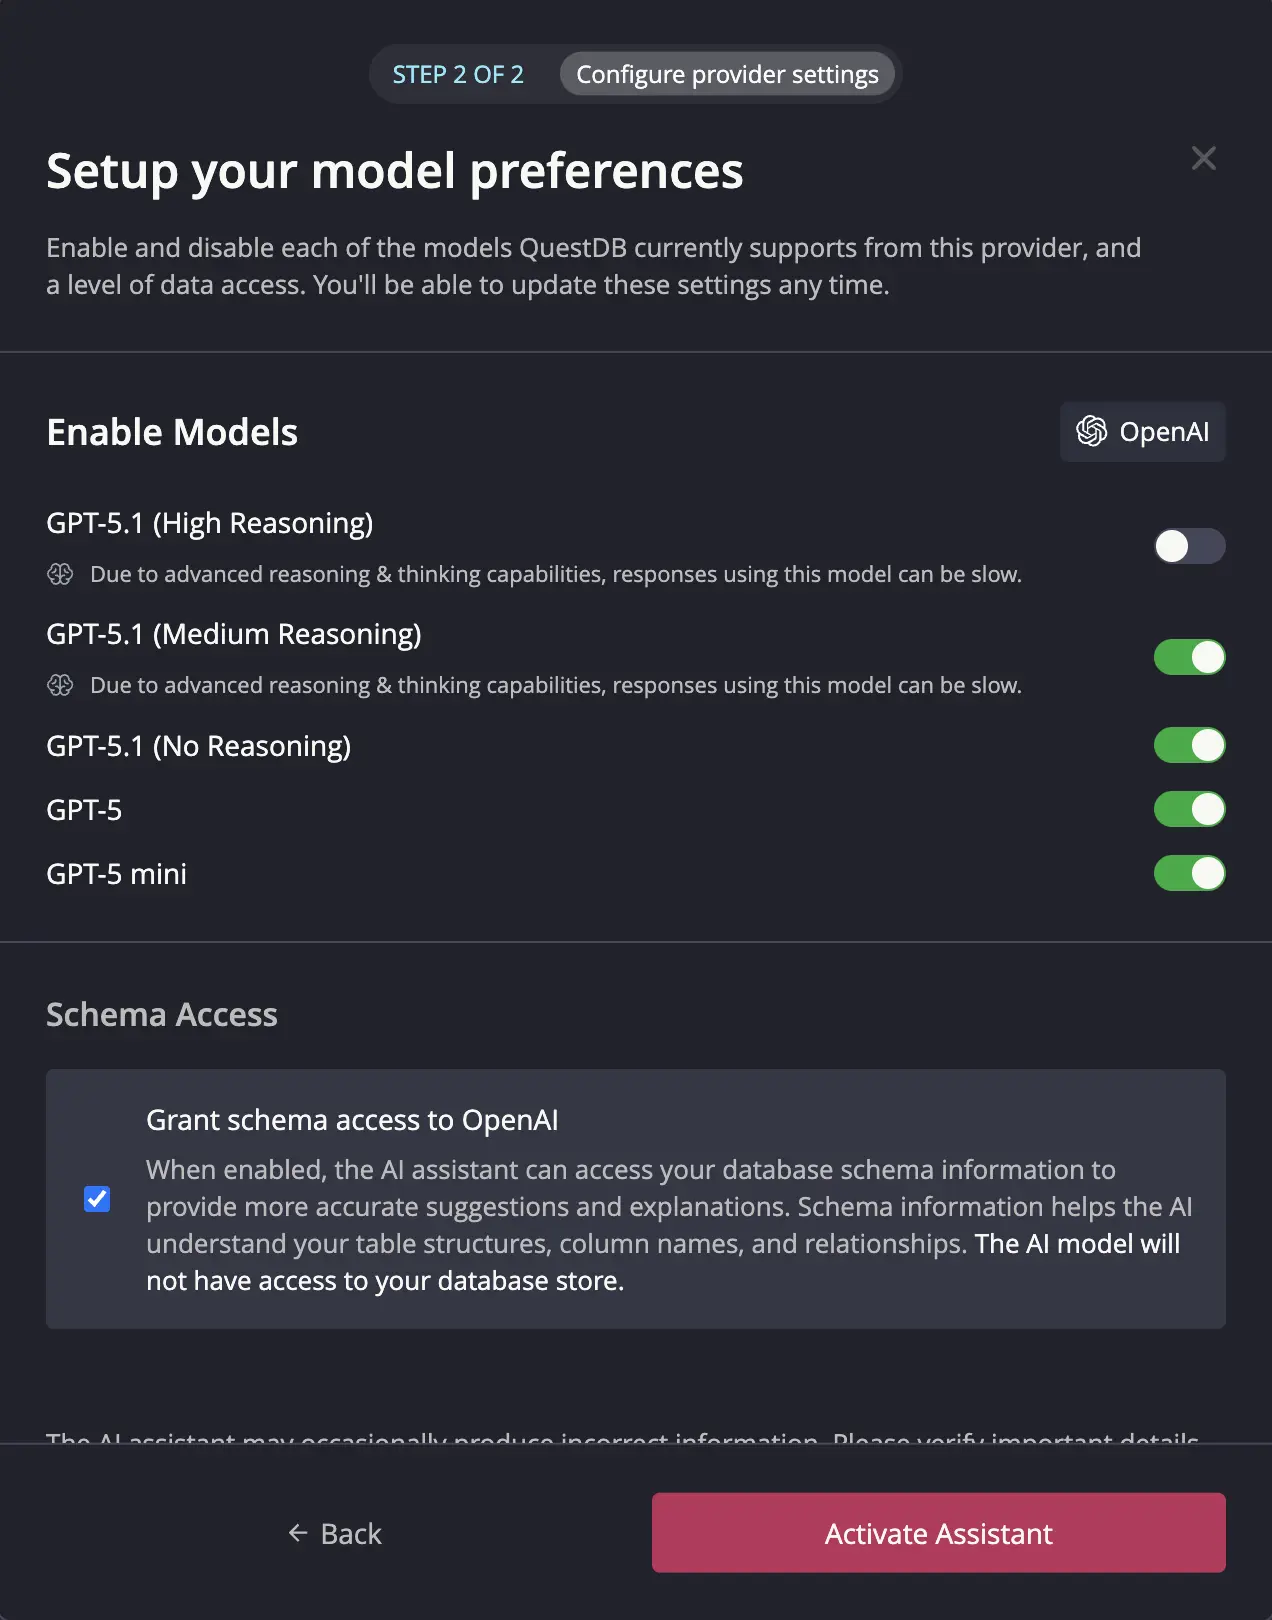
* Enable individual models based on your needs. You can switch between enabled models at any time after setup.
* Grant or revoke schema access to the AI Assistant.
info
Schema access only provides table structure information to the AI. Your actual data records are never sent to AI providers. Granting schema access helps the AI Assistant generate more accurate queries.
### Settings[](https://questdb.com/docs/getting-started/web-console/questdb-ai/#settings "Direct link to Settings")
After initial setup, you can modify settings or remove API keys using the **Settings** button in the top bar.
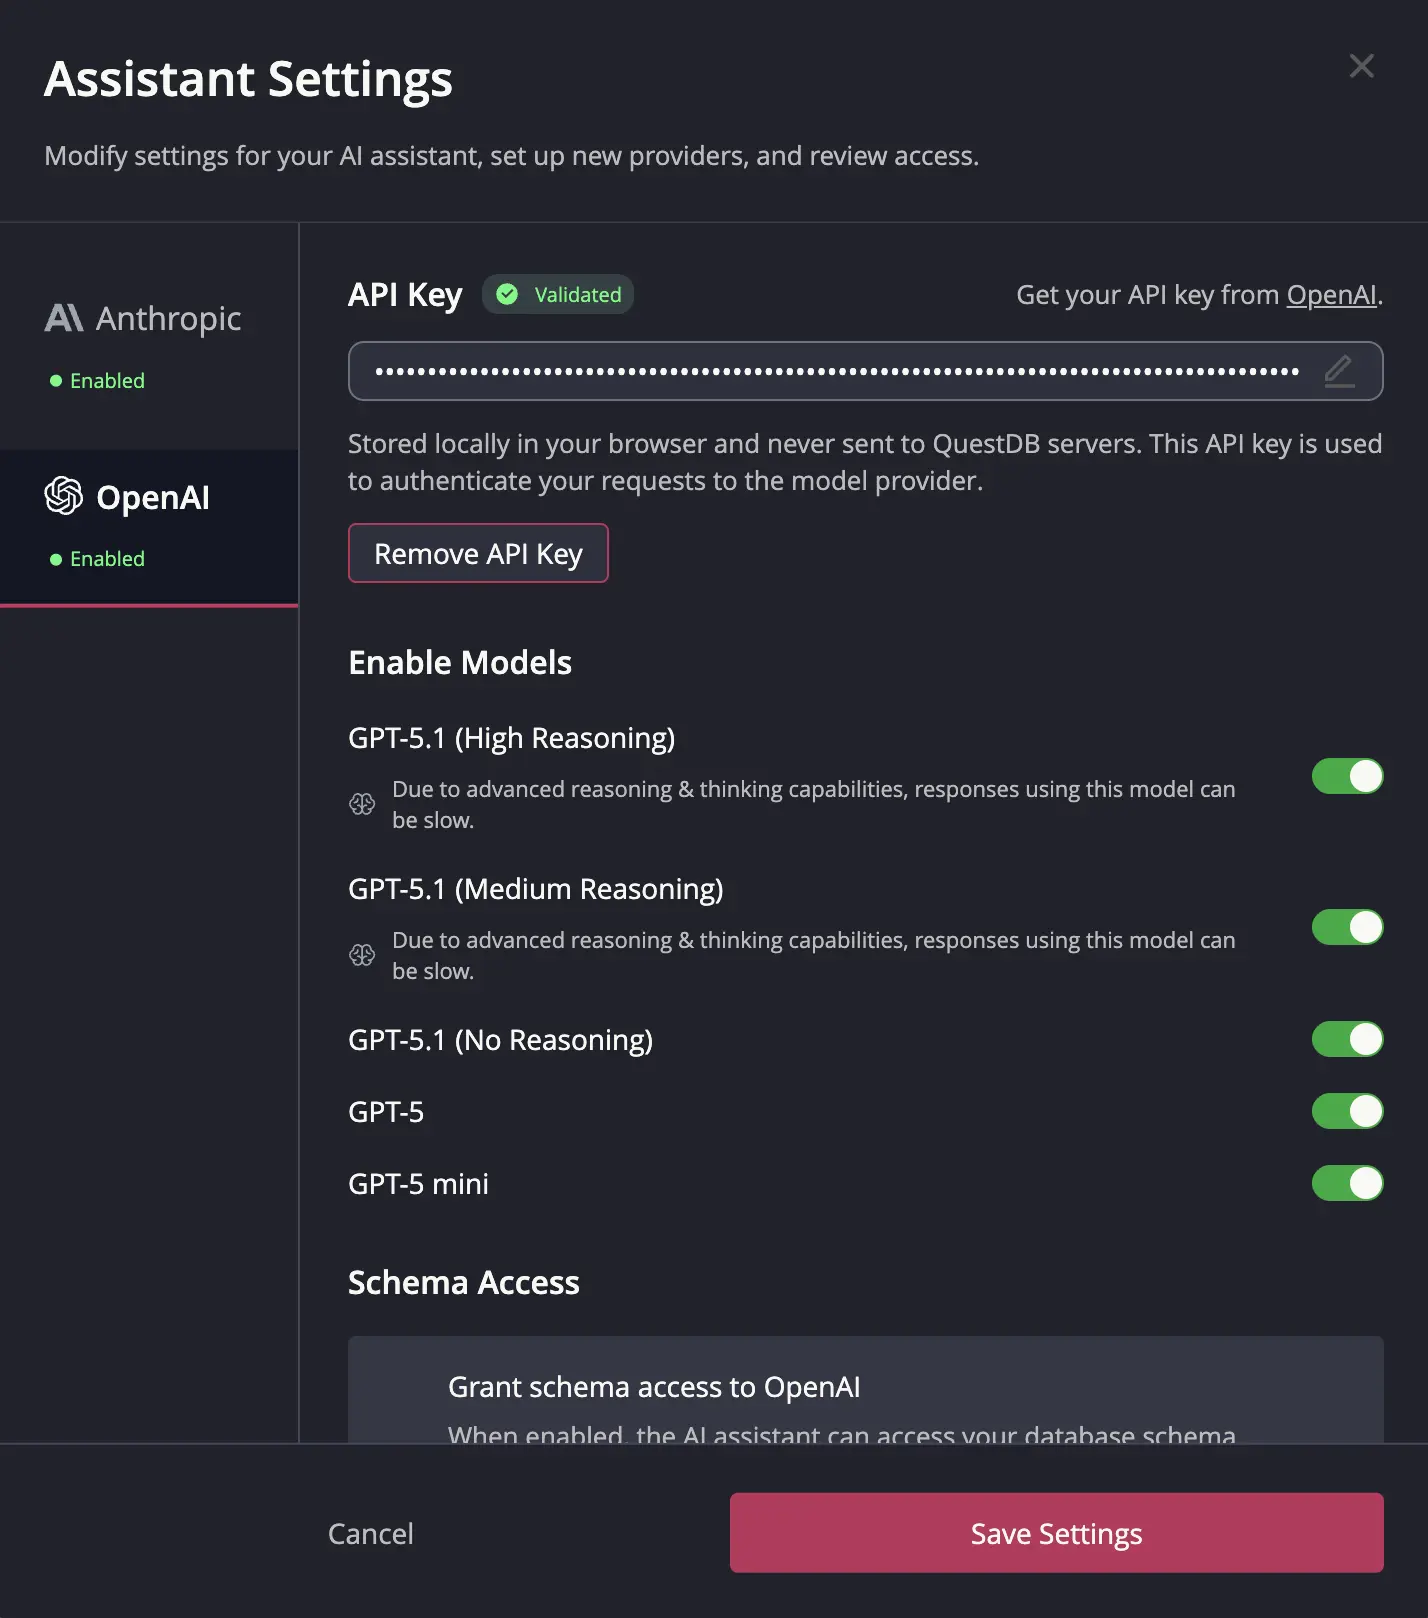
Chat Window[](https://questdb.com/docs/getting-started/web-console/questdb-ai/#chat-window "Direct link to Chat Window")
--------------------------------------------------------------------------------------------------------------------------
The Chat Window is the primary interface for interacting with the AI Assistant.
### Opening the Chat[](https://questdb.com/docs/getting-started/web-console/questdb-ai/#opening-the-chat "Direct link to Opening the Chat")
Access the AI Assistant through multiple methods:
* Clicking the AI icon in the right sidebar opens the latest chat
* Clicking the AI icon next to a query in the Code Editor opens a chat for that query. **An icon with a border indicates an existing chat for the query.**
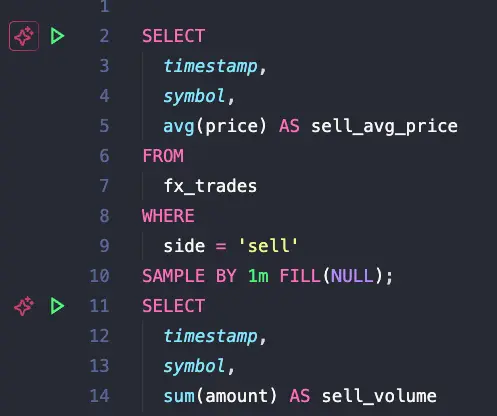
* Clicking **Explain schema with AI** in the table context menu opens a chat with a schema explanation for the selected table, materialized view, or view.
### Chat Interface[](https://questdb.com/docs/getting-started/web-console/questdb-ai/#chat-interface "Direct link to Chat Interface")
The chat window provides a complete conversation interface:
* **Header**: Shows the conversation name with action buttons
* **Messages**: Displays the conversation between you and the AI
* **Input Area**: Text area for submitting your questions, with a context badge showing the connected entity
info
Chats are connected to a single query to improve response accuracy. The context badge in the input area shows which query or table the conversation is focused on. You can click on the context badge to see the related query in the editor.
### Managing Conversations[](https://questdb.com/docs/getting-started/web-console/questdb-ai/#managing-conversations "Direct link to Managing Conversations")
* **Create a new chat**: Click the **+** button in the chat header
* **View chat history**: Click the history icon in the chat header to see all past chats
Chats are displayed in a timeline. You can:
* **Rename a chat**: Click the edit icon next to a conversation name
* **Delete a chat**: Click the delete icon next to a conversation
* **Search chats**: Use the text input to search conversations by name
### Quick Actions[](https://questdb.com/docs/getting-started/web-console/questdb-ai/#quick-actions "Direct link to Quick Actions")
When opening a chat for a query with no conversation history, quick actions are available:
* **Explain Query**: Provides an explanation of the query logic
* **Fix Query**: Appears when a query has an execution error. The AI Assistant analyzes the error and suggests a corrected version.
### SQL Suggestions[](https://questdb.com/docs/getting-started/web-console/questdb-ai/#sql-suggestions "Direct link to SQL Suggestions")
The AI Assistant can provide query suggestions when you prompt it to generate, refine, or fix a query. A diff editor is shown when a query is suggested:
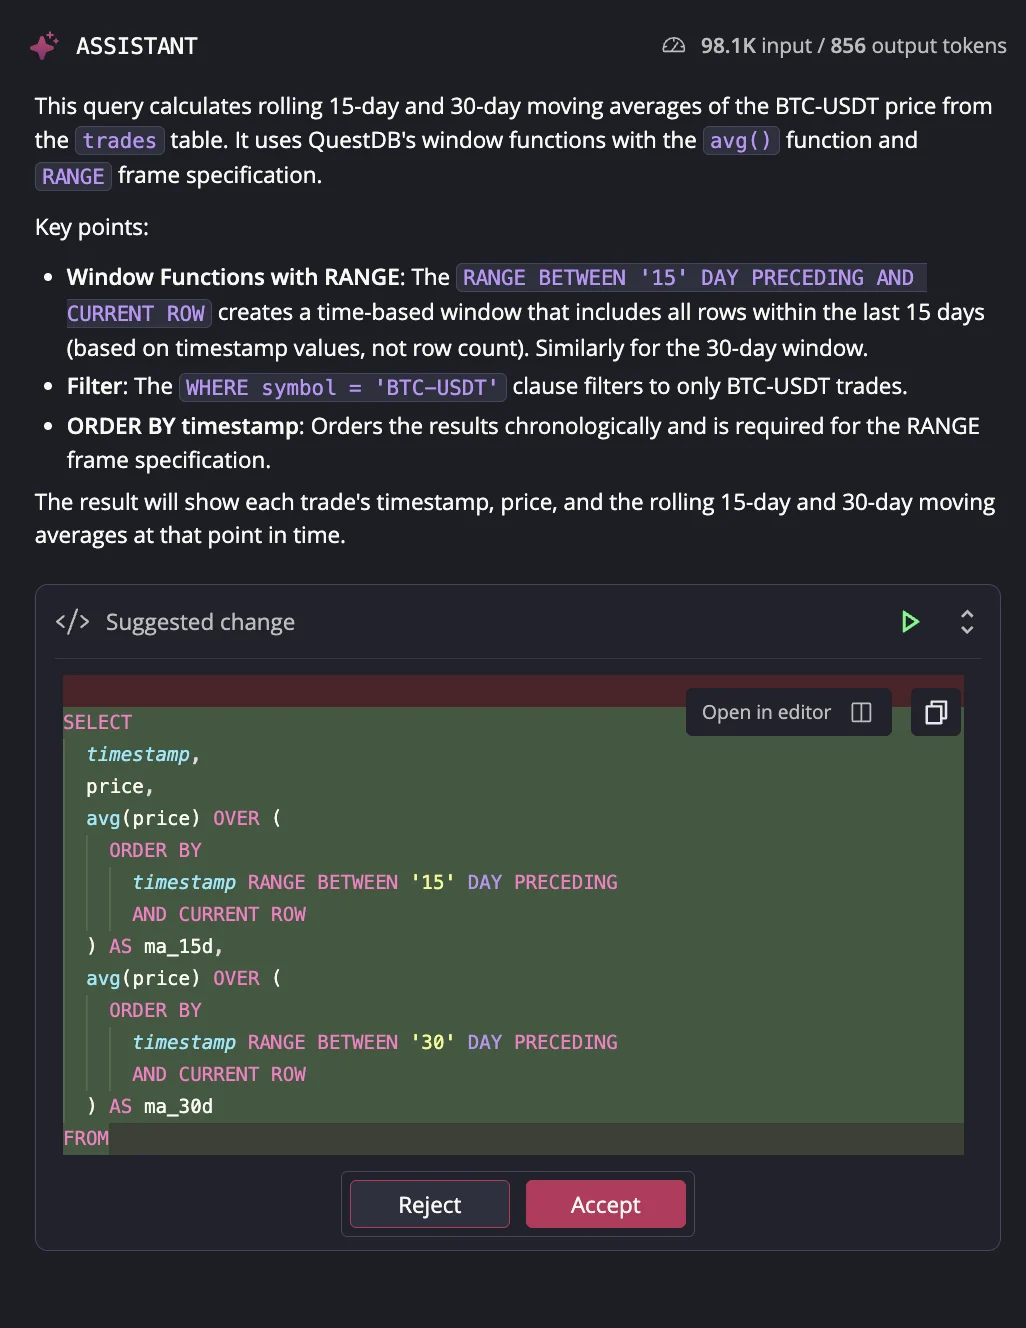
The diff editor provides several actions:
* **Run**: Execute the suggested query using the Run icon in the header
* **Accept**: Apply the suggestion and mark it as accepted. The AI Assistant uses accepted queries as the basis for future suggestions.
* **Reject**: Reject the suggestion and notify the model
* **Apply to Editor**: Insert the suggestion into your editor. Available for all queries in the history.
* **Open in editor**: Expand the diff view to a full editor tab where you can accept or reject the suggestion
### Status Indicators[](https://questdb.com/docs/getting-started/web-console/questdb-ai/#status-indicators "Direct link to Status Indicators")
The AI Assistant shows its reasoning process in expandable sections. You can investigate the reviewed documentation and tables by expanding individual status indicators.
### Aborting Generation[](https://questdb.com/docs/getting-started/web-console/questdb-ai/#aborting-generation "Direct link to Aborting Generation")
Click the red stop button during AI operations to cancel the current response. The conversation and message history are preserved, and you can continue the conversation or start a new operation.
Tips for using the AI Assistant[](https://questdb.com/docs/getting-started/web-console/questdb-ai/#tips-for-using-the-ai-assistant "Direct link to Tips for using the AI Assistant")
--------------------------------------------------------------------------------------------------------------------------------------------------------------------------------------
* Keep conversations focused on a single query or table for better contextual accuracy
* Use the Explain feature to understand complex SQL patterns and QuestDB-specific syntax
* Use the Fix feature when queries fail to get immediate troubleshooting assistance
* Enable schema access for more accurate suggestions about your specific tables
* Rename conversations with descriptive titles for easier navigation in history
* Review AI suggestions carefully before accepting them into your editor
Privacy & Data Security[](https://questdb.com/docs/getting-started/web-console/questdb-ai/#privacy--data-security "Direct link to Privacy & Data Security")
-------------------------------------------------------------------------------------------------------------------------------------------------------------
### Data Flow[](https://questdb.com/docs/getting-started/web-console/questdb-ai/#data-flow "Direct link to Data Flow")
Queries and conversation context are sent directly from your browser to your chosen AI provider. QuestDB does not receive, store, or process your conversations.
info
Web Console does not send any data to a model provider unless a provider is configured explicitly by the user.
### Bring Your Own Key (BYOK)[](https://questdb.com/docs/getting-started/web-console/questdb-ai/#bring-your-own-key-byok "Direct link to Bring Your Own Key (BYOK)")
Your API keys and conversations are stored in your browser. They are never transmitted to QuestDB servers and remain under your complete control.
You can edit or remove your API keys at any time through the Settings modal. Keys are sent only to your chosen AI provider when you make requests.
### Schema vs Data[](https://questdb.com/docs/getting-started/web-console/questdb-ai/#schema-vs-data "Direct link to Schema vs Data")
Schema access grants the AI visibility to your database structure (table names, column names, data types) but never includes actual data records or values from your tables.
You control schema access independently for each provider. Even with schema access enabled, the AI only sees metadata about your database structure, not the data itself.
Different AI providers have different data handling practices. Consult your provider's documentation to understand their data retention, usage, and privacy policies.
* [Configuration](https://questdb.com/docs/getting-started/web-console/questdb-ai/#configuration)
* [Adding a model provider](https://questdb.com/docs/getting-started/web-console/questdb-ai/#adding-a-model-provider)
* [Setting up model preferences](https://questdb.com/docs/getting-started/web-console/questdb-ai/#setting-up-model-preferences)
* [Settings](https://questdb.com/docs/getting-started/web-console/questdb-ai/#settings)
* [Chat Window](https://questdb.com/docs/getting-started/web-console/questdb-ai/#chat-window)
* [Opening the Chat](https://questdb.com/docs/getting-started/web-console/questdb-ai/#opening-the-chat)
* [Chat Interface](https://questdb.com/docs/getting-started/web-console/questdb-ai/#chat-interface)
* [Managing Conversations](https://questdb.com/docs/getting-started/web-console/questdb-ai/#managing-conversations)
* [Quick Actions](https://questdb.com/docs/getting-started/web-console/questdb-ai/#quick-actions)
* [SQL Suggestions](https://questdb.com/docs/getting-started/web-console/questdb-ai/#sql-suggestions)
* [Status Indicators](https://questdb.com/docs/getting-started/web-console/questdb-ai/#status-indicators)
* [Aborting Generation](https://questdb.com/docs/getting-started/web-console/questdb-ai/#aborting-generation)
* [Tips for using the AI Assistant](https://questdb.com/docs/getting-started/web-console/questdb-ai/#tips-for-using-the-ai-assistant)
* [Privacy & Data Security](https://questdb.com/docs/getting-started/web-console/questdb-ai/#privacy--data-security)
* [Data Flow](https://questdb.com/docs/getting-started/web-console/questdb-ai/#data-flow)
* [Bring Your Own Key (BYOK)](https://questdb.com/docs/getting-started/web-console/questdb-ai/#bring-your-own-key-byok)
* [Schema vs Data](https://questdb.com/docs/getting-started/web-console/questdb-ai/#schema-vs-data)
---
# Go Client Documentation | QuestDB
On this page
QuestDB supports the Go ecosystem, offering a Go client designed for high-performance data ingestion, tailored specifically for insert-only operations. This combination of QuestDB and its Go client provides exceptional time series data ingestion and analytical capabilities.
The Go client introduces several advantages:
* **Automatic table creation**: No need to define your schema upfront.
* **Concurrent schema changes**: Seamlessly handle multiple data streams with on-the-fly schema modifications
* **Optimized batching**: Use strong defaults or curate the size of your batches
* **Health checks and feedback**: Ensure your system's integrity with built-in health monitoring
* **Automatic write retries**: Reuse connections and retry after interruptions
This quick start guide will help you get up and running with the basic functionalities of the Go client, covering connection setup, authentication, and some common insert patterns.

[View full docs](https://pkg.go.dev/github.com/questdb/go-questdb-client/)
[View source code](https://github.com/questdb/go-questdb-client/)
info
This page focuses on our high-performance ingestion client, which is optimized for **writing** data to QuestDB. For retrieving data, we recommend using a [PostgreSQL-compatible Go library](https://questdb.com/docs/query/pgwire/go/)
or our [HTTP query endpoint](https://questdb.com/docs/query/overview/#rest-http-api)
.
Requirements[](https://questdb.com/docs/ingestion/clients/go/#requirements "Direct link to Requirements")
-----------------------------------------------------------------------------------------------------------
* Requires Go 1.19 or later.
* Assumes QuestDB is running. If it's not, refer to [the general quick start](https://questdb.com/docs/getting-started/quick-start/)
.
Client Installation[](https://questdb.com/docs/ingestion/clients/go/#client-installation "Direct link to Client Installation")
--------------------------------------------------------------------------------------------------------------------------------
To add the QuestDB client to your Go project:
go get github.com/questdb/go-questdb-client/
Authentication[](https://questdb.com/docs/ingestion/clients/go/#authentication "Direct link to Authentication")
-----------------------------------------------------------------------------------------------------------------
Passing in a configuration string with HTTP basic authentication:
package mainimport ( "context" "github.com/questdb/go-questdb-client/v4")func main() { ctx := context.TODO() client, err := questdb.LineSenderFromConf(ctx, "http::addr=localhost:9000;username=admin;password=quest;") if err != nil { panic("Failed to create client") } // Utilize the client for your operations...}
Or, set the QDB\_CLIENT\_CONF environment variable and call `questdb.LineSenderFromEnv()`.
1. Export the configuration string as an environment variable:
export QDB_CLIENT_CONF="http::addr=localhost:9000;username=admin;password=quest;"
2. Then in your Go code:
client, err := questdb.LineSenderFromEnv(context.TODO())
Alternatively, you can use the built-in Go API to specify the connection options.
package mainimport ( "context" qdb "github.com/questdb/go-questdb-client/v4")func main() { ctx := context.TODO() client, err := qdb.NewLineSender(context.TODO(), qdb.WithHttp(), qdb.WithAddress("localhost:9000"), qdb.WithBasicAuth("admin", "quest"))
When using QuestDB Enterprise, authentication can also be done via REST token. Please check the [RBAC docs](https://questdb.com/docs/security/rbac/#authentication)
for more info.
Basic Insert[](https://questdb.com/docs/ingestion/clients/go/#basic-insert "Direct link to Basic Insert")
-----------------------------------------------------------------------------------------------------------
Example: inserting executed trades for cryptocurrencies.
Without authentication and using the current timestamp:
package mainimport ( "context" "github.com/questdb/go-questdb-client/v4")func main() { ctx := context.TODO() client, err := questdb.LineSenderFromConf(ctx, "http::addr=localhost:9000;") if err != nil { panic("Failed to create client") } err = client.Table("trades"). Symbol("symbol", "ETH-USD"). Symbol("side", "sell"). Float64Column("price", 2615.54). Float64Column("amount", 0.00044). AtNow(ctx) if err != nil { panic("Failed to insert data") } err = client.Flush(ctx) if err != nil { panic("Failed to flush data") }}
In this case, the designated timestamp will be the one at execution time. Let's see now an example with an explicit timestamp, custom auto-flushing, and basic auth.
package mainimport ( "context" "github.com/questdb/go-questdb-client/v4" "time")func main() { ctx := context.TODO() client, err := questdb.LineSenderFromConf(ctx, "http::addr=localhost:9000;username=admin;password=quest;auto_flush_rows=100;auto_flush_interval=1000;") if err != nil { panic("Failed to create client") } timestamp := time.Now() err = client.Table("trades"). Symbol("symbol", "ETH-USD"). Symbol("side", "sell"). Float64Column("price", 2615.54). Float64Column("amount", 0.00044). At(ctx, timestamp) if err != nil { panic("Failed to insert data") } err = client.Flush(ctx) // You can flush manually at any point. // If you don't flush manually, the client will flush automatically // when a row is added and either: // * The buffer contains 75000 rows (if HTTP) or 600 rows (if TCP) // * The last flush was more than 1000ms ago. // Auto-flushing can be customized via the `auto_flush_..` params. if err != nil { panic("Failed to flush data") }}
We recommended to use User-assigned timestamps when ingesting data into QuestDB. Using the current timestamp hinder the ability to deduplicate rows which is [important for exactly-once processing](https://questdb.com/docs/ingestion/ilp/overview/#exactly-once-delivery-vs-at-least-once-delivery)
.
Configuration options[](https://questdb.com/docs/ingestion/clients/go/#configuration-options "Direct link to Configuration options")
--------------------------------------------------------------------------------------------------------------------------------------
The minimal configuration string needs to have the protocol, host, and port, as in:
http::addr=localhost:9000;
In the Go client, you can set the configuration options via the standard config string, which is the same across all clients, or using [the built-in API](https://pkg.go.dev/github.com/questdb/go-questdb-client/#LineSenderOption)
.
For all the extra options you can use, please check [the client docs](https://pkg.go.dev/github.com/questdb/go-questdb-client/#LineSenderFromConf)
Alternatively, for a breakdown of Configuration string options available across all clients, see the [Configuration string](https://questdb.com/docs/ingestion/clients/configuration-string/)
page.
Next Steps[](https://questdb.com/docs/ingestion/clients/go/#next-steps "Direct link to Next Steps")
-----------------------------------------------------------------------------------------------------
Please refer to the [ILP overview](https://questdb.com/docs/ingestion/ilp/overview/)
for details about transactions, error control, delivery guarantees, health check, or table and column auto-creation.
Explore the full capabilities of the Go client via [Go.dev](https://pkg.go.dev/github.com/questdb/go-questdb-client/)
.
With data flowing into QuestDB, now it's time to for analysis.
To learn _The Way_ of QuestDB SQL, see the [Query & SQL Overview](https://questdb.com/docs/query/overview/)
.
Alone? Stuck? Want help? Visit us in our [Community Forum](https://community.questdb.com/)
.
* [Requirements](https://questdb.com/docs/ingestion/clients/go/#requirements)
* [Client Installation](https://questdb.com/docs/ingestion/clients/go/#client-installation)
* [Authentication](https://questdb.com/docs/ingestion/clients/go/#authentication)
* [Basic Insert](https://questdb.com/docs/ingestion/clients/go/#basic-insert)
* [Configuration options](https://questdb.com/docs/ingestion/clients/go/#configuration-options)
* [Next Steps](https://questdb.com/docs/ingestion/clients/go/#next-steps)
---
# Advanced InfluxDB Line Protocol settings | QuestDB
On this page
This documentation provides aid for those venturing outside of the path laid down by their language clients.
For the introductory InfluxDB Line Protocol materials, including authentication, see the [ILP overview](https://questdb.com/docs/ingestion/ilp/overview/)
.
For the the basics of ingestion, instead consult the [Ingestion overview](https://questdb.com/docs/ingestion/overview/)
.
Syntax[](https://questdb.com/docs/ingestion/ilp/advanced-settings/#syntax "Direct link to Syntax")
----------------------------------------------------------------------------------------------------
Each InfluxDB Line Protocol message has to end with a new line `\n` character.
table_name,symbolset columnset timestamp\n
| Element | Definition |
| --- | --- |
| `table_name` | Name of the table where QuestDB will write data. |
| `symbolset` | A set of comma-separated `name=value` pairs that will be parsed as symbol columns. |
| `columnset` | A set of comma-separated `name=value` pairs that will be parsed as non-symbol columns. |
| `timestamp` | UNIX timestamp. The default unit is nanosecond and is configurable via `line.tcp.timestamp`. The value will be truncated to microsecond resolution when parsed by QuestDB. |
`name` in the `name=value` pair always corresponds to `column name` in the table.
Behavior[](https://questdb.com/docs/ingestion/ilp/advanced-settings/#behavior "Direct link to Behavior")
----------------------------------------------------------------------------------------------------------
* When the `table_name` does not correspond to an existing table, QuestDB will create the table on the fly using the name provided. Column types will be automatically recognized and assigned based on the data.
* The `timestamp` column is automatically created as [designated timestamp](https://questdb.com/docs/concepts/designated-timestamp/)
with the [partition strategy](https://questdb.com/docs/concepts/partitions/)
set to `DAY`. Alternatively, use [CREATE TABLE](https://questdb.com/docs/query/sql/create-table/)
to create the table with a different partition strategy before ingestion.
* When the timestamp is empty, QuestDB will use the server timestamp.
Generic example[](https://questdb.com/docs/ingestion/ilp/advanced-settings/#generic-example "Direct link to Generic example")
-------------------------------------------------------------------------------------------------------------------------------
Let's assume the following data:
| timestamp | symbol | price | amount | side |
| --- | --- | --- | --- | --- |
| 1465839830100400000 | BTC-USD | 61432 | 0.5 | buy |
| 1465839830100600000 | ETH-USD | 3421 | 2.1 | sell |
| 1465839830100700000 | BTC-USD | 61435 | 1.2 | buy |
The line protocol syntax for that table is:
trades,symbol=BTC-USD,side=buy price=61432,amount=0.5 1465839830100400000\ntrades,symbol=ETH-USD,side=sell price=3421,amount=2.1 1465839830100600000\ntrades,symbol=BTC-USD,side=buy price=61435,amount=1.2 1465839830100700000\n
This would create table similar to this SQL statement and populate it.
CREATE TABLE trades ( timestamp TIMESTAMP, symbol SYMBOL, price DOUBLE, amount DOUBLE, side SYMBOL) TIMESTAMP(timestamp) PARTITION BY DAY;
Designated timestamp[](https://questdb.com/docs/ingestion/ilp/advanced-settings/#designated-timestamp "Direct link to Designated timestamp")
----------------------------------------------------------------------------------------------------------------------------------------------
### Timestamps[](https://questdb.com/docs/ingestion/ilp/advanced-settings/#timestamps "Direct link to Timestamps")
Designated timestamp is the trailing value of an InfluxDB Line Protocol message. It is optional, and when present, is a timestamp in Epoch nanoseconds. When the timestamp is omitted, the server will insert each message using the system clock as the row timestamp. See `cairo.timestamp.locale` and `line.tcp.timestamp` [configuration options](https://questdb.com/docs/configuration/overview/)
.
caution
* While [`columnset` timestamp type units](https://questdb.com/docs/ingestion/ilp/columnset-types/#timestamp)
are microseconds, the designated timestamp units are nanoseconds by default, and can be overridden via the `line.tcp.timestamp` configuration property.
* The native timestamp format used by QuestDB is a Unix timestamp in microsecond resolution; timestamps in nanoseconds will be parsed and truncated to microseconds. When the `timestamp_ns` type is used for the designated column, the timestamp will retain the nanosecond precision.
* For HTTP, precision parameters can added to a request. These include `n` or `ns` for nanoseconds, `u` or `us` formicroseconds, `ms` for milliseconds, `s` for seconds, `m` for minutes and `h` for hours. Otherwise, it will default to nanoseconds.
curl -i -XPOST 'http://localhost:9000/write?db=mydb&precision=s' \--data-binary 'trades,symbol=BTC-USD price=61432 1465839830100400200'
Example of InfluxDB Line Protocol message with desginated timestamp value
tracking,loc=north val=200i 1000000000\n
Example of InfluxDB Line Protocol message sans timestamp
tracking,loc=north val=200i\n
note
We recommend populating designated timestamp via trailing value syntax above.
It is also possible to populate designated timestamp via `columnset`. Please see [mixed timestamp](https://questdb.com/docs/ingestion/ilp/columnset-types/#timestamp)
reference.
Irregularly-structured data[](https://questdb.com/docs/ingestion/ilp/advanced-settings/#irregularly-structured-data "Direct link to Irregularly-structured data")
-------------------------------------------------------------------------------------------------------------------------------------------------------------------
InfluxDB line protocol makes it possible to send data under different shapes. Each new entry may contain certain tags or fields, and others not. QuestDB supports on-the-fly data structure changes with minimal overhead. Whilst the example just above highlights structured data, it is possible for InfluxDB line protocol users to send data as follows:
trades,symbol=BTC-USD price=61432 1465839830100400000\ntrades,symbol=BTC-USD price=61435 1465839830100700000\ntrades,symbol=ETH-USD price=3421,amount=2.1 1465839830100800000\n
This would result in the following table:
| timestamp | symbol | price | amount |
| --- | --- | --- | --- |
| 1465839830100400000 | BTC-USD | 61432 | NULL |
| 1465839830100700000 | BTC-USD | 61435 | NULL |
| 1465839830100800000 | ETH-USD | 3421 | 2.1 |
tip
Whilst we offer this function for flexibility, we recommend that users try to minimize structural changes to maintain operational simplicity.
Duplicate column names[](https://questdb.com/docs/ingestion/ilp/advanced-settings/#duplicate-column-names "Direct link to Duplicate column names")
----------------------------------------------------------------------------------------------------------------------------------------------------
If line contains duplicate column names, the value stored in the table will be that from the first `name=value` pair on each line. For example:
trade,ticker=USD price=30,price=60 1638202821000000000\n
Price `30` is stored, `60` is ignored.
Name restrictions[](https://questdb.com/docs/ingestion/ilp/advanced-settings/#name-restrictions "Direct link to Name restrictions")
-------------------------------------------------------------------------------------------------------------------------------------
Table name cannot contain any of the following characters: `\n`, `\r`, `?`, `,`, `”`, `"`, `\`, `/`, `:`, `)`, `(`, `+`, `*`, `%`, `~`, starting `.`, trailing `.`, or a non-printable char.
Column name cannot contain any of the following characters: `\n`, `\r`, `?`, `.`, `,`, `”`, `"`, `\\`, `/`, `:`, `)`, `(`, `+`, `-`, `\*` `%%`, `~`, or a non-printable char.
Both table name and column names are allowed to have spaces . These spaces have to be escaped with `\`. For example both of these are valid lines.
trade\ table,ticker=USD price=30,details="Latest price" 1638202821000000000\n
trade,symbol\ ticker=USD price=30,details="Latest price" 1638202821000000000\n
Symbolset[](https://questdb.com/docs/ingestion/ilp/advanced-settings/#symbolset "Direct link to Symbolset")
-------------------------------------------------------------------------------------------------------------
Area of the message that contains comma-separated set of `name=value` pairs for symbol columns. For example in a message like this:
trade,ticker=BTCUSD,venue=coinbase price=30,price=60 1638202821000000000\n
`symbolset` is `ticker=BTCUSD,venue=coinbase`. Please note the mandatory space between `symbolset` and `columnset`. Naming rules for columns are subject to [duplicate rules](https://questdb.com/docs/ingestion/ilp/advanced-settings/#duplicate-column-names)
and [name restrictions](https://questdb.com/docs/ingestion/ilp/advanced-settings/#name-restrictions)
.
### Symbolset values[](https://questdb.com/docs/ingestion/ilp/advanced-settings/#symbolset-values "Direct link to Symbolset values")
`symbolset` values are always interpreted as [SYMBOL](https://questdb.com/docs/concepts/symbol/)
. Parser takes values literally so please beware of accidentally using high cardinality types such as `9092i` or `1.245667`. This will result in a significant performance loss due to large mapping tables.
`symbolset` values are not quoted. They are allowed to have special characters, such as (space), `=`, `,`, `\n`, `\r` and `\`, which must be escaped with a `\`. Example:
trade,ticker=BTC\\USD\,All,venue=coin\ base price=30 1638202821000000000\n
Whenever `symbolset` column does not exist, it will be added on-the-fly with type `SYMBOL`. On other hand when the column does exist, it is expected to be of `SYMBOL` type, otherwise the line is rejected.
Columnset[](https://questdb.com/docs/ingestion/ilp/advanced-settings/#columnset "Direct link to Columnset")
-------------------------------------------------------------------------------------------------------------
Area of the message that contains comma-separated set of `name=value` pairs for non-symbol columns. For example in a message like this:
trade,ticker=BTCUSD priceLow=30,priceHigh=60 1638202821000000000\n
`columnset` is `priceLow=30,priceHigh=60`. Naming rules for columns are subject to [duplicate rules](https://questdb.com/docs/ingestion/ilp/advanced-settings/#duplicate-column-names)
and [name restrictions](https://questdb.com/docs/ingestion/ilp/advanced-settings/#name-restrictions)
.
### Columnset values[](https://questdb.com/docs/ingestion/ilp/advanced-settings/#columnset-values "Direct link to Columnset values")
`columnset` supports several values types, which are used to either derive type of new column or mapping strategy when column already exists. These types are limited by existing InfluxDB Line Protocol specification. Wider QuestDB type system is available by creating table via SQL upfront. The following are supported value types: [Integer](https://questdb.com/docs/ingestion/ilp/columnset-types/#integer)
, [Long256](https://questdb.com/docs/ingestion/ilp/columnset-types/#long256)
, [Float](https://questdb.com/docs/ingestion/ilp/columnset-types/#float)
, [String](https://questdb.com/docs/ingestion/ilp/columnset-types/#string)
and [Timestamp](https://questdb.com/docs/ingestion/ilp/columnset-types/#timestamp)
Inserting NULL values[](https://questdb.com/docs/ingestion/ilp/advanced-settings/#inserting-null-values "Direct link to Inserting NULL values")
-------------------------------------------------------------------------------------------------------------------------------------------------
To insert a NULL value, skip the column (or symbol) for that row.
For example:
table1 a=10.5 1647357688714369403table1 b=1.25 1647357698714369403
Will insert as:
| a | b | timestamp |
| --- | --- | --- |
| 10.5 | _NULL_ | 2022-03-15T15:21:28.714369Z |
| _NULL_ | 1.25 | 2022-03-15T15:21:38.714369Z |
InfluxDB Line Protocol Datatypes and Casts[](https://questdb.com/docs/ingestion/ilp/advanced-settings/#influxdb-line-protocol-datatypes-and-casts "Direct link to InfluxDB Line Protocol Datatypes and Casts")
----------------------------------------------------------------------------------------------------------------------------------------------------------------------------------------------------------------
### Varchar vs Symbols[](https://questdb.com/docs/ingestion/ilp/advanced-settings/#varchar-vs-symbols "Direct link to Varchar vs Symbols")
Strings may be recorded as either the `VARCHAR` type or the `SYMBOL` type.
Inspecting a sample message we can see how a space `' '` separator splits `SYMBOL` columns to the left from the rest of the columns.
table_name,col1=symbol_val1,col2=symbol_val2 col3="varchar val",col4=10.5 ┬ ╰───────── separator
In this example, columns `col1` and `col2` are strings written to the database as `SYMBOL`s, whilst `col3` is written out as a `VARCHAR`.
`SYMBOL`s are strings which are automatically [interned](https://en.wikipedia.org/wiki/String_interning)
by the database on a per-column basis. You should use this type if you expect the string to be re-used over and over, such as is common with identifiers.
For one-off strings use `VARCHAR` columns which aren't interned.
### Casts[](https://questdb.com/docs/ingestion/ilp/advanced-settings/#casts "Direct link to Casts")
QuestDB types are a superset of those supported by InfluxDB Line Protocol. This means that when sending data you should be aware of the performed conversions.
See:
* [QuestDB Types in SQL](https://questdb.com/docs/query/datatypes/overview/)
* [InfluxDB Line Protocol types and cast conversion tables](https://questdb.com/docs/ingestion/ilp/columnset-types/)
Constructing well-formed messages[](https://questdb.com/docs/ingestion/ilp/advanced-settings/#constructing-well-formed-messages "Direct link to Constructing well-formed messages")
-------------------------------------------------------------------------------------------------------------------------------------------------------------------------------------
Different library implementations will perform different degrees of content validation upfront before sending messages out. To avoid encountering issues, follow these guidelines:
* **All strings must be UTF-8 encoded.**
* **Each column should only be specified once per row..**
* **Symbol columns must be written out before other columns.**
* **Table and column names can't have invalid characters.** These should not contain `?`, `.`,`,`, `'`, `"`, `\`, `/`, `:`, `(`, `)`, `+`, `-`, `*`, `%`, `~`,`' '` (space), `\0` (nul terminator), [ZERO WIDTH NO-BREAK SPACE](https://unicode-explorer.com/c/FEFF)
.
* **Write timestamp column via designated API**, or at the end of the message if you are using raw sockets. If you have multiple timestamp columns write additional ones as column values.
* **Don't change column type between rows.**
Error handling[](https://questdb.com/docs/ingestion/ilp/advanced-settings/#error-handling "Direct link to Error handling")
----------------------------------------------------------------------------------------------------------------------------
QuestDB will always log any InfluxDB Line Protocol errors in its [server logs](https://questdb.com/docs/concepts/deep-dive/root-directory-structure/#log-directory)
.
It is recommended that sending applications reuse TCP connections. If QuestDB receives an invalid message, it will discard invalid lines, produce an error message in the logs and forcibly _disconnect_ the sender to prevent further data loss.
Data may be discarded because of:
* missing new line characters at the end of messages
* an invalid data format such as unescaped special characters
* invalid column / table name characters
* schema mismatch with existing tables
* message size overflows on the input buffer
* system errors such as no space left on the disk
Detecting malformed input can be achieved through QuestDB logs by searching for `LineTcpMeasurementScheduler` and `LineTcpConnectionContext`, for example:
2022-02-03T11:01:51.007235Z I i.q.c.l.t.LineTcpMeasurementScheduler could not create table [tableName=trades, ex=`column name contains invalid characters [colName=trade_%]`, errno=0]
The following input is tolerated by QuestDB:
* a column is specified twice or more on the same line, QuestDB will pick the first occurrence and ignore the rest
* missing columns, their value will be defaulted to `null`/`0.0`/`false` depending on the type of the column
* missing designated timestamp, the current server time will be used to generate the timestamp
* the timestamp is specified as a column instead of appending it to the end of the line
* timestamp appears as a column and is also present at the end of the line, the value sent as a field will be used
With sufficient client-side validation, the lack of errors to the client and confirmation isn't necessarily a concern: QuestDB will log out any issues and disconnect on error. The database will process any valid lines up to that point and insert rows.
To resume WAL table ingestion after recovery from errors, see [ALTER TABLE RESUME WAL](https://questdb.com/docs/query/sql/alter-table-resume-wal/)
for more information.
### If you don't immediately see data[](https://questdb.com/docs/ingestion/ilp/advanced-settings/#if-you-dont-immediately-see-data "Direct link to If you don't immediately see data")
If you don't see your inserted data, this is usually a result of one of two things:
* You prepared the messages, but forgot to call `.flush()` or similar in your client library, so no data was sent.
* The internal timers and buffers within QuestDB did not commit the data yet. For development (and development only), you may want to tweak configuration settings to commit data more frequently.
cairo.max.uncommitted.rows=1
Refer to [InfluxDB Line Protocol's configuration](https://questdb.com/docs/configuration/overview/#influxdb-line-protocol-ilp)
documentation for more on these configuration settings.
* [Syntax](https://questdb.com/docs/ingestion/ilp/advanced-settings/#syntax)
* [Behavior](https://questdb.com/docs/ingestion/ilp/advanced-settings/#behavior)
* [Generic example](https://questdb.com/docs/ingestion/ilp/advanced-settings/#generic-example)
* [Designated timestamp](https://questdb.com/docs/ingestion/ilp/advanced-settings/#designated-timestamp)
* [Timestamps](https://questdb.com/docs/ingestion/ilp/advanced-settings/#timestamps)
* [Irregularly-structured data](https://questdb.com/docs/ingestion/ilp/advanced-settings/#irregularly-structured-data)
* [Duplicate column names](https://questdb.com/docs/ingestion/ilp/advanced-settings/#duplicate-column-names)
* [Name restrictions](https://questdb.com/docs/ingestion/ilp/advanced-settings/#name-restrictions)
* [Symbolset](https://questdb.com/docs/ingestion/ilp/advanced-settings/#symbolset)
* [Symbolset values](https://questdb.com/docs/ingestion/ilp/advanced-settings/#symbolset-values)
* [Columnset](https://questdb.com/docs/ingestion/ilp/advanced-settings/#columnset)
* [Columnset values](https://questdb.com/docs/ingestion/ilp/advanced-settings/#columnset-values)
* [Inserting NULL values](https://questdb.com/docs/ingestion/ilp/advanced-settings/#inserting-null-values)
* [InfluxDB Line Protocol Datatypes and Casts](https://questdb.com/docs/ingestion/ilp/advanced-settings/#influxdb-line-protocol-datatypes-and-casts)
* [Varchar vs Symbols](https://questdb.com/docs/ingestion/ilp/advanced-settings/#varchar-vs-symbols)
* [Casts](https://questdb.com/docs/ingestion/ilp/advanced-settings/#casts)
* [Constructing well-formed messages](https://questdb.com/docs/ingestion/ilp/advanced-settings/#constructing-well-formed-messages)
* [Error handling](https://questdb.com/docs/ingestion/ilp/advanced-settings/#error-handling)
* [If you don't immediately see data](https://questdb.com/docs/ingestion/ilp/advanced-settings/#if-you-dont-immediately-see-data)
---
# Code Editor | QuestDB
On this page
The **Code Editor** is the main workspace where you write and execute SQL queries in the QuestDB Web Console. It provides a modern, feature-rich editing experience with syntax highlighting, auto-completion, and multiple query execution mechanisms.
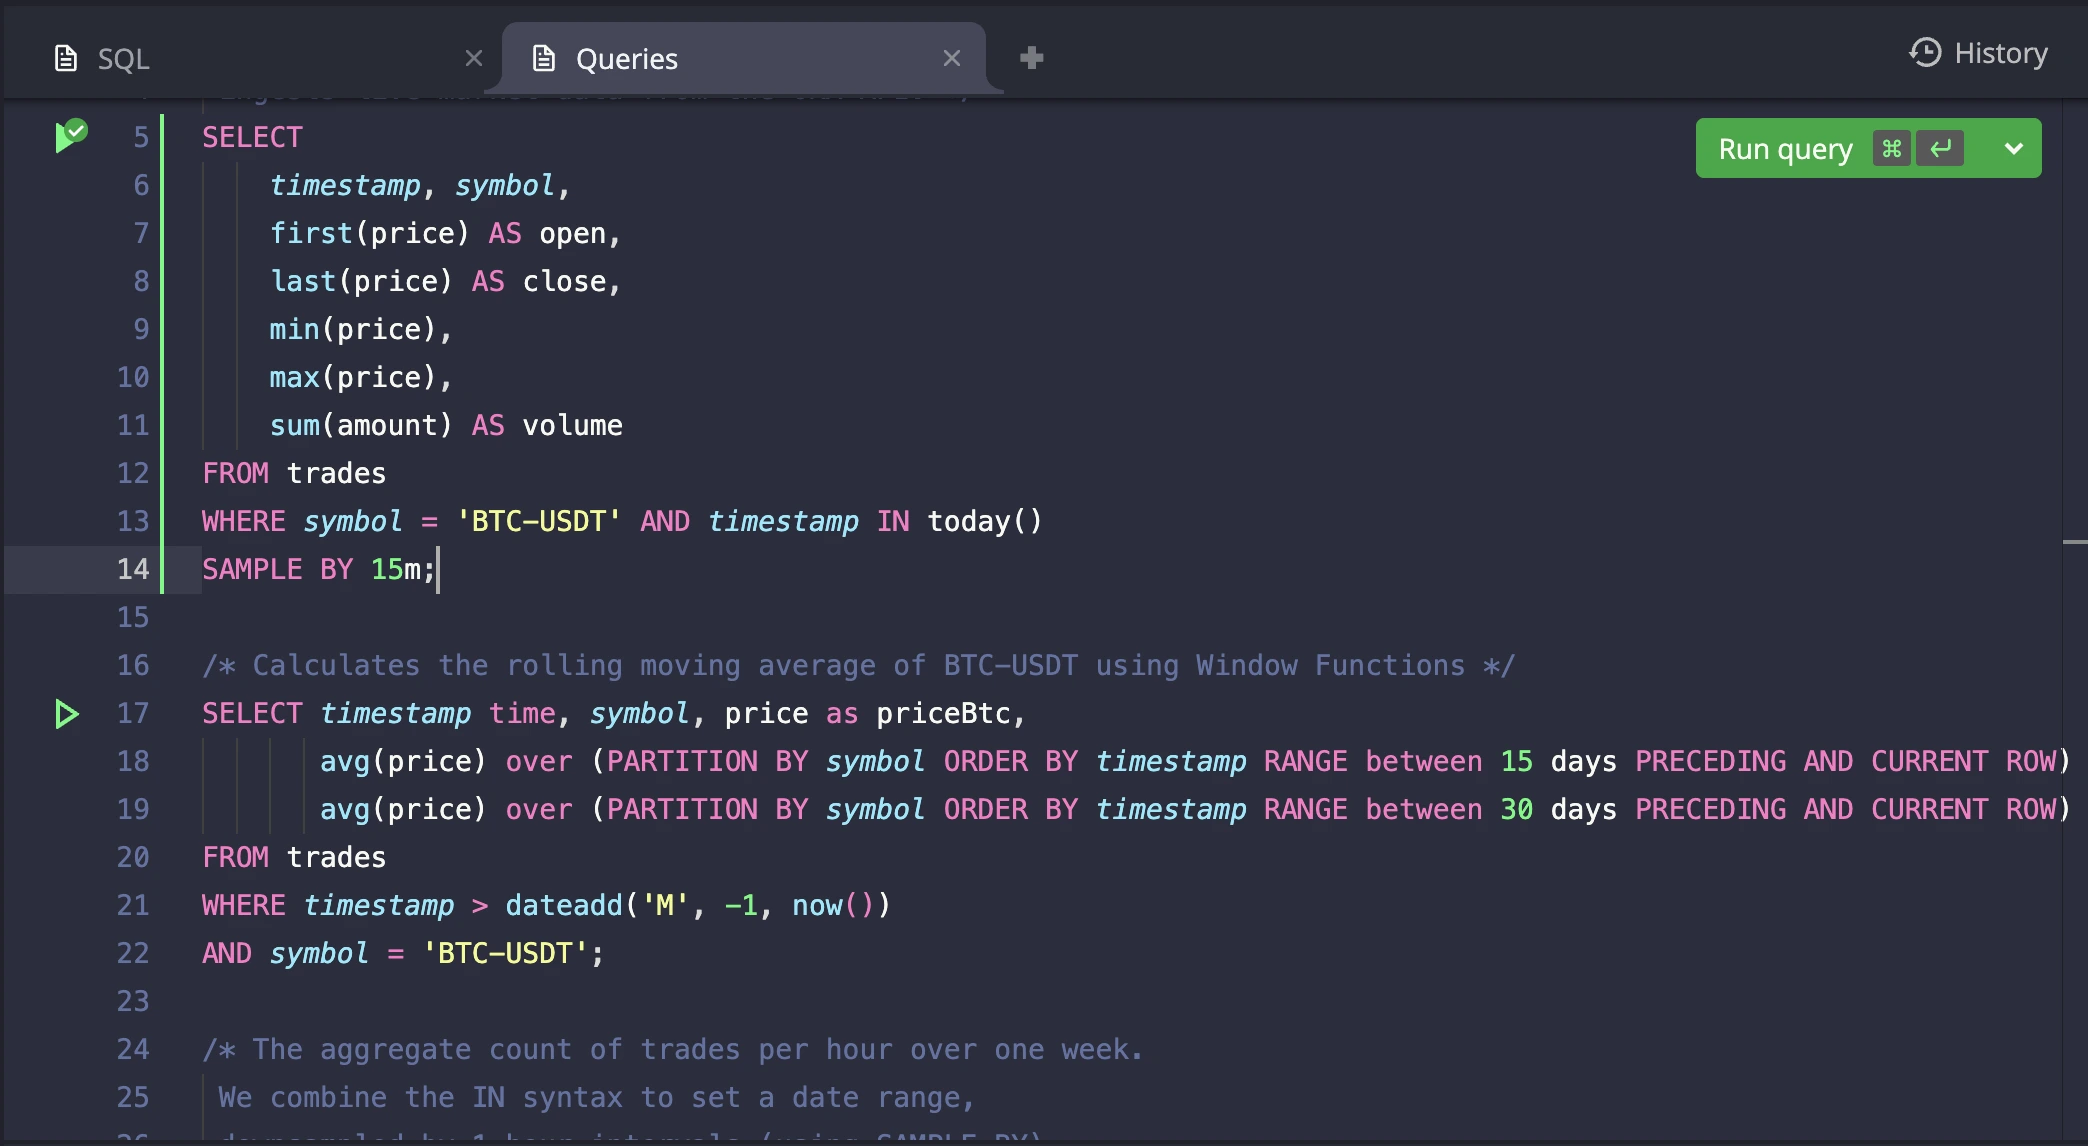
Editor[](https://questdb.com/docs/getting-started/web-console/code-editor/#editor "Direct link to Editor")
------------------------------------------------------------------------------------------------------------
The Monaco-based editor provides a powerful development environment for writing SQL queries with professional IDE features. It offers syntax highlighting, intelligent auto-completion for database objects, and multiple execution modes to suit different query workflows.
### Key Features[](https://questdb.com/docs/getting-started/web-console/code-editor/#key-features "Direct link to Key Features")
* **Syntax Highlighting**: Color-coded SQL keywords, strings, comments, and functions specific to QuestDB SQL
* **Auto-Completion**: Intelligent suggestions for table names, columns, and SQL functions as you type
* **Visual Query Status**: Glyph icons in the editor margin show query execution status (success, error, running)
* **Error Markers**: Underlined error positions based on query results
* **Multiple Execution Modes**: Support for single query execution, selection-based execution, and batch execution
* **Query Planning**: Analyze query execution plans with EXPLAIN functionality
info
Error markers and the query log are dynamically updated based on cursor position. When you place your cursor within a query, the query log will display the status of that specific query, and error markers will appear if the query execution was previously unsuccessful.
### Running a Query[](https://questdb.com/docs/getting-started/web-console/code-editor/#running-a-query "Direct link to Running a Query")
Individual query execution offers flexible options for running specific SQL statements within your editor content.
#### Running a query from the icon[](https://questdb.com/docs/getting-started/web-console/code-editor/#running-a-query-from-the-icon "Direct link to Running a query from the icon")
Click the icon in the left margin next to any SQL query to execute it.

The icon provides visual feedback:
* **Hollow play icon**: Ready to execute
* **Success icon**: Query executed successfully
* **Error icon**: Query failed with errors
* **Cancel icon**: Currently running, click to cancel
When multiple queries exist on the same line, a dropdown menu appears with execution options for each query.
#### Running a query with selection[](https://questdb.com/docs/getting-started/web-console/code-editor/#running-a-query-with-selection "Direct link to Running a query with selection")
Select a portion of the query in the editor and press `Ctrl/Cmd + Enter`, or click on the run icon to execute only the selected portion. This allows you to run specific parts of larger queries or test query fragments independently.
info
When a query is executed with a selection, the selected portion of text is highlighted with a green or red background to indicate the status. You can also track the status from the run icon of the parent query.
#### Getting query plan[](https://questdb.com/docs/getting-started/web-console/code-editor/#getting-query-plan "Direct link to Getting query plan")
Right-click on a run icon to access the context menu and select "Get query plan" to see how QuestDB will execute your query. This runs an `EXPLAIN` command and displays the execution plan in the result grid. See [EXPLAIN](https://questdb.com/docs/query/sql/explain/)
for details.
### Running Multiple Queries[](https://questdb.com/docs/getting-started/web-console/code-editor/#running-multiple-queries "Direct link to Running Multiple Queries")
The Code Editor supports executing multiple queries in sequence through batch execution. This feature provides two distinct approaches for running multiple queries efficiently.
The editor provides dedicated buttons on the top right for multiple query execution:
**Run Query Button**:
* Dynamically adapts based on your current selection and context
* For single query: Shows "Run query" or "Run selected query"
* For multiple selected queries: Shows "Run N selected queries"
* **Keyboard shortcut**: `Ctrl/Cmd + Enter`
**Run All Queries Button**:
* Executes every query in the current tab sequentially
* **Keyboard shortcut**: `Ctrl/Cmd + Shift + Enter`
#### Execution Modes[](https://questdb.com/docs/getting-started/web-console/code-editor/#execution-modes "Direct link to Execution Modes")
**Selected Queries Mode**: When you have multiple queries selected (partially or fully), the system runs only the selected portions of each query in sequence. This allows you to:
* Run specific parts of larger queries
* Execute a subset of queries from your tab
* Test query fragments before running the complete set
**All Queries Mode**: When you choose "Run all queries", the system executes every query in the tab from top to bottom. This mode includes:
* **Confirmation dialog**: Prevents accidental execution of all queries
* **Stop after failure option**: Checkbox to halt execution when a query fails (enabled by default)
* **Progress tracking**: Real-time feedback showing successful and failed query counts
* **Execution summary**: Shows the summary in the query log, including timing and the number of failed/successful queries
tip
Running multiple queries is ideal for data migration, bulk operations, or running complex multi-step procedures. The "Stop after failure" option helps prevent cascading errors in critical operations.
Tabs[](https://questdb.com/docs/getting-started/web-console/code-editor/#tabs "Direct link to Tabs")
------------------------------------------------------------------------------------------------------
The Code Editor supports multiple tabs to help you organize and manage different SQL queries simultaneously. Each tab represents a separate query buffer with its own content and execution state.
### Adding a New Tab[](https://questdb.com/docs/getting-started/web-console/code-editor/#adding-a-new-tab "Direct link to Adding a New Tab")
Click the `+` button to create a new tab for writing additional queries
### Renaming a Tab[](https://questdb.com/docs/getting-started/web-console/code-editor/#renaming-a-tab "Direct link to Renaming a Tab")
Double-click on a tab name to rename it for better organization
### Tab History[](https://questdb.com/docs/getting-started/web-console/code-editor/#tab-history "Direct link to Tab History")
Access previously closed tabs and manage your query history

* **Restore Tab**: Click on an item to restore a previously closed tab from the history
* **Clear History**: Remove all stored tab history to start fresh
info
Web Console maintains a separate query log for each tab. See [Query Log](https://questdb.com/docs/getting-started/web-console/query-log/)
for details.
* [Editor](https://questdb.com/docs/getting-started/web-console/code-editor/#editor)
* [Key Features](https://questdb.com/docs/getting-started/web-console/code-editor/#key-features)
* [Running a Query](https://questdb.com/docs/getting-started/web-console/code-editor/#running-a-query)
* [Running Multiple Queries](https://questdb.com/docs/getting-started/web-console/code-editor/#running-multiple-queries)
* [Tabs](https://questdb.com/docs/getting-started/web-console/code-editor/#tabs)
* [Adding a New Tab](https://questdb.com/docs/getting-started/web-console/code-editor/#adding-a-new-tab)
* [Renaming a Tab](https://questdb.com/docs/getting-started/web-console/code-editor/#renaming-a-tab)
* [Tab History](https://questdb.com/docs/getting-started/web-console/code-editor/#tab-history)
---
# Monitoring and alerting | QuestDB
On this page
There are many variables to consider when monitoring an active production database. This document is designed to be a helpful starting point. We plan to expand this guide to be more helpful. If you have any recommendations, feel free to [create an issue](https://github.com/questdb/documentation/issues)
or a PR on GitHub.
For detailed instructions on setting up Prometheus to scrape QuestDB metrics, see the [Prometheus integration guide](https://questdb.com/docs/integrations/other/prometheus/)
.
Basic health check[](https://questdb.com/docs/operations/monitoring-alerting/#basic-health-check "Direct link to Basic health check")
---------------------------------------------------------------------------------------------------------------------------------------
QuestDB comes with an out-of-the-box health check HTTP endpoint:
GET health status of local instance
curl -v http://127.0.0.1:9003
Getting an OK response means the QuestDB process is up and running. This method provides no further information.
If you allocate 8 vCPUs/cores or less to QuestDB, the HTTP server thread may not be able to get enough CPU time to respond in a timely manner. Your load balancer may flag the instance as dead. In such a case, create an isolated thread pool just for the health check service (the `min` HTTP server), by setting this configuration option:
http.min.worker.count=1
Alert on critical errors[](https://questdb.com/docs/operations/monitoring-alerting/#alert-on-critical-errors "Direct link to Alert on critical errors")
---------------------------------------------------------------------------------------------------------------------------------------------------------
QuestDB includes a log writer that sends any message logged at critical level to Prometheus Alertmanager over a TCP/IP socket. To configure this writer, add it to the `writers` config alongside other log writers. This is the basic setup:
log.conf
writers=stdout,alertw.alert.class=io.questdb.log.LogAlertSocketWriterw.alert.level=CRITICAL
For more details, see the [Logging and metrics page](https://questdb.com/docs/operations/logging-metrics/#prometheus-alertmanager)
.
Detect table health issues[](https://questdb.com/docs/operations/monitoring-alerting/#detect-table-health-issues "Direct link to Detect table health issues")
---------------------------------------------------------------------------------------------------------------------------------------------------------------
This section covers monitoring and troubleshooting table health issues. For detailed per-table monitoring, use the [`tables()`](https://questdb.com/docs/query/functions/meta/#tables)
function which returns real-time statistics including WAL status, memory pressure, and performance histograms. The function is lightweight and fully in-memory, suitable for frequent polling.
### Health dashboard query[](https://questdb.com/docs/operations/monitoring-alerting/#health-dashboard-query "Direct link to Health dashboard query")
SELECT table_name, table_row_count, wal_pending_row_count, CASE WHEN table_suspended THEN 'SUSPENDED' WHEN table_memory_pressure_level = 2 THEN 'BACKOFF' WHEN table_memory_pressure_level = 1 THEN 'PRESSURE' ELSE 'OK' END AS status, wal_txn - table_txn AS lag_txns, table_write_amp_p50 AS write_amp, table_merge_rate_p99 AS slowest_mergeFROM tables()WHERE walEnabledORDER BY table_suspended DESC, table_memory_pressure_level DESC, wal_pending_row_count DESC;
### Detect suspended tables[](https://questdb.com/docs/operations/monitoring-alerting/#detect-suspended-tables "Direct link to Detect suspended tables")
A WAL table becomes suspended when an error occurs during WAL apply, such as disk full, corrupted WAL segment, or kernel limits reached. While suspended, new data continues to be written to WAL but is not applied to the table.
**Detection:**
SELECT table_name FROM tables() WHERE table_suspended;
**Resolution:**
Resume from the failed transaction:
ALTER TABLE my_table RESUME WAL;
If the transaction is corrupted, skip it by specifying the next transaction:
-- Find the last applied transactionSELECT writerTxn FROM wal_tables() WHERE name = 'my_table';-- Resume from the next transactionALTER TABLE my_table RESUME WAL FROM TXN ;
For corrupted WAL segments (common after disk full errors), you may need to skip multiple transactions. Query `wal_transactions()` to find all transactions in the corrupted segment, then resume from the first transaction after that segment.
See [ALTER TABLE RESUME WAL](https://questdb.com/docs/query/sql/alter-table-resume-wal/)
for detailed recovery procedures including corrupted segment handling.
### Detect invalid materialized views[](https://questdb.com/docs/operations/monitoring-alerting/#detect-invalid-materialized-views "Direct link to Detect invalid materialized views")
Materialized views become invalid when their base table is modified in incompatible ways: dropping referenced columns, dropping partitions, renaming the table, or running TRUNCATE/UPDATE operations.
**Detection:**
SELECT view_name, invalidation_reasonFROM materialized_views()WHERE view_status = 'invalid';
**Resolution:**
Perform a full refresh to rebuild the view:
REFRESH MATERIALIZED VIEW my_view FULL;
This deletes existing data and rebuilds from the base table. For large tables, this may take significant time.
See [Materialized view invalidation](https://questdb.com/docs/concepts/materialized-views/#view-invalidation)
for more details on causes and prevention.
### Detect memory pressure[](https://questdb.com/docs/operations/monitoring-alerting/#detect-memory-pressure "Direct link to Detect memory pressure")
Memory pressure indicates the system is running low on memory for out-of-order (O3) operations. Level 1 reduces parallelism to conserve memory. Level 2 enters backoff mode, which can significantly impact throughput.
**Detection:**
SELECT table_name, CASE table_memory_pressure_level WHEN 1 THEN 'PRESSURE' WHEN 2 THEN 'BACKOFF' END AS statusFROM tables()WHERE table_memory_pressure_level > 0;
**Resolution:**
Reduce O3 memory allocation per column. The default of 256K actually uses 512K (2x the configured size). Reducing this frees memory for other operations:
server.conf
cairo.o3.column.memory.size=128K
Other options:
* Add more RAM to the server
* Reduce concurrent ingestion load
* Reduce the number of tables with active O3 writes
See [Capacity planning](https://questdb.com/docs/getting-started/capacity-planning/#memory-page-size-configuration)
and [Optimize for many tables](https://questdb.com/docs/cookbook/operations/optimize-many-tables/)
for detailed configuration guidance.
### Detect small transactions[](https://questdb.com/docs/operations/monitoring-alerting/#detect-small-transactions "Direct link to Detect small transactions")
Small transaction sizes may indicate that the client is sending individual rows instead of batching. Larger batch sizes reduce transaction overhead and improve ingestion throughput.
**Detection:**
SELECT table_name, wal_tx_size_p50, wal_tx_size_p90, wal_tx_size_maxFROM tables()WHERE walEnabled AND wal_tx_size_p90 > 0 AND wal_tx_size_p90 < 100;
**Resolution:**
* Use the [official client libraries](https://questdb.com/docs/ingestion/overview/#first-party-clients)
which handle batching automatically
* For custom ILP clients, configure auto-flush by row count or time interval rather than flushing after each row
* For HTTP/PostgreSQL ingestion, send multiple rows per request
### Detect high write amplification[](https://questdb.com/docs/operations/monitoring-alerting/#detect-high-write-amplification "Direct link to Detect high write amplification")
Write amplification measures how many times data is rewritten during ingestion. A value of 1.0 is ideal, meaning each row is written exactly once. Higher values indicate O3 merge overhead from out-of-order data being merged into existing partitions.
| Value | Interpretation |
| --- | --- |
| 1.0 – 1.5 | Excellent – minimal rewrites |
| 1.5 – 3.0 | Normal for moderate out-of-order data |
| 3.0 – 5.0 | Consider reducing partition size |
| \> 5.0 | High – reduce partition size or investigate ingestion patterns |
**Detection:**
SELECT table_name, table_write_amp_p50, table_write_amp_p99, table_merge_rate_p99 AS slowest_mergeFROM tables()WHERE walEnabled AND table_write_amp_p50 > 3.0ORDER BY table_write_amp_p99 DESC;
**Resolution:**
Reduce partition size to limit the scope of O3 merges. For example, a table with `PARTITION BY DAY` experiencing high amplification may benefit from `PARTITION BY HOUR`:
-- Recreate with smaller partitionsCREATE TABLE trades_new ( ...) TIMESTAMP(ts) PARTITION BY HOUR;
Other options:
* Reduce `cairo.writer.data.append.page.size` in server.conf
* Enable [deduplication](https://questdb.com/docs/concepts/deduplication/)
if data can be replayed
* Investigate client-side to reduce out-of-order data at the source
See [Write amplification](https://questdb.com/docs/getting-started/capacity-planning/#write-amplification)
for detailed guidance.
### Detect transaction lag and pending rows[](https://questdb.com/docs/operations/monitoring-alerting/#detect-transaction-lag-and-pending-rows "Direct link to Detect transaction lag and pending rows")
When `wal_txn - table_txn` (pending transactions) or `wal_pending_row_count` (pending rows) continuously grows, the WAL apply process cannot keep up with ingestion. The data is safely stored in WAL but not yet visible to queries.
A continuously rising difference indicates that either a table has become suspended and WAL can't be applied to it, or QuestDB is not able to keep up with the ingestion rate.
**Detection:**
SELECT table_name, wal_txn - table_txn AS pending_txns, wal_pending_row_countFROM tables()WHERE walEnabled AND (wal_txn - table_txn > 10 OR wal_pending_row_count > 1000000)ORDER BY wal_pending_row_count DESC;
**Resolution:**
* Check if the table is suspended and resume it. See [Detect suspended tables](https://questdb.com/docs/operations/monitoring-alerting/#detect-suspended-tables)
.
* Check for memory pressure which limits parallelism. See [Detect memory pressure](https://questdb.com/docs/operations/monitoring-alerting/#detect-memory-pressure)
.
* Check for high write amplification which slows merges. See [Detect high write amplification](https://questdb.com/docs/operations/monitoring-alerting/#detect-high-write-amplification)
.
* Temporarily reduce ingestion rate to allow the backlog to clear.
See the [`tables()` reference](https://questdb.com/docs/query/functions/meta/#tables)
for the complete list of columns and additional example queries.
Detect slow queries[](https://questdb.com/docs/operations/monitoring-alerting/#detect-slow-queries "Direct link to Detect slow queries")
------------------------------------------------------------------------------------------------------------------------------------------
QuestDB maintains a table called `_query_trace`, which records each executed query and the time it took. You can query this table to find slow queries.
Read more on query tracing on the [Concepts page](https://questdb.com/docs/concepts/deep-dive/query-tracing/)
.
* [Basic health check](https://questdb.com/docs/operations/monitoring-alerting/#basic-health-check)
* [Alert on critical errors](https://questdb.com/docs/operations/monitoring-alerting/#alert-on-critical-errors)
* [Detect table health issues](https://questdb.com/docs/operations/monitoring-alerting/#detect-table-health-issues)
* [Health dashboard query](https://questdb.com/docs/operations/monitoring-alerting/#health-dashboard-query)
* [Detect suspended tables](https://questdb.com/docs/operations/monitoring-alerting/#detect-suspended-tables)
* [Detect invalid materialized views](https://questdb.com/docs/operations/monitoring-alerting/#detect-invalid-materialized-views)
* [Detect memory pressure](https://questdb.com/docs/operations/monitoring-alerting/#detect-memory-pressure)
* [Detect small transactions](https://questdb.com/docs/operations/monitoring-alerting/#detect-small-transactions)
* [Detect high write amplification](https://questdb.com/docs/operations/monitoring-alerting/#detect-high-write-amplification)
* [Detect transaction lag and pending rows](https://questdb.com/docs/operations/monitoring-alerting/#detect-transaction-lag-and-pending-rows)
* [Detect slow queries](https://questdb.com/docs/operations/monitoring-alerting/#detect-slow-queries)
---
# Backup and restore | QuestDB
On this page
You should back up QuestDB to be prepared for the case where your original database or data is lost, or if your database or table is corrupted. Backups are also required to create [replica instances](https://questdb.com/docs/high-availability/setup/)
in QuestDB Enterprise.
Overview[](https://questdb.com/docs/operations/backup/#overview "Direct link to Overview")
--------------------------------------------------------------------------------------------
QuestDB supports two backup methods:
* **Built-in incremental backup** (Enterprise only): Fully automated—configure once, set a schedule, and backups run automatically. Supports point-in-time recovery to any backup timestamp.
* **[Manual checkpoint backup](https://questdb.com/docs/operations/backup/#questdb-oss-manual-backups-with-checkpoints)
** (OSS and Enterprise): Relies on external tools to copy data. Requires manual coordination: `CHECKPOINT CREATE` → copy data with external tools → `CHECKPOINT RELEASE`. Works well with cloud disk snapshots (AWS EBS, Azure disks, etc.) where you simply trigger a snapshot. For on-premises environments without snapshot capabilities, you'll need external tools or custom scripts (e.g., rsync), which do not provide point-in-time recovery.
QuestDB Enterprise: built-in backup and restore[](https://questdb.com/docs/operations/backup/#questdb-enterprise-built-in-backup-and-restore "Direct link to QuestDB Enterprise: built-in backup and restore")
----------------------------------------------------------------------------------------------------------------------------------------------------------------------------------------------------------------
QuestDB Enterprise provides an incremental backup system that stores your data in object storage. Backups are incremental—only changed data is uploaded—making them fast and bandwidth-efficient. You can monitor progress and check for errors while backups run.
### Prerequisites[](https://questdb.com/docs/operations/backup/#prerequisites "Direct link to Prerequisites")
#### License[](https://questdb.com/docs/operations/backup/#license "Direct link to License")
Built-in backup requires QuestDB Enterprise. This feature is not available in the open source version. See [QuestDB Enterprise](https://questdb.com/enterprise/)
for licensing information.
#### Supported storage backends[](https://questdb.com/docs/operations/backup/#supported-storage-backends "Direct link to Supported storage backends")
Backup supports the following storage backends:
* **Amazon S3** and S3-compatible storage (MinIO, etc.)
* **Azure Blob Storage**
* **Google Cloud Storage (GCS)**
* **Filesystem** - Local or network-attached storage (NFS, etc.). Backup is not sensitive to the underlying filesystem type.
See [Configure object storage](https://questdb.com/docs/high-availability/setup/#1-configure-object-storage)
for connection string formats.
#### Permissions[](https://questdb.com/docs/operations/backup/#permissions "Direct link to Permissions")
The backup process requires write access to the target storage. Authentication is optional—you can use instance credentials (IAM roles, managed identities) or provide explicit credentials in the connection string.
#### Network[](https://questdb.com/docs/operations/backup/#network "Direct link to Network")
Network requirements depend on your chosen storage backend. Ensure QuestDB can reach the storage endpoint on the appropriate port (typically HTTPS/443 for cloud storage).
#### Storage capacity[](https://questdb.com/docs/operations/backup/#storage-capacity "Direct link to Storage capacity")
Plan your backup storage before starting. A safe estimate is **2× your uncompressed database size**. See [Estimate backup storage](https://questdb.com/docs/operations/backup/#estimate-backup-storage)
for detailed calculations.
### Quick start[](https://questdb.com/docs/operations/backup/#quick-start "Direct link to Quick start")
Minimal configuration to enable backups:
backup.enabled=truebackup.object.store=s3::bucket=my-bucket;region=eu-west-1;access_key_id=...;secret_access_key=...;
Then run `BACKUP DATABASE;` in SQL. See [Run a backup](https://questdb.com/docs/operations/backup/#run-a-backup)
for details.
### Configure[](https://questdb.com/docs/operations/backup/#configure "Direct link to Configure")
#### Backup retention[](https://questdb.com/docs/operations/backup/#backup-retention "Direct link to Backup retention")
Control how many backups to keep before automatic cleanup removes older ones:
backup.cleanup.keep.latest.n=7
#### Filesystem backups[](https://questdb.com/docs/operations/backup/#filesystem-backups "Direct link to Filesystem backups")
For local testing or air-gapped environments, you can back up to a local filesystem path instead of cloud object storage:
backup.object.store=fs::root=/mnt/backups;atomic_write_dir=/mnt/backups/atomic;
The `atomic_write_dir` parameter is required for filesystem backends and specifies a directory for atomic write operations during backup.
#### Configuration reference[](https://questdb.com/docs/operations/backup/#configuration-reference "Direct link to Configuration reference")
| Property | Description | Default |
| --- | --- | --- |
| `backup.enabled` | Enable backup functionality | `false` |
| `backup.object.store` | Object store connection string | None (required) |
| `backup.schedule.cron` | Cron expression for [scheduled backups](https://questdb.com/docs/operations/backup/#scheduled-backups) | None (manual only) |
| `backup.schedule.tz` | [IANA timezone](https://en.wikipedia.org/wiki/List_of_tz_database_time_zones)
for cron [schedule](https://questdb.com/docs/operations/backup/#scheduled-backups) | `UTC` |
| `backup.cleanup.keep.latest.n` | Number of backups to retain | `5` |
| `backup.compression.level` | Compression level (1-22) | `5` |
| `backup.compression.threads` | Threads for compression | CPU count |
| `backup.enable.partition.hashes` | Compute BLAKE3 hashes during backup | `false` |
| `backup.verify.partition.hashes` | Verify hashes during restore | `false` |
### Run a backup[](https://questdb.com/docs/operations/backup/#run-a-backup "Direct link to Run a backup")
Once configured, you can run a backup at any time using the following command:
Backup database
BACKUP DATABASE;
Example output:
| backup\_timestamp |
| --- |
| 2024-08-24T12:34:56.789123Z |
The backup captures the committed database state at the moment the command executes. In-flight transactions are not included.
### Monitor and abort[](https://questdb.com/docs/operations/backup/#monitor-and-abort "Direct link to Monitor and abort")
You can monitor backup progress and history using the `backups()` table function:
Backup history
SELECT * FROM backups();
Example output:
| status | progress\_percent | start\_ts | end\_ts | backup\_error | cleanup\_error |
| --- | --- | --- | --- | --- | --- |
| backup complete | 100 | 2025-07-30T12:49:30.554262Z | 2025-07-30T16:19:48.554262Z | | |
| backup complete | 100 | 2025-08-06T14:15:22.882130Z | 2025-08-06T17:09:57.882130Z | | |
| backup failed | 35 | 2025-08-20T11:58:03.675219Z | 2025-08-20T12:14:07.675219Z | connection error | |
| backup in progress | 10 | 2025-08-27T15:42:18.281907Z | | | |
| cleanup in progress | 100 | 2025-08-13T13:37:41.103729Z | 2025-08-13T16:44:25.103729Z | | |
Status values:
| Status | Meaning | Action |
| --- | --- | --- |
| `backup in progress` | Backup is currently running | Wait or run `BACKUP ABORT` |
| `backup complete` | Backup finished successfully | None required |
| `backup failed` | Backup encountered an error | Check `backup_error` column |
| `cleanup in progress` | Old backup data is being removed | Wait for completion |
| `cleanup complete` | Cleanup finished successfully | None required |
| `cleanup failed` | Cleanup encountered an error | Check `cleanup_error` column |
To abort a running backup:
Abort backup
BACKUP ABORT;
### Scheduled backups[](https://questdb.com/docs/operations/backup/#scheduled-backups "Direct link to Scheduled backups")
You can configure automatic scheduled backups using cron syntax. The example below runs a backup every day at midnight UTC.
backup.schedule.cron=0 0 * * *backup.schedule.tz=UTC
#### Cron format[](https://questdb.com/docs/operations/backup/#cron-format "Direct link to Cron format")
QuestDB uses the standard **5-field cron format**:
FIELD VALUES SPECIAL CHARS┌──────────── minute ───────── 0-59 ───────────── * , - /│ ┌────────── hour ─────────── 0-23 ───────────── * , - /│ │ ┌──────── day of month ─── 1-31 ───────────── * , - / L W│ │ │ ┌────── month ────────── 1-12 or JAN-DEC ── * , - /│ │ │ │ ┌──── day of week ──── 0-7 or SUN-SAT ─── * , - / L #│ │ │ │ │* * * * *
Special character meanings:
* `*` — matches any value
* `,` — separates multiple values (e.g., `1,15` for 1st and 15th)
* `-` — defines a range (e.g., `1-5` for Monday through Friday)
* `/` — specifies intervals (e.g., `*/15` for every 15 units)
* `L` — last day of the month, or last specific weekday (e.g., `5L` = last Friday)
* `W` — nearest weekday to the given day (e.g., `15W` = nearest weekday to the 15th)
* `#` — nth weekday of the month (e.g., `5#3` = third Friday)
For day-of-week, 0 and 7 both represent Sunday; 1-6 represent Monday through Saturday.
tip
Use [crontab.guru](https://crontab.guru/)
to build and validate your cron expressions.
#### Timezone[](https://questdb.com/docs/operations/backup/#timezone "Direct link to Timezone")
The `backup.schedule.tz` property accepts any valid [IANA timezone name](https://en.wikipedia.org/wiki/List_of_tz_database_time_zones)
(e.g., `America/New_York`, `Europe/London`) or `UTC`.
If `backup.schedule.tz` not specified, the default is `UTC`.
#### Resetting schedule without restart[](https://questdb.com/docs/operations/backup/#resetting-schedule-without-restart "Direct link to Resetting schedule without restart")
The `backup.schedule.cron` and `backup.schedule.tz` settings can be modified in `server.conf` and hot-reloaded without restarting the server:
SELECT reload_config();
You can also use this to enable and disable the schedule by adding or commenting out the `backup.schedule.cron` config setting.
### Backup instance name[](https://questdb.com/docs/operations/backup/#backup-instance-name "Direct link to Backup instance name")
Each QuestDB instance has a backup instance name (three random words like `gentle-forest-orchid`). This name is generated on the first backup and organizes backups in the object store under `backup//`.
To find your instance name, run:
SELECT backup_instance_name;
Returns `null` if no backup has been run yet.
### Replication WAL cleanup integration[](https://questdb.com/docs/operations/backup/#replication-wal-cleanup-integration "Direct link to Replication WAL cleanup integration")
When replication is enabled, the [WAL cleaner](https://questdb.com/docs/high-availability/wal-cleanup/)
uses backup manifests to determine which replicated WAL data in object storage can be safely deleted. By default, the cleaner retains replication data for as many backups as your [`backup.cleanup.keep.latest.n`](https://questdb.com/docs/operations/backup/#backup-retention)
setting (default 5) and deletes everything older. No additional configuration is required — enabling backups on a replicated instance is sufficient.
### Performance characteristics[](https://questdb.com/docs/operations/backup/#performance-characteristics "Direct link to Performance characteristics")
Backup is designed to prioritize database availability over backup speed. Key characteristics:
* **Pressure-sensitive**: Backup automatically throttles itself to avoid overwhelming the database instance during normal operations
* **Batch uploads**: Data uploads in batches rather than continuously - you may see surges of activity followed by quieter periods in logs
* **Compressed**: Data is compressed before upload to reduce transfer time and storage costs
* **Multi-threaded**: Backup uses multiple threads but is deliberately throttled to maintain instance reliability
Backup duration depends on data size. Large databases (1TB+) may take several hours for a full initial backup. Subsequent incremental backups are faster as only changed data is uploaded.
### Estimate backup storage[](https://questdb.com/docs/operations/backup/#estimate-backup-storage "Direct link to Estimate backup storage")
A safe estimate for total backup storage is **2× your uncompressed database size on disk**. This provides headroom for the full backup plus incremental history and edge cases.
#### How storage accumulates[](https://questdb.com/docs/operations/backup/#how-storage-accumulates "Direct link to How storage accumulates")
| Backup type | What's uploaded | Estimated size |
| --- | --- | --- |
| Initial (full) | Entire database | DB size ÷ 4 (default compression) |
| Incremental | Changed partitions only | Changed data ÷ 4 |
Total storage = full backup + (average incremental × retention count)
The default compression level (5) achieves approximately 4× reduction. Higher `backup.compression.level` values (up to 22) improve compression at the cost of CPU time.
#### Partition-level granularity[](https://questdb.com/docs/operations/backup/#partition-level-granularity "Direct link to Partition-level granularity")
Partitions are the smallest backup unit. Any modification to a partition—even a single row or column update—causes the entire partition to be re-uploaded in the next incremental backup.
This means:
* **Append-only workloads** (typical time-series): Very efficient. Only the latest partition changes between backups.
* **Cross-partition updates**: Less efficient. An `UPDATE` without a constraining `WHERE` clause touches all partitions, causing them all to be re-uploaded.
* **Schema changes**: Column type changes cause affected partitions to be re-uploaded.
#### Example calculation[](https://questdb.com/docs/operations/backup/#example-calculation "Direct link to Example calculation")
A 500 GB database with daily backups, 7-day retention, and ~5% daily change:
| Component | Calculation | Size |
| --- | --- | --- |
| Full backup | 500 GB ÷ 4 | 125 GB |
| Daily incremental | 25 GB ÷ 4 | ~6 GB |
| 7 incrementals | 6 GB × 7 | ~42 GB |
| **Total** | | **~170 GB** |
In this example, actual usage (~170 GB) is well under the 2× planning estimate (1 TB). The 2× rule is intentionally conservative—use it for initial capacity planning before you know your actual change patterns, then refine based on observed usage.
#### Check actual usage[](https://questdb.com/docs/operations/backup/#check-actual-usage "Direct link to Check actual usage")
To verify your estimates against actual storage, browse your backup data in the object store. Backups are stored under `backup//`.
To find your instance name, see [Backup instance name](https://questdb.com/docs/operations/backup/#backup-instance-name)
.
### Limitations[](https://questdb.com/docs/operations/backup/#limitations "Direct link to Limitations")
* **Database-wide only**: Backup captures the entire database. You cannot exclude tables or backup selected tables individually. Every backup includes all user tables, materialized views, and metadata.
* **One backup at a time**: Only one backup can run at any given time. Starting a new backup while one is running will return an error.
* **Primary and replica backups are separate**: Each QuestDB instance has its own [`backup_instance_name`](https://questdb.com/docs/operations/backup/#backup-instance-name)
, so backing up both a primary and its replica creates two separate backup sets in the object store. Typically, backing up the primary is sufficient since replicas sync from the same data.
* **Same backup object store for all nodes**: When using replication, all nodes in the cluster should use the same `backup.object.store` connection string. The [WAL cleaner](https://questdb.com/docs/high-availability/wal-cleanup/)
reads backup manifests from every node to determine what replication data can be safely deleted. If nodes back up to different object stores, the cleaner cannot see all manifests and will not trigger correctly.
### Backup validation[](https://questdb.com/docs/operations/backup/#backup-validation "Direct link to Backup validation")
Backup integrity is verified during restore, not as a standalone operation.
#### Verification during restore[](https://questdb.com/docs/operations/backup/#verification-during-restore "Direct link to Verification during restore")
QuestDB performs the following checks when restoring:
* **Transaction log verification**: Header, hash, and size validation of transaction log entries (always enabled)
* **Partition hash verification**: Optional BLAKE3 hash comparison for each file in every partition
* **Manifest validation**: Version compatibility and path safety checks
To enable partition hash verification, set these properties in `server.conf`:
backup.enable.partition.hashes=true # Compute hashes during backupbackup.verify.partition.hashes=true # Verify hashes during restore
If verification fails, restore stops immediately with an error such as: `hash mismatch [path=col1.d, expected=..., actual=...]`
#### What's not available[](https://questdb.com/docs/operations/backup/#whats-not-available "Direct link to What's not available")
* No standalone `VALIDATE BACKUP` command
* No dry-run restore option
* Object store integrity relies on the storage provider (e.g., S3's built-in checksums)
### Restore[](https://questdb.com/docs/operations/backup/#restore "Direct link to Restore")
Restore is fast—approximately 1.8 TiB can be restored in under 20 minutes, depending on network bandwidth and storage performance.
caution
Enterprise backup restore uses a different trigger file (`_backup_restore`) than OSS checkpoint restore (`_restore`). Do not confuse these two mechanisms.
To restore from an object store backup, create a `_backup_restore` file in the QuestDB install root. This is a properties file with the object store configuration and optional selector fields. On startup, QuestDB reads this file, selects the requested backup timestamp (or the latest available), downloads the backup data, and reconstructs the local database state.
backup.object.store=s3::bucket=my-bucket;region=eu-west-1;access_key_id=...;secret_access_key=...;backup.instance.name=gentle-forest-orchidbackup.restore.timestamp=2024-08-24T12:34:56.789123Z
Parameters:
| Parameter | Required | Description |
| --- | --- | --- |
| `backup.object.store` | Sometimes | Object store connection string; required unless already specified in `server.conf` |
| `backup.instance.name` | Sometimes | Required when multiple instance names exist in the bucket; see [Backup instance name](https://questdb.com/docs/operations/backup/#backup-instance-name) |
| `backup.restore.timestamp` | No | Timestamp for point-in-time recovery; omit for latest backup |
#### Point-in-time recovery[](https://questdb.com/docs/operations/backup/#point-in-time-recovery "Direct link to Point-in-time recovery")
Use `backup.restore.timestamp` to restore to a specific point in time. QuestDB finds the most recent successful backup at or before the specified timestamp.
To find available backup timestamps, query the source instance:
SELECT start_ts FROM backups() WHERE status = 'backup complete';
You can also specify an arbitrary timestamp (e.g., just before an accidental deletion). QuestDB restores from the nearest available backup before that time.
If no backup exists at or before the specified timestamp, QuestDB fails to start with the error: `backup restore error: No backup timestamp found that is <=`.
warning
Restore requires an empty database directory. If the target database already has data (indicated by the presence of `db/.data_id`), restore fails with: "The local database is not empty." Use a fresh installation directory for restore operations.
The QuestDB version performing the restore must have the same major version as the version that created the backup (e.g., 8.1.0 and 8.1.1 are compatible).
Restart QuestDB. If restore succeeds, `_backup_restore` is removed automatically.
#### Restore failure recovery[](https://questdb.com/docs/operations/backup/#restore-failure-recovery "Direct link to Restore failure recovery")
If restore fails, QuestDB creates artifacts to help diagnose and recover:
| Artifact | Purpose |
| --- | --- |
| `.restore_failed/` | Directory containing tables that failed to restore |
| `_restore_failed` | File listing the names of failed tables |
To recover from a failed restore:
1. Check the `.restore_failed/` directory and `_restore_failed` file for details
2. Investigate and fix the underlying issue (connectivity, permissions, etc.)
3. Remove both `.restore_failed/` directory and `_restore_failed` file
4. Restart QuestDB to retry the restore
If you see the error "Failed restore directory found", a previous restore attempt failed. Remove the artifacts listed above before restarting.
### Create a replica from a backup[](https://questdb.com/docs/operations/backup/#create-a-replica-from-a-backup "Direct link to Create a replica from a backup")
You can use a backup to bootstrap a new replica instance instead of relying solely on WAL replay from the object store. This is faster when the backup is more recent than the oldest available WAL data.
1. **Ensure the primary is running and has replication configured**
The primary must have `replication.role=primary` and a configured `replication.object.store`.
2. **Create a `_backup_restore` file on the new replica machine**
Point it to the same backup location used by the primary:
backup.object.store=s3::bucket=my-bucket;region=eu-west-1;access_key_id=...;secret_access_key=...;backup.instance.name=gentle-forest-orchid
3. **Configure the replica**
Set `replication.role=replica` and ensure `replication.object.store` points to the same object store as the primary.
4. **Start the replica**
QuestDB restores from the backup first, then switches to WAL replay to catch up with the primary.
For more details on replication setup, see the [replication guide](https://questdb.com/docs/high-availability/setup/)
.
### Troubleshooting[](https://questdb.com/docs/operations/backup/#troubleshooting "Direct link to Troubleshooting")
If you encounter errors during backup or restore:
* **ER007 - Data ID mismatch**: The local database and object store have different Data IDs. See [error code ER007](https://questdb.com/docs/troubleshooting/error-codes/#er007)
for resolution steps.
* **Backup stuck at 0%**: Check network connectivity to the object store and verify credentials are correct.
* **"Failed restore directory found"**: A previous restore attempt failed. Remove the `.restore_failed/` directory and `_restore_failed` file, then restart. See [Restore failure recovery](https://questdb.com/docs/operations/backup/#restore-failure-recovery)
.
* **"The local database is not empty"**: Restore requires an empty database directory. Use a fresh installation or remove the existing `db/` directory.
QuestDB OSS: manual backups with checkpoints[](https://questdb.com/docs/operations/backup/#questdb-oss-manual-backups-with-checkpoints "Direct link to QuestDB OSS: manual backups with checkpoints")
-------------------------------------------------------------------------------------------------------------------------------------------------------------------------------------------------------
The OSS workflow relies on the `CHECKPOINT` mode and external snapshot or file copy tools. When in `CHECKPOINT` mode, QuestDB remains available for reads and writes, but some housekeeping tasks are paused. This is safe in principle, but database writes may consume more space than normal. When the database exits `CHECKPOINT` mode, it resumes the housekeeping tasks and reclaims disk space.
You must create a copy of the database using a tool of your choice. These are some suggestions:
* Cloud snapshot, e.g. EBS volume snapshot on AWS, Premium SSD Disk snapshot on Azure etc
* On-prem backup tools and software you typically use
* Basic command line tools, such as `cp` or `rsync`
### Data backup checklist[](https://questdb.com/docs/operations/backup/#data-backup-checklist "Direct link to Data backup checklist")
Before backing up QuestDB, consider these items:
#### Pick a good time[](https://questdb.com/docs/operations/backup/#pick-a-good-time "Direct link to Pick a good time")
We recommend that teams take a database backup when the database write load is at its lowest. If the database is under constant write load, a helpful workaround is to ensure that the disk has at least 50% free space. The more free space, the safer it is to enter the checkpoint mode.
#### Determine backup frequency[](https://questdb.com/docs/operations/backup/#determine-backup-frequency "Direct link to Determine backup frequency")
We recommend daily backups for disaster recovery purposes.
#### Choose your data copy method[](https://questdb.com/docs/operations/backup/#choose-your-data-copy-method "Direct link to Choose your data copy method")
When choosing the right copy method, consider the following goals:
* Minimize the time QuestDB spends in checkpoint mode
* Ensure that the copy time remains sustainable as the database grows
QuestDB backup lends itself relatively well to all types of differential data copying. Due to time partitioning, older data is often unmodified, at both block and file levels.
##### Cloud snapshots[](https://questdb.com/docs/operations/backup/#cloud-snapshots "Direct link to Cloud snapshots")
If you're using cloud disks, such as EBS on AWS, SSD on Azure, or similar, we strongly recommend using their existing cloud _snapshot_ infrastructure. The advantages of this approach are that:
* Cloud snapshots minimize the time QuestDB spends in checkpoint mode
* Cloud snapshots are differential and can be restored cleanly
See the following guides for volume snapshot creation on the following cloud platforms:
* [AWS](https://docs.aws.amazon.com/AWSEC2/latest/UserGuide/ebs-creating-snapshot.html)
- creating EBS snapshots
* [Azure](https://docs.microsoft.com/en-us/azure/virtual-machines/snapshot-copy-managed-disk?tabs=portal)
- creating snapshots of a virtual hard disk
* [GCP](https://cloud.google.com/compute/docs/disks/create-snapshots)
- working with persistent disk snapshots
Cloud snapshot-based systems usually break down their backup process into two steps:
1. Take a snapshot
2. Back up the snapshot
**Exit the `CHECKPOINT` mode as soon as the snapshotting stage is complete.**
Specifically, exit checkpoint mode at the following snapshot stage:
| Cloud Provider | State | Exit checkpoint mode |
| --- | --- | --- |
| **Google Cloud** (GCP) | RUNNING (UPLOADING) | When RUNNING substate changes from CREATING to UPLOADING |
| **Amazon Web Services** (AWS) | PENDING | When status is PENDING |
| **Microsoft Azure** | PENDING | Before the longer running "CREATING" stage |
##### Volume snapshots[](https://questdb.com/docs/operations/backup/#volume-snapshots "Direct link to Volume snapshots")
When the database is on-prem, we recommend using existing file system backup tools. For example, volume snapshots can be taken via [LVM](https://docs.redhat.com/en/documentation/red_hat_enterprise_linux/7/html/logical_volume_manager_administration/lvm_overview)
.
##### File copy[](https://questdb.com/docs/operations/backup/#file-copy "Direct link to File copy")
If filesystem or volume snapshots are not available, consider using a file copy method to back up the QuestDB server root directory. We recommend using a copy tool that can skip copying files based on the modification date. One such popular tool to accomplish this is [rsync](https://linux.die.net/man/1/rsync)
.
### Steps in the backup procedure[](https://questdb.com/docs/operations/backup/#steps-in-the-backup-procedure "Direct link to Steps in the backup procedure")
While explaining the steps, we'll assume the database root directory is `/var/lib/questdb`.
#### Enter checkpoint mode[](https://questdb.com/docs/operations/backup/#enter-checkpoint-mode "Direct link to Enter checkpoint mode")
To enter the checkpoint mode:
Creating a Checkpoint
CHECKPOINT CREATE
You can create only one checkpoint. Attempting to create a second checkpoint will fail.
#### Check checkpoint status[](https://questdb.com/docs/operations/backup/#check-checkpoint-status "Direct link to Check checkpoint status")
You can double-check at any time that the database is in the checkpoint mode:
Checking Checkpoint Status
SELECT * FROM checkpoint_status();
Having confirmed that QuestDB has entered the checkpoint mode, we now create the backup.
#### Take a snapshot or begin file copy[](https://questdb.com/docs/operations/backup/#take-a-snapshot-or-begin-file-copy "Direct link to Take a snapshot or begin file copy")
After a checkpoint is created and before it is released, you may safely access the file system using tools external to the database instance. In other words, you're now OK to begin your backup.
If your data copy method is a volume snapshot, you can exit the checkpoint mode as soon as the snapshot is taken (which takes a minute or two).
**Make sure to back up the entire server root directory, including the `db`, `snapshot`, and all other directories.**
File copy may take longer to back up files compared to snapshot. You will have to wait until the data transfer is fully complete before exiting checkpoint mode.
**It is very important to exit the checkpoint mode regardless of whether the copy operation succeeded or failed!**
#### Exit checkpoint mode[](https://questdb.com/docs/operations/backup/#exit-checkpoint-mode "Direct link to Exit checkpoint mode")
With your backup complete, exit checkpoint mode:
Releasing a Checkpoint
CHECKPOINT RELEASE
This concludes the backup process.
Now, with our additional copy, we're ready to restore QuestDB.
### Restore to a saved checkpoint[](https://questdb.com/docs/operations/backup/#restore-to-a-saved-checkpoint "Direct link to Restore to a saved checkpoint")
Restoring from a local checkpoint will restore the entire database.
caution
OSS checkpoint restore uses the `_restore` trigger file. This is different from Enterprise backup restore which uses `_backup_restore`.
Follow these steps:
* Ensure your QuestDB version matches the one that did the backup
* Restore QuestDB root directory contents (`/var/lib/questdb/`) from the backup
* Touch the `_restore` file
* Start the database using the restored root directory
#### Database versions[](https://questdb.com/docs/operations/backup/#database-versions "Direct link to Database versions")
Restoring data is only possible if the backup and restore QuestDB versions have the same major version number, for example: `8.1.0` and `8.1.1` are compatible. `8.1.0` and `7.5.1` are not compatible.
#### Restore the root directory[](https://questdb.com/docs/operations/backup/#restore-the-root-directory "Direct link to Restore the root directory")
When using cloud tools, create a new disk from the snapshot. The entire disk contents of the original database will be available when the compute instance starts.
warning
**AWS EBS lazy loading**: By default, EBS volumes created from snapshots load data lazily (on first access), which can cause slow reads after restore. To mitigate this:
* **Option 1**: Enable [Fast Snapshot Restore (FSR)](https://docs.aws.amazon.com/ebs/latest/userguide/ebs-fast-snapshot-restore.html)
on the snapshot before creating the volume
* **Option 2**: Pre-warm the volume by reading all blocks after restore:
sudo fio --filename=/dev/nvme1n1 --rw=read --bs=1M --iodepth=32 \ --ioengine=libaio --direct=1 --name=volume-initialize
This issue may also affect other cloud providers with similar snapshot behavior.
If you are not using cloud tools, you have to make sure that you restore the root from the backup using your own tools of choice!
#### The trigger file[](https://questdb.com/docs/operations/backup/#the-trigger-file "Direct link to The trigger file")
When you are starting the database from the backup for the first time, the database must perform a restore procedure. This ensures the data is consistent and can be read and written. It only takes place on startup, and requires a specific blank file to exist as the indication of user intent.
Touch the `_restore` file in the root directory. The following command will do the trick:
touch /var/lib/questdb/_restore
#### Start the database[](https://questdb.com/docs/operations/backup/#start-the-database "Direct link to Start the database")
Start the database using the root directory as usual. When the `_restore` file is present, the database will perform the restore procedure. There are two possible outcomes:
* Restore is successful: the database continues to run normally and is ready to use; the `_restore` file is removed to prevent the same procedure running twice
* Restore fails: the database exits and the `_restore` file remains in place. An error message appears in `stderr`. If it can be resolved, starting the database again will retry the restore procedure
Further reading[](https://questdb.com/docs/operations/backup/#further-reading "Direct link to Further reading")
-----------------------------------------------------------------------------------------------------------------
* [`BACKUP` SQL reference](https://questdb.com/docs/query/sql/backup/)
- Enterprise backup command syntax
* [`CHECKPOINT` SQL reference](https://questdb.com/docs/query/sql/checkpoint/)
- OSS checkpoint command syntax
* [Overview](https://questdb.com/docs/operations/backup/#overview)
* [QuestDB Enterprise: built-in backup and restore](https://questdb.com/docs/operations/backup/#questdb-enterprise-built-in-backup-and-restore)
* [Prerequisites](https://questdb.com/docs/operations/backup/#prerequisites)
* [Quick start](https://questdb.com/docs/operations/backup/#quick-start)
* [Configure](https://questdb.com/docs/operations/backup/#configure)
* [Run a backup](https://questdb.com/docs/operations/backup/#run-a-backup)
* [Monitor and abort](https://questdb.com/docs/operations/backup/#monitor-and-abort)
* [Scheduled backups](https://questdb.com/docs/operations/backup/#scheduled-backups)
* [Backup instance name](https://questdb.com/docs/operations/backup/#backup-instance-name)
* [Replication WAL cleanup integration](https://questdb.com/docs/operations/backup/#replication-wal-cleanup-integration)
* [Performance characteristics](https://questdb.com/docs/operations/backup/#performance-characteristics)
* [Estimate backup storage](https://questdb.com/docs/operations/backup/#estimate-backup-storage)
* [Limitations](https://questdb.com/docs/operations/backup/#limitations)
* [Backup validation](https://questdb.com/docs/operations/backup/#backup-validation)
* [Restore](https://questdb.com/docs/operations/backup/#restore)
* [Create a replica from a backup](https://questdb.com/docs/operations/backup/#create-a-replica-from-a-backup)
* [Troubleshooting](https://questdb.com/docs/operations/backup/#troubleshooting)
* [QuestDB OSS: manual backups with checkpoints](https://questdb.com/docs/operations/backup/#questdb-oss-manual-backups-with-checkpoints)
* [Data backup checklist](https://questdb.com/docs/operations/backup/#data-backup-checklist)
* [Steps in the backup procedure](https://questdb.com/docs/operations/backup/#steps-in-the-backup-procedure)
* [Restore to a saved checkpoint](https://questdb.com/docs/operations/backup/#restore-to-a-saved-checkpoint)
* [Further reading](https://questdb.com/docs/operations/backup/#further-reading)
---
# Metrics View | QuestDB
On this page
The **Metrics View** provides real-time monitoring capabilities for your QuestDB instance. It displays interactive charts and widgets that help you track database performance, WAL operations, and table-specific metrics.
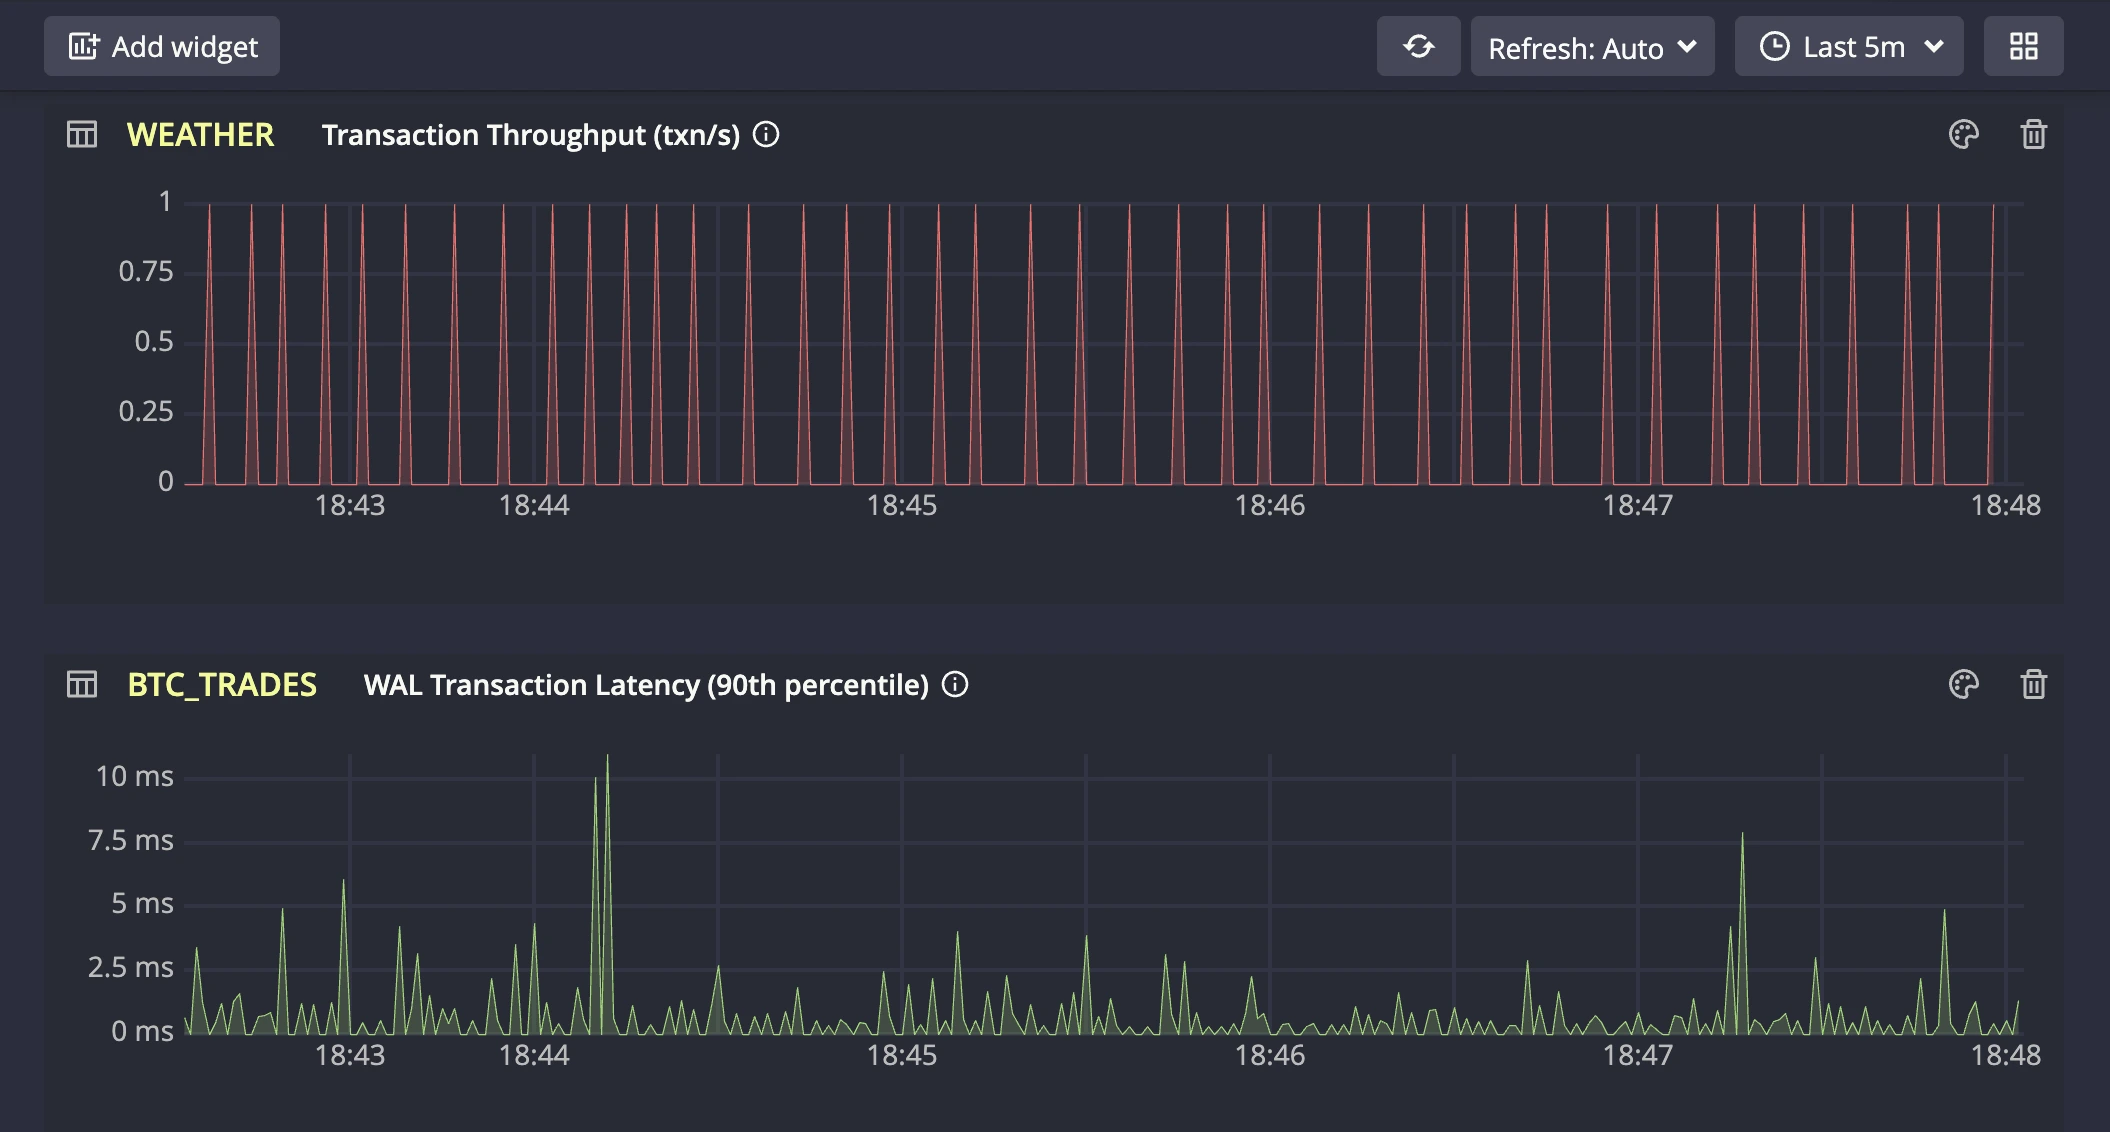
Prerequisites[](https://questdb.com/docs/getting-started/web-console/metrics-view/#prerequisites "Direct link to Prerequisites")
----------------------------------------------------------------------------------------------------------------------------------
To use the Metrics View, you must enable telemetry on your QuestDB server:
### Server Configuration[](https://questdb.com/docs/getting-started/web-console/metrics-view/#server-configuration "Direct link to Server Configuration")
Set the following in your `server.conf` file:
telemetry.enabled=true
### Environment Variable[](https://questdb.com/docs/getting-started/web-console/metrics-view/#environment-variable "Direct link to Environment Variable")
Alternatively, set the environment variable:
QDB_TELEMETRY_ENABLED=true
After making these changes, restart your QuestDB server to enable telemetry collection.
Adding a Metrics Tab[](https://questdb.com/docs/getting-started/web-console/metrics-view/#adding-a-metrics-tab "Direct link to Adding a Metrics Tab")
-------------------------------------------------------------------------------------------------------------------------------------------------------
Click the **"Add metrics"** button (chart icon) in the [Schema Explorer toolbar](https://questdb.com/docs/getting-started/web-console/schema-explorer/#toolbar)
. A new metrics tab will automatically open with the default interface.
info
Metrics tabs are visually distinguished by their chart icon and blue color scheme in the tab bar. The "+" button in the tab bar creates new SQL editor tabs, not metrics tabs.
Toolbar[](https://questdb.com/docs/getting-started/web-console/metrics-view/#toolbar "Direct link to Toolbar")
----------------------------------------------------------------------------------------------------------------
The Metrics View toolbar provides comprehensive controls for managing your monitoring experience.

* **Add Widget**: Opens a modal to select the type of metric for the widget
* **Refresh All Widgets**: Manually refreshes all widgets to get the latest data
* **Refresh Rate**: Choose automatic refresh intervals:
* **Off**: No automatic refresh
* **1s, 5s, 10s, 30s, 1m**: Fixed refresh intervals
* **Auto**: Intelligent refresh rate based on selected time range
* **Date/Time Picker**: Select custom time ranges for data analysis:
* **Predefined ranges**: Last 5m, 15m, 1h, 3h, 6h, 12h, 24h, 3 days, 7 days
* **Custom ranges**: Select specific start and end times
* **View Mode Toggle**: Switch between Grid and List layouts
Each widget in the Metrics View provides comprehensive customization options.
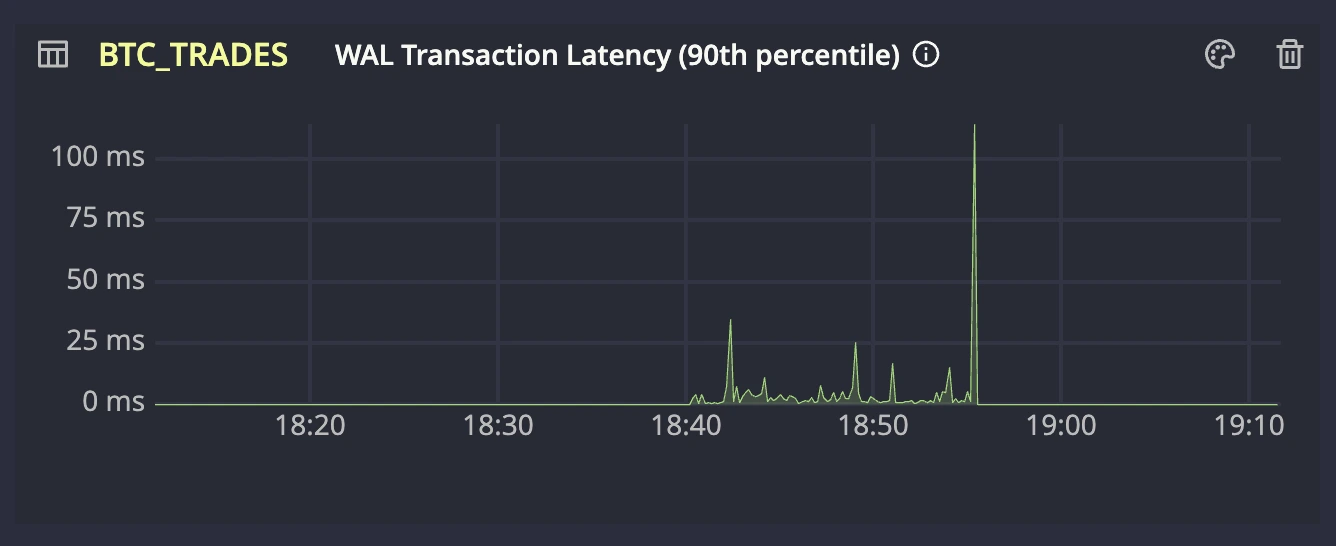
* **Table Name**: Input field for selecting which table to monitor
* **Color Customization**: Changes chart line colors for better visualization
* **Interactive Charts**: Allows you to explore data by moving the mouse over the chart
* **Remove Widget**: Deletes widgets that are no longer needed
Available Metrics[](https://questdb.com/docs/getting-started/web-console/metrics-view/#available-metrics "Direct link to Available Metrics")
----------------------------------------------------------------------------------------------------------------------------------------------
The Metrics View supports several types of widgets, each providing specific insights:
### WAL Transaction Throughput (txn/s)[](https://questdb.com/docs/getting-started/web-console/metrics-view/#wal-transaction-throughput-txns "Direct link to WAL Transaction Throughput (txn/s)")
This metric monitors the rate at which transactions are applied to tables. Performance is influenced by:
* Batch merging efficiency (multiple transactions processed together)
* Data ingestion rate from source
* Storage performance and contention
* Concurrent writes across multiple tables sharing resources
Compare against data source metrics to distinguish between ingestion bottlenecks and system performance limitations.
### WAL Row Throughput (rows/s)[](https://questdb.com/docs/getting-started/web-console/metrics-view/#wal-row-throughput-rowss "Direct link to WAL Row Throughput (rows/s)")
This metric displays rows processed per second during transaction merges. While similar to transaction throughput, this metric helps identify:
* Data density variations within transactions
* Processing overhead for row-heavy transactions
* Resource utilization from row-level operations
* Impact of row complexity on merge performance
Use alongside transaction throughput to understand the relationship between transaction size and processing efficiency.
### WAL Transaction Latency (90th percentile)[](https://questdb.com/docs/getting-started/web-console/metrics-view/#wal-transaction-latency-90th-percentile "Direct link to WAL Transaction Latency (90th percentile)")
This metric indicates the time required for data to become readable after being written. Higher latency may stem from:
* Large transaction sizes (refer to Avg Transaction Size metric if elevated)
* Unordered data requiring additional processing
* Write amplification (see dedicated metric if batch size is optimal)
* Storage I/O limitations or contention
Monitor this metric alongside related charts to identify the root cause of performance variations and optimize accordingly.
### Table Write Amplification[](https://questdb.com/docs/getting-started/web-console/metrics-view/#table-write-amplification "Direct link to Table Write Amplification")
This metric tracks the data write overhead during merge operations. Write amplification occurs when:
* Copy-on-write operations affect large data blocks
* Datasets are re-ingested for deduplication
* Data requires extensive rewriting during merges
Scale ranges from optimal (1x) to problematic (1000x+). High amplification typically indicates duplicate data ingestion or suboptimal data ordering patterns.
### Table Average Transaction Size (rows/txn)[](https://questdb.com/docs/getting-started/web-console/metrics-view/#table-average-transaction-size-rowstxn "Direct link to Table Average Transaction Size (rows/txn)")
This metric tracks the mean size of transactions processed through the database API. While the database is optimized for both small and large transactions, larger batch sizes generally lead to better database performance. Monitor this metric to understand your API's transaction patterns and identify opportunities for batch size optimization. Key aspects to observe:
* Transaction size trends and variations
* Any unusually small transactions that could be batched
* Consistency of batch sizes across time periods
info
Metrics View displays key metrics for quick monitoring in the Web Console. For comprehensive metrics and advanced monitoring capabilities, see [Prometheus monitoring and alerting](https://questdb.com/docs/integrations/other/prometheus/)
.
Best Practices[](https://questdb.com/docs/getting-started/web-console/metrics-view/#best-practices "Direct link to Best Practices")
-------------------------------------------------------------------------------------------------------------------------------------
* Limit the number of active widgets to maintain performance
* Use appropriate time ranges (shorter ranges for real-time monitoring)
* Remove unused widgets to reduce resource consumption
* Historical data queries may transfer more data for longer time ranges
This comprehensive monitoring capability helps you maintain optimal database performance and identify issues before they impact your applications.
* [Prerequisites](https://questdb.com/docs/getting-started/web-console/metrics-view/#prerequisites)
* [Server Configuration](https://questdb.com/docs/getting-started/web-console/metrics-view/#server-configuration)
* [Environment Variable](https://questdb.com/docs/getting-started/web-console/metrics-view/#environment-variable)
* [Adding a Metrics Tab](https://questdb.com/docs/getting-started/web-console/metrics-view/#adding-a-metrics-tab)
* [Toolbar](https://questdb.com/docs/getting-started/web-console/metrics-view/#toolbar)
* [Widget](https://questdb.com/docs/getting-started/web-console/metrics-view/#widget)
* [Available Metrics](https://questdb.com/docs/getting-started/web-console/metrics-view/#available-metrics)
* [WAL Transaction Throughput (txn/s)](https://questdb.com/docs/getting-started/web-console/metrics-view/#wal-transaction-throughput-txns)
* [WAL Row Throughput (rows/s)](https://questdb.com/docs/getting-started/web-console/metrics-view/#wal-row-throughput-rowss)
* [WAL Transaction Latency (90th percentile)](https://questdb.com/docs/getting-started/web-console/metrics-view/#wal-transaction-latency-90th-percentile)
* [Table Write Amplification](https://questdb.com/docs/getting-started/web-console/metrics-view/#table-write-amplification)
* [Table Average Transaction Size (rows/txn)](https://questdb.com/docs/getting-started/web-console/metrics-view/#table-average-transaction-size-rowstxn)
* [Best Practices](https://questdb.com/docs/getting-started/web-console/metrics-view/#best-practices)
---
# Node.js Client Documentation | QuestDB
On this page
QuestDB offers Node.js developers a dedicated client designed for efficient and high-performance data ingestion.
The Node.js client has solid benefits:
* **Automatic table creation**: No need to define your schema upfront.
* **Concurrent schema changes**: Seamlessly handle multiple data streams with on-the-fly schema modifications
* **Optimized batching**: Use strong defaults or curate the size of your batches
* **Health checks and feedback**: Ensure your system's integrity with built-in health monitoring
* **Automatic write retries**: Reuse connections and retry after interruptions
This quick start guide introduces the basic functionalities of the Node.js client, including setting up a connection, inserting data, and flushing data to QuestDB.

[View full docs](https://questdb.github.io/nodejs-questdb-client)
[View source code](https://github.com/questdb/nodejs-questdb-client)
info
This page focuses on our high-performance ingestion client, which is optimized for **writing** data to QuestDB. For retrieving data, we recommend using a [PostgreSQL-compatible Node.js library](https://questdb.com/docs/query/pgwire/nodejs/)
or our [HTTP query endpoint](https://questdb.com/docs/query/overview/#rest-http-api)
.
Requirements[](https://questdb.com/docs/ingestion/clients/nodejs/#requirements "Direct link to Requirements")
---------------------------------------------------------------------------------------------------------------
* Node.js v16 or newer.
* Assumes QuestDB is running. If it's not, refer to [the general quick start](https://questdb.com/docs/getting-started/quick-start/)
.
Client installation[](https://questdb.com/docs/ingestion/clients/nodejs/#client-installation "Direct link to Client installation")
------------------------------------------------------------------------------------------------------------------------------------
Install the QuestDB Node.js client via npm:
npm i -s @questdb/nodejs-client
Authentication[](https://questdb.com/docs/ingestion/clients/nodejs/#authentication "Direct link to Authentication")
---------------------------------------------------------------------------------------------------------------------
Passing in a configuration string with basic auth:
const { Sender } = require("@questdb/nodejs-client");const conf = "http::addr=localhost:9000;username=admin;password=quest;"const sender = Sender.fromConfig(conf); ...
Passing via the `QDB_CLIENT_CONF` env var:
export QDB_CLIENT_CONF="http::addr=localhost:9000;username=admin;password=quest;"
const { Sender } = require("@questdb/nodejs-client");const sender = Sender.fromEnv(); ...
When using QuestDB Enterprise, authentication can also be done via REST token. Please check the [RBAC docs](https://questdb.com/docs/security/rbac/#authentication)
for more info.
Basic insert[](https://questdb.com/docs/ingestion/clients/nodejs/#basic-insert "Direct link to Basic insert")
---------------------------------------------------------------------------------------------------------------
Example: inserting executed trades for cryptocurrencies.
Without authentication and using the current timestamp.
const { Sender } = require("@questdb/nodejs-client")async function run() { // create a sender using HTTP protocol const sender = Sender.fromConfig("http::addr=localhost:9000") // add rows to the buffer of the sender await sender .table("trades") .symbol("symbol", "ETH-USD") .symbol("side", "sell") .floatColumn("price", 2615.54) .floatColumn("amount", 0.00044) .atNow() // flush the buffer of the sender, sending the data to QuestDB // the buffer is cleared after the data is sent, and the sender is ready to accept new data await sender.flush() // close the connection after all rows ingested // unflushed data will be lost await sender.close()}run().then(console.log).catch(console.error)
In this case, the designated timestamp will be the one at execution time. Let's see now an example with an explicit timestamp, custom auto-flushing, and basic auth.
const { Sender } = require("@questdb/nodejs-client")async function run() { // create a sender using HTTP protocol const sender = Sender.fromConfig( "http::addr=localhost:9000;username=admin;password=quest;auto_flush_rows=100;auto_flush_interval=1000;", ) // Calculate the current timestamp. You could also parse a date from your source data. const timestamp = Date.now() // add rows to the buffer of the sender await sender .table("trades") .symbol("symbol", "ETH-USD") .symbol("side", "sell") .floatColumn("price", 2615.54) .floatColumn("amount", 0.00044) .at(timestamp, "ms") // add rows to the buffer of the sender await sender .table("trades") .symbol("symbol", "BTC-USD") .symbol("side", "sell") .floatColumn("price", 39269.98) .floatColumn("amount", 0.001) .at(timestamp, "ms") // flush the buffer of the sender, sending the data to QuestDB // the buffer is cleared after the data is sent, and the sender is ready to accept new data await sender.flush() // close the connection after all rows ingested // unflushed data will be lost await sender.close()}run().then(console.log).catch(console.error)
As you can see, both events now are using the same timestamp. We recommended to use the original event timestamps when ingesting data into QuestDB. Using the current timestamp hinder the ability to deduplicate rows which is [important for exactly-once processing](https://questdb.com/docs/ingestion/ilp/overview/#exactly-once-delivery-vs-at-least-once-delivery)
.
Decimal insertion[](https://questdb.com/docs/ingestion/clients/nodejs/#decimal-insertion "Direct link to Decimal insertion")
------------------------------------------------------------------------------------------------------------------------------
note
Decimal columns are available with ILP protocol version 3 (QuestDB v9.2.0+ and NodeJS client v4.2.0+).
HTTP/HTTPS connections negotiate this automatically (`protocol_version=auto`), while TCP/TCPS connections must opt in explicitly (for example `tcp::...;protocol_version=3`). Once on v3, you can choose between the textual helper and the binary helper.
caution
QuestDB does not auto-create decimal columns. Define them ahead of ingestion with `DECIMAL(precision, scale)` so the server knows how many digits to store, as explained in the [decimal data type](https://questdb.com/docs/query/datatypes/decimal/#creating-tables-with-decimals)
guide.
### Text literal (easy to use)[](https://questdb.com/docs/ingestion/clients/nodejs/#text-literal-easy-to-use "Direct link to Text literal (easy to use)")
import { Sender } from "@questdb/nodejs-client";async function runDecimalsText() { const sender = await Sender.fromConfig( "tcp::addr=localhost:9009;protocol_version=3", ); await sender .table("fx") .symbol("pair", "EURUSD") .decimalColumnText("mid", "1.234500") // keeps trailing zeros .atNow(); await sender.flush(); await sender.close();}
`decimalColumnText` accepts strings or numbers. String literals go through `validateDecimalText` and are written verbatim with the `d` suffix, so every digit (including trailing zeros or exponent form) is preserved. Passing a number is convenient, but JavaScript’s default formatting will drop insignificant zeros.
### Binary form (high throughput)[](https://questdb.com/docs/ingestion/clients/nodejs/#binary-form-high-throughput "Direct link to Binary form (high throughput)")
const sender = await Sender.fromConfig( "tcp::addr=localhost:9009;protocol_version=3",);const scale = 4;const notional = 12345678901234567890n; // represents 1_234_567_890_123_456.7890await sender .table("positions") .symbol("desk", "ny") .decimalColumnUnscaled("notional", notional, scale) .atNow();await sender.flush();await sender.close();
`decimalColumnUnscaled` converts `BigInt` inputs into the ILP v3 binary payload. You can also pass an `Int8Array` if you already have a two’s-complement, big-endian byte array. The scale must stay between 0 and 76, and payloads wider than 32 bytes are rejected up front. This binary path keeps rows compact, making it the preferred option for high-performance feeds.
Configuration options[](https://questdb.com/docs/ingestion/clients/nodejs/#configuration-options "Direct link to Configuration options")
------------------------------------------------------------------------------------------------------------------------------------------
The minimal configuration string needs to have the protocol, host, and port, as in:
http::addr=localhost:9000;
For all the extra options you can use, please check [the client docs](https://questdb.github.io/nodejs-questdb-client/classes/SenderOptions.html)
Alternatively, for a breakdown of Configuration string options available across all clients, see the [Configuration string](https://questdb.com/docs/ingestion/clients/configuration-string/)
page.
Next Steps[](https://questdb.com/docs/ingestion/clients/nodejs/#next-steps "Direct link to Next Steps")
---------------------------------------------------------------------------------------------------------
Please refer to the [ILP overview](https://questdb.com/docs/ingestion/ilp/overview/)
for details about transactions, error control, delivery guarantees, health check, or table and column auto-creation.
Dive deeper into the Node.js client capabilities, including TypeScript and Worker Threads examples, by exploring the [GitHub repository](https://github.com/questdb/nodejs-questdb-client)
.
To learn _The Way_ of QuestDB SQL, see the [Query & SQL Overview](https://questdb.com/docs/query/overview/)
.
Should you encounter any issues or have questions, the [Community Forum](https://community.questdb.com/)
is a vibrant platform for discussions.
* [Requirements](https://questdb.com/docs/ingestion/clients/nodejs/#requirements)
* [Client installation](https://questdb.com/docs/ingestion/clients/nodejs/#client-installation)
* [Authentication](https://questdb.com/docs/ingestion/clients/nodejs/#authentication)
* [Basic insert](https://questdb.com/docs/ingestion/clients/nodejs/#basic-insert)
* [Decimal insertion](https://questdb.com/docs/ingestion/clients/nodejs/#decimal-insertion)
* [Text literal (easy to use)](https://questdb.com/docs/ingestion/clients/nodejs/#text-literal-easy-to-use)
* [Binary form (high throughput)](https://questdb.com/docs/ingestion/clients/nodejs/#binary-form-high-throughput)
* [Configuration options](https://questdb.com/docs/ingestion/clients/nodejs/#configuration-options)
* [Next Steps](https://questdb.com/docs/ingestion/clients/nodejs/#next-steps)
---
# PowerBI | QuestDB
On this page
This guide demonstrates how to connect QuestDB with Microsoft PowerBI to create interactive data visualizations and dashboards.
Prerequisites[](https://questdb.com/docs/integrations/visualization/powerbi/#prerequisites "Direct link to Prerequisites")
----------------------------------------------------------------------------------------------------------------------------
* [QuestDB](https://questdb.com/docs/getting-started/quick-start/)
running locally or remotely
* [PowerBI Desktop](https://powerbi.microsoft.com/)
installed
Connection Setup[](https://questdb.com/docs/integrations/visualization/powerbi/#connection-setup "Direct link to Connection Setup")
-------------------------------------------------------------------------------------------------------------------------------------
QuestDB utilizes a fully featured PostgreSQL Wire Protocol (PGWire). As such, setup for PowerBI mirrors the standard PostgreSQL connection setup. The benefit is the performance profile of QuestDB, and its powerful time-series SQL extensions, with the simplicity of the PGWire protocol.
1. Open PowerBI Desktop
2. Click "Get Data" in the Home tab
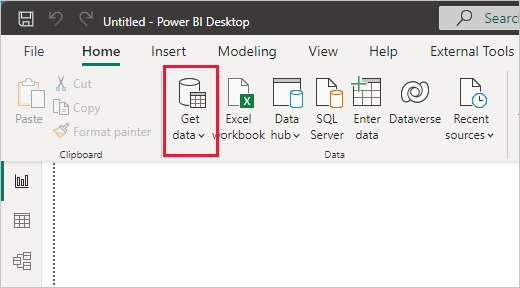
3. Select "Database" → "PostgreSQL"
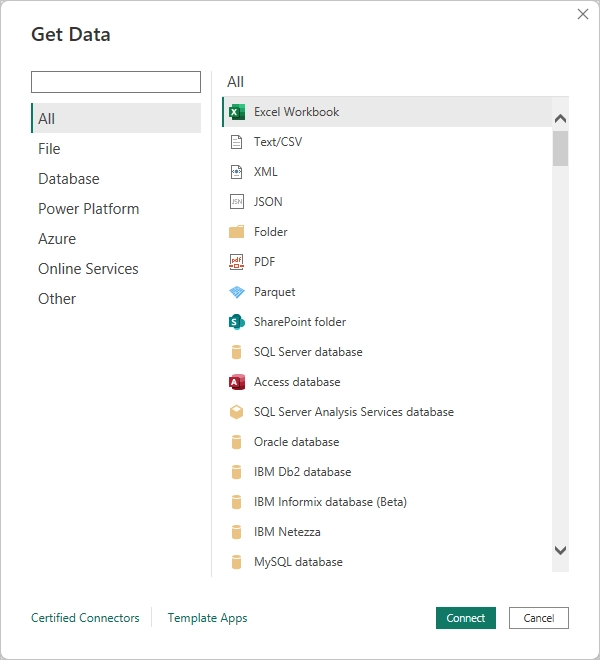
4. Enter your QuestDB connection details:
* Server: `localhost` (or your server address)
* Database: `qdb`
* Data Connectivity mode: `Import`
* Advanced options (optional):
* Port: `8812` (default QuestDB PGWire port)
* Command timeout: Adjust based on your query complexity
5. Select:
* Database authentication:
* User: `admin`
* Password: `quest`
6. Click "Connect"
Working with Data[](https://questdb.com/docs/integrations/visualization/powerbi/#working-with-data "Direct link to Working with Data")
----------------------------------------------------------------------------------------------------------------------------------------
1. In the Navigator window, select the tables you want to analyze
2. Click "Transform Data" to modify the data or "Load" to import it directly
3. Create visualizations by dragging fields onto the report canvas
4. Save your report and publish it to PowerBI Service if needed
Using Custom SQL[](https://questdb.com/docs/integrations/visualization/powerbi/#using-custom-sql "Direct link to Using Custom SQL")
-------------------------------------------------------------------------------------------------------------------------------------
To leverage QuestDB-specific features like `SAMPLE BY` and `LATEST ON`, you can use custom SQL:
1. In the "Get Data" dialog, click "Advanced options"
2. Enter your SQL query in the "SQL statement" field
3. Click "OK" to execute
> Remember, you must include a timestamp column when using functions like `SAMPLE BY`.
Here are some useful query examples:
-- Get 1-hour samples of trade pricesSELECT timestamp, avg(price) as avg_price, sum(amount) as volumeFROM tradesWHERE timestamp >= dateadd('d', -7, now())SAMPLE BY 1h;-- Get latest trade for each symbolSELECT * FROM tradesLATEST ON timestamp PARTITION BY symbol;-- Combine SAMPLE BY with multiple aggregationsSELECT timestamp, symbol, max(price) max_price, min(price) min_price, avg(price) avg_priceFROM tradesWHERE timestamp >= dateadd('M', -1, now())SAMPLE BY 1dALIGN TO CALENDAR;
Best Practices[](https://questdb.com/docs/integrations/visualization/powerbi/#best-practices "Direct link to Best Practices")
-------------------------------------------------------------------------------------------------------------------------------
* Leverage [timestamps](https://questdb.com/docs/concepts/timestamps-timezones/)
functions for time-series analysis
* Explore various [aggregation functions](https://questdb.com/docs/query/functions/aggregation/)
to suit your data needs
* Consider using powerful [window functions](https://questdb.com/docs/query/functions/window-functions/overview/)
to perform complex calculations
* For large datasets, use incremental refresh in PowerBI
Caveats[](https://questdb.com/docs/integrations/visualization/powerbi/#caveats "Direct link to Caveats")
----------------------------------------------------------------------------------------------------------
### Date Table Limitations[](https://questdb.com/docs/integrations/visualization/powerbi/#date-table-limitations "Direct link to Date Table Limitations")
QuestDB currently cannot be used as a source for PowerBI's "Mark as Date Table" feature. This means:
* You cannot mark QuestDB tables as date tables in PowerBI
* Some time intelligence functions in PowerBI may not be available
* If you need date table functionality, consider creating it in PowerBI or using another data source
tip
If you'd like QuestDB to support this feature, please add a 👍 to [this GitHub issue](https://github.com/questdb/questdb/issues/5208)
.
Troubleshooting[](https://questdb.com/docs/integrations/visualization/powerbi/#troubleshooting "Direct link to Troubleshooting")
----------------------------------------------------------------------------------------------------------------------------------
* If connection fails, verify your QuestDB instance is running and accessible
* Ensure PGWire is enabled in your QuestDB configuration
* `pg.enabled=true` - see [configuration](https://questdb.com/docs/configuration/overview/)
for more details
* Check that the port `8812` is open and not blocked by firewalls
* For timeout errors, adjust the command timeout in advanced options
Further Reading[](https://questdb.com/docs/integrations/visualization/powerbi/#further-reading "Direct link to Further Reading")
----------------------------------------------------------------------------------------------------------------------------------
* [QuestDB PGWire](https://questdb.com/docs/query/pgwire/overview/)
* [PowerBI Documentation](https://docs.microsoft.com/en-us/power-bi/)
* [Prerequisites](https://questdb.com/docs/integrations/visualization/powerbi/#prerequisites)
* [Connection Setup](https://questdb.com/docs/integrations/visualization/powerbi/#connection-setup)
* [Working with Data](https://questdb.com/docs/integrations/visualization/powerbi/#working-with-data)
* [Using Custom SQL](https://questdb.com/docs/integrations/visualization/powerbi/#using-custom-sql)
* [Best Practices](https://questdb.com/docs/integrations/visualization/powerbi/#best-practices)
* [Caveats](https://questdb.com/docs/integrations/visualization/powerbi/#caveats)
* [Date Table Limitations](https://questdb.com/docs/integrations/visualization/powerbi/#date-table-limitations)
* [Troubleshooting](https://questdb.com/docs/integrations/visualization/powerbi/#troubleshooting)
* [Further Reading](https://questdb.com/docs/integrations/visualization/powerbi/#further-reading)
---
# Profiling | QuestDB
On this page
Profiling lets you see what's happening inside the database at the code level - which functions are consuming CPU time, where memory is being allocated, and what's blocking threads. This is an advanced diagnostic technique. Most users will never need it; query plans, metrics, and logs are usually sufficient for understanding performance.
However, when you're facing issues that can't be explained by the usual tools - unexplained CPU spikes, mysterious latency, or behavior that doesn't match what metrics suggest - profiling reveals the internal picture.
QuestDB embeds [async-profiler](https://github.com/async-profiler/async-profiler)
in the Linux x86\_64 distribution, with convenience commands built into `questdb.sh`.
There are two profiling approaches:
* **Ad-hoc profiling** produces a single flame graph for a specific time window. Use this when you can reproduce an issue on demand - start profiling, trigger the problem, stop profiling, and analyze the result.
* **Continuous profiling** records to JFR files in the background, which can later be converted to heatmaps. Heatmaps show activity over time, letting you spot anomalies and zoom into specific moments to generate flame graphs. Use this when problems occur unpredictably - the profiler is always running, so you can investigate after the fact.
This page covers:
* [Ad-hoc profiling](https://questdb.com/docs/troubleshooting/profiling/#attach-to-a-running-instance)
- Attach to a running instance and capture a flame graph
* [Continuous profiling](https://questdb.com/docs/troubleshooting/profiling/#continuous-profiling)
- Run the profiler in the background for later analysis
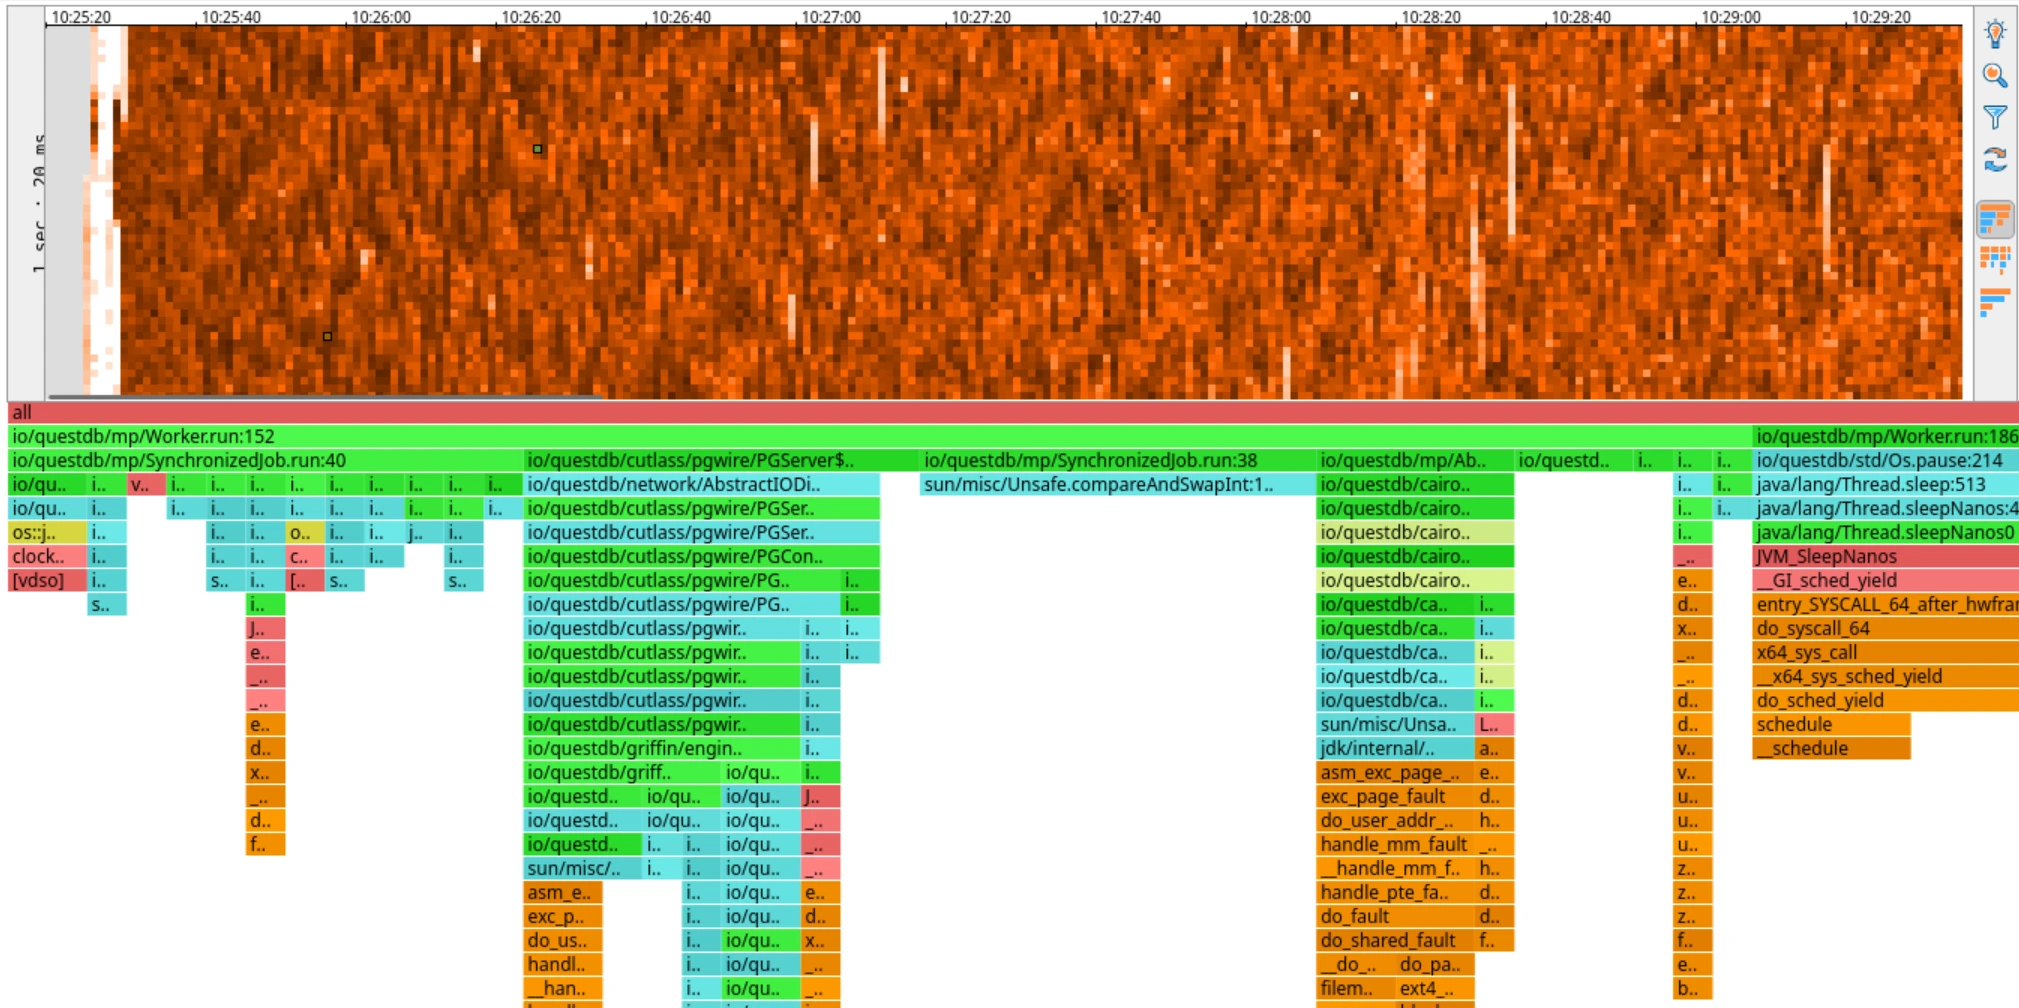
Heatmap showing CPU usage over time with flame graph
Prerequisites[](https://questdb.com/docs/troubleshooting/profiling/#prerequisites "Direct link to Prerequisites")
-------------------------------------------------------------------------------------------------------------------
Profiling requires [async-profiler](https://github.com/async-profiler/async-profiler)
. QuestDB ships with async-profiler and the `jfrconv` converter bundled in the **Linux x86\_64** distribution only. For other platforms, you must install async-profiler separately.
### Linux kernel settings[](https://questdb.com/docs/troubleshooting/profiling/#linux-kernel-settings "Direct link to Linux kernel settings")
Profiling works without any kernel configuration changes, but for best accuracy on Linux, configure the following kernel parameters:
# Allow unrestricted access to perf eventssudo sysctl kernel.perf_event_paranoid=-1# Expose kernel symbols for complete stack tracessudo sysctl kernel.kptr_restrict=0
To make these settings permanent, add them to `/etc/sysctl.conf` or create a file in `/etc/sysctl.d/`:
# /etc/sysctl.d/99-profiling.confkernel.perf_event_paranoid=-1kernel.kptr_restrict=0
| Setting | Recommended Value | Description |
| --- | --- | --- |
| `perf_event_paranoid` | `-1` | Controls access to performance events. Value `-1` allows unrestricted access to perf events, providing the most accurate profiling results. |
| `kptr_restrict` | `0` | Controls kernel pointer visibility. Value `0` exposes kernel symbols, enabling complete stack traces including kernel frames. |
Without these settings, profiling still works but may have reduced accuracy.
warning
These settings have security implications as they expose performance counters and kernel addresses. On production systems, consider enabling them only during profiling sessions, or use more restrictive values based on your security requirements. See the [Linux kernel perf security documentation](https://www.kernel.org/doc/html/v6.0/admin-guide/perf-security.html)
for details.
Attach to a running instance[](https://questdb.com/docs/troubleshooting/profiling/#attach-to-a-running-instance "Direct link to Attach to a running instance")
----------------------------------------------------------------------------------------------------------------------------------------------------------------
Use the `profile` command to attach async-profiler to an already running QuestDB instance. This mode is useful for ad-hoc profiling of production systems without requiring a restart.
### Syntax[](https://questdb.com/docs/troubleshooting/profiling/#syntax "Direct link to Syntax")
./questdb.sh profile [-t tag] -- [profiler-args]
| Option | Description |
| --- | --- |
| `-t` | Process tag to identify which QuestDB instance to profile. Required only when profiling an instance started with a custom `-t` tag. |
| `--` | Separator between questdb.sh options and async-profiler arguments. |
All arguments after `--` are passed directly to the `asprof` command-line tool.
### Examples[](https://questdb.com/docs/troubleshooting/profiling/#examples "Direct link to Examples")
Profile CPU usage for 30 seconds and generate an HTML flame graph:
./questdb.sh profile -- -e cpu -d 30 -f /tmp/cpu-profile.html
Profile memory allocations:
./questdb.sh profile -- -e alloc -d 60 -f /tmp/alloc-profile.html
Profile lock contention:
./questdb.sh profile -- -e lock -d 30 -f /tmp/lock-profile.html
Generate a JFR (Java Flight Recorder) file instead of HTML:
./questdb.sh profile -- -e cpu -d 60 -f /tmp/profile.jfr
Profile a specific tagged instance:
./questdb.sh profile -t mydb -- -e cpu -d 30 -f /tmp/profile.html
### Common profiler arguments[](https://questdb.com/docs/troubleshooting/profiling/#common-profiler-arguments "Direct link to Common profiler arguments")
| Argument | Description |
| --- | --- |
| `-e ` | Event to profile: `cpu`, `alloc`, `lock`, `wall`, `itimer`, etc. |
| `-d ` | Duration of profiling in seconds. |
| `-f ` | Output file. Extension determines format: `.html` for flame graph, `.jfr` for JFR, `.svg` for SVG. |
| `-i ` | Sampling interval (e.g., `10ms`, `1us`). |
| `-t` | Profile threads separately. Each stack trace will end with a frame that denotes a single thread. (Note: this is asprof's `-t`, distinct from the questdb.sh `-t` tag option used before `--`.) |
| `--all-user` | Include only user-mode events. |
For a complete list of options, see the [async-profiler documentation](https://github.com/async-profiler/async-profiler)
.
Continuous profiling[](https://questdb.com/docs/troubleshooting/profiling/#continuous-profiling "Direct link to Continuous profiling")
----------------------------------------------------------------------------------------------------------------------------------------
### Overview[](https://questdb.com/docs/troubleshooting/profiling/#overview "Direct link to Overview")
Use the `-p` flag with the `start` command to run the profiler continuously in the background. This is valuable when you don't know when a problem will occur - the profiler is always recording, so you can analyze what happened after the fact. Continuous profiling helps catch rare events that are difficult to reproduce and reveals patterns and trends over time.
Profile data is written to JFR files in the `/profiles` directory (e.g., `~/.questdb/profiles/`). These can later be converted to heatmaps. Heatmaps show samples over time, letting you spot anomalies and then zoom into a specific time window to generate a flame graph for just that period.
### Default configuration[](https://questdb.com/docs/troubleshooting/profiling/#default-configuration "Direct link to Default configuration")
When you run `./questdb.sh start -p` without additional parameters, the profiler uses these defaults:
| Setting | Default | Description |
| --- | --- | --- |
| Events | `cpu,wall` | Profiles both CPU time and wall-clock time simultaneously |
| Interval | `5ms` | Sampling interval for CPU and wall-clock profiling |
| Allocation interval | `512k` | Sample every 512 KB of allocations (when `alloc` event is enabled) |
| Lock threshold | `10ms` | Sample locks held longer than 10ms (when `lock` event is enabled) |
| Loop duration | `30m` | Start a new JFR file every 30 minutes |
| Output directory | `/profiles` | Profile files are written here |
| File name pattern | `profile-%n{48}.jfr` | Sequence number up to 48, then wraps around |
With the default 30-minute loop and sequence limit of 48, the profiler keeps up to 24 hours of data before overwriting. JFR file sizes depend on workload activity - expect roughly 10-50 MB per 30-minute file under typical load. Monitor disk usage if running continuously in production.
Override defaults via environment variables before starting QuestDB:
export PROFILER_EVENT="cpu" # Profile CPU onlyexport PROFILER_INTERVAL="10ms" # Less frequent samplingexport PROFILER_LOOP="1h" # New file every hour./questdb.sh start -p
If you pass custom agent parameters after `--`, they replace the environment variable defaults entirely.
### Syntax[](https://questdb.com/docs/troubleshooting/profiling/#syntax-1 "Direct link to Syntax")
./questdb.sh start -p [-d dir] [-f] [-n] [-t tag] [-- agent-params]
| Option | Description |
| --- | --- |
| `-p` | Enable async-profiler agent at startup. |
| `-d` | QuestDB root directory. |
| `-f` | Force overwrite of the public (Web Console) directory. |
| `-n` | Disable HUP signal handler (keeps QuestDB running after terminal closes). |
| `-t` | Process tag for identification. |
| `--` | Separator between questdb.sh options and JVM agent parameters. |
Arguments after `--` are passed as JVM agent parameters to async-profiler.
### Examples[](https://questdb.com/docs/troubleshooting/profiling/#examples-1 "Direct link to Examples")
Start with default settings (profiles `cpu,wall` events, writes to `/profiles/`):
./questdb.sh start -p
Start with custom parameters (overrides all defaults):
./questdb.sh start -p -- start,event=cpu,file=/tmp/profile.jfr,interval=10ms
Start with wall-clock profiling at a custom interval:
./questdb.sh start -p -- start,event=wall,file=/tmp/wall.jfr,interval=20ms
### Agent parameters[](https://questdb.com/docs/troubleshooting/profiling/#agent-parameters "Direct link to Agent parameters")
When using continuous profiling, parameters are passed in a comma-separated format:
| Parameter | Description |
| --- | --- |
| `start` | Begin profiling immediately on JVM startup. |
| `event=` | Event type to profile: `cpu`, `alloc`, `lock`, `wall`, etc. |
| `file=` | Output file path. |
| `interval=