# Table of Contents
- [Riskfolio-Lib 7.2](#riskfolio-lib-7-2)
- [Advanced Portfolio Optimization: A Cutting-edge Quantitative Approach - Riskfolio-Lib 7.2](#advanced-portfolio-optimization-a-cutting-edge-quantitative-approach-riskfolio-lib-7-2)
- [Install - Riskfolio-Lib 7.2](#install-riskfolio-lib-7-2)
- [Examples - Riskfolio-Lib 7.2](#examples-riskfolio-lib-7-2)
- [Authors - Riskfolio-Lib 7.2](#authors-riskfolio-lib-7-2)
- [Contributing - Riskfolio-Lib 7.2](#contributing-riskfolio-lib-7-2)
- [License - Riskfolio-Lib 7.2](#license-riskfolio-lib-7-2)
- [Changelog - Riskfolio-Lib 7.2](#changelog-riskfolio-lib-7-2)
- [Reports Functions - Riskfolio-Lib 7.2](#reports-functions-riskfolio-lib-7-2)
- [Python Module Index - Riskfolio-Lib 7.2](#python-module-index-riskfolio-lib-7-2)
- [Index - Riskfolio-Lib 7.2](#index-riskfolio-lib-7-2)
- [Riskfolio-XL: Riskfolio-Lib add-in for Microsoft Excel - Riskfolio-Lib 7.2](#riskfolio-xl-riskfolio-lib-add-in-for-microsoft-excel-riskfolio-lib-7-2)
- [Portfolio Optimization with Python Course - Riskfolio-Lib 7.2](#portfolio-optimization-with-python-course-riskfolio-lib-7-2)
- [Hierarchical Clustering Portfolio Optimization - Riskfolio-Lib 7.2](#hierarchical-clustering-portfolio-optimization-riskfolio-lib-7-2)
- [Portfolio Optimization - Riskfolio-Lib 7.2](#portfolio-optimization-riskfolio-lib-7-2)
- [Parameters Estimation - Riskfolio-Lib 7.2](#parameters-estimation-riskfolio-lib-7-2)
- [Constraints Functions - Riskfolio-Lib 7.2](#constraints-functions-riskfolio-lib-7-2)
- [Plot Functions - Riskfolio-Lib 7.2](#plot-functions-riskfolio-lib-7-2)
- [Risk Functions - Riskfolio-Lib 7.2](#risk-functions-riskfolio-lib-7-2)
- [DBHT, OWA Weights, Gerber Statistic, CPP and Auxiliary Functions - Riskfolio-Lib 7.2](#dbht-owa-weights-gerber-statistic-cpp-and-auxiliary-functions-riskfolio-lib-7-2)
- [
Documentation page not found
- Read the Docs Community ](#-documentation-page-not-found-read-the-docs-community-)
- [Riskfolio-Lib 7.2](#riskfolio-lib-7-2)
- [Just a moment...](#just-a-moment-)
- [Just a moment...](#just-a-moment-)
- [Just a moment...](#just-a-moment-)
- [Just a moment...](#just-a-moment-)
- [Just a moment...](#just-a-moment-)
- [Just a moment...](#just-a-moment-)
- [Just a moment...](#just-a-moment-)
- [Just a moment...](#just-a-moment-)
- [Just a moment...](#just-a-moment-)
- [Just a moment...](#just-a-moment-)
- [Just a moment...](#just-a-moment-)
- [Just a moment...](#just-a-moment-)
- [Just a moment...](#just-a-moment-)
- [Just a moment...](#just-a-moment-)
- [Just a moment...](#just-a-moment-)
- [Just a moment...](#just-a-moment-)
- [Just a moment...](#just-a-moment-)
- [Just a moment...](#just-a-moment-)
- [Just a moment...](#just-a-moment-)
- [Just a moment...](#just-a-moment-)
---
# Riskfolio-Lib 7.2
[Skip to content](https://riskfolio-lib.readthedocs.io/en/latest/#portfolio-optimization-in-python-easy-for-everyone)
Riskfolio-Lib[¶](https://riskfolio-lib.readthedocs.io/en/latest/#riskfolio-lib "Link to this heading")
=======================================================================================================
Portfolio Optimization in Python, Easy for Everyone[¶](https://riskfolio-lib.readthedocs.io/en/latest/#portfolio-optimization-in-python-easy-for-everyone "Link to this heading")
----------------------------------------------------------------------------------------------------------------------------------------------------------------------------------
[Buy Advanced Portfolio Optimization Book on Springer](https://www.kqzyfj.com/click-101359873-15150084?url=https%3A%2F%2Flink.springer.com%2Fbook%2F9783031843037)
[Enroll in the Portfolio Optimization with Python Course](https://www.paypal.com/ncp/payment/GN55W4UQ7VAMN)
[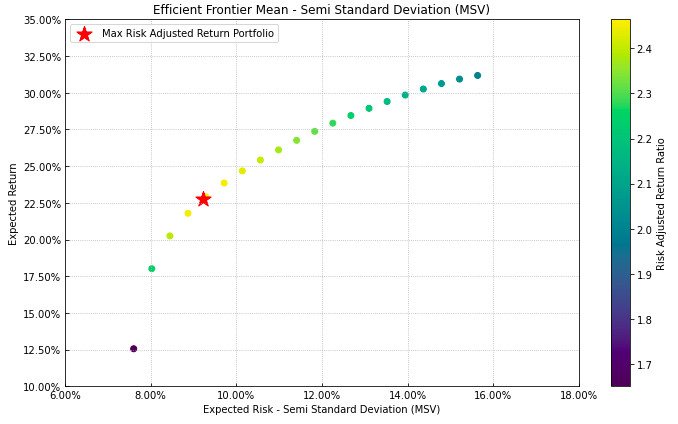](https://riskfolio-lib.readthedocs.io/en/latest/_images/MSV_Frontier.png)
[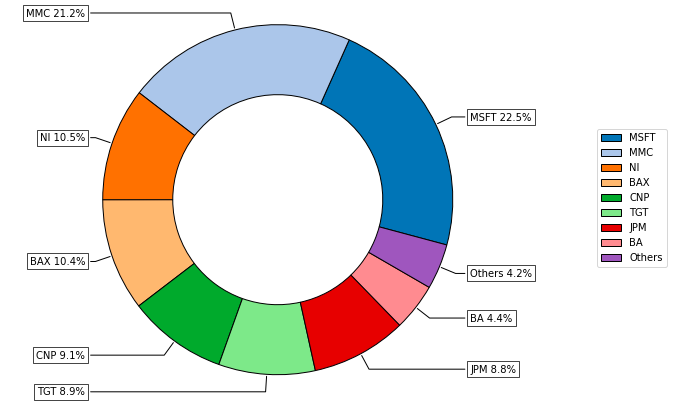](https://riskfolio-lib.readthedocs.io/en/latest/_images/Pie_Chart.png)
[](https://github.com/sponsors/dcajasn)
[](https://ko-fi.com/B0B833SXD)
[](https://github.com/dcajasn/Riskfolio-Lib/stargazers)
[](https://pepy.tech/project/riskfolio-lib)
[](https://pepy.tech/project/riskfolio-lib)
 [](https://github.com/dcajasn/Riskfolio-Lib/blob/master/LICENSE.txt)
[](https://mybinder.org/v2/gh/dcajasn/Riskfolio-Lib/HEAD)
### Description[¶](https://riskfolio-lib.readthedocs.io/en/latest/#description "Link to this heading")
Riskfolio-Lib is a library for making **Portfolio Optimization in Python** made in Peru 🇵🇪. Its objective is to help students, academics and practitioners to build investment portfolios based on mathematically complex models with low effort. It is built on top of [CVXPY](https://www.cvxpy.org/)
and closely integrated with [Pandas](https://pandas.pydata.org/)
data structures.
Some of key functionalities that Riskfolio-Lib offers:
* Mean Risk and Logarithmic Mean Risk (Kelly Criterion) Portfolio Optimization with 4 objective functions:
> * Minimum Risk.
>
> * Maximum Return.
>
> * Maximum Utility Function.
>
> * Maximum Risk Adjusted Return Ratio.
>
* Mean Risk and Logarithmic Mean Risk (Kelly Criterion) Portfolio Optimization with 24 convex risk measures:
> **Dispersion Risk Measures:**
>
> * Standard Deviation.
>
> * Square Root Kurtosis.
>
> * Mean Absolute Deviation (MAD).
>
> * Gini Mean Difference (GMD).
>
> * Conditional Value at Risk Range.
>
> * Tail Gini Range.
>
> * Entropic Value at Risk Range.
>
> * Relativistic Value at Risk Range.
>
> * Range.
>
>
> **Downside Risk Measures:**
>
> * Semi Standard Deviation.
>
> * Square Root Semi Kurtosis.
>
> * First Lower Partial Moment (Omega Ratio).
>
> * Second Lower Partial Moment (Sortino Ratio).
>
> * Conditional Value at Risk (CVaR).
>
> * Tail Gini.
>
> * Entropic Value at Risk (EVaR).
>
> * Relativistic Value at Risk (RLVaR).
>
> * Worst Realization (Minimax).
>
>
> **Drawdown Risk Measures:**
>
> * Average Drawdown for uncompounded cumulative returns.
>
> * Ulcer Index for uncompounded cumulative returns.
>
> * Conditional Drawdown at Risk (CDaR) for uncompounded cumulative returns.
>
> * Entropic Drawdown at Risk (EDaR) for uncompounded cumulative returns.
>
> * Relativistic Drawdown at Risk (RLDaR) for uncompounded cumulative returns.
>
> * Maximum Drawdown (Calmar Ratio) for uncompounded cumulative returns.
>
* Risk Parity Portfolio Optimization with 20 convex risk measures:
> **Dispersion Risk Measures:**
>
> * Standard Deviation.
>
> * Square Root Kurtosis.
>
> * Mean Absolute Deviation (MAD).
>
> * Gini Mean Difference (GMD).
>
> * Conditional Value at Risk Range.
>
> * Tail Gini Range.
>
> * Entropic Value at Risk Range.
>
> * Relativistic Value at Risk Range.
>
>
> **Downside Risk Measures:**
>
> * Semi Standard Deviation.
>
> * Square Root Semi Kurtosis.
>
> * First Lower Partial Moment (Omega Ratio)
>
> * Second Lower Partial Moment (Sortino Ratio)
>
> * Conditional Value at Risk (CVaR).
>
> * Tail Gini.
>
> * Entropic Value at Risk (EVaR).
>
> * Relativistic Value at Risk (RLVaR).
>
>
> **Drawdown Risk Measures:**
>
> * Ulcer Index for uncompounded cumulative returns.
>
> * Conditional Drawdown at Risk (CDaR) for uncompounded cumulative returns.
>
> * Entropic Drawdown at Risk (EDaR) for uncompounded cumulative returns.
>
> * Relativistic Drawdown at Risk (RLDaR) for uncompounded cumulative returns.
>
* Hierarchical Clustering Portfolio Optimization: Hierarchical Risk Parity (HRP) and Hierarchical Equal Risk Contribution (HERC) with 35 risk measures using naive risk parity:
> **Dispersion Risk Measures:**
>
> * Standard Deviation.
>
> * Variance.
>
> * Square Root Kurtosis.
>
> * Mean Absolute Deviation (MAD).
>
> * Gini Mean Difference (GMD).
>
> * Value at Risk Range.
>
> * Conditional Value at Risk Range.
>
> * Tail Gini Range.
>
> * Entropic Value at Risk Range.
>
> * Relativistic Value at Risk Range.
>
> * Range.
>
>
> **Downside Risk Measures:**
>
> * Semi Standard Deviation.
>
> * Square Root Semi Kurtosis.
>
> * First Lower Partial Moment (Omega Ratio).
>
> * Second Lower Partial Moment (Sortino Ratio).
>
> * Value at Risk (VaR).
>
> * Conditional Value at Risk (CVaR).
>
> * Entropic Value at Risk (EVaR).
>
> * Relativistic Value at Risk (RLVaR).
>
> * Tail Gini.
>
> * Worst Case Realization (Minimax).
>
>
> **Drawdown Risk Measures:**
>
> * Average Drawdown for compounded and uncompounded cumulative returns.
>
> * Ulcer Index for compounded and uncompounded cumulative returns.
>
> * Drawdown at Risk (DaR) for compounded and uncompounded cumulative returns.
>
> * Conditional Drawdown at Risk (CDaR) for compounded and uncompounded cumulative returns.
>
> * Entropic Drawdown at Risk (EDaR) for compounded and uncompounded cumulative returns.
>
> * Relativistic Drawdown at Risk (RLDaR) for compounded and uncompounded cumulative returns.
>
> * Maximum Drawdown (Calmar Ratio) for compounded and uncompounded cumulative returns.
>
* Nested Clustered Optimization (NCO) with four objective functions and the available risk measures to each objective:
> * Minimum Risk.
>
> * Maximum Return.
>
> * Maximum Utility Function.
>
> * Equal Risk Contribution.
>
* Worst Case Mean Variance Portfolio Optimization.
* Relaxed Risk Parity Portfolio Optimization.
* Ordered Weighted Averaging (OWA) Portfolio Optimization.
* Portfolio optimization with Black Litterman model.
* Portfolio optimization with Risk Factors model.
* Portfolio optimization with Black Litterman Bayesian model.
* Portfolio optimization with Augmented Black Litterman model.
* Portfolio optimization with constraints on tracking error and turnover.
* Portfolio optimization with short positions and leveraged portfolios.
* Portfolio optimization with constraints on number of assets and number of effective assets.
* Portfolio optimization with constraints based on graph information.
* Portfolio optimization with inequality constraints on risk contributions for variance.
* Portfolio optimization with inequality constraints on factor risk contributions for variance.
* Portfolio optimization with integer constraints such as Cardinality on Assets and Categories, Mutually Exclusive and Join Investment.
* Tools to build efficient frontier for 24 convex risk measures.
* Tools to build linear constraints on assets, asset classes and risk factors.
* Tools to build views on assets and asset classes.
* Tools to build views on risk factors.
* Tools to build risk contribution constraints per asset classes.
* Tools to build risk contribution constraints per risk factor using explicit risk factors and principal components.
* Tools to build bounds constraints for Hierarchical Clustering Portfolios.
* Tools to calculate risk measures.
* Tools to calculate risk contributions per asset.
* Tools to calculate risk contributions per risk factor.
* Tools to calculate uncertainty sets for mean vector and covariance matrix.
* Tools to calculate assets clusters based on codependence metrics.
* Tools to estimate loadings matrix (Stepwise Regression and Principal Components Regression).
* Tools to visualizing portfolio properties and risk measures.
* Tools to build reports on Jupyter Notebook and Excel.
* Option to use commercial optimization solver like MOSEK or GUROBI for large scale problems.
### Choosing a Solver[¶](https://riskfolio-lib.readthedocs.io/en/latest/#choosing-a-solver "Link to this heading")
Due to Riskfolio-Lib is based on CVXPY, Riskfolio-Lib can use the same solvers available for CVXPY. The list of solvers compatible with CVXPY is available in [Choosing a solver](https://www.cvxpy.org/tutorial/solvers/index.html#choosing-a-solver)
section of CVXPY’s documentation. However, to select an adequate solver for each risk measure we can use the following table that specifies which type of programming technique is used to model each risk measure.
| Risk Measure | LP | QP | SOCP | SDP | EXP | POW |
| --- | --- | --- | --- | --- | --- | --- |
| Variance (MV) | | | X | X\* | | |
| Mean Absolute Deviation (MAD) | X | | | | | |
| Gini Mean Difference (GMD) | | | | | | X\*\* |
| Semi Variance (MSV) | | | X | | | |
| Kurtosis (KT) | | | | X | | |
| Semi Kurtosis (SKT) | | | | X | | |
| First Lower Partial Moment (FLPM) | X | | | | | |
| Second Lower Partial Moment (SLPM) | | | X | | | |
| Conditional Value at Risk (CVaR) | X | | | | | |
| Tail Gini (TG) | | | | | | X\*\* |
| Entropic Value at Risk (EVaR) | | | | | X\*\* | |
| Relativistic Value at Risk (RLVaR) | | | | | | X\*\* |
| Worst Realization (WR) | X | | | | | |
| CVaR Range (CVRG) | X | | | | | |
| Tail Gini Range (TGRG) | | | | | | X\*\* |
| EVaR Range (EVRG) | | | | | X\*\* | |
| RLVaR Range (RVRG) | | | | | | X\*\* |
| Range (RG) | X | | | | | |
| Average Drawdown (ADD) | X | | | | | |
| Ulcer Index (UCI) | | | X | | | |
| Conditional Drawdown at Risk (CDaR) | X | | | | | |
| Entropic Drawdown at Risk (EDaR) | | | | | X\*\* | |
| Relativistic Drawdown at Risk (RLDaR) | | | | | | X\*\* |
| Maximum Drawdown (MDD) | X | | | | | |
(\*) When SDP graph theory constraints or risk contribution constraints are included. In the case integer programming graph theory constraints are included, the model assume the SOCP formulation.
(\*\*) For these models is highly recommended to use MOSEK as solver, due to in some cases CLARABEL cannot find a solution and SCS takes too much time to solve them.
LP: Linear Programming refers to problems with a linear objective function and linear constraints.
QP: Quadratic Programming refers to problems with a quadratic objective function and linear constraints.
SOCP: Second Order Cone Programming refers to problems with second-order cone constraints.
SDP: Semidefinite Programming refers to problems with positive semidefinite constraints.
EXP:refers to problems with exponential cone constraints.
POW: refers to problems with 3-dimensional power cone constraints.
### Consulting Fees[¶](https://riskfolio-lib.readthedocs.io/en/latest/#consulting-fees "Link to this heading")
Riskfolio-Lib is an open-source project, however due it’s a project that is not financed for any institution, I started charging for consultancies that are not related to errors in source code. Our fees are as follows:
* $ 25 USD (United States Dollars) per question that doesn’t require to check code.
* $ 50 USD to check a small size script or code (less than 200 lines of code). The fee of the solution depends on the complexity of the solution:
* $ 50 USD for simple errors in scripts (modify less than 10 lines of code).
* For most complex errors the fee depends on the complexity of the solution but the fee is $ 150 USD per hour.
* $ 100 USD to check a medium size script or code (between 201 and 600 lines of code). The fee of the solution depends on the complexity of the solution:
* $ 50 USD for simple errors in scripts (modify less than 10 lines of code).
* For most complex errors the fee depends on the complexity of the solution but the fee is $ 150 USD per hour.
* For large size script or code (more than 600 lines of code) the fee is variable depending on the size of the code. The fee of the solution depends on the complexity of the solution:
* $ 50 USD for simple errors in scripts (modify less than 10 lines of code).
* For most complex errors the fee depends on the complexity of the solution but the fee is $ 150 USD per hour.
**All consulting must be paid in advance**.
You can contact me through:
* LinkedIn
* Gmail
You can pay using one of the following channels:
[](https://github.com/sponsors/dcajasn)
[](https://ko-fi.com/B0B833SXD)
### Citing[¶](https://riskfolio-lib.readthedocs.io/en/latest/#citing "Link to this heading")
If you use Riskfolio-Lib for published work, please use the following BibTeX entry:
`@misc{riskfolio, author = {Dany Cajas}, title = {Riskfolio-Lib (7.2.1)}, year = {2026}, url = {https://github.com/dcajasn/Riskfolio-Lib}, }`
### Contents[¶](https://riskfolio-lib.readthedocs.io/en/latest/#contents "Link to this heading")
* [Portfolio Optimization Book](https://riskfolio-lib.readthedocs.io/en/latest/book.html)
* [Portfolio Optimization Course](https://riskfolio-lib.readthedocs.io/en/latest/course.html)
* [Riskfolio-XL](https://riskfolio-lib.readthedocs.io/en/latest/excel.html)
* [Install](https://riskfolio-lib.readthedocs.io/en/latest/install.html)
* [Portfolio Models](https://riskfolio-lib.readthedocs.io/en/latest/portfolio.html)
* [Hierarchical Clustering Models](https://riskfolio-lib.readthedocs.io/en/latest/hcportfolio.html)
* [Parameters Estimation](https://riskfolio-lib.readthedocs.io/en/latest/parameters.html)
* [Constraints Functions](https://riskfolio-lib.readthedocs.io/en/latest/constraints.html)
* [Risk Functions](https://riskfolio-lib.readthedocs.io/en/latest/risk.html)
* [Plot Functions](https://riskfolio-lib.readthedocs.io/en/latest/plot.html)
* [Reports](https://riskfolio-lib.readthedocs.io/en/latest/reports.html)
* [Auxiliary Functions](https://riskfolio-lib.readthedocs.io/en/latest/auxiliary.html)
* [Examples](https://riskfolio-lib.readthedocs.io/en/latest/examples.html)
* [Contributing](https://riskfolio-lib.readthedocs.io/en/latest/contributing.html)
* [Authors](https://riskfolio-lib.readthedocs.io/en/latest/authors.html)
* [License](https://riskfolio-lib.readthedocs.io/en/latest/license.html)
* [Changelog](https://riskfolio-lib.readthedocs.io/en/latest/changelog.html)
### Indices and tables[¶](https://riskfolio-lib.readthedocs.io/en/latest/#indices-and-tables "Link to this heading")
* [Index](https://riskfolio-lib.readthedocs.io/en/latest/genindex.html)
* [Module Index](https://riskfolio-lib.readthedocs.io/en/latest/py-modindex.html)
* [Search Page](https://riskfolio-lib.readthedocs.io/en/latest/search.html)
### Module Plans[¶](https://riskfolio-lib.readthedocs.io/en/latest/#module-plans "Link to this heading")
The plan for this library is to add more functions that will be very useful for students, academics and practitioners.
* Add more functions based on suggestion of users.
[**On-Demand H100 SXM GPUs for $2.99/hr/GPU with Lambda** 640 GB of vRAM in one 8x instance **Launch now**](https://server.ethicalads.io/proxy/click/9837/019d0edd-8fac-7681-b3ae-6e1cc74dab4a/)
[Ads by EthicalAds](https://www.ethicalads.io/advertisers/topics/data-science/?ref=ea-text)
---
# Advanced Portfolio Optimization: A Cutting-edge Quantitative Approach - Riskfolio-Lib 7.2
[Skip to content](https://riskfolio-lib.readthedocs.io/en/latest/book.html#motivation)
Advanced Portfolio Optimization: A Cutting-edge Quantitative Approach[¶](https://riskfolio-lib.readthedocs.io/en/latest/book.html#advanced-portfolio-optimization-a-cutting-edge-quantitative-approach "Link to this heading")
===============================================================================================================================================================================================================================
[Buy Advanced Portfolio Optimization Book on Springer](https://www.kqzyfj.com/click-101359873-15150084?url=https%3A%2F%2Flink.springer.com%2Fbook%2F9783031843037)
[Enroll in the Portfolio Optimization with Python Course](https://www.paypal.com/ncp/payment/GN55W4UQ7VAMN)
[](https://github.com/sponsors/dcajasn)
[](https://ko-fi.com/B0B833SXD)
Motivation[¶](https://riskfolio-lib.readthedocs.io/en/latest/book.html#motivation "Link to this heading")
----------------------------------------------------------------------------------------------------------
This book attempts to fill the gap that exists in quantitative finance books and courses that only focus on the mean-variance model and its variants, and ignore the further developments made in the last 70 years after the publication of Markowitz’s pioneering work. Readers will find this book very useful because each section explains the idea and mathematics of each model, and each section is accompanied by its corresponding Python code that allows all the examples to be reproduced.
Buy on Springer[¶](https://riskfolio-lib.readthedocs.io/en/latest/book.html#buy-on-springer "Link to this heading")
--------------------------------------------------------------------------------------------------------------------
Click the button below to buy on Springer Shop:
[Buy Advanced Portfolio Optimization Book on Springer](https://www.anrdoezrs.net/click-101359873-15150084?url=https%3A%2F%2Flink.springer.com%2Fbook%2F9783031843037)
Table of Contents[¶](https://riskfolio-lib.readthedocs.io/en/latest/book.html#table-of-contents "Link to this heading")
------------------------------------------------------------------------------------------------------------------------
The detailed content of the book follows below:
      
---
# Install - Riskfolio-Lib 7.2
[Skip to content](https://riskfolio-lib.readthedocs.io/en/latest/install.html#mac-os-x-windows-and-linux)
Install[¶](https://riskfolio-lib.readthedocs.io/en/latest/install.html#install "Link to this heading")
=======================================================================================================
[Buy Advanced Portfolio Optimization Book on Springer](https://www.kqzyfj.com/click-101359873-15150084?url=https%3A%2F%2Flink.springer.com%2Fbook%2F9783031843037)
[Enroll in the Portfolio Optimization with Python Course](https://www.paypal.com/ncp/payment/GN55W4UQ7VAMN)
[](https://github.com/sponsors/dcajasn)
[](https://ko-fi.com/B0B833SXD)
Mac OS X, Windows, and Linux[¶](https://riskfolio-lib.readthedocs.io/en/latest/install.html#mac-os-x-windows-and-linux "Link to this heading")
-----------------------------------------------------------------------------------------------------------------------------------------------
Riskfolio-lib only supports Python 3.7+ on OS X, Windows, and Linux. I recommend using pip for installation.
1. It is highly recommendable that you must have installed a scientific Python distribution like [anaconda](https://www.anaconda.com/products/individual)
or [winpython](https://winpython.github.io/)
(Windows only).
2. Install `Pybind11`.
> `pip install pybind11`
3. If you don’t have installed cvxpy, you must follow [cvxpy](https://www.cvxpy.org/install/index.html)
installation instructions before installing Riskfolio-Lib.
4. If you still have problems installing cvxpy, you can download cvxpy wheel from the [Unofficial Windows Binaries for Python Extension Packages](https://www.lfd.uci.edu/~gohlke/pythonlibs/#cvxpy)
and install using pip.
> `pip install path/cvxpy‑version.whl`
5. Install [Visual Studio Build Tools](https://visualstudio.microsoft.com/es/downloads/)
(Only for Windows).
[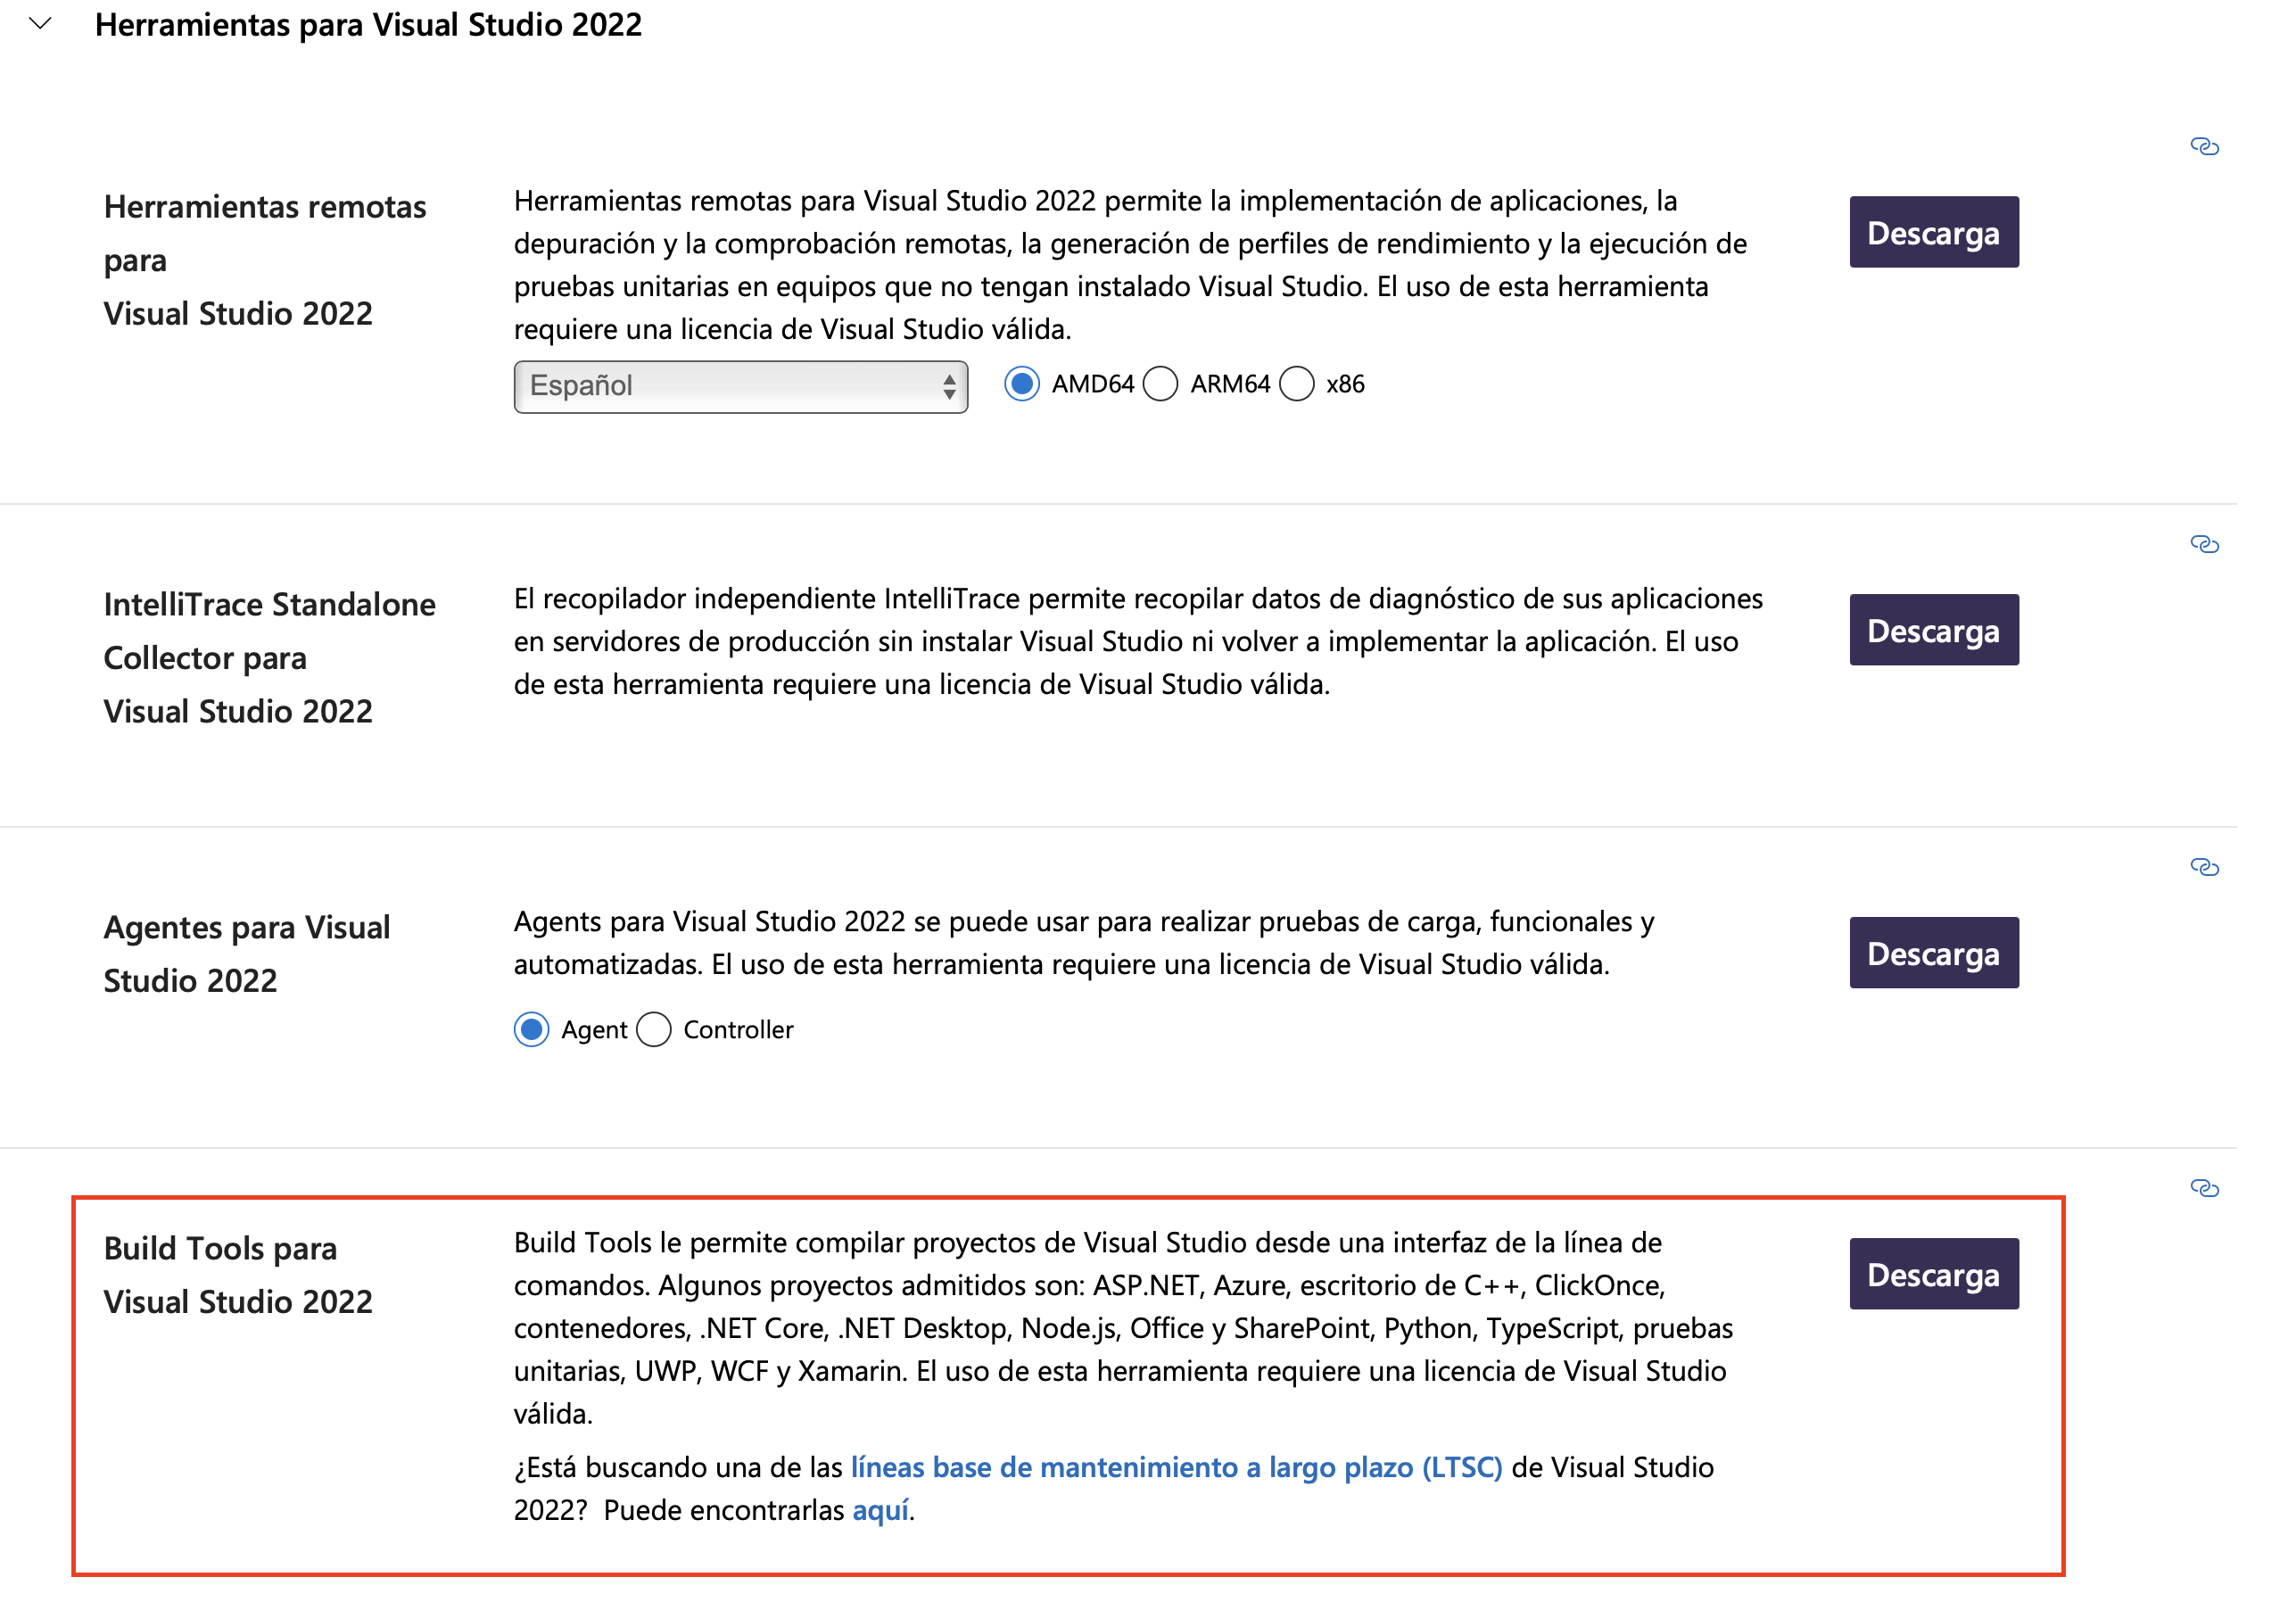](https://riskfolio-lib.readthedocs.io/en/latest/_images/MVSC1.png)
[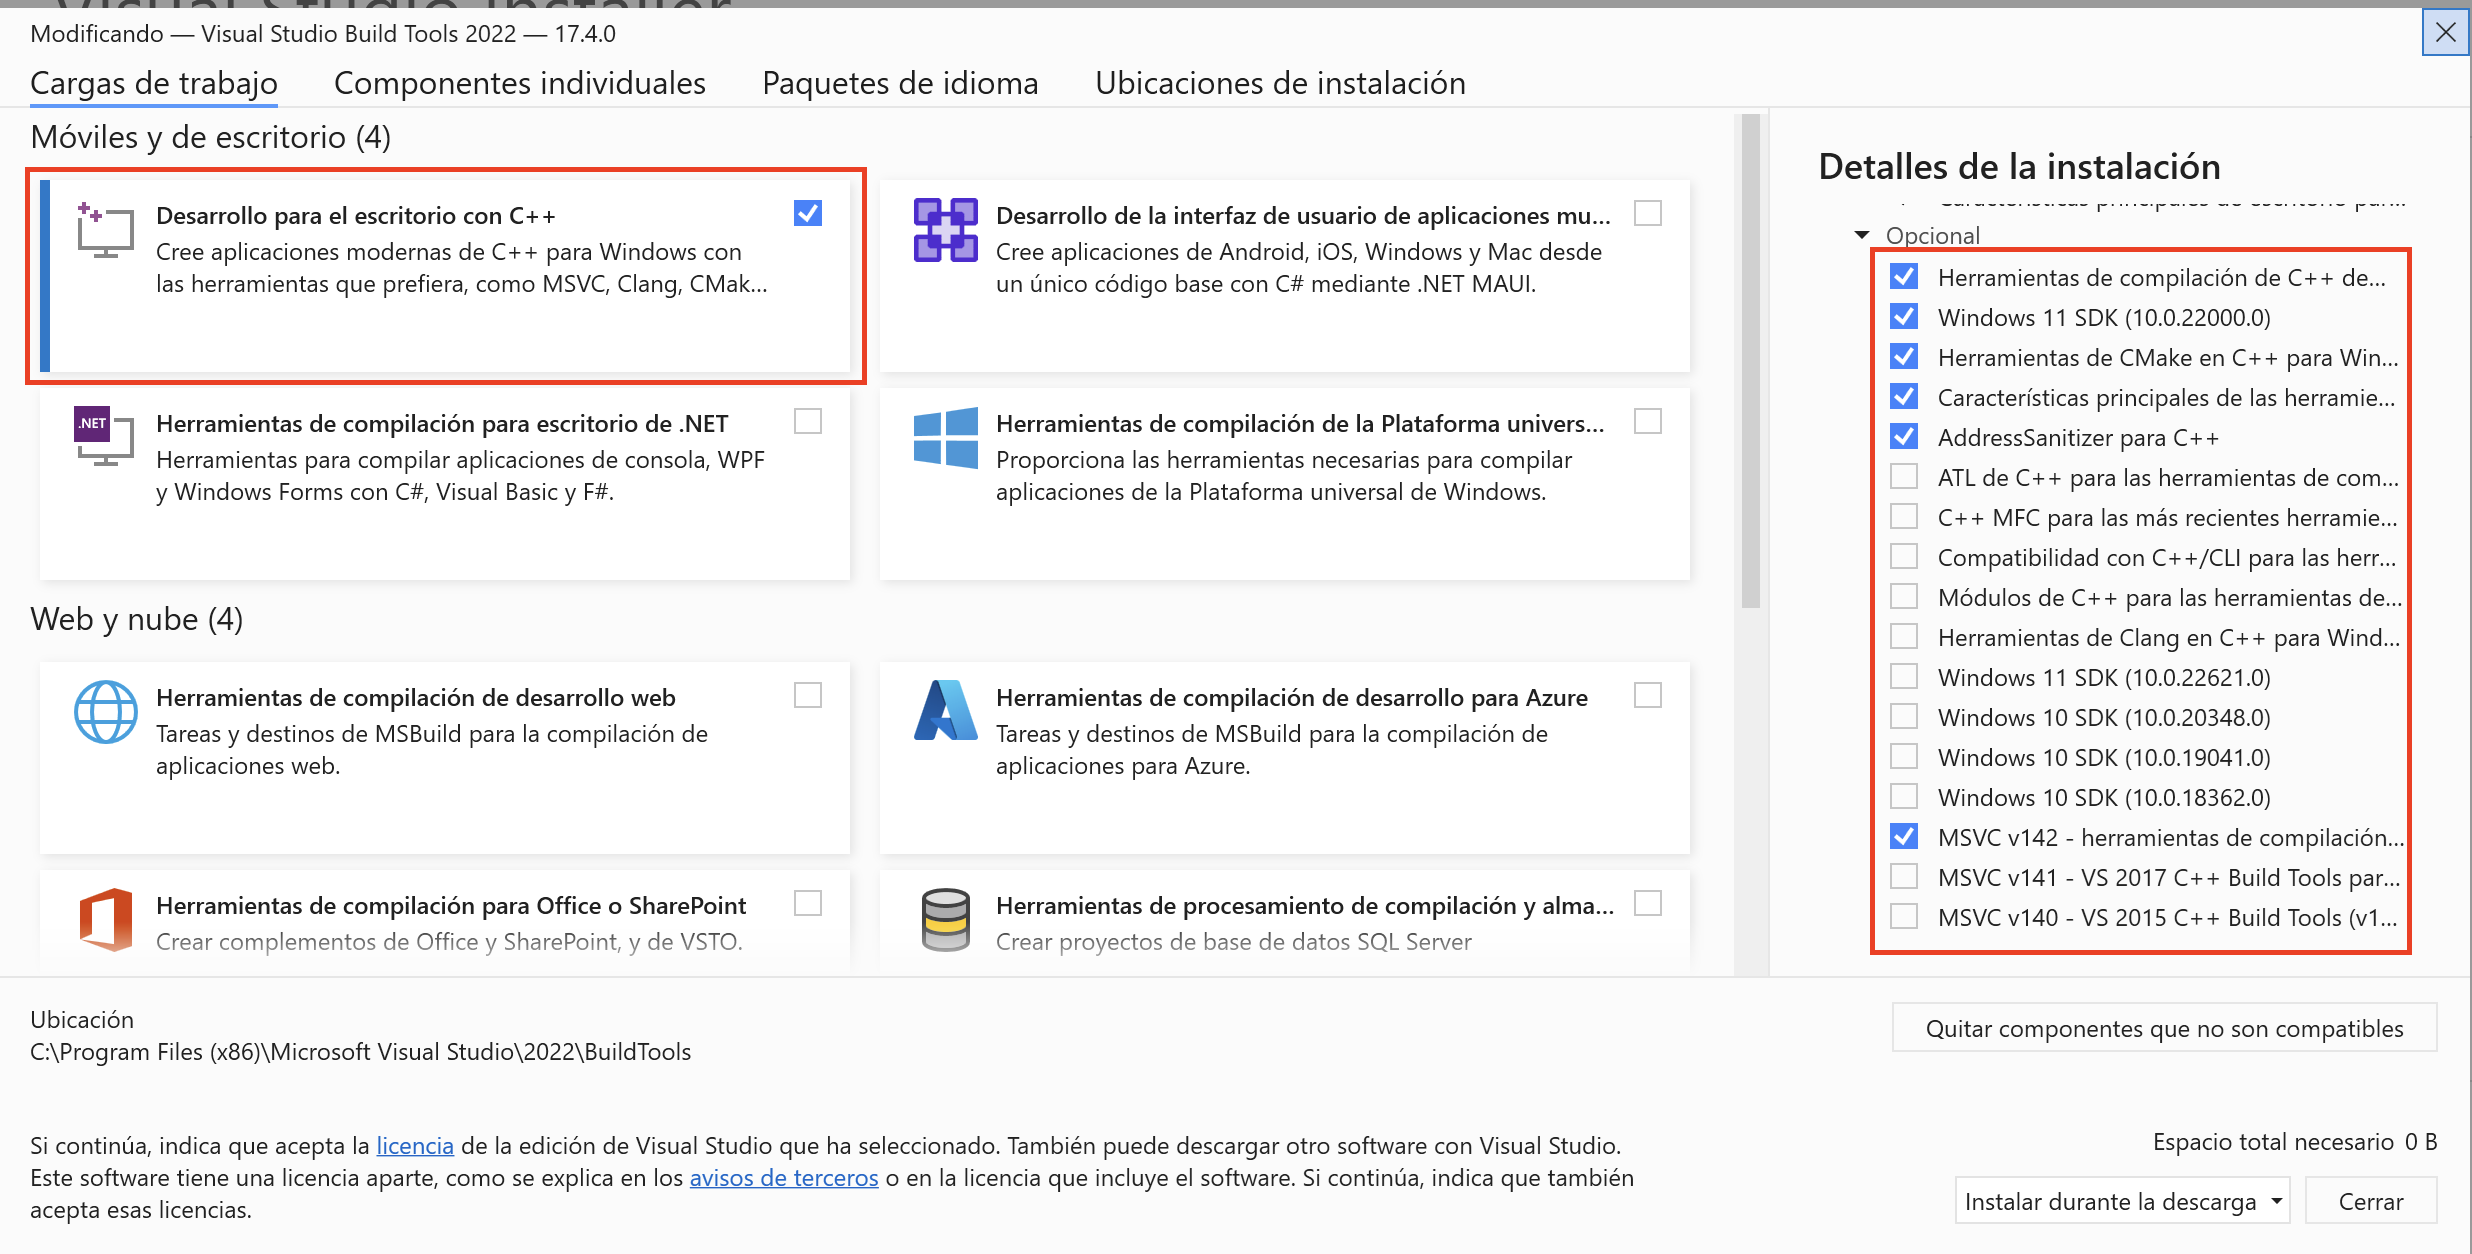](https://riskfolio-lib.readthedocs.io/en/latest/_images/MVSC2.png)
6. Install `Riskfolio-lib`.
> `pip install riskfolio-lib`
7. To run some examples is necessary to install [yfinance](https://pypi.org/project/yfinance/)
.
> `pip install yfinance`
8. To run some examples is necessary to install MOSEK, you must follow [MOSEK](https://docs.mosek.com/9.2/install/installation.html)
installation instructions. To get a MOSEK license you must go to [Academic Licenses](https://www.mosek.com/products/academic-licenses/)
.
> `pip install mosek`
Dependencies[¶](https://riskfolio-lib.readthedocs.io/en/latest/install.html#dependencies "Link to this heading")
-----------------------------------------------------------------------------------------------------------------
Riskfolio-Lib has the following dependencies:
* numpy>=1.24.0
* pandas>=2.0.0
* matplotlib>=3.8.0
* clarabel>=0.6.0
* cvxpy>=1.5.2
* scikit-learn>=1.3.0
* statsmodels>=0.13.5
* arch>=7.0
* xlsxwriter>=3.1.2
* networkx>=3.0
* astropy>=5.1 (if there are problems check [astropy installation instructions](https://www.astropy.org/)
)
* pybind11>=2.10.1
---
# Examples - Riskfolio-Lib 7.2
[Skip to content](https://riskfolio-lib.readthedocs.io/en/latest/examples.html#return-risk-portfolio-optimization-models)
Examples[¶](https://riskfolio-lib.readthedocs.io/en/latest/examples.html#examples "Link to this heading")
==========================================================================================================
[Buy Advanced Portfolio Optimization Book on Springer](https://www.kqzyfj.com/click-101359873-15150084?url=https%3A%2F%2Flink.springer.com%2Fbook%2F9783031843037)
[Enroll in the Portfolio Optimization with Python Course](https://www.paypal.com/ncp/payment/GN55W4UQ7VAMN)
[](https://github.com/sponsors/dcajasn)
[](https://ko-fi.com/B0B833SXD)
The following examples are available:
Return Risk Portfolio Optimization Models[¶](https://riskfolio-lib.readthedocs.io/en/latest/examples.html#return-risk-portfolio-optimization-models "Link to this heading")
----------------------------------------------------------------------------------------------------------------------------------------------------------------------------
* [Mean Risk Portfolio Optimization using Historical Estimates](https://colab.research.google.com/github/dcajasn/Riskfolio-Lib/blob/master/examples/Tutorial%201%20-%20Classic%20Mean%20Risk%20Optimization.ipynb)
.
* [Mean Risk Portfolio Optimization using Custom Estimates (mean and covariance)](https://colab.research.google.com/github/dcajasn/Riskfolio-Lib/blob/master/examples/Tutorial%206%20-%20Portfolio%20Optimization%20with%20Custom%20Parameters.ipynb)
.
* [Ulcer Index Portfolio Optimization for Mean Risk and Risk Parity](https://colab.research.google.com/github/dcajasn/Riskfolio-Lib/blob/master/examples/Tutorial%2014%20-%20Mean%20Ulcer%20Index%20Portfolio%20Optimization.ipynb)
.
* [Entropic Value at Risk (EVaR) Portfolio Optimization for Mean Risk and Risk Parity](https://colab.research.google.com/github/dcajasn/Riskfolio-Lib/blob/master/examples/Tutorial%2015%20-%20Mean%20Entropic%20Value%20at%20Risk%20(EVaR)%20Optimization.ipynb)
.
* [Riskfolio-Lib with MOSEK for Real Applications (612 assets and 4943 observations)](https://colab.research.google.com/github/dcajasn/Riskfolio-Lib/blob/master/examples/Tutorial%2017%20-%20Riskfolio-Lib%20with%20MOSEK%20for%20Real%20Applications%20(612%20assets%20and%204943%20observations).ipynb)
.
* [Entropic Drawdown at Risk (EDaR) Portfolio Optimization for Mean Risk and Risk Parity](https://colab.research.google.com/github/dcajasn/Riskfolio-Lib/blob/master/examples/Tutorial%2019%20-%20Mean%20Entropic%20Drawdown%20at%20Risk%20(EDaR)%20Optimization.ipynb)
.
* [Logarithmic Mean Risk (Kelly Criterion) Portfolio Optimization](https://colab.research.google.com/github/dcajasn/Riskfolio-Lib/blob/master/examples/Tutorial%2022%20-%20Logarithmic%20Mean%20Risk%20Optimization%20(Kelly%20Criterion).ipynb)
.
* [Worst Case Mean Variance Portfolio Optimization using Box and Elliptical Uncertainty Sets](https://colab.research.google.com/github/dcajasn/Riskfolio-Lib/blob/master/examples/Tutorial%2012%20-%20Worst%20Case%20Mean%20Variance%20Portfolio%20Optimization.ipynb)
.
* [Comparing Covariance Estimates Methods](https://colab.research.google.com/github/dcajasn/Riskfolio-Lib/blob/master/examples/Tutorial%2034%20-%20Comparing%20Covariance%20Estimators%20Methods.ipynb)
.
* [Gini Mean Difference (GMD) Portfolio Optimization for Mean Risk and Risk Parity](https://colab.research.google.com/github/dcajasn/Riskfolio-Lib/blob/master/examples/Tutorial%2035%20-%20Gini%20Mean%20Difference%20(GMD)%20Optimization.ipynb)
.
* [Tail Gini Range Portfolio Optimization for Mean Risk and Risk Parity](https://colab.research.google.com/github/dcajasn/Riskfolio-Lib/blob/master/examples/Tutorial%2036%20-%20Mean%20Tail%20Gini%20Range%20Optimization.ipynb)
.
* [Ordered Weighted Averaging (OWA) Portfolio Optimization](https://colab.research.google.com/github/dcajasn/Riskfolio-Lib/blob/master/examples/Tutorial%2037%20-%20OWA%20Portfolio%20Optimization.ipynb)
.
* [Kurtosis Portfolio Optimization for Mean Risk and Risk Parity](https://colab.research.google.com/github/dcajasn/Riskfolio-Lib/blob/master/examples/Tutorial%2038%20-%20Mean%20Kurtosis%20Optimization.ipynb)
.
* [Semi Kurtosis Portfolio Optimization for Mean Risk and Risk Parity](https://colab.research.google.com/github/dcajasn/Riskfolio-Lib/blob/master/examples/Tutorial%2039%20-%20Mean%20Semi%20Kurtosis%20Optimization.ipynb)
.
* [Relativistic Value at Risk (RLVaR) Portfolio Optimization for Mean Risk and Risk Parity](https://colab.research.google.com/github/dcajasn/Riskfolio-Lib/blob/master/examples/Tutorial%2040%20-%20Mean%20Relativistic%20Value%20at%20Risk%20(RLVaR)%20Optimization.ipynb)
.
* [Relativistic Drawdown at Risk (RLDaR) Portfolio Optimization for Mean Risk and Risk Parity](https://colab.research.google.com/github/dcajasn/Riskfolio-Lib/blob/master/examples/Tutorial%2041%20-%20Mean%20Relativistic%20Drawdown%20at%20Risk%20(RLDaR)%20Optimization.ipynb)
.
* [Higher L-Moments OWA Portfolio Optimization for Mean Risk and Risk Parity](https://colab.research.google.com/github/dcajasn/Riskfolio-Lib/blob/master/examples/Tutorial%2042%20-%20Higher%20L-Moments%20OWA%20Portfolio%20Optimization.ipynb)
.
* [Entropic Value at Risk Range (EVRG) Portfolio Optimization for Mean Risk and Risk Parity](https://colab.research.google.com/github/dcajasn/Riskfolio-Lib/blob/master/examples/Tutorial%2049%20-%20Mean%20Entropic%20Value%20at%20Risk%20Range%20(EVRG)%20Optimization.ipynb)
.
* [Relativistic Value at Risk Range (RVRG) Portfolio Optimization for Mean Risk and Risk Parity](https://colab.research.google.com/github/dcajasn/Riskfolio-Lib/blob/master/examples/Tutorial%2050%20-%20Mean%20Relativistic%20Value%20at%20Risk%20Range%20(RVRG)%20Optimization.ipynb)
.
Special Constraints[¶](https://riskfolio-lib.readthedocs.io/en/latest/examples.html#special-constraints "Link to this heading")
--------------------------------------------------------------------------------------------------------------------------------
* [Index Tracking/Replicating Portfolios](https://colab.research.google.com/github/dcajasn/Riskfolio-Lib/blob/master/examples/Tutorial%207%20-%20Index%20Tracking-Replicating%20Portfolios.ipynb)
.
* [Short and Leveraged Portfolios](https://colab.research.google.com/github/dcajasn/Riskfolio-Lib/blob/master/examples/Tutorial%208%20-%20Short%20and%20Leveraged%20Portfolios.ipynb)
.
* [Portfolio Optimization with Constraints on Return and Risk Measures](https://colab.research.google.com/github/dcajasn/Riskfolio-Lib/blob/master/examples/Tutorial%2021%20-%20Constraints%20on%20Return%20and%20Risk%20Measures.ipynb)
.
* [Portfolio Optimization with Dollar Neutral Constraint](https://colab.research.google.com/github/dcajasn/Riskfolio-Lib/blob/master/examples/Tutorial%2023%20-%20Dollar%20Neutral%20Portfolios.ipynb)
.
* [Portfolio Optimization with Constraints on Number of Assets and Number of Effective Assets](https://colab.research.google.com/github/dcajasn/Riskfolio-Lib/blob/master/examples/Tutorial%2026%20-%20Constraints%20on%20Maximum%20Number%20of%20Assets.ipynb)
.
* [Portfolio Optimization with Integer Constraints](https://colab.research.google.com/github/dcajasn/Riskfolio-Lib/blob/master/examples/Tutorial%2052%20-%20Portfolio%20Optimization%20with%20Integer%20Constraints.ipynb)
.
Risk Factors Models[¶](https://riskfolio-lib.readthedocs.io/en/latest/examples.html#risk-factors-models "Link to this heading")
--------------------------------------------------------------------------------------------------------------------------------
* [Mean Risk Portfolio Optimization using Risk Factors and Stepwise Regression](https://colab.research.google.com/github/dcajasn/Riskfolio-Lib/blob/master/examples/Tutorial%202%20-%20Portfolio%20Optimization%20using%20Risk%20Factors%20and%20Stepwise%20Regression.ipynb)
.
* [Mean Risk Portfolio Optimization using Risk Factors and Principal Component Regression](https://colab.research.google.com/github/dcajasn/Riskfolio-Lib/blob/master/examples/Tutorial%209%20-%20Portfolio%20Optimization%20using%20Risk%20Factors%20and%20Principal%20Components%20Regression%20(PCR).ipynb)
.
* [Fixed Income Portfolio Optimization and Immunization](https://colab.research.google.com/github/dcajasn/Riskfolio-Lib/blob/master/examples/Tutorial%204%20-%20Bond%20Portfolio%20Optimization%20and%20Immunization.ipynb)
.
* [Vanilla Risk Parity Optimization using Risk Factors and Stepwise Regression](https://colab.research.google.com/github/dcajasn/Riskfolio-Lib/blob/master/examples/Tutorial%2011%20-%20Risk%20Parity%20Portfolio%20Optimization%20using%20Risk%20Factors%20and%20Stepwise%20Regression.ipynb)
.
* [Mean Kurtosis Portfolio Optimization using Risk Factors](https://colab.research.google.com/github/dcajasn/Riskfolio-Lib/blob/master/examples/Tutorial%2053%20-%20Mean%20Kurtosis%20Optimization%20using%20Risk%20Factors.ipynb)
.
Black Litterman Models[¶](https://riskfolio-lib.readthedocs.io/en/latest/examples.html#black-litterman-models "Link to this heading")
--------------------------------------------------------------------------------------------------------------------------------------
* [Mean Risk Portfolio Optimization using Black Litterman Model](https://colab.research.google.com/github/dcajasn/Riskfolio-Lib/blob/master/examples/Tutorial%203%20-%20Mean%20Risk%20Optimization%20using%20Black%20Litterman.ipynb)
.
* [Mean Risk Portfolio Optimization using Black Litterman Model and Risk Factors Models (Black Litterman Bayesian and Augmented Black Litterman)](https://colab.research.google.com/github/dcajasn/Riskfolio-Lib/blob/master/examples/Tutorial%2020%20-%20Mean%20Risk%20Optimization%20using%20Black%20Litterman%20and%20Risk%20Factors%20Models.ipynb)
.
Risk Parity Models[¶](https://riskfolio-lib.readthedocs.io/en/latest/examples.html#risk-parity-models "Link to this heading")
------------------------------------------------------------------------------------------------------------------------------
* [Vanilla Risk Parity Portfolio Optimization using historical estimates](https://colab.research.google.com/github/dcajasn/Riskfolio-Lib/blob/master/examples/Tutorial%2010%20-%20Risk%20Parity%20Portfolio%20Optimization.ipynb)
.
* [Relaxed Risk Parity Portfolio Optimization](https://colab.research.google.com/github/dcajasn/Riskfolio-Lib/blob/master/examples/Tutorial%2032%20-%20Relaxed%20Risk%20Parity%20Portfolio%20Optimization.ipynb)
.
* [Risk Parity with Constraints using the Risk Budgeting Approach](https://colab.research.google.com/github/dcajasn/Riskfolio-Lib/blob/master/examples/Tutorial%2033%20-%20Risk%20Parity%20with%20Constraints%20using%20the%20Risk%20Budgeting%20Approach.ipynb)
.
* [Risk Parity with a Risk Constraint per Classes](https://colab.research.google.com/github/dcajasn/Riskfolio-Lib/blob/master/examples/Tutorial%2043%20-%20Risk%20Parity%20with%20a%20Risk%20Constraint%20per%20Classes.ipynb)
.
* [Risk Parity with Risk Factors](https://colab.research.google.com/github/dcajasn/Riskfolio-Lib/blob/master/examples/Tutorial%2047%20-%20Risk%20Parity%20with%20Risk%20Factors.ipynb)
.
* [Mean Variance Portfolio Optimization with Risk Contribution Inequalities Constraints](https://colab.research.google.com/github/dcajasn/Riskfolio-Lib/blob/master/examples/Tutorial%2048%20-%20Classic%20Mean%20Variance%20Optimization%20with%20Risk%20Contribution%20Inequalities%20Constraints.ipynb)
.
* [Mean Variance Portfolio Optimization with Risk Factor Contribution Inequalities Constraints](https://colab.research.google.com/github/dcajasn/Riskfolio-Lib/blob/master/examples/Tutorial%2051%20-%20Classic%20Mean%20Variance%20Optimization%20with%20Risk%20Factor%20Contribution%20Inequalities%20Constraints.ipynb)
.
Hierarchical Clustering Portfolio Optimization[¶](https://riskfolio-lib.readthedocs.io/en/latest/examples.html#hierarchical-clustering-portfolio-optimization "Link to this heading")
--------------------------------------------------------------------------------------------------------------------------------------------------------------------------------------
* [Hierarchical Risk Parity (HRP) Portfolio Optimization](https://colab.research.google.com/github/dcajasn/Riskfolio-Lib/blob/master/examples/Tutorial%2024%20-%20Hierarchical%20Risk%20Parity%20(HRP)%20Portfolio%20Optimization.ipynb)
.
* [Hierarchical Equal Risk Contribution (HERC) Portfolio Optimization](https://colab.research.google.com/github/dcajasn/Riskfolio-Lib/blob/master/examples/Tutorial%2025%20-%20Hierarchical%20Equal%20Risk%20Contribution%20(HERC)%20Portfolio%20Optimization.ipynb)
.
* [Hierarchical Equal Risk Contribution with Equally Weights within Clusters (HERC2) Portfolio Optimization](https://colab.research.google.com/github/dcajasn/Riskfolio-Lib/blob/master/examples/Tutorial%2027%20-%20HERC%20with%20Equal%20Weights%20within%20Clusters%20(HERC2).ipynb)
.
* [Hierarchical Risk Parity with Constraints](https://colab.research.google.com/github/dcajasn/Riskfolio-Lib/blob/master/examples/Tutorial%2029%20-%20Hierarchical%20Risk%20Parity%20(HRP)%20Portfolio%20Optimization%20with%20Constraints.ipynb)
.
* [Nested Clustered Optimization (NCO)](https://colab.research.google.com/github/dcajasn/Riskfolio-Lib/blob/master/examples/Tutorial%2030%20-%20Nested%20Clustered%20Optimization%20(NCO).ipynb)
.
* [Hierarchical Portfolios with Custom Covariance](https://colab.research.google.com/github/dcajasn/Riskfolio-Lib/blob/master/examples/Tutorial%2031%20-%20Hierarchical%20Portfolios%20with%20Custom%20Covariance.ipynb)
.
* [Hierarchical Equal Risk Contribution (HERC) with Constraints](https://colab.research.google.com/github/dcajasn/Riskfolio-Lib/blob/master/examples/Tutorial%2044%20-%20Hierarchical%20Equal%20Risk%20Contribution%20(HERC)%20Portfolio%20Optimization%20with%20Constraints.ipynb)
.
* [Nested Clustered Optimization (NCO) with Constraints](https://colab.research.google.com/github/dcajasn/Riskfolio-Lib/blob/master/examples/Tutorial%2045%20-%20Nested%20Clustered%20Optimization%20(NCO)%20Portfolio%20Optimization%20with%20Constraints.ipynb)
.
Graph Theory Constraints[¶](https://riskfolio-lib.readthedocs.io/en/latest/examples.html#graph-theory-constraints "Link to this heading")
------------------------------------------------------------------------------------------------------------------------------------------
* [Hierarchical Clustering and Networks](https://colab.research.google.com/github/dcajasn/Riskfolio-Lib/blob/master/examples/Tutorial%2028%20-%20Hierarchical%20Clustering%20and%20Networks.ipynb)
.
* [Classic Mean Risk Optimization with Network and Dendrogram Constraints](https://colab.research.google.com/github/dcajasn/Riskfolio-Lib/blob/master/examples/Tutorial%2046%20-%20Classic%20Mean%20Risk%20Optimization%20with%20Network%20and%20Dendrogram%20Constraints.ipynb)
.
Backtesting[¶](https://riskfolio-lib.readthedocs.io/en/latest/examples.html#backtesting "Link to this heading")
----------------------------------------------------------------------------------------------------------------
* [Multi Assets Algorithmic Trading Backtesting using Backtrader](https://colab.research.google.com/github/dcajasn/Riskfolio-Lib/blob/master/examples/Tutorial%205%20-%20Multi%20Assets%20Algorithmic%20Trading%20Backtesting%20with%20Backtrader.ipynb)
(matplotlib=3.2.2 for compatibility with backtrader=1.9.76.123. We don’t recommend to try to reproduce this example due the compatibility problems of Backtrader).
* [Multi Assets Algorithmic Trading Backtesting using Vectorbt](https://colab.research.google.com/github/dcajasn/Riskfolio-Lib/blob/master/examples/Tutorial%2018%20-%20Multi%20Assets%20Algorithmic%20Trading%20Backtesting%20with%20Vectorbt.ipynb)
(vectorbt=0.26.1).
Excel and Reporting[¶](https://riskfolio-lib.readthedocs.io/en/latest/examples.html#excel-and-reporting "Link to this heading")
--------------------------------------------------------------------------------------------------------------------------------
* [Riskfolio-Lib and Xlwings](https://colab.research.google.com/github/dcajasn/Riskfolio-Lib/blob/master/examples/Tutorial%2013%20-%20Riskfolio-Lib%20and%20Xlwings.ipynb)
.
* [Riskfolio-Lib Reports in Jupyter Notebook and Excel](https://colab.research.google.com/github/dcajasn/Riskfolio-Lib/blob/master/examples/Tutorial%2016%20-%20Riskfolio-Lib%20Reports%20in%20Jupyter%20Notebook%20and%20Excel.ipynb)
.
---
# Authors - Riskfolio-Lib 7.2
Authors[¶](https://riskfolio-lib.readthedocs.io/en/latest/authors.html#authors "Link to this heading")
=======================================================================================================
[Buy Advanced Portfolio Optimization Book on Springer](https://www.kqzyfj.com/click-101359873-15150084?url=https%3A%2F%2Flink.springer.com%2Fbook%2F9783031843037)
[Enroll in the Portfolio Optimization with Python Course](https://www.paypal.com/ncp/payment/GN55W4UQ7VAMN)
[](https://github.com/sponsors/dcajasn)
[](https://ko-fi.com/B0B833SXD)
* **Dany Cajas**
I’m a BSc in Economic Engineering at Universidad Nacional de Ingeniería and MA in Finance at Universidad del Pacífico. I am very interested in quantitative finance. For more about me, you can visit:
* My blog [financioneroncios](https://financioneroncios.wordpress.com/)
.
* My [linkedin](https://www.linkedin.com/in/dany-cajas/)
.
* My [SSRN author page](https://papers.ssrn.com/sol3/cf_dev/AbsByAuth.cfm?per_id=2931756)
where you can find all my working papers.
* Or write me to [dcajasn@gmail.com](mailto:dcajasn%40gmail.com)
.
I like to learn and apply my knowledge in practical applications; for this reason, I started my blog to practice and share in my native language the things that I’ve been learned until now. One topic that always have been very interesting to me is portfolio optimization. However, I realized that open-source libraries (python) are few (there are among one and four) and are mainly focused on mean variance optimization, ignoring advances in other convex risk measures (CVaR, MAD, Maximum Drawdown, etc.) and other estimations techniques like robust estimates, Black Litterman and risk factors models. For this reason, I developed Riskfolio-Lib, a well documented library that will help students, academics and practitioners to apply mathematically complex optimization models in their strategic asset allocation process.
---
# Contributing - Riskfolio-Lib 7.2
[Skip to content](https://riskfolio-lib.readthedocs.io/en/latest/contributing.html#how-to-contribute)
Contributing[¶](https://riskfolio-lib.readthedocs.io/en/latest/contributing.html#contributing "Link to this heading")
======================================================================================================================
[Buy Advanced Portfolio Optimization Book on Springer](https://www.kqzyfj.com/click-101359873-15150084?url=https%3A%2F%2Flink.springer.com%2Fbook%2F9783031843037)
[Enroll in the Portfolio Optimization with Python Course](https://www.paypal.com/ncp/payment/GN55W4UQ7VAMN)
[](https://github.com/sponsors/dcajasn)
[](https://ko-fi.com/B0B833SXD)
How to contribute?[¶](https://riskfolio-lib.readthedocs.io/en/latest/contributing.html#how-to-contribute "Link to this heading")
---------------------------------------------------------------------------------------------------------------------------------
I would like to people help me to:
* Improve documentation.
* Improve performance of existing code.
* Add new optimization objectives functions, robust estimation techniques or new functionalities.
* Write more examples using jupyter notebooks.
* Help me to write tests using pytest.
* Recommend new journal papers, articles, blog posts related to convex portfolio optimization that you think will improve the features of Riskfoli-Lib.
Do you have any questions?[¶](https://riskfolio-lib.readthedocs.io/en/latest/contributing.html#do-you-have-any-questions "Link to this heading")
-------------------------------------------------------------------------------------------------------------------------------------------------
If you have any questions related to Riskfolio-Lib, please [raise an issue](https://github.com/dcajasn/Riskfolio-Lib/issues)
and I will tag it as a question.
If you have questions _unrelated_ to Riskfolio-Lib or want advisory, contact me through my blog [financioneroncios](https://financioneroncios.wordpress.com/)
, my [linkedin](https://www.linkedin.com/in/dany-cajas/)
or write me an email to [dany.cajas.n@uni.pe](mailto:dany.cajas.n%40uni.pe)
---
# License - Riskfolio-Lib 7.2
License[¶](https://riskfolio-lib.readthedocs.io/en/latest/license.html#license "Link to this heading")
=======================================================================================================
[Buy Advanced Portfolio Optimization Book on Springer](https://www.kqzyfj.com/click-101359873-15150084?url=https%3A%2F%2Flink.springer.com%2Fbook%2F9783031843037)
[Enroll in the Portfolio Optimization with Python Course](https://www.paypal.com/ncp/payment/GN55W4UQ7VAMN)
[](https://github.com/sponsors/dcajasn)
[](https://ko-fi.com/B0B833SXD)
Copyright (c) 2020-2026, Dany Cajas All rights reserved.
Redistribution and use in source and binary forms, with or without modification, are permitted provided that the following conditions are met:
* Redistributions of source code must retain the above copyright notice, this list of conditions and the following disclaimer.
* Redistributions in binary form must reproduce the above copyright notice, this list of conditions and the following disclaimer in the documentation and/or other materials provided with the distribution.
* Neither the name of Riskfolio-Lib nor the names of its contributors may be used to endorse or promote products derived from this software without specific prior written permission.
THIS SOFTWARE IS PROVIDED BY THE COPYRIGHT HOLDERS AND CONTRIBUTORS “AS IS” AND ANY EXPRESS OR IMPLIED WARRANTIES, INCLUDING, BUT NOT LIMITED TO, THE IMPLIED WARRANTIES OF MERCHANTABILITY AND FITNESS FOR A PARTICULAR PURPOSE ARE DISCLAIMED. IN NO EVENT SHALL THE COPYRIGHT HOLDER OR CONTRIBUTORS BE LIABLE FOR ANY DIRECT, INDIRECT, INCIDENTAL, SPECIAL, EXEMPLARY, OR CONSEQUENTIAL DAMAGES (INCLUDING, BUT NOT LIMITED TO, PROCUREMENT OF SUBSTITUTE GOODS OR SERVICES; LOSS OF USE, DATA, OR PROFITS; OR BUSINESS INTERRUPTION) HOWEVER CAUSED AND ON ANY THEORY OF LIABILITY, WHETHER IN CONTRACT, STRICT LIABILITY, OR TORT (INCLUDING NEGLIGENCE OR OTHERWISE) ARISING IN ANY WAY OUT OF THE USE OF THIS SOFTWARE, EVEN IF ADVISED OF THE POSSIBILITY OF SUCH DAMAGE.
---
# Changelog - Riskfolio-Lib 7.2
[Skip to content](https://riskfolio-lib.readthedocs.io/en/latest/changelog.html#version-7-2-0)
Changelog[¶](https://riskfolio-lib.readthedocs.io/en/latest/changelog.html#changelog "Link to this heading")
=============================================================================================================
[Buy Advanced Portfolio Optimization Book on Springer](https://www.kqzyfj.com/click-101359873-15150084?url=https%3A%2F%2Flink.springer.com%2Fbook%2F9783031843037)
[Enroll in the Portfolio Optimization with Python Course](https://www.paypal.com/ncp/payment/GN55W4UQ7VAMN)
[](https://github.com/sponsors/dcajasn)
[](https://ko-fi.com/B0B833SXD)
Version 7.2.0[¶](https://riskfolio-lib.readthedocs.io/en/latest/changelog.html#version-7-2-0 "Link to this heading")
---------------------------------------------------------------------------------------------------------------------
* Add functions that allow to calculate estimators of coskewness tensor and cokurtosis square matrix based on risk factor models.
* Add the possibility to optimize portfolio kurtosis using an estimator of cokurtosis square matrix based on risk factor models.
* Add the possibility to add constraints on portfolio kurtosis using an estimator of cokurtosis square matrix based on risk factor models.
Version 7.1.0[¶](https://riskfolio-lib.readthedocs.io/en/latest/changelog.html#version-7-1-0 "Link to this heading")
---------------------------------------------------------------------------------------------------------------------
* Add the possibility to included integer constraints such as cardinality constraints on assets and categories, mutually exclusive constraints and join investment constraints in the portfolio object.
* Add a new helper function that allows users to create the matrices that represent the integer constraints.
* Fixed a bug related to leverage portfolios.
Version 7.0.0[¶](https://riskfolio-lib.readthedocs.io/en/latest/changelog.html#version-7-0-0 "Link to this heading")
---------------------------------------------------------------------------------------------------------------------
* Add two new convex risk measures: EVaR Range and RLVaR Range, to the Portfolio object.
* Add three new risk measures: VaR Range, EVaR Range and RLVaR Range, to the HCPortfolio object.
* Add the generalization of risk parity for variance through inequality constraints on the risk contributions of assets to the Portfolio object.
* Add the generalization of factor risk parity for variance through inequality constraints on the risk contributions of risk factors to the Portfolio object.
* Add a function to calculate the Brinson Performance Attribution per class and aggregate.
* Add a plot function to show the Brinson Performance Attribution.
* Add functions to calculate the VaR Range, EVaR Range and RLVaR Range.
* Update plot functions to consider EVaR Range and RLVaR Range.
* Update duplication, elimination and summation matrices functions to consider or not the diagonal of the symmetric matrix.
Version 6.3.0[¶](https://riskfolio-lib.readthedocs.io/en/latest/changelog.html#version-6-3-0 "Link to this heading")
---------------------------------------------------------------------------------------------------------------------
* Add new functions to calculate the number of effective assets (NEA) and the average centrality of the portfolio.
* Add the possibility to use neighborhood and cluster network constraints at the same time.
* Fixed some bugs in HRP and HERC when we add constraints.
* Fixed a bug in the duplication\_summation\_matrix.
* Fixed tight layout in plot functions that uses multiple axes.
Version 6.2.0[¶](https://riskfolio-lib.readthedocs.io/en/latest/changelog.html#version-6-2-0 "Link to this heading")
---------------------------------------------------------------------------------------------------------------------
* Improvement in calculation speed of duplication\_matrix, duplication\_elimination\_matrix and duplication\_summation\_matrix functions using a vectorized formula.
* Fixed formulation of risk parity with risk factors model that produced incorrect results when using the MOSEK solver.
* Fixed some bugs in PlotFunctions module.
* Fixed some bugs in HCPortfolio related to custom\_mu vector and use of Kurtosis and Semi Kurtosis as risk measures.
* Standardized the way additional parameters to estimate mean vector and covariance matrix are entered.
Version 6.1.0[¶](https://riskfolio-lib.readthedocs.io/en/latest/changelog.html#version-6-1-0 "Link to this heading")
---------------------------------------------------------------------------------------------------------------------
* Implements standarized silhouette score to determine the optimal number of clusters.
* Fix plot\_clusters function to plot clusters and heatmap in same order of codependence matrix. Originally it plots the codependece matrix with axis x inverted.
Version 6.0.0[¶](https://riskfolio-lib.readthedocs.io/en/latest/changelog.html#version-6-0-0 "Link to this heading")
---------------------------------------------------------------------------------------------------------------------
* Implements risk parity optimization based on explicit risk factors and principal components.
* Implements new formulations of Gini Mean Difference, Tail Gini, Range, CVaR Range and Tail Gini Range that improves speed compared to formulations based on the owa portfolio model.
* Improves the calculation of elliptical uncertainty sets for worst case optimization.
* Add new functions that allow us to calculate the risk contribution per explicit risk factors and principal components.
* Add new functions that allow us to plot the risk contribution per explicit risk factors and principal components.
Version 5.0.0[¶](https://riskfolio-lib.readthedocs.io/en/latest/changelog.html#version-5-0-0 "Link to this heading")
---------------------------------------------------------------------------------------------------------------------
* Implements new kind of constraints that incorporates the information from networks like the Minimum Spanning Tree and Maximally Filtered Graph into the portfolio optimization models: return-risk portfolio, owa portfolio and worst case portfolio.
* Implements new kind of constraints that incorporates the information from dendrograms into the portfolio optimization models: return-risk portfolio, owa portfolio and worst case portfolio.
* Improves the speed of several functions using the c++ linear algebra library Eigen and c++ eigenvalues library Spectra.
* Add new functions that allow us to plot the relationship between graphs and asset allocation.
* Add new functions that allow us to create constraints based on graphs information.
* Add a new example about applications of networks and dendrograms constraints in portfolio optimization problems.
* Fixed some errors related to HCPortfolio with constraints.
* Fixed some errors in some plots.
Version 4.4.0[¶](https://riskfolio-lib.readthedocs.io/en/latest/changelog.html#version-4-4-0 "Link to this heading")
---------------------------------------------------------------------------------------------------------------------
* Implements the approximate Kurtosis model through sum of squared quadratic forms for large scale kurtosis optimization.
* Add the block vectorization operator.
Version 4.3.0[¶](https://riskfolio-lib.readthedocs.io/en/latest/changelog.html#version-4-3-0 "Link to this heading")
---------------------------------------------------------------------------------------------------------------------
* Implements custom constraints for the Relaxed Risk Parity portfolio model.
* Add three new methods to estimate the mean vector: James-Stein, Bayes-Stein and BOP.
Version 4.2.0[¶](https://riskfolio-lib.readthedocs.io/en/latest/changelog.html#version-4-2-0 "Link to this heading")
---------------------------------------------------------------------------------------------------------------------
* Implements constraints for the Hierarchical Equal Risk Contribution (HERC) and Nested Clustered Optimization (NCO) portfolio models.
* Add the option to show risk contributions as a percentage of total risk in risk contribution plot.
* Repairs some bugs.
Version 4.1.0[¶](https://riskfolio-lib.readthedocs.io/en/latest/changelog.html#version-4-1-0 "Link to this heading")
---------------------------------------------------------------------------------------------------------------------
* Implements the Relativistic Value at Risk and Relativistic Drawdown at Risk portfolio models.
* Implements the Higher L-moments portfolio model function as an special case of OWA portfolio.
* Adds functions to calculate L-moments.
* Adds a function to calculate risk contribution constraints on asset classes.
* Repairs some bugs.
Version 4.0.0[¶](https://riskfolio-lib.readthedocs.io/en/latest/changelog.html#version-4-0-0 "Link to this heading")
---------------------------------------------------------------------------------------------------------------------
* Implements Kurtosis and Semi Kurtosis portfolio models based on parametric approach.
* Implements new c++ based functions to speed up kurtosis model calculations.
* Repairs some bugs.
Version 3.3.0[¶](https://riskfolio-lib.readthedocs.io/en/latest/changelog.html#version-3-3-0 "Link to this heading")
---------------------------------------------------------------------------------------------------------------------
* Adds Kendall Tau and Gerber statistic as options for codependence matrix in HCPortfolio object.
* Adds Gerber statistic as an option for covariance matrix estimator in Portfolio and HCPortfolio objects.
Version 3.2.0[¶](https://riskfolio-lib.readthedocs.io/en/latest/changelog.html#version-3-2-0 "Link to this heading")
---------------------------------------------------------------------------------------------------------------------
* Implements reformulations of portfolio models based on drawdowns to speed up calculations.
* Adds some tests for portfolio object and hcportfolio object.
Version 3.1.0[¶](https://riskfolio-lib.readthedocs.io/en/latest/changelog.html#version-3-1-0 "Link to this heading")
---------------------------------------------------------------------------------------------------------------------
* Implements a reformulation of OWA portfolio optimization to speed up calculations.
Version 3.0.0[¶](https://riskfolio-lib.readthedocs.io/en/latest/changelog.html#version-3-0-0 "Link to this heading")
---------------------------------------------------------------------------------------------------------------------
* Implements 5 additional risk measures for mean risk model: Gini Mean Difference, Tail Gini, Range, CVaR range and Tail Gini range.
* Implements 4 additional risk measures for risk parity model: Gini Mean Difference, Tail Gini, CVaR range and Tail Gini range.
* Implements the OWA Portfolio Optimization model for custom vector of weights and a module to build OWA weights for some special cases.
* Implements a function to plot range risk measures.
* Adds the option to use Graphical Lasso, j-Logo, denoising and detoning covariance estimates.
Version 2.0.0[¶](https://riskfolio-lib.readthedocs.io/en/latest/changelog.html#version-2-0-0 "Link to this heading")
---------------------------------------------------------------------------------------------------------------------
* Implement Nested Clustered Optimization (NCO) model with four objective functions.
* Implements the Relaxed Risk Parity model.
* Implements the Risk Budgeting approach for Risk Parity Portfolios with constraints.
* Adds the option to use custom covariance in Hierarchical Clustering Portfolios.
Version 1.0.0[¶](https://riskfolio-lib.readthedocs.io/en/latest/changelog.html#version-1-0-0 "Link to this heading")
---------------------------------------------------------------------------------------------------------------------
* Redesigns of Riskfolio-Lib interface (Only import riskfolio for all functions).
* Implements Hierarchical Risk Parity (HRP) model with constraints on assets’ weights.
* Implements a function that helps to build constraints for the HRP model.
* Implements the Direct Bubble Hierarchical Tree (DBHT) linkage method for HRP and HERC models.
* Implements a function that plots relationship among assets in a network using Minimum Spanning Tree (MST) and Planar Maximally Filtered Graph (PMFG).
* Adds two new codependence measures: mutual information and lower tail dependence index.
Version 0.4.0[¶](https://riskfolio-lib.readthedocs.io/en/latest/changelog.html#version-0-4-0 "Link to this heading")
---------------------------------------------------------------------------------------------------------------------
* Implements Hierarchical Equal Risk Contribution with equally weights within clusters (HERC2).
* Implements a function that help us to discretize portfolio weights into number of shares given an investment amount.
* Implements the option to select the method to estimate covariance in HRP, HERC and HERC2.
* Adds the option to add constraints on the number of assets and the number of effective assets.
* Fixes an error in two\_diff\_gap\_stat() when number of assets is too small.
* Fixes an error on forward\_regression() and backward\_regression() when there is no significant feature in regression modes using p-value criterion.
* Adds an example that shows how to build HERC2 portfolios.
* Adds an example that shows how to build constraints on the number of assets and number of effective assets.
Version 0.3.0[¶](https://riskfolio-lib.readthedocs.io/en/latest/changelog.html#version-0-3-0 "Link to this heading")
---------------------------------------------------------------------------------------------------------------------
* Implements Hierarchical Risk Parity (HRP) and Hierarchical Equal Risk Parity (HERC).
* Implements the function plot\_clusters() and plot\_dendrogram() that help us to identify clusters based on a distance correlation metric.
* Implements the function assets\_clusters() that help us to create asset classes based on hierarchical clusters.
* Adds an example that shows how to build Hierarchical Risk Parity portfolios.
* Adds an example that shows how to build Hierarchical Equal Risk Parity portfolios.
Version 0.2.0[¶](https://riskfolio-lib.readthedocs.io/en/latest/changelog.html#version-0-2-0 "Link to this heading")
---------------------------------------------------------------------------------------------------------------------
* Implements Logarithmic Mean Risk (Kelly Criterion) Portfolio Optimization models.
* Implements the function plot\_bar() that help us to plot portfolios with negative weights.
* Adds the option to build dollar neutral portfolios.
* Adds an example that shows how to build Logarithmic Mean Risk (Kelly Criterion) portfolios.
* Adds an example that shows how to build dollar neutral portfolios.
Version 0.1.5[¶](https://riskfolio-lib.readthedocs.io/en/latest/changelog.html#version-0-1-5 "Link to this heading")
---------------------------------------------------------------------------------------------------------------------
* Adds the option to add a constraint on minimum portfolio return.
* Adds an example of how to add constraints on portfolio return and risk measures.
Version 0.1.4[¶](https://riskfolio-lib.readthedocs.io/en/latest/changelog.html#version-0-1-4 "Link to this heading")
---------------------------------------------------------------------------------------------------------------------
* Adds Black Litterman with factors in two flavors: Black Litterman Bayesian model and Augmented Black Litterman model.
* Implements factors\_views, a function that allows to design views on risk factors for Black Litterman with factors.
* Repairs some bugs.
Version 0.1.2[¶](https://riskfolio-lib.readthedocs.io/en/latest/changelog.html#version-0-1-2 "Link to this heading")
---------------------------------------------------------------------------------------------------------------------
* Adds Entropic Drawdown at Risk for Mean Risk Portfolio Optimization and Risk Parity Portfolio Optimization.
* Repairs some bugs.
Version 0.1.1[¶](https://riskfolio-lib.readthedocs.io/en/latest/changelog.html#version-0-1-1 "Link to this heading")
---------------------------------------------------------------------------------------------------------------------
* Repairs some bugs in Portfolio related to Semi Variance and UCI.
* Implements an option to annualize returns and risk in plot\_frontier, Jupyter Notebook and Excel reports.
* Adds examples using Vectorbt for Backtesting and MOSEK for large scale problems.
Version 0.1.0[¶](https://riskfolio-lib.readthedocs.io/en/latest/changelog.html#version-0-1-0 "Link to this heading")
---------------------------------------------------------------------------------------------------------------------
* Repairs some bugs in RiskFunctions.
* Implements the Reports module that helps to build reports on Jupyter Notebook and Excel.
* Implements plot\_table, a function that resume some indicators of a portfolio.
* Adds Entropic Value at Risk for Mean Risk Portfolio Optimization and Risk Parity Portfolio Optimization.
Version 0.0.7[¶](https://riskfolio-lib.readthedocs.io/en/latest/changelog.html#version-0-0-7 "Link to this heading")
---------------------------------------------------------------------------------------------------------------------
* Implements normal assumption method to estimate box and elliptical uncertainty sets for Worst Case Optimization.
* Implements elliptical uncertainty sets for covariance matrix.
* Adds Ulcer Index for Mean Risk Portfolio Optimization and Risk Parity Portfolio Optimization.
* Implements functions to calculate Ulcer Index.
Version 0.0.6[¶](https://riskfolio-lib.readthedocs.io/en/latest/changelog.html#version-0-0-6 "Link to this heading")
---------------------------------------------------------------------------------------------------------------------
* Repairs some bugs.
* Implements bootstrapping methods to estimate box and elliptical uncertainty sets for Worst Case Optimization.
* Implements Worst Case Mean Variance Portfolio Optimization using box and elliptical uncertainty sets.
Version 0.0.5[¶](https://riskfolio-lib.readthedocs.io/en/latest/changelog.html#version-0-0-5 "Link to this heading")
---------------------------------------------------------------------------------------------------------------------
* Repairs some bugs.
* Implements Risk Parity Portfolio Optimization for 7 convex risk measures.
Version 0.0.4[¶](https://riskfolio-lib.readthedocs.io/en/latest/changelog.html#version-0-0-4 "Link to this heading")
---------------------------------------------------------------------------------------------------------------------
* Repairs some bugs.
* Update to make it compatible with cvxpy >=1.1.0
* Implements Principal Component Regression for loadings matrix estimation.
* Adds Akaike information criterion, Schwarz information criterion, R squared and adjusted R squared feature selection criterions in stepwise regression.
Version 0.0.3[¶](https://riskfolio-lib.readthedocs.io/en/latest/changelog.html#version-0-0-3 "Link to this heading")
---------------------------------------------------------------------------------------------------------------------
* Repairs some bugs.
* Implements an option for building constraints common for all assets classes.
Version 0.0.2[¶](https://riskfolio-lib.readthedocs.io/en/latest/changelog.html#version-0-0-2 "Link to this heading")
---------------------------------------------------------------------------------------------------------------------
* Repairs some bugs.
Version 0.0.1[¶](https://riskfolio-lib.readthedocs.io/en/latest/changelog.html#version-0-0-1 "Link to this heading")
---------------------------------------------------------------------------------------------------------------------
* Implements robust and ewma estimates.
* Implements Black Litterman model and risk factors models.
* Implements mean risk optimization with 10 risk measures.
---
# Reports Functions - Riskfolio-Lib 7.2
[Skip to content](https://riskfolio-lib.readthedocs.io/en/latest/reports.html#example)
Reports Functions[¶](https://riskfolio-lib.readthedocs.io/en/latest/reports.html#reports-functions "Link to this heading")
===========================================================================================================================
[Buy Advanced Portfolio Optimization Book on Springer](https://www.kqzyfj.com/click-101359873-15150084?url=https%3A%2F%2Flink.springer.com%2Fbook%2F9783031843037)
[Enroll in the Portfolio Optimization with Python Course](https://www.paypal.com/ncp/payment/GN55W4UQ7VAMN)
[](https://github.com/sponsors/dcajasn)
[](https://ko-fi.com/B0B833SXD)
This section explains some functions that allows us to create Jupyter Notebook and Excel reports that helps us to analyze quickly the properties of our portfolios.
The following example build an optimum portfolio and create a Jupyter Notebook and Excel report using the functions of this module.
Example[¶](https://riskfolio-lib.readthedocs.io/en/latest/reports.html#example "Link to this heading")
-------------------------------------------------------------------------------------------------------
`import numpy as np import pandas as pd import yfinance as yf import riskfolio as rp yf.pdr_override() # Date range start = '2016-01-01' end = '2019-12-30' # Tickers of assets tickers = ['JCI', 'TGT', 'CMCSA', 'CPB', 'MO', 'APA', 'MMC', 'JPM', 'ZION', 'PSA', 'BAX', 'BMY', 'LUV', 'PCAR', 'TXT', 'TMO', 'DE', 'MSFT', 'HPQ', 'SEE', 'VZ', 'CNP', 'NI', 'T', 'BA'] tickers.sort() # Downloading the data data = yf.download(tickers, start = start, end = end) data = data.loc[:,('Adj Close', slice(None))] data.columns = tickers assets = data.pct_change().dropna() Y = assets # Creating the Portfolio Object port = rp.Portfolio(returns=Y) # To display dataframes values in percentage format pd.options.display.float_format = '{:.4%}'.format # Choose the risk measure rm = 'MV' # Standard Deviation # Estimate inputs of the model (historical estimates) method_mu='hist' # Method to estimate expected returns based on historical data. method_cov='hist' # Method to estimate covariance matrix based on historical data. port.assets_stats(method_mu=method_mu, method_cov=method_cov) # Estimate the portfolio that maximizes the risk adjusted return ratio w = port.optimization(model='Classic', rm=rm, obj='Sharpe', rf=0.0, l=0, hist=True)`
Module Functions[¶](https://riskfolio-lib.readthedocs.io/en/latest/reports.html#module-Reports "Link to this heading")
-----------------------------------------------------------------------------------------------------------------------
Reports.jupyter\_report(_[returns](https://riskfolio-lib.readthedocs.io/en/latest/reports.html#Reports.jupyter_report.returns "Reports.jupyter_report.returns (Python parameter) — Assets returns DataFrame, where n_samples is the number of observations and n_assets is the number of assets.")
_, _[w](https://riskfolio-lib.readthedocs.io/en/latest/reports.html#Reports.jupyter_report.w "Reports.jupyter_report.w (Python parameter) — Portfolio weights, where n_assets is the number of assets.")
_, _[rm](https://riskfolio-lib.readthedocs.io/en/latest/reports.html#Reports.jupyter_report.rm "Reports.jupyter_report.rm (Python parameter) — Risk measure used to estimate risk contribution. The default is 'MV'.")
\=`'MV'`_, _[rf](https://riskfolio-lib.readthedocs.io/en/latest/reports.html#Reports.jupyter_report.rf "Reports.jupyter_report.rf (Python parameter) — Risk free rate or minimum acceptable return.")
\=`0`_, _[alpha](https://riskfolio-lib.readthedocs.io/en/latest/reports.html#Reports.jupyter_report.alpha "Reports.jupyter_report.alpha (Python parameter) — Significance level of VaR, CVaR, Tail Gini, EVaR, RLVaR, CDaR, EDaR and RLDaR.")
\=`0.05`_, _[a\_sim](https://riskfolio-lib.readthedocs.io/en/latest/reports.html#Reports.jupyter_report.a_sim "Reports.jupyter_report.a_sim (Python parameter) — Number of CVaRs used to approximate Tail Gini of losses.")
\=`100`_, _[beta](https://riskfolio-lib.readthedocs.io/en/latest/reports.html#Reports.jupyter_report.beta "Reports.jupyter_report.beta (Python parameter) — Significance level of CVaR and Tail Gini of gains.")
\=`None`_, _[b\_sim](https://riskfolio-lib.readthedocs.io/en/latest/reports.html#Reports.jupyter_report.b_sim "Reports.jupyter_report.b_sim (Python parameter) — Number of CVaRs used to approximate Tail Gini of gains.")
\=`None`_, _[kappa](https://riskfolio-lib.readthedocs.io/en/latest/reports.html#Reports.jupyter_report.kappa "Reports.jupyter_report.kappa (Python parameter) — Deformation parameter of RLVaR and RLDaR, must be between 0 and 1.")
\=`0.3`_, _[solver](https://riskfolio-lib.readthedocs.io/en/latest/reports.html#Reports.jupyter_report.solver "Reports.jupyter_report.solver (Python parameter) — Solver available for CVXPY that supports power cone programming and exponential cone programming. Used to calculate EVaR, EDaR, RLVaR and RLDaR.")
\=`'CLARABEL'`_, _[percentage](https://riskfolio-lib.readthedocs.io/en/latest/reports.html#Reports.jupyter_report.percentage "Reports.jupyter_report.percentage (Python parameter) — If risk contribution per asset is expressed as percentage or as a value.")
\=`False`_, _[erc\_line](https://riskfolio-lib.readthedocs.io/en/latest/reports.html#Reports.jupyter_report.erc_line "Reports.jupyter_report.erc_line (Python parameter) — If equal risk contribution line is plotted. The default is False.")
\=`True`_, _[color](https://riskfolio-lib.readthedocs.io/en/latest/reports.html#Reports.jupyter_report.color "Reports.jupyter_report.color (Python parameter) — Color used to plot each asset risk contribution. The default is 'tab:blue'.")
\=`'tab:blue'`_, _[erc\_linecolor](https://riskfolio-lib.readthedocs.io/en/latest/reports.html#Reports.jupyter_report.erc_linecolor "Reports.jupyter_report.erc_linecolor (Python parameter) — Color used to plot equal risk contribution line. The default is 'r'.")
\=`'r'`_, _[others](https://riskfolio-lib.readthedocs.io/en/latest/reports.html#Reports.jupyter_report.others "Reports.jupyter_report.others (Python parameter) — Percentage of others section.")
\=`0.05`_, _[nrow](https://riskfolio-lib.readthedocs.io/en/latest/reports.html#Reports.jupyter_report.nrow "Reports.jupyter_report.nrow (Python parameter) — Number of rows of the legend.")
\=`25`_, _[cmap](https://riskfolio-lib.readthedocs.io/en/latest/reports.html#Reports.jupyter_report.cmap "Reports.jupyter_report.cmap (Python parameter) — Color scale used to plot each asset weight. The default is 'tab20'.")
\=`'tab20'`_, _[height](https://riskfolio-lib.readthedocs.io/en/latest/reports.html#Reports.jupyter_report.height "Reports.jupyter_report.height (Python parameter) — Average height of charts in the image in inches.")
\=`6`_, _[width](https://riskfolio-lib.readthedocs.io/en/latest/reports.html#Reports.jupyter_report.width "Reports.jupyter_report.width (Python parameter) — Width of the image in inches.")
\=`14`_, _[t\_factor](https://riskfolio-lib.readthedocs.io/en/latest/reports.html#Reports.jupyter_report.t_factor "Reports.jupyter_report.t_factor (Python parameter) — Factor used to annualize expected return and expected risks for risk measures based on returns (not drawdowns).")
\=`252`_, _[ini\_days](https://riskfolio-lib.readthedocs.io/en/latest/reports.html#Reports.jupyter_report.ini_days "Reports.jupyter_report.ini_days (Python parameter) — If provided, it is the number of days of compounding for first return. It is used to calculate Compound Annual Growth Rate (CAGR).")
\=`1`_, _[days\_per\_year](https://riskfolio-lib.readthedocs.io/en/latest/reports.html#Reports.jupyter_report.days_per_year "Reports.jupyter_report.days_per_year (Python parameter) — Days per year assumption.")
\=`252`_, _[bins](https://riskfolio-lib.readthedocs.io/en/latest/reports.html#Reports.jupyter_report.bins "Reports.jupyter_report.bins (Python parameter) — Number of bins of the histogram.")
\=`50`_)[\[source\]](https://riskfolio-lib.readthedocs.io/en/latest/_modules/Reports.html#jupyter_report)
[¶](https://riskfolio-lib.readthedocs.io/en/latest/reports.html#Reports.jupyter_report "Link to this definition")
Create a matplotlib report with useful information to analyze risk and profitability of investment portfolios.
Parameters:[¶](https://riskfolio-lib.readthedocs.io/en/latest/reports.html#Reports.jupyter_report-parameters "Permalink to this headline")
returns : DataFrame of shape (n\_samples, n\_assets), optional[¶](https://riskfolio-lib.readthedocs.io/en/latest/reports.html#Reports.jupyter_report.returns "Permalink to this definition")
Assets returns DataFrame, where n\_samples is the number of observations and n\_assets is the number of assets.
w : DataFrame or Series of shape (n\_assets, 1)[¶](https://riskfolio-lib.readthedocs.io/en/latest/reports.html#Reports.jupyter_report.w "Permalink to this definition")
Portfolio weights, where n\_assets is the number of assets.
rm : [str](https://docs.python.org/3.11/library/stdtypes.html#str "(in Python v3.11)")
, optional[¶](https://riskfolio-lib.readthedocs.io/en/latest/reports.html#Reports.jupyter_report.rm "Permalink to this definition")
Risk measure used to estimate risk contribution. The default is ‘MV’. Possible values are:
* ’MV’: Standard Deviation.
* ’KT’: Square Root Kurtosis.
* ’MAD’: Mean Absolute Deviation.
* ’GMD’: Gini Mean Difference.
* ’MSV’: Semi Standard Deviation.
* ’SKT’: Square Root Semi Kurtosis.
* ’FLPM’: First Lower Partial Moment (Omega Ratio).
* ’SLPM’: Second Lower Partial Moment (Sortino Ratio).
* ’CVaR’: Conditional Value at Risk.
* ’TG’: Tail Gini.
* ’EVaR’: Entropic Value at Risk.
* ’RLVaR’: Relativistc Value at Risk.
* ’WR’: Worst Realization (Minimax).
* ’CVRG’: CVaR range of returns.
* ’TGRG’: Tail Gini range of returns.
* ’RG’: Range of returns.
* ’MDD’: Maximum Drawdown of uncompounded cumulative returns (Calmar Ratio).
* ’ADD’: Average Drawdown of uncompounded cumulative returns.
* ’DaR’: Drawdown at Risk of uncompounded cumulative returns.
* ’CDaR’: Conditional Drawdown at Risk of uncompounded cumulative returns.
* ’EDaR’: Entropic Drawdown at Risk of uncompounded cumulative returns.
* ’RLDaR’: Relativistic Drawdown at Risk of uncompounded cumulative returns.
* ’UCI’: Ulcer Index of uncompounded cumulative returns.
rf : [float](https://docs.python.org/3.11/library/functions.html#float "(in Python v3.11)")
, optional[¶](https://riskfolio-lib.readthedocs.io/en/latest/reports.html#Reports.jupyter_report.rf "Permalink to this definition")
Risk free rate or minimum acceptable return. The default is 0.
alpha : [float](https://docs.python.org/3.11/library/functions.html#float "(in Python v3.11)")
, optional[¶](https://riskfolio-lib.readthedocs.io/en/latest/reports.html#Reports.jupyter_report.alpha "Permalink to this definition")
Significance level of VaR, CVaR, Tail Gini, EVaR, RLVaR, CDaR, EDaR and RLDaR. The default is 0.05. The default is 0.05.
a\_sim : [float](https://docs.python.org/3.11/library/functions.html#float "(in Python v3.11)")
, optional[¶](https://riskfolio-lib.readthedocs.io/en/latest/reports.html#Reports.jupyter_report.a_sim "Permalink to this definition")
Number of CVaRs used to approximate Tail Gini of losses. The default is 100.
beta : [float](https://docs.python.org/3.11/library/functions.html#float "(in Python v3.11)")
, optional[¶](https://riskfolio-lib.readthedocs.io/en/latest/reports.html#Reports.jupyter_report.beta "Permalink to this definition")
Significance level of CVaR and Tail Gini of gains. If None it duplicates alpha value. The default is None.
b\_sim : [float](https://docs.python.org/3.11/library/functions.html#float "(in Python v3.11)")
, optional[¶](https://riskfolio-lib.readthedocs.io/en/latest/reports.html#Reports.jupyter_report.b_sim "Permalink to this definition")
Number of CVaRs used to approximate Tail Gini of gains. If None it duplicates a\_sim value. The default is None.
kappa : [float](https://docs.python.org/3.11/library/functions.html#float "(in Python v3.11)")
, optional[¶](https://riskfolio-lib.readthedocs.io/en/latest/reports.html#Reports.jupyter_report.kappa "Permalink to this definition")
Deformation parameter of RLVaR and RLDaR, must be between 0 and 1. The default is 0.30.
solver : [str](https://docs.python.org/3.11/library/stdtypes.html#str "(in Python v3.11)")
, optional[¶](https://riskfolio-lib.readthedocs.io/en/latest/reports.html#Reports.jupyter_report.solver "Permalink to this definition")
Solver available for CVXPY that supports power cone programming and exponential cone programming. Used to calculate EVaR, EDaR, RLVaR and RLDaR. The default value is ‘CLARABEL’.
percentage : [bool](https://docs.python.org/3.11/library/functions.html#bool "(in Python v3.11)")
, optional[¶](https://riskfolio-lib.readthedocs.io/en/latest/reports.html#Reports.jupyter_report.percentage "Permalink to this definition")
If risk contribution per asset is expressed as percentage or as a value. The default is False.
erc\_line : [bool](https://docs.python.org/3.11/library/functions.html#bool "(in Python v3.11)")
, optional[¶](https://riskfolio-lib.readthedocs.io/en/latest/reports.html#Reports.jupyter_report.erc_line "Permalink to this definition")
If equal risk contribution line is plotted. The default is False.
color : [str](https://docs.python.org/3.11/library/stdtypes.html#str "(in Python v3.11)")
, optional[¶](https://riskfolio-lib.readthedocs.io/en/latest/reports.html#Reports.jupyter_report.color "Permalink to this definition")
Color used to plot each asset risk contribution. The default is ‘tab:blue’.
erc\_linecolor : [str](https://docs.python.org/3.11/library/stdtypes.html#str "(in Python v3.11)")
, optional[¶](https://riskfolio-lib.readthedocs.io/en/latest/reports.html#Reports.jupyter_report.erc_linecolor "Permalink to this definition")
Color used to plot equal risk contribution line. The default is ‘r’.
others : [float](https://docs.python.org/3.11/library/functions.html#float "(in Python v3.11)")
, optional[¶](https://riskfolio-lib.readthedocs.io/en/latest/reports.html#Reports.jupyter_report.others "Permalink to this definition")
Percentage of others section. The default is 0.05.
nrow : [int](https://docs.python.org/3.11/library/functions.html#int "(in Python v3.11)")
, optional[¶](https://riskfolio-lib.readthedocs.io/en/latest/reports.html#Reports.jupyter_report.nrow "Permalink to this definition")
Number of rows of the legend. The default is 25.
cmap : cmap, optional[¶](https://riskfolio-lib.readthedocs.io/en/latest/reports.html#Reports.jupyter_report.cmap "Permalink to this definition")
Color scale used to plot each asset weight. The default is ‘tab20’.
height : [float](https://docs.python.org/3.11/library/functions.html#float "(in Python v3.11)")
, optional[¶](https://riskfolio-lib.readthedocs.io/en/latest/reports.html#Reports.jupyter_report.height "Permalink to this definition")
Average height of charts in the image in inches. The default is 6.
width : [float](https://docs.python.org/3.11/library/functions.html#float "(in Python v3.11)")
, optional[¶](https://riskfolio-lib.readthedocs.io/en/latest/reports.html#Reports.jupyter_report.width "Permalink to this definition")
Width of the image in inches. The default is 14.
t\_factor : [float](https://docs.python.org/3.11/library/functions.html#float "(in Python v3.11)")
, optional[¶](https://riskfolio-lib.readthedocs.io/en/latest/reports.html#Reports.jupyter_report.t_factor "Permalink to this definition")
Factor used to annualize expected return and expected risks for risk measures based on returns (not drawdowns). The default is 252.
Annualized Return\=Return×t\_factorAnnualized Risk\=Risk×t\_factor
ini\_days : [float](https://docs.python.org/3.11/library/functions.html#float "(in Python v3.11)")
, optional[¶](https://riskfolio-lib.readthedocs.io/en/latest/reports.html#Reports.jupyter_report.ini_days "Permalink to this definition")
If provided, it is the number of days of compounding for first return. It is used to calculate Compound Annual Growth Rate (CAGR). This value depend on assumptions used in t\_factor, for example if data is monthly you can use 21 (252 days per year) or 30 (360 days per year). The default is 1 for daily returns.
days\_per\_year : [float](https://docs.python.org/3.11/library/functions.html#float "(in Python v3.11)")
, optional[¶](https://riskfolio-lib.readthedocs.io/en/latest/reports.html#Reports.jupyter_report.days_per_year "Permalink to this definition")
Days per year assumption. It is used to calculate Compound Annual Growth Rate (CAGR). Default value is 252 trading days per year.
bins : [float](https://docs.python.org/3.11/library/functions.html#float "(in Python v3.11)")
, optional[¶](https://riskfolio-lib.readthedocs.io/en/latest/reports.html#Reports.jupyter_report.bins "Permalink to this definition")
Number of bins of the histogram. The default is 50.
Raises:[¶](https://riskfolio-lib.readthedocs.io/en/latest/reports.html#Reports.jupyter_report-raises "Permalink to this headline")
[**ValueError**](https://docs.python.org/3.11/library/exceptions.html#ValueError "(in Python v3.11)")
– When the value cannot be calculated.
Returns:[¶](https://riskfolio-lib.readthedocs.io/en/latest/reports.html#Reports.jupyter_report-returns "Permalink to this headline")
**ax** – Returns the Axes object with the plot for further tweaking.
Return type:[¶](https://riskfolio-lib.readthedocs.io/en/latest/reports.html#Reports.jupyter_report-return-type "Permalink to this headline")
matplotlib axis of size (6,1)
Example
`ax = rp.jupyter_report(returns, w, rm='MV', rf=0, alpha=0.05, height=6, width=14, others=0.05, nrow=25)`
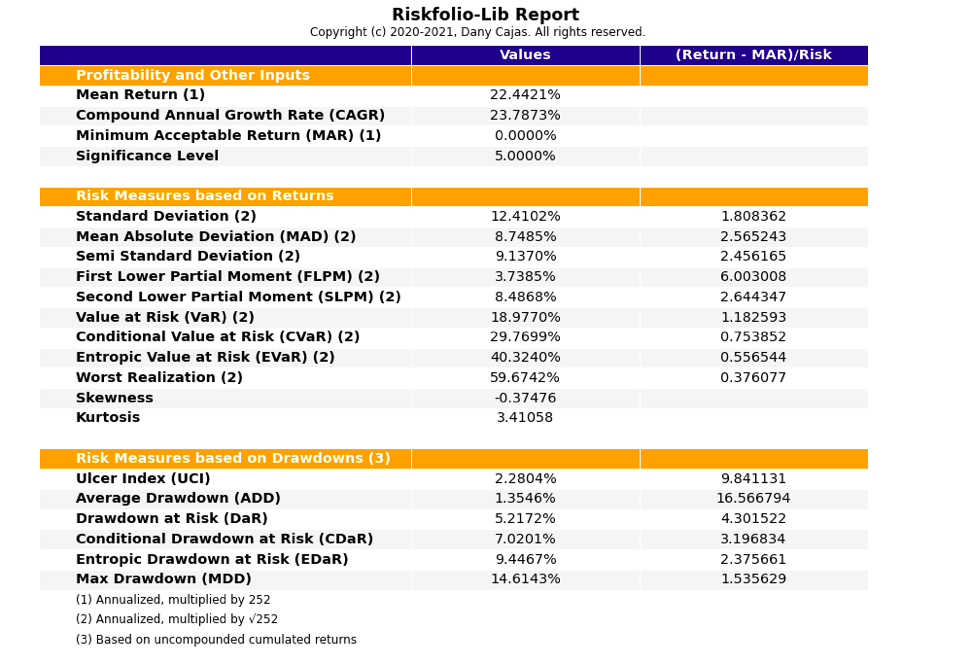 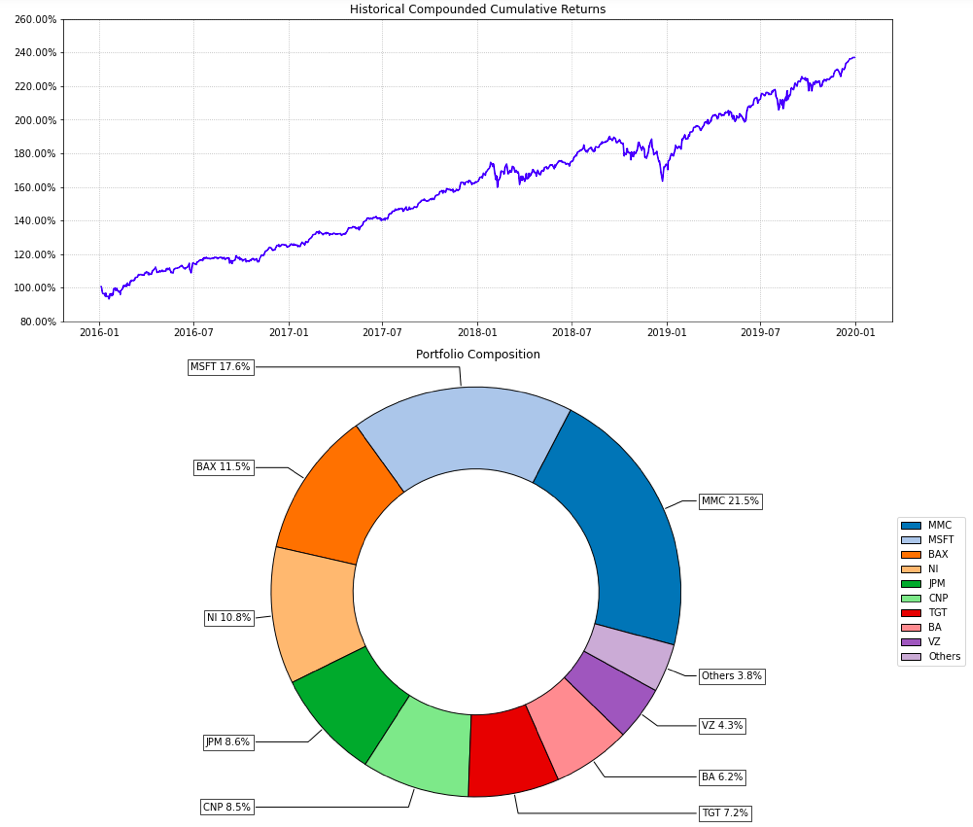 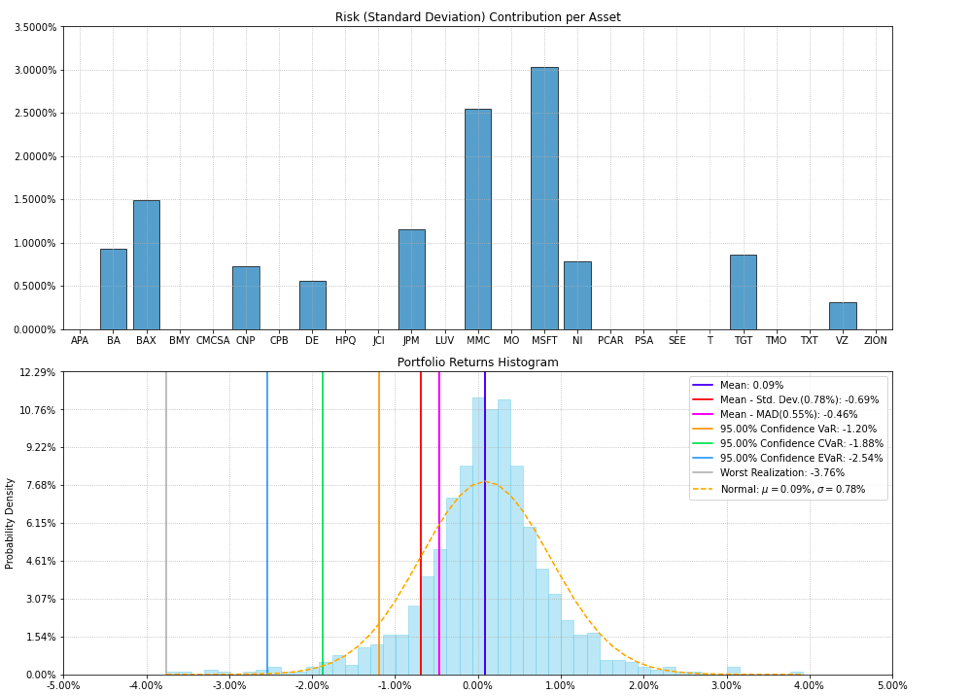 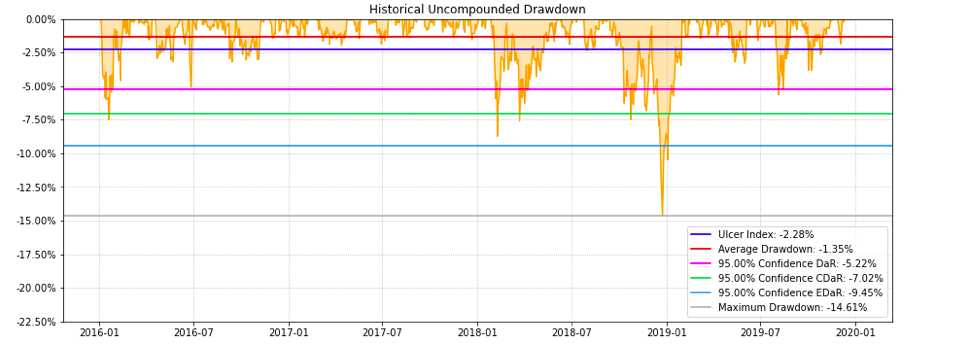
Reports.excel\_report(_[returns](https://riskfolio-lib.readthedocs.io/en/latest/reports.html#Reports.excel_report.returns "Reports.excel_report.returns (Python parameter) — Assets returns DataFrame, where n_samples is the number of observations and n_assets is the number of assets.")
_, _[w](https://riskfolio-lib.readthedocs.io/en/latest/reports.html#Reports.excel_report.w "Reports.excel_report.w (Python parameter) — Portfolio weights, where n_assets is the number of assets.")
_, _[rf](https://riskfolio-lib.readthedocs.io/en/latest/reports.html#Reports.excel_report.rf "Reports.excel_report.rf (Python parameter) — Risk free rate or minimum acceptable return.")
\=`0`_, _[alpha](https://riskfolio-lib.readthedocs.io/en/latest/reports.html#Reports.excel_report.alpha "Reports.excel_report.alpha (Python parameter) — Significance level of VaR, CVaR, EVaR, DaR and CDaR. The default is 0.05.")
\=`0.05`_, _[solver](https://riskfolio-lib.readthedocs.io/en/latest/reports.html#Reports.excel_report.solver "Reports.excel_report.solver (Python parameter) — Solver available for CVXPY that supports exponential cone programming. Used to calculate EVaR and EDaR.")
\=`'CLARABEL'`_, _[t\_factor](https://riskfolio-lib.readthedocs.io/en/latest/reports.html#Reports.excel_report.t_factor "Reports.excel_report.t_factor (Python parameter) — Factor used to annualize expected return and expected risks for risk measures based on returns (not drawdowns).")
\=`252`_, _[ini\_days](https://riskfolio-lib.readthedocs.io/en/latest/reports.html#Reports.excel_report.ini_days "Reports.excel_report.ini_days (Python parameter) — If provided, it is the number of days of compounding for first return. It is used to calculate Compound Annual Growth Rate (CAGR).")
\=`1`_, _[days\_per\_year](https://riskfolio-lib.readthedocs.io/en/latest/reports.html#Reports.excel_report.days_per_year "Reports.excel_report.days_per_year (Python parameter) — Days per year assumption.")
\=`252`_, _[name](https://riskfolio-lib.readthedocs.io/en/latest/reports.html#Reports.excel_report.name "Reports.excel_report.name (Python parameter) — Name or name with path where the Excel report will be saved.")
\=`'report'`_)[\[source\]](https://riskfolio-lib.readthedocs.io/en/latest/_modules/Reports.html#excel_report)
[¶](https://riskfolio-lib.readthedocs.io/en/latest/reports.html#Reports.excel_report "Link to this definition")
Create an Excel report (with formulas) with useful information to analyze risk and profitability of investment portfolios.
Parameters:[¶](https://riskfolio-lib.readthedocs.io/en/latest/reports.html#Reports.excel_report-parameters "Permalink to this headline")
returns : DataFrame of shape (n\_samples, n\_assets), optional[¶](https://riskfolio-lib.readthedocs.io/en/latest/reports.html#Reports.excel_report.returns "Permalink to this definition")
Assets returns DataFrame, where n\_samples is the number of observations and n\_assets is the number of assets.
w : DataFrame or Series of shape (n\_assets, 1)[¶](https://riskfolio-lib.readthedocs.io/en/latest/reports.html#Reports.excel_report.w "Permalink to this definition")
Portfolio weights, where n\_assets is the number of assets.
rf : [float](https://docs.python.org/3.11/library/functions.html#float "(in Python v3.11)")
, optional[¶](https://riskfolio-lib.readthedocs.io/en/latest/reports.html#Reports.excel_report.rf "Permalink to this definition")
Risk free rate or minimum acceptable return. The default is 0.
alpha : [float](https://docs.python.org/3.11/library/functions.html#float "(in Python v3.11)")
, optional[¶](https://riskfolio-lib.readthedocs.io/en/latest/reports.html#Reports.excel_report.alpha "Permalink to this definition")
Significance level of VaR, CVaR, EVaR, DaR and CDaR. The default is 0.05.
solver : [str](https://docs.python.org/3.11/library/stdtypes.html#str "(in Python v3.11)")
, optional[¶](https://riskfolio-lib.readthedocs.io/en/latest/reports.html#Reports.excel_report.solver "Permalink to this definition")
Solver available for CVXPY that supports exponential cone programming. Used to calculate EVaR and EDaR. The default value is ‘CLARABEL’.
t\_factor : [float](https://docs.python.org/3.11/library/functions.html#float "(in Python v3.11)")
, optional[¶](https://riskfolio-lib.readthedocs.io/en/latest/reports.html#Reports.excel_report.t_factor "Permalink to this definition")
Factor used to annualize expected return and expected risks for risk measures based on returns (not drawdowns). The default is 252.
Annualized Return\=Return×t\_factorAnnualized Risk\=Risk×t\_factor
ini\_days : [float](https://docs.python.org/3.11/library/functions.html#float "(in Python v3.11)")
, optional[¶](https://riskfolio-lib.readthedocs.io/en/latest/reports.html#Reports.excel_report.ini_days "Permalink to this definition")
If provided, it is the number of days of compounding for first return. It is used to calculate Compound Annual Growth Rate (CAGR). This value depend on assumptions used in t\_factor, for example if data is monthly you can use 21 (252 days per year) or 30 (360 days per year). The default is 1 for daily returns.
days\_per\_year : [float](https://docs.python.org/3.11/library/functions.html#float "(in Python v3.11)")
, optional[¶](https://riskfolio-lib.readthedocs.io/en/latest/reports.html#Reports.excel_report.days_per_year "Permalink to this definition")
Days per year assumption. It is used to calculate Compound Annual Growth Rate (CAGR). Default value is 252 trading days per year.
name : [str](https://docs.python.org/3.11/library/stdtypes.html#str "(in Python v3.11)")
, optional[¶](https://riskfolio-lib.readthedocs.io/en/latest/reports.html#Reports.excel_report.name "Permalink to this definition")
Name or name with path where the Excel report will be saved. If no path is provided the report will be saved in the same path of current file.
Raises:[¶](https://riskfolio-lib.readthedocs.io/en/latest/reports.html#Reports.excel_report-raises "Permalink to this headline")
[**ValueError**](https://docs.python.org/3.11/library/exceptions.html#ValueError "(in Python v3.11)")
– When the report cannot be built.
Example
`rp.excel_report(returns, w, rf=0, alpha=0.05, t_factor=252, ini_days=1, days_per_year=252, name="report")`
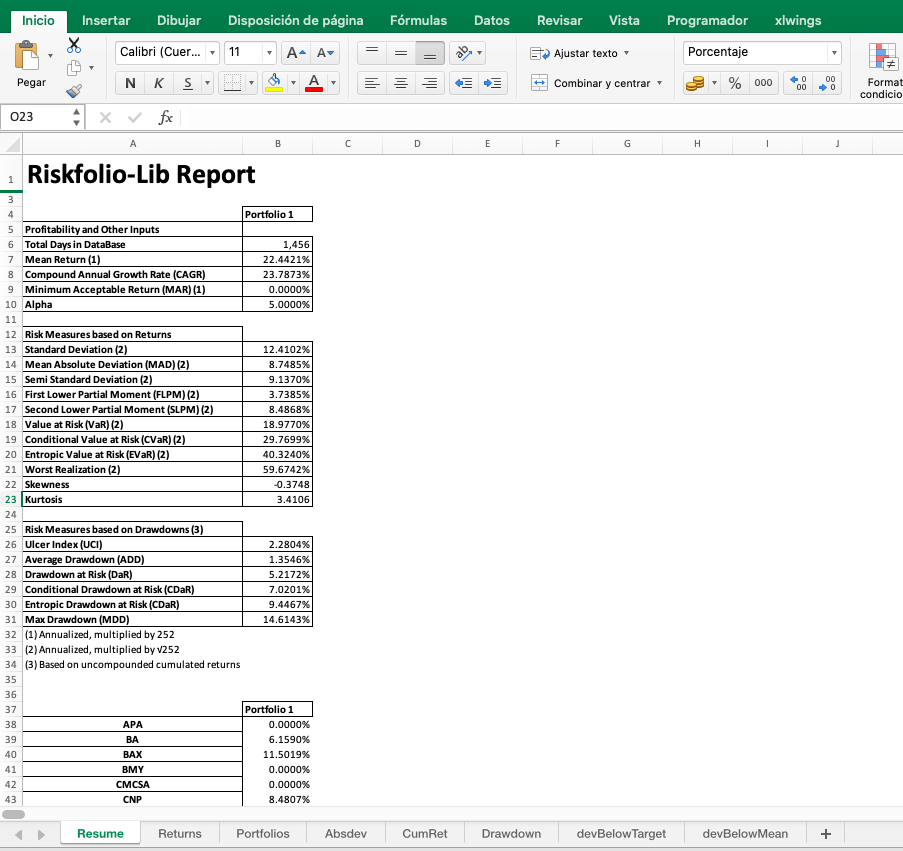
---
# Python Module Index - Riskfolio-Lib 7.2
Python Module Index
===================
[**a**](https://riskfolio-lib.readthedocs.io/en/latest/py-modindex.html#cap-a)
| [**c**](https://riskfolio-lib.readthedocs.io/en/latest/py-modindex.html#cap-c)
| [**d**](https://riskfolio-lib.readthedocs.io/en/latest/py-modindex.html#cap-d)
| [**g**](https://riskfolio-lib.readthedocs.io/en/latest/py-modindex.html#cap-g)
| [**h**](https://riskfolio-lib.readthedocs.io/en/latest/py-modindex.html#cap-h)
| [**o**](https://riskfolio-lib.readthedocs.io/en/latest/py-modindex.html#cap-o)
| [**p**](https://riskfolio-lib.readthedocs.io/en/latest/py-modindex.html#cap-p)
| [**r**](https://riskfolio-lib.readthedocs.io/en/latest/py-modindex.html#cap-r)
| | | |
| --- | --- | --- |
| | | |
| | **a** | |
| | [`AuxFunctions`](https://riskfolio-lib.readthedocs.io/en/latest/auxiliary.html#module-AuxFunctions) | |
| | | |
| | **c** | |
| | [`ConstraintsFunctions`](https://riskfolio-lib.readthedocs.io/en/latest/constraints.html#module-ConstraintsFunctions) | |
| | [`cppfunctions`](https://riskfolio-lib.readthedocs.io/en/latest/auxiliary.html#module-cppfunctions) | |
| | | |
| | **d** | |
| | [`DBHT`](https://riskfolio-lib.readthedocs.io/en/latest/auxiliary.html#module-DBHT) | |
| | | |
| | **g** | |
| | [`GerberStatistic`](https://riskfolio-lib.readthedocs.io/en/latest/auxiliary.html#module-GerberStatistic) | |
| | | |
| | **h** | |
| | [`HCPortfolio`](https://riskfolio-lib.readthedocs.io/en/latest/hcportfolio.html#module-HCPortfolio) | |
| | | |
| | **o** | |
| | [`OwaWeights`](https://riskfolio-lib.readthedocs.io/en/latest/auxiliary.html#module-OwaWeights) | |
| | | |
| | **p** | |
| | [`ParamsEstimation`](https://riskfolio-lib.readthedocs.io/en/latest/parameters.html#module-ParamsEstimation) | |
| | [`PlotFunctions`](https://riskfolio-lib.readthedocs.io/en/latest/plot.html#module-PlotFunctions) | |
| | [`Portfolio`](https://riskfolio-lib.readthedocs.io/en/latest/portfolio.html#module-Portfolio) | |
| | | |
| | **r** | |
| | [`Reports`](https://riskfolio-lib.readthedocs.io/en/latest/reports.html#module-Reports) | |
| | [`RiskFunctions`](https://riskfolio-lib.readthedocs.io/en/latest/risk.html#module-RiskFunctions) | |
---
# Index - Riskfolio-Lib 7.2
Index
=====
[**A**](https://riskfolio-lib.readthedocs.io/en/latest/genindex.html#A)
| [**B**](https://riskfolio-lib.readthedocs.io/en/latest/genindex.html#B)
| [**C**](https://riskfolio-lib.readthedocs.io/en/latest/genindex.html#C)
| [**D**](https://riskfolio-lib.readthedocs.io/en/latest/genindex.html#D)
| [**E**](https://riskfolio-lib.readthedocs.io/en/latest/genindex.html#E)
| [**F**](https://riskfolio-lib.readthedocs.io/en/latest/genindex.html#F)
| [**G**](https://riskfolio-lib.readthedocs.io/en/latest/genindex.html#G)
| [**H**](https://riskfolio-lib.readthedocs.io/en/latest/genindex.html#H)
| [**I**](https://riskfolio-lib.readthedocs.io/en/latest/genindex.html#I)
| [**J**](https://riskfolio-lib.readthedocs.io/en/latest/genindex.html#J)
| [**K**](https://riskfolio-lib.readthedocs.io/en/latest/genindex.html#K)
| [**L**](https://riskfolio-lib.readthedocs.io/en/latest/genindex.html#L)
| [**M**](https://riskfolio-lib.readthedocs.io/en/latest/genindex.html#M)
| [**N**](https://riskfolio-lib.readthedocs.io/en/latest/genindex.html#N)
| [**O**](https://riskfolio-lib.readthedocs.io/en/latest/genindex.html#O)
| [**P**](https://riskfolio-lib.readthedocs.io/en/latest/genindex.html#P)
| [**R**](https://riskfolio-lib.readthedocs.io/en/latest/genindex.html#R)
| [**S**](https://riskfolio-lib.readthedocs.io/en/latest/genindex.html#S)
| [**T**](https://riskfolio-lib.readthedocs.io/en/latest/genindex.html#T)
| [**U**](https://riskfolio-lib.readthedocs.io/en/latest/genindex.html#U)
| [**V**](https://riskfolio-lib.readthedocs.io/en/latest/genindex.html#V)
| [**W**](https://riskfolio-lib.readthedocs.io/en/latest/genindex.html#W)
A
-
| | |
| --- | --- |
| * [ADD\_Abs() (in module RiskFunctions)](https://riskfolio-lib.readthedocs.io/en/latest/risk.html#RiskFunctions.ADD_Abs)
* [ADD\_Rel() (in module RiskFunctions)](https://riskfolio-lib.readthedocs.io/en/latest/risk.html#RiskFunctions.ADD_Rel)
* [assets\_clusters() (in module ConstraintsFunctions)](https://riskfolio-lib.readthedocs.io/en/latest/constraints.html#ConstraintsFunctions.assets_clusters)
* [assets\_constraints() (in module ConstraintsFunctions)](https://riskfolio-lib.readthedocs.io/en/latest/constraints.html#ConstraintsFunctions.assets_constraints)
* [assets\_stats() (Portfolio.Portfolio method)](https://riskfolio-lib.readthedocs.io/en/latest/portfolio.html#Portfolio.Portfolio.assets_stats) | * [assets\_views() (in module ConstraintsFunctions)](https://riskfolio-lib.readthedocs.io/en/latest/constraints.html#ConstraintsFunctions.assets_views)
* [augmented\_black\_litterman() (in module ParamsEstimation)](https://riskfolio-lib.readthedocs.io/en/latest/parameters.html#ParamsEstimation.augmented_black_litterman)
* AuxFunctions
* [module](https://riskfolio-lib.readthedocs.io/en/latest/auxiliary.html#module-AuxFunctions)
* [average\_centrality() (in module ConstraintsFunctions)](https://riskfolio-lib.readthedocs.io/en/latest/constraints.html#ConstraintsFunctions.average_centrality) |
B
-
| | |
| --- | --- |
| * [backward\_regression() (in module ParamsEstimation)](https://riskfolio-lib.readthedocs.io/en/latest/parameters.html#ParamsEstimation.backward_regression)
* [black\_litterman() (in module ParamsEstimation)](https://riskfolio-lib.readthedocs.io/en/latest/parameters.html#ParamsEstimation.black_litterman)
* [black\_litterman\_bayesian() (in module ParamsEstimation)](https://riskfolio-lib.readthedocs.io/en/latest/parameters.html#ParamsEstimation.black_litterman_bayesian)
* [blacklitterman\_stats() (Portfolio.Portfolio method)](https://riskfolio-lib.readthedocs.io/en/latest/portfolio.html#Portfolio.Portfolio.blacklitterman_stats)
* [blfactors\_stats() (Portfolio.Portfolio method)](https://riskfolio-lib.readthedocs.io/en/latest/portfolio.html#Portfolio.Portfolio.blfactors_stats) | * [block\_vec\_pq() (in module AuxFunctions)](https://riskfolio-lib.readthedocs.io/en/latest/auxiliary.html#AuxFunctions.block_vec_pq)
* [bootstrapping() (in module ParamsEstimation)](https://riskfolio-lib.readthedocs.io/en/latest/parameters.html#ParamsEstimation.bootstrapping)
* [breadth() (in module DBHT)](https://riskfolio-lib.readthedocs.io/en/latest/auxiliary.html#DBHT.breadth)
* [BrinsonAttribution() (in module RiskFunctions)](https://riskfolio-lib.readthedocs.io/en/latest/risk.html#RiskFunctions.BrinsonAttribution)
* [BubbleCluster8s() (in module DBHT)](https://riskfolio-lib.readthedocs.io/en/latest/auxiliary.html#DBHT.BubbleCluster8s) |
C
-
| | |
| --- | --- |
| * [CDaR\_Abs() (in module RiskFunctions)](https://riskfolio-lib.readthedocs.io/en/latest/risk.html#RiskFunctions.CDaR_Abs)
* [CDaR\_Rel() (in module RiskFunctions)](https://riskfolio-lib.readthedocs.io/en/latest/risk.html#RiskFunctions.CDaR_Rel)
* [centrality\_vector() (in module ConstraintsFunctions)](https://riskfolio-lib.readthedocs.io/en/latest/constraints.html#ConstraintsFunctions.centrality_vector)
* [CliqHierarchyTree2s() (in module DBHT)](https://riskfolio-lib.readthedocs.io/en/latest/auxiliary.html#DBHT.CliqHierarchyTree2s)
* [clique3() (in module DBHT)](https://riskfolio-lib.readthedocs.io/en/latest/auxiliary.html#DBHT.clique3)
* [clusters\_matrix() (in module ConstraintsFunctions)](https://riskfolio-lib.readthedocs.io/en/latest/constraints.html#ConstraintsFunctions.clusters_matrix)
* [codep\_dist() (in module AuxFunctions)](https://riskfolio-lib.readthedocs.io/en/latest/auxiliary.html#AuxFunctions.codep_dist)
* [cokurt\_matrix() (in module ParamsEstimation)](https://riskfolio-lib.readthedocs.io/en/latest/parameters.html#ParamsEstimation.cokurt_matrix)
* [cokurtosis\_matrix() (in module cppfunctions)](https://riskfolio-lib.readthedocs.io/en/latest/auxiliary.html#cppfunctions.cokurtosis_matrix)
* [color\_list() (in module AuxFunctions)](https://riskfolio-lib.readthedocs.io/en/latest/auxiliary.html#AuxFunctions.color_list)
* [commutation\_matrix() (in module cppfunctions)](https://riskfolio-lib.readthedocs.io/en/latest/auxiliary.html#cppfunctions.commutation_matrix)
* [connected\_assets() (in module ConstraintsFunctions)](https://riskfolio-lib.readthedocs.io/en/latest/constraints.html#ConstraintsFunctions.connected_assets) | * [connection\_matrix() (in module ConstraintsFunctions)](https://riskfolio-lib.readthedocs.io/en/latest/constraints.html#ConstraintsFunctions.connection_matrix)
* ConstraintsFunctions
* [module](https://riskfolio-lib.readthedocs.io/en/latest/constraints.html#module-ConstraintsFunctions)
* [corr2cov() (in module AuxFunctions)](https://riskfolio-lib.readthedocs.io/en/latest/auxiliary.html#AuxFunctions.corr2cov)
* [coskewness\_matrix() (in module cppfunctions)](https://riskfolio-lib.readthedocs.io/en/latest/auxiliary.html#cppfunctions.coskewness_matrix)
* [cov2corr() (in module AuxFunctions)](https://riskfolio-lib.readthedocs.io/en/latest/auxiliary.html#AuxFunctions.cov2corr)
* [cov\_fix() (in module AuxFunctions)](https://riskfolio-lib.readthedocs.io/en/latest/auxiliary.html#AuxFunctions.cov_fix)
* [cov\_returns() (in module AuxFunctions)](https://riskfolio-lib.readthedocs.io/en/latest/auxiliary.html#AuxFunctions.cov_returns)
* [covar\_matrix() (in module ParamsEstimation)](https://riskfolio-lib.readthedocs.io/en/latest/parameters.html#ParamsEstimation.covar_matrix)
* cppfunctions
* [module](https://riskfolio-lib.readthedocs.io/en/latest/auxiliary.html#module-cppfunctions)
* [CVaR\_Hist() (in module RiskFunctions)](https://riskfolio-lib.readthedocs.io/en/latest/risk.html#RiskFunctions.CVaR_Hist)
* [CVRG() (in module RiskFunctions)](https://riskfolio-lib.readthedocs.io/en/latest/risk.html#RiskFunctions.CVRG) |
D
-
| | |
| --- | --- |
| * [d\_corr() (in module cppfunctions)](https://riskfolio-lib.readthedocs.io/en/latest/auxiliary.html#cppfunctions.d_corr)
* [d\_corr\_matrix() (in module cppfunctions)](https://riskfolio-lib.readthedocs.io/en/latest/auxiliary.html#cppfunctions.d_corr_matrix)
* [DaR\_Abs() (in module RiskFunctions)](https://riskfolio-lib.readthedocs.io/en/latest/risk.html#RiskFunctions.DaR_Abs)
* [DaR\_Rel() (in module RiskFunctions)](https://riskfolio-lib.readthedocs.io/en/latest/risk.html#RiskFunctions.DaR_Rel)
* DBHT
* [module](https://riskfolio-lib.readthedocs.io/en/latest/auxiliary.html#module-DBHT)
* [DBHTs() (in module DBHT)](https://riskfolio-lib.readthedocs.io/en/latest/auxiliary.html#DBHT.DBHTs)
* [dcorr() (in module AuxFunctions)](https://riskfolio-lib.readthedocs.io/en/latest/auxiliary.html#AuxFunctions.dcorr) | * [dcorr\_matrix() (in module AuxFunctions)](https://riskfolio-lib.readthedocs.io/en/latest/auxiliary.html#AuxFunctions.dcorr_matrix)
* [denoiseCov() (in module AuxFunctions)](https://riskfolio-lib.readthedocs.io/en/latest/auxiliary.html#AuxFunctions.denoiseCov)
* [denoisedCorr() (in module AuxFunctions)](https://riskfolio-lib.readthedocs.io/en/latest/auxiliary.html#AuxFunctions.denoisedCorr)
* [DirectHb() (in module DBHT)](https://riskfolio-lib.readthedocs.io/en/latest/auxiliary.html#DBHT.DirectHb)
* [distance\_wei() (in module DBHT)](https://riskfolio-lib.readthedocs.io/en/latest/auxiliary.html#DBHT.distance_wei)
* [duplication\_elimination\_matrix() (in module cppfunctions)](https://riskfolio-lib.readthedocs.io/en/latest/auxiliary.html#cppfunctions.duplication_elimination_matrix)
* [duplication\_matrix() (in module cppfunctions)](https://riskfolio-lib.readthedocs.io/en/latest/auxiliary.html#cppfunctions.duplication_matrix)
* [duplication\_summation\_matrix() (in module cppfunctions)](https://riskfolio-lib.readthedocs.io/en/latest/auxiliary.html#cppfunctions.duplication_summation_matrix) |
E
-
| | |
| --- | --- |
| * [EDaR\_Abs() (in module RiskFunctions)](https://riskfolio-lib.readthedocs.io/en/latest/risk.html#RiskFunctions.EDaR_Abs)
* [EDaR\_Rel() (in module RiskFunctions)](https://riskfolio-lib.readthedocs.io/en/latest/risk.html#RiskFunctions.EDaR_Rel)
* [efficient\_frontier() (Portfolio.Portfolio method)](https://riskfolio-lib.readthedocs.io/en/latest/portfolio.html#Portfolio.Portfolio.efficient_frontier)
* [Entropic\_RM() (in module RiskFunctions)](https://riskfolio-lib.readthedocs.io/en/latest/risk.html#RiskFunctions.Entropic_RM) | * [errPDFs() (in module AuxFunctions)](https://riskfolio-lib.readthedocs.io/en/latest/auxiliary.html#AuxFunctions.errPDFs)
* [EVaR\_Hist() (in module RiskFunctions)](https://riskfolio-lib.readthedocs.io/en/latest/risk.html#RiskFunctions.EVaR_Hist)
* [EVRG() (in module RiskFunctions)](https://riskfolio-lib.readthedocs.io/en/latest/risk.html#RiskFunctions.EVRG)
* [excel\_report() (in module Reports)](https://riskfolio-lib.readthedocs.io/en/latest/reports.html#Reports.excel_report) |
F
-
| | |
| --- | --- |
| * [factors\_constraints() (in module ConstraintsFunctions)](https://riskfolio-lib.readthedocs.io/en/latest/constraints.html#ConstraintsFunctions.factors_constraints)
* [Factors\_Risk\_Contribution() (in module RiskFunctions)](https://riskfolio-lib.readthedocs.io/en/latest/risk.html#RiskFunctions.Factors_Risk_Contribution)
* [factors\_stats() (Portfolio.Portfolio method)](https://riskfolio-lib.readthedocs.io/en/latest/portfolio.html#Portfolio.Portfolio.factors_stats)
* [factors\_views() (in module ConstraintsFunctions)](https://riskfolio-lib.readthedocs.io/en/latest/constraints.html#ConstraintsFunctions.factors_views) | * [findMaxEval() (in module AuxFunctions)](https://riskfolio-lib.readthedocs.io/en/latest/auxiliary.html#AuxFunctions.findMaxEval)
* [fitKDE() (in module AuxFunctions)](https://riskfolio-lib.readthedocs.io/en/latest/auxiliary.html#AuxFunctions.fitKDE)
* [forward\_regression() (in module ParamsEstimation)](https://riskfolio-lib.readthedocs.io/en/latest/parameters.html#ParamsEstimation.forward_regression)
* [frc\_optimization() (Portfolio.Portfolio method)](https://riskfolio-lib.readthedocs.io/en/latest/portfolio.html#Portfolio.Portfolio.frc_optimization)
* [frontier\_limits() (Portfolio.Portfolio method)](https://riskfolio-lib.readthedocs.io/en/latest/portfolio.html#Portfolio.Portfolio.frontier_limits) |
G
-
| | |
| --- | --- |
| * [gerber\_cov\_stat0() (in module GerberStatistic)](https://riskfolio-lib.readthedocs.io/en/latest/auxiliary.html#GerberStatistic.gerber_cov_stat0)
* [gerber\_cov\_stat1() (in module GerberStatistic)](https://riskfolio-lib.readthedocs.io/en/latest/auxiliary.html#GerberStatistic.gerber_cov_stat1)
* [gerber\_cov\_stat2() (in module GerberStatistic)](https://riskfolio-lib.readthedocs.io/en/latest/auxiliary.html#GerberStatistic.gerber_cov_stat2) | * GerberStatistic
* [module](https://riskfolio-lib.readthedocs.io/en/latest/auxiliary.html#module-GerberStatistic)
* [getPCA() (in module AuxFunctions)](https://riskfolio-lib.readthedocs.io/en/latest/auxiliary.html#AuxFunctions.getPCA)
* [GMD() (in module RiskFunctions)](https://riskfolio-lib.readthedocs.io/en/latest/risk.html#RiskFunctions.GMD) |
H
-
| | |
| --- | --- |
| * HCPortfolio
* [module](https://riskfolio-lib.readthedocs.io/en/latest/hcportfolio.html#module-HCPortfolio) | * [HCPortfolio (class in HCPortfolio)](https://riskfolio-lib.readthedocs.io/en/latest/hcportfolio.html#HCPortfolio.HCPortfolio)
* [HierarchyConstruct4s() (in module DBHT)](https://riskfolio-lib.readthedocs.io/en/latest/auxiliary.html#DBHT.HierarchyConstruct4s)
* [hrp\_constraints() (in module ConstraintsFunctions)](https://riskfolio-lib.readthedocs.io/en/latest/constraints.html#ConstraintsFunctions.hrp_constraints) |
I
-
| | |
| --- | --- |
| * [integer\_constraints() (in module ConstraintsFunctions)](https://riskfolio-lib.readthedocs.io/en/latest/constraints.html#ConstraintsFunctions.integer_constraints) | * [is\_pos\_def() (in module AuxFunctions)](https://riskfolio-lib.readthedocs.io/en/latest/auxiliary.html#AuxFunctions.is_pos_def) |
J
-
| | |
| --- | --- |
| * [j\_LoGo() (in module DBHT)](https://riskfolio-lib.readthedocs.io/en/latest/auxiliary.html#DBHT.j_LoGo) | * [jupyter\_report() (in module Reports)](https://riskfolio-lib.readthedocs.io/en/latest/reports.html#Reports.jupyter_report) |
K
-
| | |
| --- | --- |
| * [k\_eigh() (in module cppfunctions)](https://riskfolio-lib.readthedocs.io/en/latest/auxiliary.html#cppfunctions.k_eigh) | * [Kurtosis() (in module RiskFunctions)](https://riskfolio-lib.readthedocs.io/en/latest/risk.html#RiskFunctions.Kurtosis) |
L
-
| | |
| --- | --- |
| * [L\_Moment() (in module RiskFunctions)](https://riskfolio-lib.readthedocs.io/en/latest/risk.html#RiskFunctions.L_Moment)
* [L\_Moment\_CRM() (in module RiskFunctions)](https://riskfolio-lib.readthedocs.io/en/latest/risk.html#RiskFunctions.L_Moment_CRM) | * [loadings\_matrix() (in module ParamsEstimation)](https://riskfolio-lib.readthedocs.io/en/latest/parameters.html#ParamsEstimation.loadings_matrix)
* [LPM() (in module RiskFunctions)](https://riskfolio-lib.readthedocs.io/en/latest/risk.html#RiskFunctions.LPM)
* [ltdi\_matrix() (in module AuxFunctions)](https://riskfolio-lib.readthedocs.io/en/latest/auxiliary.html#AuxFunctions.ltdi_matrix) |
M
-
| | |
| --- | --- |
| * [MAD() (in module RiskFunctions)](https://riskfolio-lib.readthedocs.io/en/latest/risk.html#RiskFunctions.MAD)
* [MDD\_Abs() (in module RiskFunctions)](https://riskfolio-lib.readthedocs.io/en/latest/risk.html#RiskFunctions.MDD_Abs)
* [MDD\_Rel() (in module RiskFunctions)](https://riskfolio-lib.readthedocs.io/en/latest/risk.html#RiskFunctions.MDD_Rel)
* [mean\_vector() (in module ParamsEstimation)](https://riskfolio-lib.readthedocs.io/en/latest/parameters.html#ParamsEstimation.mean_vector)
* module
* [AuxFunctions](https://riskfolio-lib.readthedocs.io/en/latest/auxiliary.html#module-AuxFunctions)
* [ConstraintsFunctions](https://riskfolio-lib.readthedocs.io/en/latest/constraints.html#module-ConstraintsFunctions)
* [cppfunctions](https://riskfolio-lib.readthedocs.io/en/latest/auxiliary.html#module-cppfunctions)
* [DBHT](https://riskfolio-lib.readthedocs.io/en/latest/auxiliary.html#module-DBHT)
* [GerberStatistic](https://riskfolio-lib.readthedocs.io/en/latest/auxiliary.html#module-GerberStatistic)
* [HCPortfolio](https://riskfolio-lib.readthedocs.io/en/latest/hcportfolio.html#module-HCPortfolio)
* [OwaWeights](https://riskfolio-lib.readthedocs.io/en/latest/auxiliary.html#module-OwaWeights)
* [ParamsEstimation](https://riskfolio-lib.readthedocs.io/en/latest/parameters.html#module-ParamsEstimation)
* [PlotFunctions](https://riskfolio-lib.readthedocs.io/en/latest/plot.html#module-PlotFunctions)
* [Portfolio](https://riskfolio-lib.readthedocs.io/en/latest/portfolio.html#module-Portfolio)
* [Reports](https://riskfolio-lib.readthedocs.io/en/latest/reports.html#module-Reports)
* [RiskFunctions](https://riskfolio-lib.readthedocs.io/en/latest/risk.html#module-RiskFunctions) | * [mpPDF() (in module AuxFunctions)](https://riskfolio-lib.readthedocs.io/en/latest/auxiliary.html#AuxFunctions.mpPDF)
* [mutual\_info\_matrix() (in module AuxFunctions)](https://riskfolio-lib.readthedocs.io/en/latest/auxiliary.html#AuxFunctions.mutual_info_matrix) |
N
-
| | |
| --- | --- |
| * [NEA() (in module RiskFunctions)](https://riskfolio-lib.readthedocs.io/en/latest/risk.html#RiskFunctions.NEA) | * [normal\_simulation() (in module ParamsEstimation)](https://riskfolio-lib.readthedocs.io/en/latest/parameters.html#ParamsEstimation.normal_simulation)
* [numBins() (in module AuxFunctions)](https://riskfolio-lib.readthedocs.io/en/latest/auxiliary.html#AuxFunctions.numBins) |
O
-
| | |
| --- | --- |
| * [optimization() (HCPortfolio.HCPortfolio method)](https://riskfolio-lib.readthedocs.io/en/latest/hcportfolio.html#HCPortfolio.HCPortfolio.optimization)
* [(Portfolio.Portfolio method)](https://riskfolio-lib.readthedocs.io/en/latest/portfolio.html#Portfolio.Portfolio.optimization)
* [owa\_cvar() (in module OwaWeights)](https://riskfolio-lib.readthedocs.io/en/latest/auxiliary.html#OwaWeights.owa_cvar)
* [owa\_cvrg() (in module OwaWeights)](https://riskfolio-lib.readthedocs.io/en/latest/auxiliary.html#OwaWeights.owa_cvrg)
* [owa\_gmd() (in module OwaWeights)](https://riskfolio-lib.readthedocs.io/en/latest/auxiliary.html#OwaWeights.owa_gmd)
* [owa\_l\_moment() (in module OwaWeights)](https://riskfolio-lib.readthedocs.io/en/latest/auxiliary.html#OwaWeights.owa_l_moment)
* [owa\_l\_moment\_crm() (in module OwaWeights)](https://riskfolio-lib.readthedocs.io/en/latest/auxiliary.html#OwaWeights.owa_l_moment_crm)
* [owa\_optimization() (Portfolio.Portfolio method)](https://riskfolio-lib.readthedocs.io/en/latest/portfolio.html#Portfolio.Portfolio.owa_optimization) | * [owa\_rg() (in module OwaWeights)](https://riskfolio-lib.readthedocs.io/en/latest/auxiliary.html#OwaWeights.owa_rg)
* [owa\_tg() (in module OwaWeights)](https://riskfolio-lib.readthedocs.io/en/latest/auxiliary.html#OwaWeights.owa_tg)
* [owa\_tgrg() (in module OwaWeights)](https://riskfolio-lib.readthedocs.io/en/latest/auxiliary.html#OwaWeights.owa_tgrg)
* [owa\_wcvar() (in module OwaWeights)](https://riskfolio-lib.readthedocs.io/en/latest/auxiliary.html#OwaWeights.owa_wcvar)
* [owa\_wcvrg() (in module OwaWeights)](https://riskfolio-lib.readthedocs.io/en/latest/auxiliary.html#OwaWeights.owa_wcvrg)
* [owa\_wr() (in module OwaWeights)](https://riskfolio-lib.readthedocs.io/en/latest/auxiliary.html#OwaWeights.owa_wr)
* OwaWeights
* [module](https://riskfolio-lib.readthedocs.io/en/latest/auxiliary.html#module-OwaWeights) |
P
-
| | |
| --- | --- |
| * ParamsEstimation
* [module](https://riskfolio-lib.readthedocs.io/en/latest/parameters.html#module-ParamsEstimation)
* [PCR() (in module ParamsEstimation)](https://riskfolio-lib.readthedocs.io/en/latest/parameters.html#ParamsEstimation.PCR)
* [plot\_bar() (in module PlotFunctions)](https://riskfolio-lib.readthedocs.io/en/latest/plot.html#PlotFunctions.plot_bar)
* [plot\_BrinsonAttribution() (in module PlotFunctions)](https://riskfolio-lib.readthedocs.io/en/latest/plot.html#PlotFunctions.plot_BrinsonAttribution)
* [plot\_clusters() (in module PlotFunctions)](https://riskfolio-lib.readthedocs.io/en/latest/plot.html#PlotFunctions.plot_clusters)
* [plot\_clusters\_network() (in module PlotFunctions)](https://riskfolio-lib.readthedocs.io/en/latest/plot.html#PlotFunctions.plot_clusters_network)
* [plot\_clusters\_network\_allocation() (in module PlotFunctions)](https://riskfolio-lib.readthedocs.io/en/latest/plot.html#PlotFunctions.plot_clusters_network_allocation)
* [plot\_dendrogram() (in module PlotFunctions)](https://riskfolio-lib.readthedocs.io/en/latest/plot.html#PlotFunctions.plot_dendrogram)
* [plot\_drawdown() (in module PlotFunctions)](https://riskfolio-lib.readthedocs.io/en/latest/plot.html#PlotFunctions.plot_drawdown)
* [plot\_factor\_risk\_con() (in module PlotFunctions)](https://riskfolio-lib.readthedocs.io/en/latest/plot.html#PlotFunctions.plot_factor_risk_con)
* [plot\_frontier() (in module PlotFunctions)](https://riskfolio-lib.readthedocs.io/en/latest/plot.html#PlotFunctions.plot_frontier)
* [plot\_frontier\_area() (in module PlotFunctions)](https://riskfolio-lib.readthedocs.io/en/latest/plot.html#PlotFunctions.plot_frontier_area) | * [plot\_hist() (in module PlotFunctions)](https://riskfolio-lib.readthedocs.io/en/latest/plot.html#PlotFunctions.plot_hist)
* [plot\_network() (in module PlotFunctions)](https://riskfolio-lib.readthedocs.io/en/latest/plot.html#PlotFunctions.plot_network)
* [plot\_network\_allocation() (in module PlotFunctions)](https://riskfolio-lib.readthedocs.io/en/latest/plot.html#PlotFunctions.plot_network_allocation)
* [plot\_pie() (in module PlotFunctions)](https://riskfolio-lib.readthedocs.io/en/latest/plot.html#PlotFunctions.plot_pie)
* [plot\_range() (in module PlotFunctions)](https://riskfolio-lib.readthedocs.io/en/latest/plot.html#PlotFunctions.plot_range)
* [plot\_risk\_con() (in module PlotFunctions)](https://riskfolio-lib.readthedocs.io/en/latest/plot.html#PlotFunctions.plot_risk_con)
* [plot\_series() (in module PlotFunctions)](https://riskfolio-lib.readthedocs.io/en/latest/plot.html#PlotFunctions.plot_series)
* [plot\_table() (in module PlotFunctions)](https://riskfolio-lib.readthedocs.io/en/latest/plot.html#PlotFunctions.plot_table)
* PlotFunctions
* [module](https://riskfolio-lib.readthedocs.io/en/latest/plot.html#module-PlotFunctions)
* [PMFG\_T2s() (in module DBHT)](https://riskfolio-lib.readthedocs.io/en/latest/auxiliary.html#DBHT.PMFG_T2s)
* Portfolio
* [module](https://riskfolio-lib.readthedocs.io/en/latest/portfolio.html#module-Portfolio)
* [Portfolio (class in Portfolio)](https://riskfolio-lib.readthedocs.io/en/latest/portfolio.html#Portfolio.Portfolio) |
R
-
| | |
| --- | --- |
| * [related\_assets() (in module ConstraintsFunctions)](https://riskfolio-lib.readthedocs.io/en/latest/constraints.html#ConstraintsFunctions.related_assets)
* Reports
* [module](https://riskfolio-lib.readthedocs.io/en/latest/reports.html#module-Reports)
* [reset\_all() (Portfolio.Portfolio method)](https://riskfolio-lib.readthedocs.io/en/latest/portfolio.html#Portfolio.Portfolio.reset_all)
* [reset\_inputs() (Portfolio.Portfolio method)](https://riskfolio-lib.readthedocs.io/en/latest/portfolio.html#Portfolio.Portfolio.reset_inputs)
* [reset\_linear\_constraints() (Portfolio.Portfolio method)](https://riskfolio-lib.readthedocs.io/en/latest/portfolio.html#Portfolio.Portfolio.reset_linear_constraints)
* [reset\_risk\_constraints() (Portfolio.Portfolio method)](https://riskfolio-lib.readthedocs.io/en/latest/portfolio.html#Portfolio.Portfolio.reset_risk_constraints)
* [residuals\_cokurtosis\_fm() (in module cppfunctions)](https://riskfolio-lib.readthedocs.io/en/latest/auxiliary.html#cppfunctions.residuals_cokurtosis_fm)
* [residuals\_coskewness\_fm() (in module cppfunctions)](https://riskfolio-lib.readthedocs.io/en/latest/auxiliary.html#cppfunctions.residuals_coskewness_fm)
* [RG() (in module RiskFunctions)](https://riskfolio-lib.readthedocs.io/en/latest/risk.html#RiskFunctions.RG)
* [risk\_constraint() (in module ConstraintsFunctions)](https://riskfolio-lib.readthedocs.io/en/latest/constraints.html#ConstraintsFunctions.risk_constraint) | * [Risk\_Contribution() (in module RiskFunctions)](https://riskfolio-lib.readthedocs.io/en/latest/risk.html#RiskFunctions.Risk_Contribution)
* [risk\_factors() (in module ParamsEstimation)](https://riskfolio-lib.readthedocs.io/en/latest/parameters.html#ParamsEstimation.risk_factors)
* [Risk\_Margin() (in module RiskFunctions)](https://riskfolio-lib.readthedocs.io/en/latest/risk.html#RiskFunctions.Risk_Margin)
* RiskFunctions
* [module](https://riskfolio-lib.readthedocs.io/en/latest/risk.html#module-RiskFunctions)
* [RLDaR\_Abs() (in module RiskFunctions)](https://riskfolio-lib.readthedocs.io/en/latest/risk.html#RiskFunctions.RLDaR_Abs)
* [RLDaR\_Rel() (in module RiskFunctions)](https://riskfolio-lib.readthedocs.io/en/latest/risk.html#RiskFunctions.RLDaR_Rel)
* [RLVaR\_Hist() (in module RiskFunctions)](https://riskfolio-lib.readthedocs.io/en/latest/risk.html#RiskFunctions.RLVaR_Hist)
* [round\_values() (in module AuxFunctions)](https://riskfolio-lib.readthedocs.io/en/latest/auxiliary.html#AuxFunctions.round_values)
* [rp\_optimization() (Portfolio.Portfolio method)](https://riskfolio-lib.readthedocs.io/en/latest/portfolio.html#Portfolio.Portfolio.rp_optimization)
* [rrp\_optimization() (Portfolio.Portfolio method)](https://riskfolio-lib.readthedocs.io/en/latest/portfolio.html#Portfolio.Portfolio.rrp_optimization)
* [RVRG() (in module RiskFunctions)](https://riskfolio-lib.readthedocs.io/en/latest/risk.html#RiskFunctions.RVRG) |
S
-
| | |
| --- | --- |
| * [semi\_cokurtosis\_matrix() (in module cppfunctions)](https://riskfolio-lib.readthedocs.io/en/latest/auxiliary.html#cppfunctions.semi_cokurtosis_matrix)
* [semi\_coskewness\_matrix() (in module cppfunctions)](https://riskfolio-lib.readthedocs.io/en/latest/auxiliary.html#cppfunctions.semi_coskewness_matrix)
* [SemiDeviation() (in module RiskFunctions)](https://riskfolio-lib.readthedocs.io/en/latest/risk.html#RiskFunctions.SemiDeviation)
* [SemiKurtosis() (in module RiskFunctions)](https://riskfolio-lib.readthedocs.io/en/latest/risk.html#RiskFunctions.SemiKurtosis) | * [Sharpe() (in module RiskFunctions)](https://riskfolio-lib.readthedocs.io/en/latest/risk.html#RiskFunctions.Sharpe)
* [Sharpe\_Risk() (in module RiskFunctions)](https://riskfolio-lib.readthedocs.io/en/latest/risk.html#RiskFunctions.Sharpe_Risk)
* [shrinkCorr() (in module AuxFunctions)](https://riskfolio-lib.readthedocs.io/en/latest/auxiliary.html#AuxFunctions.shrinkCorr)
* [std\_silhouette\_score() (in module AuxFunctions)](https://riskfolio-lib.readthedocs.io/en/latest/auxiliary.html#AuxFunctions.std_silhouette_score) |
T
-
| | |
| --- | --- |
| * [TG() (in module RiskFunctions)](https://riskfolio-lib.readthedocs.io/en/latest/risk.html#RiskFunctions.TG) | * [TGRG() (in module RiskFunctions)](https://riskfolio-lib.readthedocs.io/en/latest/risk.html#RiskFunctions.TGRG)
* [two\_diff\_gap\_stat() (in module AuxFunctions)](https://riskfolio-lib.readthedocs.io/en/latest/auxiliary.html#AuxFunctions.two_diff_gap_stat) |
U
-
| | |
| --- | --- |
| * [UCI\_Abs() (in module RiskFunctions)](https://riskfolio-lib.readthedocs.io/en/latest/risk.html#RiskFunctions.UCI_Abs) | * [UCI\_Rel() (in module RiskFunctions)](https://riskfolio-lib.readthedocs.io/en/latest/risk.html#RiskFunctions.UCI_Rel) |
V
-
| | |
| --- | --- |
| * [VaR\_Hist() (in module RiskFunctions)](https://riskfolio-lib.readthedocs.io/en/latest/risk.html#RiskFunctions.VaR_Hist) | * [var\_info\_matrix() (in module AuxFunctions)](https://riskfolio-lib.readthedocs.io/en/latest/auxiliary.html#AuxFunctions.var_info_matrix)
* [VRG() (in module RiskFunctions)](https://riskfolio-lib.readthedocs.io/en/latest/risk.html#RiskFunctions.VRG) |
W
-
| | |
| --- | --- |
| * [wc\_optimization() (Portfolio.Portfolio method)](https://riskfolio-lib.readthedocs.io/en/latest/portfolio.html#Portfolio.Portfolio.wc_optimization)
* [wc\_stats() (Portfolio.Portfolio method)](https://riskfolio-lib.readthedocs.io/en/latest/portfolio.html#Portfolio.Portfolio.wc_stats) | * [weights\_discretizetion() (in module AuxFunctions)](https://riskfolio-lib.readthedocs.io/en/latest/auxiliary.html#AuxFunctions.weights_discretizetion)
* [WR() (in module RiskFunctions)](https://riskfolio-lib.readthedocs.io/en/latest/risk.html#RiskFunctions.WR) |
---
# Riskfolio-XL: Riskfolio-Lib add-in for Microsoft Excel - Riskfolio-Lib 7.2
[Skip to content](https://riskfolio-lib.readthedocs.io/en/latest/excel.html#description)
Riskfolio-XL: Riskfolio-Lib add-in for Microsoft Excel[¶](https://riskfolio-lib.readthedocs.io/en/latest/excel.html#riskfolio-xl-riskfolio-lib-add-in-for-microsoft-excel "Link to this heading")
==================================================================================================================================================================================================
[Buy Advanced Portfolio Optimization Book on Springer](https://www.kqzyfj.com/click-101359873-15150084?url=https%3A%2F%2Flink.springer.com%2Fbook%2F9783031843037)
[Enroll in the Portfolio Optimization with Python Course](https://www.paypal.com/ncp/payment/GN55W4UQ7VAMN)
[](https://github.com/sponsors/dcajasn)
[](https://ko-fi.com/B0B833SXD)
Description[¶](https://riskfolio-lib.readthedocs.io/en/latest/excel.html#description "Link to this heading")
-------------------------------------------------------------------------------------------------------------
Riskfolio-XL is a Microsoft Excel add-in based on [PyXLL](https://www.pyxll.com/index.html)
library, that allows users use the same features of Riskfolio-Lib in Excel through Riskfolio-XL spreadsheet functions. Its objective is to help non-programming users to build investment portfolios based on mathematically complex models with low effort and to support the maintenance and further development of Riskfolio-Lib.
Installation[¶](https://riskfolio-lib.readthedocs.io/en/latest/excel.html#installation "Link to this heading")
---------------------------------------------------------------------------------------------------------------
Riskfolio-XL is only available on Windows and it requires a valid installation of PyXLL package and PyXLL add-in. To install PyXLL and PyXLL add-in, you can find the PyXLL installation instructions in the following [link](https://www.pyxll.com/docs/userguide/installation/firsttime.html)
.
After installing the PyXLL package and PyXLL add-in, the latest stable release of Riskfolio-XL (and older versions) can be installed from PyPI:
> `pip install riskfolio-xl`
After installing the Riskfolio-XL package you will have access to the **TRIAL COPY** of Riskfolio-XL, this version is limited to work only with portfolios of 7 assets and risk factor models of 3 risk factors.
To access the **PURCHASED COPY** of Riskfolio-XL, you need a valid license. To get a Riskfolio-XL license you have to purchase it paying a monthly or annual subscription:
Monthly License Annual License
Something went wrong. Contact the merchant for help.
This browser isn’t supported. Open a different browser and try again.
There isn't enough of this item for your order.
### Riskfolio-XL Monthly License
### $20.00 USD
### $20.00 USD
### Sold out
Quantity
1
Checkout

Something went wrong. Contact the merchant for help.
This browser isn’t supported. Open a different browser and try again.
There isn't enough of this item for your order.
### Riskfolio-XL Annual License
### $210.00 USD
### $210.00 USD
### Sold out
Quantity
123456789101112131415161718192021222324252627282930313233343536373839404142434445464748495051525354555657585960616263646566676869707172737475767778798081828384858687888990919293949596979899100
Checkout

**After paying, you need to send us an email to** [orenji.eirl@gmail.com](mailto:orenji.eirl%40gmail.com)
**and you will receive your Riskfolio-XL license (within 24 hours) and a discount code to purchase the PyXLL package.**
Then, you have to add your Riskfolio-XL license to the pyxll.cfg file:
* First, click on About PyXLL button of Riskfolio-XL add-in as shown in the image below:

* Then, click on the config file link as shown in the image below:

* Finally, write your Riskfolio-XL license in the riskfolio\_xl\_key parameter as shown in the image below:

Citing[¶](https://riskfolio-lib.readthedocs.io/en/latest/excel.html#citing "Link to this heading")
---------------------------------------------------------------------------------------------------
If you use Riskfolio-Lib for published work, please use the following BibTeX entry:
`@misc{riskfolioxl, author = {Dany Cajas}, title = {Riskfolio-LXLib (0.1.1)}, year = {2024}, url = {https://riskfolio-lib.readthedocs.io/en/latest/excel.html}, }`
License[¶](https://riskfolio-lib.readthedocs.io/en/latest/excel.html#license "Link to this heading")
-----------------------------------------------------------------------------------------------------
RISKFOLIO-XL END-USER LICENSE AGREEMENT
IMPORTANT PLEASE READ THE TERMS AND CONDITIONS OF THIS LICENSE AGREEMENT CAREFULLY BEFORE CONTINUING WITH THIS PROGRAM INSTALL OR EXECUTION: RISKFOLIO-XL End-User License Agreement (“EULA”) is a legal agreement between you (either an individual or a single entity) and ORENJI EIRL, a Peruvian company (ORENJI), for the ORENJI SOFTWARE(s) identified above which may include associated software components, media, printed materials, and “online” or electronic documentation (“SOFTWARE”). By installing, copying, or otherwise using the SOFTWARE, you agree to be bound by the terms of this EULA. This license agreement represents the entire agreement concerning the program between you and ORENJI, (referred to as “licenser”), and it supersedes any prior proposal, representation, or understanding between the parties. If you do not agree to the terms of this EULA, do not install or use the SOFTWARE. The SOFTWARE is protected by copyright laws and international copyright treaties, as well as other intellectual property laws and treaties. The SOFTWARE is licensed, not sold.
1\. GRANT OF LICENSE. Subject to Your compliance with Your obligations under this Agreement, for the Term of this Agreement, ORENJI hereby grants to You, and You hereby accept from ORENJI, a non-exclusive, non-transferable, non-sublicensable, non-assignable, revocable, limited right and license to Use the SOFTWARE on a compatible computer (not exceeding one concurrent user). 1.1 Installation and Use. ORENJI grants you the right to install and use copies of the SOFTWARE on your computer running a validly licensed copy of the operating system for which the SOFTWARE was designed. The SOFTWARE runs on Microsoft Excel for Windows and requires a valid installation of PyXLL package and PyXLL add-in. 1.2 Backup Copies. You may also make copies of the SOFTWARE as may be necessary for backup and archival purposes. 1.3 Trial copy. You may Use a Trial Copy of the SOFTWARE for evaluation only, in order to determine whether the program meets Your needs before purchasing it. Upon Your purchase of Purchased Copy of the SOFTWARE, Your evaluation period will automatically terminate, and You will be governed by the terms of this Agreement applicable to Purchased Copies of the SOFTWARE. 1.4 Purchased copy. When You purchase a License to the SOFTWARE, You will receive a License Number which will activate Your Purchased Copy. You may not publish or distribute this License Number by any means without direct authorization from ORENJI. If You do, Your License to Use the Software, and this Agreement, shall automatically terminate without notice to You, You must remove all installed copies of the Software from Your Computer(s), and You may be liable for legal damages for continued Use of the SOFTWARE. If You purchased a corporate License to Use the SOFTWARE, You agree not to install or Use the SOFTWARE on more computers than the number included in Your License. 1.5 On-line license validation. An internet connection is required to authenticate the SOFTWARE and verify Your license. ORENJI reserves the right to validate Your license through subsequent online authentications. If ORENJI determines Your license is not valid or does not correspond to Your computer, You may not be able to use the SOFTWARE. If you disable or otherwise tamper with the technical protection measures, the SOFTWARE may not function properly and You will have materially beached this agreement.
2\. DESCRIPTION OF OTHER RIGHTS AND LIMITATIONS. 2.1 Maintenance of Copyright Notices. You must not remove or alter any copyright notices on any and all copies of the SOFTWARE. 2.2 Distribution. You may not distribute registered copies of the SOFTWARE to third parties. 2.3 Prohibition on Reverse Engineering, Decompilation, and Disassembly. You may not reverse engineer, decompile, or disassemble the SOFTWARE, except and only to the extent that such activity is expressly permitted by applicable law notwithstanding this limitation. 2.4 Separation of Components. Software is licensed as a single product. Its components may not be separated for use on more than one computer. 2.5 Rental. You may not rent, lease, or lend the SOFTWARE. 2.6 Support Services. ORENJI may provide you with support services related to the SOFTWARE (“Support Services”). Any supplemental software code provided to you as part of the Support Services shall be considered part of the SOFTWARE and subject to the terms and conditions of this EULA. 2.6 Compliance with Applicable Laws. You must comply with all applicable laws regarding use of the SOFTWARE.
3\. TERMINATION Without prejudice to any other rights, ORENJI may terminate this EULA if you fail to comply with the terms and conditions of this EULA. In such event, you must destroy all copies of the SOFTWARE in your possession.
4\. COPYRIGHT All rights, all title, all interest, all trademarks and all copyrights in and pertaining to the Software, including but not limited to all images, photographs, animations, video, audio, music, text, data, computer code, algorithms, and information, are owned by ORENJI or its affiliated companies. The SOFTWARE is protected by U.S. and international copyright, trademarks, and other intellectual property laws and treaty provisions. You must treat the SOFTWARE like any other copyrighted product for archival purposes, and You may not copy the printed materials and documentation accompanying the SOFTWARE. You may not remove, modify or alter any ORENJI copyright or trademark notice from any part of the SOFTWARE. Unauthorized use or copying of the SOFTWARE, including SOFTWARE that has been modified, merged, or included with other software, is expressly forbidden.
5\. DISCLAIMER OF WARRANTIES THE SOFTWARE IS LICENSED “AS IS, WITH ALL FAULTS” AND YOU AND YOUR AUTHORIZED END USERS ARE ASSUMING ALL RISK AS TO ITS QUALITY AND PERFORMANCE. ORENJI DISCLAIMS ALL WARRANTIES, EXPRESS OR IMPLIED, WITH RESPECT TO THE SOFTWARE, INCLUDING BUT NOT LIMITED TO CONDITION, CONFORMITY TO ANY REPRESENTATION OR DESCRIPTION, COMPATIBILITY WITH ALL HARDWARE AND SOFTWARE CONFIGURATIONS, THE EXISTENCE OF ANY LATENT OR PATENT DEFECTS, NEGLIGENCE, AND THE WARRANTIES OF TITLE, NON-INFRINGEMENT, MERCHANTABILITY, AND FITNESS FOR A PARTICULAR USE OR PURPOSE. FURTHER, YOU ACKNOWLEDGE AND AGREE THAT (1) ORENJI DOES NOT MAKE ANY WARRANTY THAT THE SOFTWARE AND DOCUMENTATION ARE WITHOUT DEFECT OR ERROR, OR THAT ALL PRODUCT ERRORS WILL BE CORRECTED; AND (2) ORENJI DOES NOT MAKE ANY WARRANTY AS TO ANY RESULTS THAT MAY BE OBTAINED BY USE OF THE SOFTWARE.
6\. INDEMNITY You agree to indemnify and hold harmless ORENJI, its subsidiaries, and their current and former shareholders, directors, officers, employees, and agents from and against any and all demands, judgments, losses, costs, expenses, obligations, liabilities, damages, fines, recoveries and deficiencies, including without limitation interest, penalties, reasonable attorney’s fees and costs, which any such party may incur or suffer which are based upon, arising from, or related to the Use of the SOFTWARE provided to You, or the alleged or actual breach of any of Your obligations under this Agreement.
7\. LIMITATION OF LIABILITY In no event shall ORENJI be liable for any damages (including, without limitation, lost profits, business interruption, or lost information) rising out of ‘Authorized Users’ use of or inability to use the SOFTWARE, even if ORENJI has been advised of the possibility of such damages. In no event will ORENJI be liable for loss of data or for indirect, special, incidental, consequential (including lost profit), or other damages based in contract, tort or otherwise. ORENJI shall have no liability with respect to the content of the SOFTWARE or any part thereof, including but not limited to errors or omissions contained therein, libel, infringements of rights of publicity, privacy, trademark rights, business interruption, personal injury, loss of privacy, moral rights or the disclosure of confidential information.
[**On-Demand H100 SXM GPUs for $2.99/hr/GPU with Lambda** 640 GB of vRAM in one 8x instance **Launch now**](https://server.ethicalads.io/proxy/click/9837/019d0edd-8fac-7681-b3ae-6e1cc74dab4a/)
[Ads by EthicalAds](https://www.ethicalads.io/advertisers/topics/data-science/?ref=ea-text)
---
# Portfolio Optimization with Python Course - Riskfolio-Lib 7.2
[Skip to content](https://riskfolio-lib.readthedocs.io/en/latest/course.html#motivation)
Portfolio Optimization with Python Course[¶](https://riskfolio-lib.readthedocs.io/en/latest/course.html#portfolio-optimization-with-python-course "Link to this heading")
==========================================================================================================================================================================
[Buy Advanced Portfolio Optimization Book on Springer](https://www.kqzyfj.com/click-101359873-15150084?url=https%3A%2F%2Flink.springer.com%2Fbook%2F9783031843037)
[Enroll in the Portfolio Optimization with Python Course](https://www.paypal.com/ncp/payment/GN55W4UQ7VAMN)
[](https://github.com/sponsors/dcajasn)
[](https://ko-fi.com/B0B833SXD)
Motivation[¶](https://riskfolio-lib.readthedocs.io/en/latest/course.html#motivation "Link to this heading")
------------------------------------------------------------------------------------------------------------
Since its release in March 2nd, 2020; Riskfolio-Lib has become one of the most popular Portfolio Optimization Python libraries worldwide. However, a large percentage of users encounter difficulties when using Riskfolio-Lib because they have not had adequate training in mathematical optimization or mathematical programming.
**It is important to mention that this course helps to fund the continuous development and maintenance of Riskfolio-Lib due to it is a personal open-source project that is not financed for any institution like other popular Python projects.**
Objective[¶](https://riskfolio-lib.readthedocs.io/en/latest/course.html#objective "Link to this heading")
----------------------------------------------------------------------------------------------------------
The objective of the course is to provide the student with the computational tools that allow them to design asset allocation strategies using the most modern portfolio optimization techniques that would be very complicated using a spreadsheet or a traditional programming language.
Student Profile[¶](https://riskfolio-lib.readthedocs.io/en/latest/course.html#student-profile "Link to this heading")
----------------------------------------------------------------------------------------------------------------------
Professionals in the areas of finance, investments, risk management; who wish to improve their skills in portfolio optimization. It is recommended that the students have basic to intermediate knowledge of portfolio theory, optimization, calculus, linear algebra and statistics; and intermediate to advance knowledge of one programming language (Python, R, Julia, Rust, C, C++, VBA, VB.net, Matlab or similar).
Courses Details[¶](https://riskfolio-lib.readthedocs.io/en/latest/course.html#courses-details "Link to this heading")
----------------------------------------------------------------------------------------------------------------------
* The course will be available, with all materials (recordings, codes, slides and whiteboards), starting **March 28, 2026**.
* The classes are online and asynchronous through our Google Classroom.
* The materials will be updated every two years.
Enrollment[¶](https://riskfolio-lib.readthedocs.io/en/latest/course.html#enrollment "Link to this heading")
------------------------------------------------------------------------------------------------------------
To enroll in the course, you need an email with an explicit “@gmail.com” domain and then pay the course fee using the following PayPal link:
Course
[**On-Demand H100 SXM GPUs for $2.99/hr/GPU with Lambda** 640 GB of vRAM in one 8x instance **Launch now**](https://server.ethicalads.io/proxy/click/9837/019d0edd-8fac-7681-b3ae-6e1cc74dab4a/)
[Ads by EthicalAds](https://www.ethicalads.io/advertisers/topics/data-science/?ref=ea-text)
Something went wrong. Contact the merchant for help.
This browser isn’t supported. Open a different browser and try again.
There isn't enough of this item for your order.
### Portfolio Optimization with Python Course
### $800.00 USD
### $800.00 USD
### Sold out
Full course on portfolio optimization with applications in the Python programming language.
Checkout

After pay the PayPal invoice you must send us an email to [orenji.eirl@gmail.com](mailto:orenji.eirl%40gmail.com)
to confirm your registration in the course.
If you wish to register in a **group of 4 or more, a 10% discount applies**, for which you must send us an email to [orenji.eirl@gmail.com](mailto:orenji.eirl%40gmail.com)
with the information of all the students (full name, city of residence and an email with explicit [‘@gmail.com](mailto:'%40gmail.com)
’ domain) in order to send you a customized PayPal invoice with the discount.
Course Content[¶](https://riskfolio-lib.readthedocs.io/en/latest/course.html#course-content "Link to this heading")
--------------------------------------------------------------------------------------------------------------------
The detailed content of the course follows below:
| Topics | |
| --- | --- |
| **Scientific Computation Review** | |
| Numpy: Linear Algebra | |
| Pandas: Dataframes | |
| Scipy: Statistical Functions and Linear Algebra | |
| Montecarlo and Quasimontecarlo Simulation Applied to Portfolio Optimization | |
| Statsmodels: Econometrics | |
| **Convex Optimization Applied to Portfolio Optimization** | |
| CVXPY: Disciplined Convex Programming (DCP) Optimization | |
| Linear Programming | |
| - _Gini Mean Difference (GMD)_ | - _Mean Absolute Deviation (MAD)_ |
| - _First Lower Partial Moment_ | - _Conditional Value at Risk (CVaR)_ |
| - _Maximum Loss or Minimax_ | - _Range_ |
| - _Conditional Drawdown at Risk (CDaR)_ | - _Maximum Drawdown_ |
| - _Linear Inequalities Constraints_ | - _Turnover Constraints_ |
| Quadratic Programming | |
| - _Variance_ | - _Tracking Error based on Weights_ |
| Second Order Cone Programming | |
| - _Standard Deviation_ | - _Second Lower Partial Moment_ |
| - _Value at Risk for Elliptical Distributions_ | - _Index Tracking Error_ |
| _Semidefinite Programming_ | |
| - _Variance_ | - _Kurtosis_ |
| - _Approximate Kurtosis_ | - _Skewness_ |
| _Exponential Cone Programming_ | |
| - _Entropic Value at Risk (EVaR)_ | - _Entropic Drawdown at Risk (EDaR)_ |
| Power Cone Programming | |
| - _Relativistic Value at Risk (RLVaR)_ | - _Relativistic Drawdown at Risk (RLDaR)_ |
| - _Even Moments_ | |
| Convex Fractional Programming (Risk Adjusted Return Ratio Optimization) | |
| Mean Risk Optimization | |
| Ordered Weighted Average (OWA) Risk Measures | |
| - _OWA Risk Measures_ | - _Higher L-moments_ |
| Risk Parity Optimization | |
| - _Least Squares Approach_ | - _Risk Budgeting Approach_ |
| - _Semidefinite Approach_ | |
| Worst Case Optimization | |
| - _Box Uncertainty Sets_ | - _Elliptical Uncertainty Sets_ |
| **Integer Programming Applied to Portfolio Optimization** | |
| Quantile Optimization | |
| - _Value at Risk_ | - _Drawdown at Risk_ |
| Integer Constraints | |
| - _Cardinality Constraint on Assets_ | - _Cardinality Constraint on Sets_ |
| - _Join Investment Constraints_ | - _Mutually Exclusive Investment Constraints_ |
| - _Buy in Threshold Constraint_ | |
| Convex Fractional Programming with Integer Variables | |
| Risk Parity Optimization for Long Short Portfolios | |
| **Machine Learning Algorithms Applied to Portfolio Optimization** | |
| Hierarchical Risk Parity | |
| Hierarchical Equal Risk Contribution | |
| Nested Clustered Optimization | |
| **Graph Theory Applied to Portfolio Optimization** | |
| Centrality Measures Constraints (Average Connectivity of Graphs) | |
| Network Constraints (Relative Positions on Graphs) | |
| Clusters Constraints (Clusters based on Dendrogram) | |
| **Estimation of Input Parameters that Incorporate Additional Information** | |
| Risk Factors Models | |
| - _Explicit Risk Factors_ | - _Implicit Risk Factors_ |
| Black Litterman Models | |
| - _Original Black Litterman Model (Views on Assets)_ | |
| - _Augmented Black Litterman Model (Views on Assets and Risk Factors)_ | |
| - _Black Litterman Bayesian (Views on Risk Factors)_ | |
| **Backtesting of Portfolio Optimization Strategies** | |
| The Walk Forward Method (Rolling and Expanding Window) | |
| The Cross-Validation Method | |
| The Combinatorial Purged Cross-Validation Method | |
---
# Hierarchical Clustering Portfolio Optimization - Riskfolio-Lib 7.2
[Skip to content](https://riskfolio-lib.readthedocs.io/en/latest/hcportfolio.html#some-theory)
Hierarchical Clustering Portfolio Optimization[¶](https://riskfolio-lib.readthedocs.io/en/latest/hcportfolio.html#hierarchical-clustering-portfolio-optimization "Link to this heading")
=========================================================================================================================================================================================
[Buy Advanced Portfolio Optimization Book on Springer](https://www.kqzyfj.com/click-101359873-15150084?url=https%3A%2F%2Flink.springer.com%2Fbook%2F9783031843037)
[Enroll in the Portfolio Optimization with Python Course](https://www.paypal.com/ncp/payment/GN55W4UQ7VAMN)
[](https://github.com/sponsors/dcajasn)
[](https://ko-fi.com/B0B833SXD)
Some Theory[¶](https://riskfolio-lib.readthedocs.io/en/latest/hcportfolio.html#some-theory "Link to this heading")
-------------------------------------------------------------------------------------------------------------------
### Hierarchical Clustering Portfolio Optimization[¶](https://riskfolio-lib.readthedocs.io/en/latest/hcportfolio.html#id1 "Link to this heading")
Riskfolio-Lib allows to calculate the new machine learning asset allocation models. The available models are:
* Hierarchical Risk Parity (HRP) \[[C1](https://riskfolio-lib.readthedocs.io/en/latest/hcportfolio.html#id77 "Marcos López de Prado. Building diversified portfolios that outperform out of sample. The Journal of Portfolio Management, 42(4):59–69, 2016. URL: https://jpm.pm-research.com/content/42/4/59, arXiv:https://jpm.pm-research.com/content/42/4/59.full.pdf, doi:10.3905/jpm.2016.42.4.059.")\
\], \[[C2](https://riskfolio-lib.readthedocs.io/en/latest/hcportfolio.html#id76 "Daniel Sjöstrand and Nima Behnejad. Exploration of hierarchical clustering in long-only risk-based portfolio optimization. Master's thesis, Copenhagen Business School, Solbjerg Pl. 3, 2000 Frederiksberg, Denmark, 5 2020. URL: https://research-api.cbs.dk/ws/portalfiles/portal/62178444/879726_Master_Thesis_Nima_Daniel_15736.pdf.")\
\], \[[C3](https://riskfolio-lib.readthedocs.io/en/latest/hcportfolio.html#id86 "Johann Pfitzinger and Nico Katzke. A constrained hierarchical risk parity algorithm with cluster-based capital allocation. Working Papers 14/2019, Stellenbosch University, Department of Economics, 2019. URL: https://ideas.repec.org/p/sza/wpaper/wpapers328.html.")\
\].
* Hierarchical Equal Risk Contribution (HERC) \[[C4](https://riskfolio-lib.readthedocs.io/en/latest/hcportfolio.html#id78 "Thomas Raffinot. Hierarchical clustering-based asset allocation. The Journal of Portfolio Management, 44(2):89–99, December 2017. URL: https://doi.org/10.3905/jpm.2018.44.2.089, doi:10.3905/jpm.2018.44.2.089.")\
\], \[[C5](https://riskfolio-lib.readthedocs.io/en/latest/hcportfolio.html#id79 "Thomas Raffinot. The hierarchical equal risk contribution portfolio. 08 2018. doi:10.2139/ssrn.3237540.")\
\], \[[C2](https://riskfolio-lib.readthedocs.io/en/latest/hcportfolio.html#id76 "Daniel Sjöstrand and Nima Behnejad. Exploration of hierarchical clustering in long-only risk-based portfolio optimization. Master's thesis, Copenhagen Business School, Solbjerg Pl. 3, 2000 Frederiksberg, Denmark, 5 2020. URL: https://research-api.cbs.dk/ws/portalfiles/portal/62178444/879726_Master_Thesis_Nima_Daniel_15736.pdf.")\
\].
* Nested Clustered Optimization (NCO) \[[C6](https://riskfolio-lib.readthedocs.io/en/latest/hcportfolio.html#id89 "Marcos Prado. A robust estimator of the efficient frontier. SSRN Electronic Journal, 01 2019. doi:10.2139/ssrn.3469961.")\
\], \[[C2](https://riskfolio-lib.readthedocs.io/en/latest/hcportfolio.html#id76 "Daniel Sjöstrand and Nima Behnejad. Exploration of hierarchical clustering in long-only risk-based portfolio optimization. Master's thesis, Copenhagen Business School, Solbjerg Pl. 3, 2000 Frederiksberg, Denmark, 5 2020. URL: https://research-api.cbs.dk/ws/portalfiles/portal/62178444/879726_Master_Thesis_Nima_Daniel_15736.pdf.")\
\].
In the first two cases we have the option to use the following 32 risk measures to calculate HRP and HERC portfolios using naive risk parity:
**Dispersion Risk Measures:**
* Standard Deviation.
* Variance.
* Square Root Kurtosis.
* Mean Absolute Deviation (MAD).
* Gini Mean Difference (GMD).
* Conditional Value at Risk Range.
* Tail Gini Range.
* Range.
**Downside Risk Measures:**
* Semi Standard Deviation.
* Square Root Semi Kurtosis.
* First Lower Partial Moment (Omega Ratio).
* Second Lower Partial Moment (Sortino Ratio).
* Value at Risk (VaR).
* Conditional Value at Risk (CVaR).
* Entropic Value at Risk (EVaR).
* Relativistic Value at Risk (RLVaR).
* Tail Gini.
* Worst Case Realization (Minimax).
**Drawdown Risk Measures:**
* Average Drawdown for compounded and uncompounded cumulative returns.
* Ulcer Index for compounded and uncompounded cumulative returns.
* Drawdown at Risk (DaR) for compounded and uncompounded cumulative returns.
* Conditional Drawdown at Risk (CDaR) for compounded and uncompounded cumulative returns.
* Entropic Drawdown at Risk (EDaR) for compounded and uncompounded cumulative returns.
* Relativistic Drawdown at Risk (EDaR) for compounded and uncompounded cumulative returns.
* Maximum Drawdown (Calmar Ratio) for compounded and uncompounded cumulative returns.
For the NCO model we have the option to use four objective functions with the available risk measures to each objective:
* Minimize the selected risk measure.
* Maximize the Utility function μw−lϕi(w).
* Maximize the risk adjusted return ratio based on the selected risk measure.
* Equally risk contribution portfolio of the selected risk measure.
Module Methods[¶](https://riskfolio-lib.readthedocs.io/en/latest/hcportfolio.html#module-HCPortfolio "Link to this heading")
-----------------------------------------------------------------------------------------------------------------------------
_class_ HCPortfolio.HCPortfolio(_[returns](https://riskfolio-lib.readthedocs.io/en/latest/hcportfolio.html#HCPortfolio.HCPortfolio.__init__.returns "HCPortfolio.HCPortfolio.__init__.returns (Python parameter) — Assets returns DataFrame, where n_samples is the number of observations and n_assets is the number of assets. The default is None.")
\=`None`_, _[alpha](https://riskfolio-lib.readthedocs.io/en/latest/hcportfolio.html#HCPortfolio.HCPortfolio.__init__.alpha "HCPortfolio.HCPortfolio.__init__.alpha (Python parameter) — Significance level of VaR, CVaR, EVaR, RLVaR, DaR, CDaR, EDaR, RLDaR and Tail Gini of losses. The default is 0.05.")
\=`0.05`_, _[a\_sim](https://riskfolio-lib.readthedocs.io/en/latest/hcportfolio.html#HCPortfolio.HCPortfolio.__init__.a_sim "HCPortfolio.HCPortfolio.__init__.a_sim (Python parameter) — Number of CVaRs used to approximate Tail Gini of losses.")
\=`100`_, _[beta](https://riskfolio-lib.readthedocs.io/en/latest/hcportfolio.html#HCPortfolio.HCPortfolio.__init__.beta "HCPortfolio.HCPortfolio.__init__.beta (Python parameter) — Significance level of CVaR and Tail Gini of gains.")
\=`None`_, _[b\_sim](https://riskfolio-lib.readthedocs.io/en/latest/hcportfolio.html#HCPortfolio.HCPortfolio.__init__.b_sim "HCPortfolio.HCPortfolio.__init__.b_sim (Python parameter) — Number of CVaRs used to approximate Tail Gini of gains.")
\=`None`_, _[kappa](https://riskfolio-lib.readthedocs.io/en/latest/hcportfolio.html#HCPortfolio.HCPortfolio.__init__.kappa "HCPortfolio.HCPortfolio.__init__.kappa (Python parameter) — Deformation parameter of RLVaR and RLDaR for losses, must be between 0 and 1. The default is 0.3.")
\=`0.3`_, _[kappa\_g](https://riskfolio-lib.readthedocs.io/en/latest/hcportfolio.html#HCPortfolio.HCPortfolio.__init__.kappa_g "HCPortfolio.HCPortfolio.__init__.kappa_g (Python parameter) — Deformation parameter of RLVaR and RLDaR for gains, must be between 0 and 1. The default is None.")
\=`None`_, _[solver\_rl](https://riskfolio-lib.readthedocs.io/en/latest/hcportfolio.html#HCPortfolio.HCPortfolio.__init__.solver_rl "HCPortfolio.HCPortfolio.__init__.solver_rl (Python parameter) — Solver available for CVXPY that supports power cone programming.")
\=`'CLARABEL'`_, _[solvers](https://riskfolio-lib.readthedocs.io/en/latest/hcportfolio.html#HCPortfolio.HCPortfolio.__init__.solvers "HCPortfolio.HCPortfolio.__init__.solvers (Python parameter) — List of solvers available for CVXPY used for the selected NCO method. The default value is ['CLARABEL', 'SCS', 'ECOS'].")
\=`['CLARABEL', 'SCS', 'ECOS']`_, _[w\_max](https://riskfolio-lib.readthedocs.io/en/latest/hcportfolio.html#HCPortfolio.HCPortfolio.__init__.w_max "HCPortfolio.HCPortfolio.__init__.w_max (Python parameter) — Upper bound constraint for hierarchical risk parity weights c-Pfitzinger.")
\=`None`_, _[w\_min](https://riskfolio-lib.readthedocs.io/en/latest/hcportfolio.html#HCPortfolio.HCPortfolio.__init__.w_min "HCPortfolio.HCPortfolio.__init__.w_min (Python parameter) — Lower bound constraint for hierarchical risk parity weights c-Pfitzinger.")
\=`None`_)[\[source\]](https://riskfolio-lib.readthedocs.io/en/latest/_modules/HCPortfolio.html#HCPortfolio)
[¶](https://riskfolio-lib.readthedocs.io/en/latest/hcportfolio.html#HCPortfolio.HCPortfolio "Link to this definition")
Class that creates a portfolio object with all properties needed to calculate optimal portfolios.
Parameters:[¶](https://riskfolio-lib.readthedocs.io/en/latest/hcportfolio.html#HCPortfolio.HCPortfolio-parameters "Permalink to this headline")
returns : DataFrame of shape (n\_samples, n\_assets), optional[¶](https://riskfolio-lib.readthedocs.io/en/latest/hcportfolio.html#HCPortfolio.HCPortfolio.__init__.returns "Permalink to this definition")
Assets returns DataFrame, where n\_samples is the number of observations and n\_assets is the number of assets. The default is None.
alpha : [float](https://docs.python.org/3.11/library/functions.html#float "(in Python v3.11)")
, optional[¶](https://riskfolio-lib.readthedocs.io/en/latest/hcportfolio.html#HCPortfolio.HCPortfolio.__init__.alpha "Permalink to this definition")
Significance level of VaR, CVaR, EVaR, RLVaR, DaR, CDaR, EDaR, RLDaR and Tail Gini of losses. The default is 0.05.
a\_sim : [float](https://docs.python.org/3.11/library/functions.html#float "(in Python v3.11)")
, optional[¶](https://riskfolio-lib.readthedocs.io/en/latest/hcportfolio.html#HCPortfolio.HCPortfolio.__init__.a_sim "Permalink to this definition")
Number of CVaRs used to approximate Tail Gini of losses. The default is 100.
beta : [float](https://docs.python.org/3.11/library/functions.html#float "(in Python v3.11)")
, optional[¶](https://riskfolio-lib.readthedocs.io/en/latest/hcportfolio.html#HCPortfolio.HCPortfolio.__init__.beta "Permalink to this definition")
Significance level of CVaR and Tail Gini of gains. If None it duplicates alpha value. The default is None.
b\_sim : [float](https://docs.python.org/3.11/library/functions.html#float "(in Python v3.11)")
, optional[¶](https://riskfolio-lib.readthedocs.io/en/latest/hcportfolio.html#HCPortfolio.HCPortfolio.__init__.b_sim "Permalink to this definition")
Number of CVaRs used to approximate Tail Gini of gains. If None it duplicates a\_sim value. The default is None.
kappa : [float](https://docs.python.org/3.11/library/functions.html#float "(in Python v3.11)")
, optional[¶](https://riskfolio-lib.readthedocs.io/en/latest/hcportfolio.html#HCPortfolio.HCPortfolio.__init__.kappa "Permalink to this definition")
Deformation parameter of RLVaR and RLDaR for losses, must be between 0 and 1. The default is 0.3.
kappa\_g : [float](https://docs.python.org/3.11/library/functions.html#float "(in Python v3.11)")
, optional[¶](https://riskfolio-lib.readthedocs.io/en/latest/hcportfolio.html#HCPortfolio.HCPortfolio.__init__.kappa_g "Permalink to this definition")
Deformation parameter of RLVaR and RLDaR for gains, must be between 0 and 1. The default is None.
solver\_rl : [str](https://docs.python.org/3.11/library/stdtypes.html#str "(in Python v3.11)")
, optional[¶](https://riskfolio-lib.readthedocs.io/en/latest/hcportfolio.html#HCPortfolio.HCPortfolio.__init__.solver_rl "Permalink to this definition")
Solver available for CVXPY that supports power cone programming. Used to calculate RLVaR and RLDaR. The default value is None.
solvers : [list](https://docs.python.org/3.11/library/stdtypes.html#list "(in Python v3.11)")
, optional[¶](https://riskfolio-lib.readthedocs.io/en/latest/hcportfolio.html#HCPortfolio.HCPortfolio.__init__.solvers "Permalink to this definition")
List of solvers available for CVXPY used for the selected NCO method. The default value is \[‘CLARABEL’, ‘SCS’, ‘ECOS’\].
w\_max : pd.Series or [float](https://docs.python.org/3.11/library/functions.html#float "(in Python v3.11)")
, optional[¶](https://riskfolio-lib.readthedocs.io/en/latest/hcportfolio.html#HCPortfolio.HCPortfolio.__init__.w_max "Permalink to this definition")
Upper bound constraint for hierarchical risk parity weights \[[C3](https://riskfolio-lib.readthedocs.io/en/latest/hcportfolio.html#id86 "Johann Pfitzinger and Nico Katzke. A constrained hierarchical risk parity algorithm with cluster-based capital allocation. Working Papers 14/2019, Stellenbosch University, Department of Economics, 2019. URL: https://ideas.repec.org/p/sza/wpaper/wpapers328.html.")\
\].
w\_min : pd.Series or [float](https://docs.python.org/3.11/library/functions.html#float "(in Python v3.11)")
, optional[¶](https://riskfolio-lib.readthedocs.io/en/latest/hcportfolio.html#HCPortfolio.HCPortfolio.__init__.w_min "Permalink to this definition")
Lower bound constraint for hierarchical risk parity weights \[[C3](https://riskfolio-lib.readthedocs.io/en/latest/hcportfolio.html#id86 "Johann Pfitzinger and Nico Katzke. A constrained hierarchical risk parity algorithm with cluster-based capital allocation. Working Papers 14/2019, Stellenbosch University, Department of Economics, 2019. URL: https://ideas.repec.org/p/sza/wpaper/wpapers328.html.")\
\].
optimization(_[model](https://riskfolio-lib.readthedocs.io/en/latest/hcportfolio.html#HCPortfolio.HCPortfolio.optimization.model "HCPortfolio.HCPortfolio.optimization.model (Python parameter) — The hierarchical cluster portfolio model used for optimize the portfolio.")
\=`'HRP'`_, _[codependence](https://riskfolio-lib.readthedocs.io/en/latest/hcportfolio.html#HCPortfolio.HCPortfolio.optimization.codependence "HCPortfolio.HCPortfolio.optimization.codependence (Python parameter) — The codependence or similarity matrix used to build the distance metric and clusters.")
\=`'pearson'`_, _[obj](https://riskfolio-lib.readthedocs.io/en/latest/hcportfolio.html#HCPortfolio.HCPortfolio.optimization.obj "HCPortfolio.HCPortfolio.optimization.obj (Python parameter) — Objective function used by the NCO model. The default is 'MinRisk'.")
\=`'MinRisk'`_, _[rm](https://riskfolio-lib.readthedocs.io/en/latest/hcportfolio.html#HCPortfolio.HCPortfolio.optimization.rm "HCPortfolio.HCPortfolio.optimization.rm (Python parameter) — The risk measure used to optimize the portfolio.")
\=`'MV'`_, _[rf](https://riskfolio-lib.readthedocs.io/en/latest/hcportfolio.html#HCPortfolio.HCPortfolio.optimization.rf "HCPortfolio.HCPortfolio.optimization.rf (Python parameter) — Risk free rate, must be in the same period of assets returns. The default is 0.")
\=`0`_, _[l](https://riskfolio-lib.readthedocs.io/en/latest/hcportfolio.html#HCPortfolio.HCPortfolio.optimization.l "HCPortfolio.HCPortfolio.optimization.l (Python parameter) — Risk aversion factor of the 'Utility' objective function. The default is 2.")
\=`2`_, _[method\_mu](https://riskfolio-lib.readthedocs.io/en/latest/hcportfolio.html#HCPortfolio.HCPortfolio.optimization.method_mu "HCPortfolio.HCPortfolio.optimization.method_mu (Python parameter) — The method used to estimate the expected returns vector. The default value is 'hist'.")
\=`'hist'`_, _[method\_cov](https://riskfolio-lib.readthedocs.io/en/latest/hcportfolio.html#HCPortfolio.HCPortfolio.optimization.method_cov "HCPortfolio.HCPortfolio.optimization.method_cov (Python parameter) — The method used to estimate the covariance matrix: The default is 'hist'.")
\=`'hist'`_, _[custom\_mu](https://riskfolio-lib.readthedocs.io/en/latest/hcportfolio.html#HCPortfolio.HCPortfolio.optimization.custom_mu "HCPortfolio.HCPortfolio.optimization.custom_mu (Python parameter) — Custom mean vector when NCO objective is 'Utility' or 'Sharpe'. The default is None.")
\=`None`_, _[custom\_cov](https://riskfolio-lib.readthedocs.io/en/latest/hcportfolio.html#HCPortfolio.HCPortfolio.optimization.custom_cov "HCPortfolio.HCPortfolio.optimization.custom_cov (Python parameter) — Custom covariance matrix, used when codependence or covariance parameters have value 'custom_cov'.")
\=`None`_, _[linkage](https://riskfolio-lib.readthedocs.io/en/latest/hcportfolio.html#HCPortfolio.HCPortfolio.optimization.linkage "HCPortfolio.HCPortfolio.optimization.linkage (Python parameter) — Linkage method of hierarchical clustering.")
\=`'single'`_, _[opt\_k\_method](https://riskfolio-lib.readthedocs.io/en/latest/hcportfolio.html#HCPortfolio.HCPortfolio.optimization.opt_k_method "HCPortfolio.HCPortfolio.optimization.opt_k_method (Python parameter) — Method used to calculate the optimum number of clusters. The default is 'twodiff'.")
\=`'twodiff'`_, _[k](https://riskfolio-lib.readthedocs.io/en/latest/hcportfolio.html#HCPortfolio.HCPortfolio.optimization.k "HCPortfolio.HCPortfolio.optimization.k (Python parameter) — Number of clusters.")
\=`None`_, _[max\_k](https://riskfolio-lib.readthedocs.io/en/latest/hcportfolio.html#HCPortfolio.HCPortfolio.optimization.max_k "HCPortfolio.HCPortfolio.optimization.max_k (Python parameter) — Max number of clusters used by the two difference gap statistic to find the optimal number of clusters.")
\=`10`_, _[bins\_info](https://riskfolio-lib.readthedocs.io/en/latest/hcportfolio.html#HCPortfolio.HCPortfolio.optimization.bins_info "HCPortfolio.HCPortfolio.optimization.bins_info (Python parameter) — Number of bins used to calculate variation of information.")
\=`'KN'`_, _[alpha\_tail](https://riskfolio-lib.readthedocs.io/en/latest/hcportfolio.html#HCPortfolio.HCPortfolio.optimization.alpha_tail "HCPortfolio.HCPortfolio.optimization.alpha_tail (Python parameter) — Significance level for lower tail dependence index.")
\=`0.05`_, _[gs\_threshold](https://riskfolio-lib.readthedocs.io/en/latest/hcportfolio.html#HCPortfolio.HCPortfolio.optimization.gs_threshold "HCPortfolio.HCPortfolio.optimization.gs_threshold (Python parameter) — Gerber statistic threshold.")
\=`0.5`_, _[leaf\_order](https://riskfolio-lib.readthedocs.io/en/latest/hcportfolio.html#HCPortfolio.HCPortfolio.optimization.leaf_order "HCPortfolio.HCPortfolio.optimization.leaf_order (Python parameter) — Indicates if the cluster are ordered so that the distance between successive leaves is minimal.")
\=`True`_, _[dict\_mu](https://riskfolio-lib.readthedocs.io/en/latest/hcportfolio.html#HCPortfolio.HCPortfolio.optimization.dict_mu "HCPortfolio.HCPortfolio.optimization.dict_mu (Python parameter) — Other variables related to the mean vector estimation method.")
\=`{}`_, _[dict\_cov](https://riskfolio-lib.readthedocs.io/en/latest/hcportfolio.html#HCPortfolio.HCPortfolio.optimization.dict_cov "HCPortfolio.HCPortfolio.optimization.dict_cov (Python parameter) — Other variables related to the covariance estimation method.")
\=`{}`_)[\[source\]](https://riskfolio-lib.readthedocs.io/en/latest/_modules/HCPortfolio.html#HCPortfolio.optimization)
[¶](https://riskfolio-lib.readthedocs.io/en/latest/hcportfolio.html#HCPortfolio.HCPortfolio.optimization "Link to this definition")
This method calculates the optimal portfolio according to the optimization model selected by the user.
Parameters:[¶](https://riskfolio-lib.readthedocs.io/en/latest/hcportfolio.html#HCPortfolio.HCPortfolio.optimization-parameters "Permalink to this headline")
model : [str](https://docs.python.org/3.11/library/stdtypes.html#str "(in Python v3.11)")
, optional[¶](https://riskfolio-lib.readthedocs.io/en/latest/hcportfolio.html#HCPortfolio.HCPortfolio.optimization.model "Permalink to this definition")
The hierarchical cluster portfolio model used for optimize the portfolio. The default is ‘HRP’. Possible values are:
* ’HRP’: Hierarchical Risk Parity.
* ’HERC’: Hierarchical Equal Risk Contribution.
* ’HERC2’: HERC but splitting weights equally within clusters.
* ’NCO’: Nested Clustered Optimization.
codependence : [str](https://docs.python.org/3.11/library/stdtypes.html#str "(in Python v3.11)")
, optional[¶](https://riskfolio-lib.readthedocs.io/en/latest/hcportfolio.html#HCPortfolio.HCPortfolio.optimization.codependence "Permalink to this definition")
The codependence or similarity matrix used to build the distance metric and clusters. The default is ‘pearson’. Possible values are:
* ’pearson’: pearson correlation matrix. Distance formula: Di,j\=0.5(1−ρi,jpearson).
* ’spearman’: spearman correlation matrix. Distance formula: Di,j\=0.5(1−ρi,jspearman).
* ’kendall’: kendall correlation matrix. Distance formula: Di,j\=0.5(1−ρi,jkendall).
* ’gerber1’: Gerber statistic 1 correlation matrix. Distance formula: Di,j\=0.5(1−ρi,jgerber1).
* ’gerber2’: Gerber statistic 2 correlation matrix. Distance formula: Di,j\=0.5(1−ρi,jgerber2).
* ’abs\_pearson’: absolute value pearson correlation matrix. Distance formula: Di,j\=(1−|ρi,jpearson|).
* ’abs\_spearman’: absolute value spearman correlation matrix. Distance formula: Di,j\=(1−|ρi,jspearman|).
* ’abs\_kendall’: absolute value kendall correlation matrix. Distance formula: Di,j\=(1−|ρi,jkendall|).
* ’distance’: distance correlation matrix. Distance formula Di,j\=(1−ρi,jdistance).
* ’mutual\_info’: mutual information matrix. Distance used is variation information matrix.
* ’tail’: lower tail dependence index matrix. Dissimilarity formula Di,j\=−logλi,j.
* ’custom\_cov’: use custom correlation matrix based on the custom\_cov parameter. Distance formula: Di,j\=0.5(1−ρi,jpearson).
obj : [str](https://docs.python.org/3.11/library/stdtypes.html#str "(in Python v3.11)")
, optional[¶](https://riskfolio-lib.readthedocs.io/en/latest/hcportfolio.html#HCPortfolio.HCPortfolio.optimization.obj "Permalink to this definition")
Objective function used by the NCO model. The default is ‘MinRisk’. Possible values are:
* ’MinRisk’: Minimize the selected risk measure.
* ’Utility’: Maximize the Utility function μw−lϕi(w).
* ’Sharpe’: Maximize the risk adjusted return ratio based on the selected risk measure.
* ’ERC’: Equally risk contribution portfolio of the selected risk measure.
rm : [str](https://docs.python.org/3.11/library/stdtypes.html#str "(in Python v3.11)")
, optional[¶](https://riskfolio-lib.readthedocs.io/en/latest/hcportfolio.html#HCPortfolio.HCPortfolio.optimization.rm "Permalink to this definition")
The risk measure used to optimize the portfolio. If model is ‘NCO’, the risk measures available depends on the objective function. The default is ‘MV’. Possible values are:
* ’equal’: Equally weighted.
* ’vol’: Standard Deviation.
* ’MV’: Variance.
* ’KT’: Square Root Kurtosis.
* ’MAD’: Mean Absolute Deviation.
* ’MSV’: Semi Standard Deviation.
* ’SKT’: Square Root Semi Kurtosis.
* ’FLPM’: First Lower Partial Moment (Omega Ratio).
* ’SLPM’: Second Lower Partial Moment (Sortino Ratio).
* ’VaR’: Value at Risk.
* ’CVaR’: Conditional Value at Risk.
* ’TG’: Tail Gini.
* ’EVaR’: Entropic Value at Risk.
* ’RLVaR’: Relativistic Value at Risk. I recommend only use this function with MOSEK solver.
* ’WR’: Worst Realization (Minimax).
* ’VRG’ VaR range of returns.
* ’CVRG’: CVaR range of returns.
* ’TGRG’: Tail Gini range of returns.
* ’EVRG’: EVaR range of returns.
* ’RVRG’: RLVaR range of returns. I recommend only use this function with MOSEK solver.
* ’MDD’: Maximum Drawdown of uncompounded cumulative returns (Calmar Ratio).
* ’ADD’: Average Drawdown of uncompounded cumulative returns.
* ’DaR’: Drawdown at Risk of uncompounded cumulative returns.
* ’CDaR’: Conditional Drawdown at Risk of uncompounded cumulative returns.
* ’EDaR’: Entropic Drawdown at Risk of uncompounded cumulative returns.
* ’RLDaR’: Relativistic Drawdown at Risk of uncompounded cumulative returns. I recommend only use this function with MOSEK solver.
* ’UCI’: Ulcer Index of uncompounded cumulative returns.
* ’MDD\_Rel’: Maximum Drawdown of compounded cumulative returns (Calmar Ratio).
* ’ADD\_Rel’: Average Drawdown of compounded cumulative returns.
* ’DaR\_Rel’: Drawdown at Risk of compounded cumulative returns.
* ’CDaR\_Rel’: Conditional Drawdown at Risk of compounded cumulative returns.
* ’EDaR\_Rel’: Entropic Drawdown at Risk of compounded cumulative returns.
* ’RLDaR\_Rel’: Relativistic Drawdown at Risk of compounded cumulative returns. I recommend only use this function with MOSEK solver.
* ’UCI\_Rel’: Ulcer Index of compounded cumulative returns.
rf : [float](https://docs.python.org/3.11/library/functions.html#float "(in Python v3.11)")
, optional[¶](https://riskfolio-lib.readthedocs.io/en/latest/hcportfolio.html#HCPortfolio.HCPortfolio.optimization.rf "Permalink to this definition")
Risk free rate, must be in the same period of assets returns. The default is 0.
l : scalar, optional[¶](https://riskfolio-lib.readthedocs.io/en/latest/hcportfolio.html#HCPortfolio.HCPortfolio.optimization.l "Permalink to this definition")
Risk aversion factor of the ‘Utility’ objective function. The default is 2.
method\_mu : [str](https://docs.python.org/3.11/library/stdtypes.html#str "(in Python v3.11)")
, optional[¶](https://riskfolio-lib.readthedocs.io/en/latest/hcportfolio.html#HCPortfolio.HCPortfolio.optimization.method_mu "Permalink to this definition")
The method used to estimate the expected returns vector. The default value is ‘hist’. Possible values are:
* ’hist’: use historical estimator.
* ’ewma1’: use ewma with adjust=True. For more information see [EWM](https://pandas.pydata.org/pandas-docs/stable/user_guide/window.html#exponentially-weighted-window)
.
* ’ewma2’: use ewma with adjust=False. For more information see [EWM](https://pandas.pydata.org/pandas-docs/stable/user_guide/window.html#exponentially-weighted-window)
.
* ’JS’: James-Stein estimator. For more information see \[[C7](https://riskfolio-lib.readthedocs.io/en/latest/hcportfolio.html#id105 "Attilio Meucci. Risk and Asset Allocation. Springer Berlin Heidelberg, 2005. URL: https://doi.org/10.1007/978-3-540-27904-4, doi:10.1007/978-3-540-27904-4.")\
\] and \[[C8](https://riskfolio-lib.readthedocs.io/en/latest/hcportfolio.html#id106 "Yiyong Feng and Daniel P. Palomar. A signal processing perspective of financial engineering. Foundations and Trends® in Signal Processing, 9(1-2):1–231, 2016. URL: https://doi.org/10.1561/2000000072, doi:10.1561/2000000072.")\
\].
* ’BS’: Bayes-Stein estimator. For more information see \[[C9](https://riskfolio-lib.readthedocs.io/en/latest/hcportfolio.html#id107 "Philippe Jorion. Bayes-stein estimation for portfolio analysis. The Journal of Financial and Quantitative Analysis, 21(3):279, September 1986. URL: https://doi.org/10.2307/2331042, doi:10.2307/2331042.")\
\].
* ’BOP’: BOP estimator. For more information see \[[C10](https://riskfolio-lib.readthedocs.io/en/latest/hcportfolio.html#id108 "Taras Bodnar, Ostap Okhrin, and Nestor Parolya. Optimal shrinkage estimator for high-dimensional mean vector. Journal of Multivariate Analysis, 170:63–79, 03 2019. URL: https://doi.org/10.1016\%2Fj.jmva.2018.07.004, doi:10.1016/j.jmva.2018.07.004.")\
\].
* ’custom\_mu’: use custom expected returns vector.
method\_cov : [str](https://docs.python.org/3.11/library/stdtypes.html#str "(in Python v3.11)")
, optional[¶](https://riskfolio-lib.readthedocs.io/en/latest/hcportfolio.html#HCPortfolio.HCPortfolio.optimization.method_cov "Permalink to this definition")
The method used to estimate the covariance matrix: The default is ‘hist’. Possible values are:
* ’hist’: use historical estimates.
* ’ewma1’: use ewma with adjust=True. For more information see [EWM](https://pandas.pydata.org/pandas-docs/stable/user_guide/window.html#exponentially-weighted-window)
.
* ’ewma2’: use ewma with adjust=False. For more information see [EWM](https://pandas.pydata.org/pandas-docs/stable/user_guide/window.html#exponentially-weighted-window)
.
* ’ledoit’: use the Ledoit and Wolf Shrinkage method.
* ’oas’: use the Oracle Approximation Shrinkage method.
* ’shrunk’: use the basic Shrunk Covariance method.
* ’gl’: use the basic Graphical Lasso Covariance method.
* ’jlogo’: use the j-LoGo Covariance method. For more information see: \[[C11](https://riskfolio-lib.readthedocs.io/en/latest/hcportfolio.html#id90 "Wolfram Barfuss, Guido Previde Massara, T. Di Matteo, and Tomaso Aste. Parsimonious modeling with information filtering networks. Physical Review E, 12 2016. URL: http://dx.doi.org/10.1103/PhysRevE.94.062306, doi:10.1103/physreve.94.062306.")\
\].
* ’fixed’: denoise using fixed method. For more information see chapter 2 of \[[C12](https://riskfolio-lib.readthedocs.io/en/latest/hcportfolio.html#id91 "Marcos M. López de Prado. Machine Learning for Asset Managers. Elements in Quantitative Finance. Cambridge University Press, 2020. doi:10.1017/9781108883658.")\
\].
* ’spectral’: denoise using spectral method. For more information see chapter 2 of \[[C12](https://riskfolio-lib.readthedocs.io/en/latest/hcportfolio.html#id91 "Marcos M. López de Prado. Machine Learning for Asset Managers. Elements in Quantitative Finance. Cambridge University Press, 2020. doi:10.1017/9781108883658.")\
\].
* ’shrink’: denoise using shrink method. For more information see chapter 2 of \[[C12](https://riskfolio-lib.readthedocs.io/en/latest/hcportfolio.html#id91 "Marcos M. López de Prado. Machine Learning for Asset Managers. Elements in Quantitative Finance. Cambridge University Press, 2020. doi:10.1017/9781108883658.")\
\].
* ’gerber1’: use the Gerber statistic 1. For more information see: \[[C13](https://riskfolio-lib.readthedocs.io/en/latest/hcportfolio.html#id95 "Sander Gerber, Harry Markowitz, Philip Ernst, Yinsen Miao, Babak Javid, and Paul Sargen. The gerber statistic: a robust co-movement measure for portfolio optimization. SSRN Electronic Journal, 2021. URL: https://doi.org/10.2139/ssrn.3880054, doi:10.2139/ssrn.3880054.")\
\].
* ’gerber2’: use the Gerber statistic 2. For more information see: \[[C13](https://riskfolio-lib.readthedocs.io/en/latest/hcportfolio.html#id95 "Sander Gerber, Harry Markowitz, Philip Ernst, Yinsen Miao, Babak Javid, and Paul Sargen. The gerber statistic: a robust co-movement measure for portfolio optimization. SSRN Electronic Journal, 2021. URL: https://doi.org/10.2139/ssrn.3880054, doi:10.2139/ssrn.3880054.")\
\].
* ’custom\_cov’: use custom covariance matrix.
custom\_mu : DataFrame or None, optional[¶](https://riskfolio-lib.readthedocs.io/en/latest/hcportfolio.html#HCPortfolio.HCPortfolio.optimization.custom_mu "Permalink to this definition")
Custom mean vector when NCO objective is ‘Utility’ or ‘Sharpe’. The default is None.
custom\_cov : DataFrame or None, optional[¶](https://riskfolio-lib.readthedocs.io/en/latest/hcportfolio.html#HCPortfolio.HCPortfolio.optimization.custom_cov "Permalink to this definition")
Custom covariance matrix, used when codependence or covariance parameters have value ‘custom\_cov’. The default is None.
linkage : string, optional[¶](https://riskfolio-lib.readthedocs.io/en/latest/hcportfolio.html#HCPortfolio.HCPortfolio.optimization.linkage "Permalink to this definition")
Linkage method of hierarchical clustering. For more information see [linkage](https://docs.scipy.org/doc/scipy/reference/generated/scipy.cluster.hierarchy.linkage.html)
. The default is ‘single’. Possible values are:
* ’single’.
* ’complete’.
* ’average’.
* ’weighted’.
* ’centroid’.
* ’median’.
* ’ward’.
* ’DBHT’: Direct Bubble Hierarchical Tree.
opt\_k\_method : [str](https://docs.python.org/3.11/library/stdtypes.html#str "(in Python v3.11)")
[¶](https://riskfolio-lib.readthedocs.io/en/latest/hcportfolio.html#HCPortfolio.HCPortfolio.optimization.opt_k_method "Permalink to this definition")
Method used to calculate the optimum number of clusters. The default is ‘twodiff’. Possible values are:
* ’twodiff’: two difference gap statistic.
* ’stdsil’: standarized silhouette score.
k : [int](https://docs.python.org/3.11/library/functions.html#int "(in Python v3.11)")
, optional[¶](https://riskfolio-lib.readthedocs.io/en/latest/hcportfolio.html#HCPortfolio.HCPortfolio.optimization.k "Permalink to this definition")
Number of clusters. This value is took instead of the optimal number of clusters calculated with the two difference gap statistic. The default is None.
max\_k : [int](https://docs.python.org/3.11/library/functions.html#int "(in Python v3.11)")
, optional[¶](https://riskfolio-lib.readthedocs.io/en/latest/hcportfolio.html#HCPortfolio.HCPortfolio.optimization.max_k "Permalink to this definition")
Max number of clusters used by the two difference gap statistic to find the optimal number of clusters. The default is 10.
bins\_info : [int](https://docs.python.org/3.11/library/functions.html#int "(in Python v3.11)")
or [str](https://docs.python.org/3.11/library/stdtypes.html#str "(in Python v3.11)")
[¶](https://riskfolio-lib.readthedocs.io/en/latest/hcportfolio.html#HCPortfolio.HCPortfolio.optimization.bins_info "Permalink to this definition")
Number of bins used to calculate variation of information. The default value is ‘KN’. Possible values are:
* ’KN’: Knuth’s choice method. See more in [knuth\_bin\_width](https://docs.astropy.org/en/stable/api/astropy.stats.knuth_bin_width.html)
.
* ’FD’: Freedman–Diaconis’ choice method. See more in [freedman\_bin\_width](https://docs.astropy.org/en/stable/api/astropy.stats.freedman_bin_width.html)
.
* ’SC’: Scotts’ choice method. See more in [scott\_bin\_width](https://docs.astropy.org/en/stable/api/astropy.stats.scott_bin_width.html)
.
* ’HGR’: Hacine-Gharbi and Ravier’ choice method.
* int: integer value choice by user.
alpha\_tail : [float](https://docs.python.org/3.11/library/functions.html#float "(in Python v3.11)")
, optional[¶](https://riskfolio-lib.readthedocs.io/en/latest/hcportfolio.html#HCPortfolio.HCPortfolio.optimization.alpha_tail "Permalink to this definition")
Significance level for lower tail dependence index. The default is 0.05.
gs\_threshold : [float](https://docs.python.org/3.11/library/functions.html#float "(in Python v3.11)")
, optional[¶](https://riskfolio-lib.readthedocs.io/en/latest/hcportfolio.html#HCPortfolio.HCPortfolio.optimization.gs_threshold "Permalink to this definition")
Gerber statistic threshold. The default is 0.5.
leaf\_order : [bool](https://docs.python.org/3.11/library/functions.html#bool "(in Python v3.11)")
, optional[¶](https://riskfolio-lib.readthedocs.io/en/latest/hcportfolio.html#HCPortfolio.HCPortfolio.optimization.leaf_order "Permalink to this definition")
Indicates if the cluster are ordered so that the distance between successive leaves is minimal. The default is True.
dict\_mu : [dict](https://docs.python.org/3.11/library/stdtypes.html#dict "(in Python v3.11)")
[¶](https://riskfolio-lib.readthedocs.io/en/latest/hcportfolio.html#HCPortfolio.HCPortfolio.optimization.dict_mu "Permalink to this definition")
Other variables related to the mean vector estimation method.
dict\_cov : [dict](https://docs.python.org/3.11/library/stdtypes.html#dict "(in Python v3.11)")
[¶](https://riskfolio-lib.readthedocs.io/en/latest/hcportfolio.html#HCPortfolio.HCPortfolio.optimization.dict_cov "Permalink to this definition")
Other variables related to the covariance estimation method.
Returns:[¶](https://riskfolio-lib.readthedocs.io/en/latest/hcportfolio.html#HCPortfolio.HCPortfolio.optimization-returns "Permalink to this headline")
**w** – The weights of optimal portfolio.
Return type:[¶](https://riskfolio-lib.readthedocs.io/en/latest/hcportfolio.html#HCPortfolio.HCPortfolio.optimization-return-type "Permalink to this headline")
DataFrame
See also
`riskfolio.src.ParamsEstimation.mean_vector`, `riskfolio.src.ParamsEstimation.covar_matrix`
Bibliography[¶](https://riskfolio-lib.readthedocs.io/en/latest/hcportfolio.html#bibliography "Link to this heading")
---------------------------------------------------------------------------------------------------------------------
\[[C1](https://riskfolio-lib.readthedocs.io/en/latest/hcportfolio.html#id2)\
\]
Marcos López de Prado. Building diversified portfolios that outperform out of sample. _The Journal of Portfolio Management_, 42(4):59–69, 2016. URL: [https://jpm.pm-research.com/content/42/4/59](https://jpm.pm-research.com/content/42/4/59)
, [arXiv:https://jpm.pm-research.com/content/42/4/59.full.pdf](https://arxiv.org/abs/https://jpm.pm-research.com/content/42/4/59.full.pdf)
, [doi:10.3905/jpm.2016.42.4.059](https://doi.org/10.3905/jpm.2016.42.4.059)
.
\[C2\] ([1](https://riskfolio-lib.readthedocs.io/en/latest/hcportfolio.html#id3)
,[2](https://riskfolio-lib.readthedocs.io/en/latest/hcportfolio.html#id7)
,[3](https://riskfolio-lib.readthedocs.io/en/latest/hcportfolio.html#id9)
)
Daniel Sjöstrand and Nima Behnejad. Exploration of hierarchical clustering in long-only risk-based portfolio optimization. Master's thesis, Copenhagen Business School, Solbjerg Pl. 3, 2000 Frederiksberg, Denmark, 5 2020. URL: [https://research-api.cbs.dk/ws/portalfiles/portal/62178444/879726\_Master\_Thesis\_Nima\_Daniel\_15736.pdf](https://research-api.cbs.dk/ws/portalfiles/portal/62178444/879726_Master_Thesis_Nima_Daniel_15736.pdf)
.
\[C3\] ([1](https://riskfolio-lib.readthedocs.io/en/latest/hcportfolio.html#id4)
,[2](https://riskfolio-lib.readthedocs.io/en/latest/hcportfolio.html#id10)
,[3](https://riskfolio-lib.readthedocs.io/en/latest/hcportfolio.html#id11)
)
Johann Pfitzinger and Nico Katzke. A constrained hierarchical risk parity algorithm with cluster-based capital allocation. Working Papers 14/2019, Stellenbosch University, Department of Economics, 2019. URL: [https://ideas.repec.org/p/sza/wpaper/wpapers328.html](https://ideas.repec.org/p/sza/wpaper/wpapers328.html)
.
\[[C4](https://riskfolio-lib.readthedocs.io/en/latest/hcportfolio.html#id5)\
\]
Thomas Raffinot. Hierarchical clustering-based asset allocation. _The Journal of Portfolio Management_, 44(2):89–99, December 2017. URL: [https://doi.org/10.3905/jpm.2018.44.2.089](https://doi.org/10.3905/jpm.2018.44.2.089)
, [doi:10.3905/jpm.2018.44.2.089](https://doi.org/10.3905/jpm.2018.44.2.089)
.
\[[C5](https://riskfolio-lib.readthedocs.io/en/latest/hcportfolio.html#id6)\
\]
Thomas Raffinot. The hierarchical equal risk contribution portfolio. 08 2018. [doi:10.2139/ssrn.3237540](https://doi.org/10.2139/ssrn.3237540)
.
\[[C6](https://riskfolio-lib.readthedocs.io/en/latest/hcportfolio.html#id8)\
\]
Marcos Prado. A robust estimator of the efficient frontier. _SSRN Electronic Journal_, 01 2019. [doi:10.2139/ssrn.3469961](https://doi.org/10.2139/ssrn.3469961)
.
\[[C7](https://riskfolio-lib.readthedocs.io/en/latest/hcportfolio.html#id13)\
\]
Attilio Meucci. _Risk and Asset Allocation_. Springer Berlin Heidelberg, 2005. URL: [https://doi.org/10.1007/978-3-540-27904-4](https://doi.org/10.1007/978-3-540-27904-4)
, [doi:10.1007/978-3-540-27904-4](https://doi.org/10.1007/978-3-540-27904-4)
.
\[[C8](https://riskfolio-lib.readthedocs.io/en/latest/hcportfolio.html#id14)\
\]
Yiyong Feng and Daniel P. Palomar. A signal processing perspective of financial engineering. _Foundations and Trends® in Signal Processing_, 9(1-2):1–231, 2016. URL: [https://doi.org/10.1561/2000000072](https://doi.org/10.1561/2000000072)
, [doi:10.1561/2000000072](https://doi.org/10.1561/2000000072)
.
\[[C9](https://riskfolio-lib.readthedocs.io/en/latest/hcportfolio.html#id15)\
\]
Philippe Jorion. Bayes-stein estimation for portfolio analysis. _The Journal of Financial and Quantitative Analysis_, 21(3):279, September 1986. URL: [https://doi.org/10.2307/2331042](https://doi.org/10.2307/2331042)
, [doi:10.2307/2331042](https://doi.org/10.2307/2331042)
.
\[[C10](https://riskfolio-lib.readthedocs.io/en/latest/hcportfolio.html#id16)\
\]
Taras Bodnar, Ostap Okhrin, and Nestor Parolya. Optimal shrinkage estimator for high-dimensional mean vector. _Journal of Multivariate Analysis_, 170:63–79, 03 2019. URL: [https://doi.org/10.1016\\%2Fj.jmva.2018.07.004](https://doi.org/10.1016/%2Fj.jmva.2018.07.004)
, [doi:10.1016/j.jmva.2018.07.004](https://doi.org/10.1016/j.jmva.2018.07.004)
.
\[[C11](https://riskfolio-lib.readthedocs.io/en/latest/hcportfolio.html#id19)\
\]
Wolfram Barfuss, Guido Previde Massara, T. Di Matteo, and Tomaso Aste. Parsimonious modeling with information filtering networks. _Physical Review E_, 12 2016. URL: [http://dx.doi.org/10.1103/PhysRevE.94.062306](http://dx.doi.org/10.1103/PhysRevE.94.062306)
, [doi:10.1103/physreve.94.062306](https://doi.org/10.1103/physreve.94.062306)
.
\[C12\] ([1](https://riskfolio-lib.readthedocs.io/en/latest/hcportfolio.html#id20)
,[2](https://riskfolio-lib.readthedocs.io/en/latest/hcportfolio.html#id21)
,[3](https://riskfolio-lib.readthedocs.io/en/latest/hcportfolio.html#id22)
)
Marcos M. López de Prado. _Machine Learning for Asset Managers_. Elements in Quantitative Finance. Cambridge University Press, 2020. [doi:10.1017/9781108883658](https://doi.org/10.1017/9781108883658)
.
\[C13\] ([1](https://riskfolio-lib.readthedocs.io/en/latest/hcportfolio.html#id23)
,[2](https://riskfolio-lib.readthedocs.io/en/latest/hcportfolio.html#id24)
)
Sander Gerber, Harry Markowitz, Philip Ernst, Yinsen Miao, Babak Javid, and Paul Sargen. The gerber statistic: a robust co-movement measure for portfolio optimization. _SSRN Electronic Journal_, 2021. URL: [https://doi.org/10.2139/ssrn.3880054](https://doi.org/10.2139/ssrn.3880054)
, [doi:10.2139/ssrn.3880054](https://doi.org/10.2139/ssrn.3880054)
.
[**On-Demand H100 SXM GPUs for $2.99/hr/GPU with Lambda** 640 GB of vRAM in one 8x instance **Launch now**](https://server.ethicalads.io/proxy/click/9837/019d0edd-8fac-7681-b3ae-6e1cc74dab4a/)
[Ads by EthicalAds](https://www.ethicalads.io/advertisers/topics/data-science/?ref=ea-text)
---
# Portfolio Optimization - Riskfolio-Lib 7.2
[Skip to content](https://riskfolio-lib.readthedocs.io/en/latest/portfolio.html#some-theory)
Portfolio Optimization[¶](https://riskfolio-lib.readthedocs.io/en/latest/portfolio.html#portfolio-optimization "Link to this heading")
=======================================================================================================================================
[Buy Advanced Portfolio Optimization Book on Springer](https://www.kqzyfj.com/click-101359873-15150084?url=https%3A%2F%2Flink.springer.com%2Fbook%2F9783031843037)
[Enroll in the Portfolio Optimization with Python Course](https://www.paypal.com/ncp/payment/GN55W4UQ7VAMN)
[](https://github.com/sponsors/dcajasn)
[](https://ko-fi.com/B0B833SXD)
Some Theory[¶](https://riskfolio-lib.readthedocs.io/en/latest/portfolio.html#some-theory "Link to this heading")
-----------------------------------------------------------------------------------------------------------------
### Mean Risk Portfolio Optimization[¶](https://riskfolio-lib.readthedocs.io/en/latest/portfolio.html#mean-risk-portfolio-optimization "Link to this heading")
Riskfolio-Lib allows to calculate optimum portfolios that results from optimize one of the following 4 objective functions:
* **Maximum Return Portfolio:**
maxwR(w)s.t.Aw≤bARCRC(w)≤bRCTr(ΣW)(w)ϱi(w)≤ci∀i∈\[1,24\]R(w)≥μ―
* **Minimum Risk Portfolio:**
minwϱk(w)s.t.Aw≤bARCRC(w)≤bRCTr(ΣW)(w)ϱi(w)≤ci∀i∈\[1,24\]R(w)≥μ―
* **Maximum Risk Adjusted Return Ratio Portfolio:**
maxwR(w)−rfϱk(w)s.t.Aw≤bARCRC(w)≤bRCTr(ΣW)(w)ϱi(w)≤ci∀i∈\[1,24\]R(w)≥μ―
* **Maximum Utility Portfolio:**
maxwR(w)−λϱk(w)s.t.Aw≤bARCRC(w)≤bRCTr(ΣW)(w)ϱi(w)≤ci∀i∈\[1,24\]R(w)≥μ―
where:
R(w) is the return function, possible values are:
> * μw: arithmetic return.
>
> * μw−0.5wτΣw: approximate logarithmic return \[[A1](https://riskfolio-lib.readthedocs.io/en/latest/portfolio.html#id221 "Edward Thorp. The kelly criterion in blackjack, sports betting, and the stock market. Handbook of Asset and Liability Management, 1:, 12 2008. doi:10.1016/B978-044453248-0.50015-0.")\
> \].
>
> * 1T∑i\=1Tln(1+riw): exact logarithmic return \[[A2](https://riskfolio-lib.readthedocs.io/en/latest/portfolio.html#id222 "Dany Cajas. Kelly portfolio optimization: a disciplined convex programming framework. SSRN Electronic Journal, 2021. URL: https://doi.org/10.2139/ssrn.3833617, doi:10.2139/ssrn.3833617.")\
> \].
>
w: is the vector of weights of the optimum portfolio.
W: is the symmetric matrix variable that approximates ww′.
μ: is the vector of expected returns.
Σ: is the covariance matrix of assets returns.
r: is the matrix of assets returns.
ci: is the upper bound of risk measure i.
Aw≤b: is a set of linear constraints.
ARCRC(w)≤bRCTr(ΣW)(w) is a set of linear risk contribution constraints for variance based on \[[A3](https://riskfolio-lib.readthedocs.io/en/latest/portfolio.html#id265 "Dany Cajas. A semidefinite programming approach to risk parity portfolio optimization. SSRN Electronic Journal, 2025. URL: http://dx.doi.org/10.2139/ssrn.5097869, doi:10.2139/ssrn.5097869.")\
\].
ϱi(w): are 24 available risk measures. The available risk measures are:
* Standard Deviation \[[A4](https://riskfolio-lib.readthedocs.io/en/latest/portfolio.html#id175 "Harry Markowitz. Portfolio selection. The Journal of Finance, 7(1):77–91, 1952. URL: http://www.jstor.org/stable/2975974.")\
\].
* Square Root Kurtosis \[[A5](https://riskfolio-lib.readthedocs.io/en/latest/portfolio.html#id243 "Dany Cajas. Convex optimization of portfolio kurtosis. SSRN Electronic Journal, 2022. URL: https://doi.org/10.2139/ssrn.4202967, doi:10.2139/ssrn.4202967.")\
\], \[[A6](https://riskfolio-lib.readthedocs.io/en/latest/portfolio.html#id247 "Dany Cajas. Approximation of portfolio kurtosis through sum of squared quadratic forms. SSRN Electronic Journal, 6 2023. doi:10.2139/ssrn.4472793.")\
\].
* Mean Absolute Deviation \[[A7](https://riskfolio-lib.readthedocs.io/en/latest/portfolio.html#id193 "Hiroshi Konno and Hiroaki Yamazaki. Mean-absolute deviation portfolio optimization model and its applications to tokyo stock market. Management Science, 37(5):519-531, 1991. URL: https://EconPapers.repec.org/RePEc:inm:ormnsc:v:37:y:1991:i:5:p:519-531.")\
\].
* Gini Mean Difference \[[A8](https://riskfolio-lib.readthedocs.io/en/latest/portfolio.html#id240 "Shlomo Yitzhaki. Stochastic dominance, mean variance, and gini's mean difference. American Economic Review, 72:178-85, 01 1982.")\
\], \[[A9](https://riskfolio-lib.readthedocs.io/en/latest/portfolio.html#id239 "Dany Cajas. Owa portfolio optimization: a disciplined convex programming framework. SSRN Electronic Journal, 2021. URL: https://doi.org/10.2139/ssrn.3988927, doi:10.2139/ssrn.3988927.")\
\], \[[A10](https://riskfolio-lib.readthedocs.io/en/latest/portfolio.html#id264 "Dany Cajas. Efficient gini mean difference and tail gini portfolio optimization based on p-norms. SSRN Electronic Journal, 2024. URL: http://dx.doi.org/10.2139/ssrn.4711326, doi:10.2139/ssrn.4711326.")\
\].
* Conditional Value at Risk Range \[[A9](https://riskfolio-lib.readthedocs.io/en/latest/portfolio.html#id239 "Dany Cajas. Owa portfolio optimization: a disciplined convex programming framework. SSRN Electronic Journal, 2021. URL: https://doi.org/10.2139/ssrn.3988927, doi:10.2139/ssrn.3988927.")\
\], \[[A11](https://riskfolio-lib.readthedocs.io/en/latest/portfolio.html#id263 "Dany Cajas. Advanced portfolio optimization. Springer International Publishing, Cham, Switzerland, April 2025.")\
\].
* Tail Gini Range \[[A9](https://riskfolio-lib.readthedocs.io/en/latest/portfolio.html#id239 "Dany Cajas. Owa portfolio optimization: a disciplined convex programming framework. SSRN Electronic Journal, 2021. URL: https://doi.org/10.2139/ssrn.3988927, doi:10.2139/ssrn.3988927.")\
\], \[[A11](https://riskfolio-lib.readthedocs.io/en/latest/portfolio.html#id263 "Dany Cajas. Advanced portfolio optimization. Springer International Publishing, Cham, Switzerland, April 2025.")\
\].
* Entropic Value at Risk Range \[[A11](https://riskfolio-lib.readthedocs.io/en/latest/portfolio.html#id263 "Dany Cajas. Advanced portfolio optimization. Springer International Publishing, Cham, Switzerland, April 2025.")\
\].
* Relativistic Value at Risk Range.:cite:a-Cajas2025book.
* Range \[[A9](https://riskfolio-lib.readthedocs.io/en/latest/portfolio.html#id239 "Dany Cajas. Owa portfolio optimization: a disciplined convex programming framework. SSRN Electronic Journal, 2021. URL: https://doi.org/10.2139/ssrn.3988927, doi:10.2139/ssrn.3988927.")\
\].
* Semi Standard Deviation \[[A12](https://riskfolio-lib.readthedocs.io/en/latest/portfolio.html#id199 "Renata Mansini, W. Ogryczak, and M.Grazia Speranza. Twenty years of linear programming based portfolio optimization. European Journal of Operational Research, 234:518-535, 04 2014. doi:10.1016/j.ejor.2013.08.035.")\
\].
* Square Root Semi Kurtosis \[[A5](https://riskfolio-lib.readthedocs.io/en/latest/portfolio.html#id243 "Dany Cajas. Convex optimization of portfolio kurtosis. SSRN Electronic Journal, 2022. URL: https://doi.org/10.2139/ssrn.4202967, doi:10.2139/ssrn.4202967.")\
\], \[[A6](https://riskfolio-lib.readthedocs.io/en/latest/portfolio.html#id247 "Dany Cajas. Approximation of portfolio kurtosis through sum of squared quadratic forms. SSRN Electronic Journal, 6 2023. doi:10.2139/ssrn.4472793.")\
\].
* First Lower Partial Moment (Omega Ratio) \[[A13](https://riskfolio-lib.readthedocs.io/en/latest/portfolio.html#id197 "Renata Mansini, W. Ogryczak, and M.Grazia Speranza. Linear Models for Portfolio Optimization, pages 19-45. Springer, 01 2015. doi:10.1007/978-3-319-18482-1_2.")\
\].
* Second Lower Partial Moment (Sortino Ratio) \[[A13](https://riskfolio-lib.readthedocs.io/en/latest/portfolio.html#id197 "Renata Mansini, W. Ogryczak, and M.Grazia Speranza. Linear Models for Portfolio Optimization, pages 19-45. Springer, 01 2015. doi:10.1007/978-3-319-18482-1_2.")\
\].
* Conditional Value at Risk \[[A14](https://riskfolio-lib.readthedocs.io/en/latest/portfolio.html#id194 "R. Tyrrell Rockafellar and Stanislav Uryasev. Optimization of conditional value-at-risk. Journal of Risk, 2:21–41, 2000.")\
\].
* Tail Gini \[[A15](https://riskfolio-lib.readthedocs.io/en/latest/portfolio.html#id241 "W. Ogryczak and Andrzej Ruszczynskia. Dual stochastic dominance and quantile risk measures. International Transactions in Operational Research, 9:661-680, 09 2002. doi:10.1111/1475-3995.00380.")\
\], \[[A9](https://riskfolio-lib.readthedocs.io/en/latest/portfolio.html#id239 "Dany Cajas. Owa portfolio optimization: a disciplined convex programming framework. SSRN Electronic Journal, 2021. URL: https://doi.org/10.2139/ssrn.3988927, doi:10.2139/ssrn.3988927.")\
\], \[[A10](https://riskfolio-lib.readthedocs.io/en/latest/portfolio.html#id264 "Dany Cajas. Efficient gini mean difference and tail gini portfolio optimization based on p-norms. SSRN Electronic Journal, 2024. URL: http://dx.doi.org/10.2139/ssrn.4711326, doi:10.2139/ssrn.4711326.")\
\].
* Entropic Value at Risk \[[A16](https://riskfolio-lib.readthedocs.io/en/latest/portfolio.html#id217 "Amir Ahmadi Javid. Entropic value-at-risk: a new coherent risk measure. Journal of Optimization Theory and Applications, 12 2012. doi:10.1007/s10957-011-9968-2.")\
\], \[[A17](https://riskfolio-lib.readthedocs.io/en/latest/portfolio.html#id216 "Amir Ahmadi Javid and Malihe Fallah. Portfolio optimization with entropic value-at-risk. European Journal of Operational Research, 08 2017. doi:10.1016/j.ejor.2019.02.007.")\
\], \[[A18](https://riskfolio-lib.readthedocs.io/en/latest/portfolio.html#id219 "Dany Cajas. Entropic portfolio optimization: a disciplined convex programming framework. SSRN Electronic Journal, 2021. URL: https://doi.org/10.2139/ssrn.3792520, doi:10.2139/ssrn.3792520.")\
\].
* Relativistic Value at Risk \[[A19](https://riskfolio-lib.readthedocs.io/en/latest/portfolio.html#id245 "Dany Cajas. Portfolio optimization of relativistic value at risk. SSRN Electronic Journal, 2023. URL: https://doi.org/10.2139/ssrn.4378498, doi:10.2139/ssrn.4378498.")\
\].
* Worst Realization (Minimax) \[[A20](https://riskfolio-lib.readthedocs.io/en/latest/portfolio.html#id198 "Renata Mansini, W. Ogryczak, and M.Grazia Speranza. On lp solvable models for portfolio selection. Informatica, 14:37-62, 01 2003.")\
\].
* Average Drawdown of uncompounded cumulative returns \[[A21](https://riskfolio-lib.readthedocs.io/en/latest/portfolio.html#id195 "A. Chekhlov, S. Uryasev, and M. Zabarankin. Portfolio optimization with drawdown constraints. In Panos M Pardalos, Athanasios Migdalas, and George Baourakis, editors, Supply Chain And Finance, volume of World Scientific Book Chapters, chapter 13, pages 209-228. World Scientific Publishing Co. Pte. Ltd., edition, November 2004. URL: https://ideas.repec.org/h/wsi/wschap/9789812562586_0013.html.")\
\].
* Ulcer Index of uncompounded cumulative returns \[[A22](https://riskfolio-lib.readthedocs.io/en/latest/portfolio.html#id215 "Peter Martin. The investor's guide to fidelity funds. Wiley, New York, 1989. ISBN 978-0471622581.")\
\].
* Conditional Drawdown at Risk of uncompounded cumulative returns \[[A21](https://riskfolio-lib.readthedocs.io/en/latest/portfolio.html#id195 "A. Chekhlov, S. Uryasev, and M. Zabarankin. Portfolio optimization with drawdown constraints. In Panos M Pardalos, Athanasios Migdalas, and George Baourakis, editors, Supply Chain And Finance, volume of World Scientific Book Chapters, chapter 13, pages 209-228. World Scientific Publishing Co. Pte. Ltd., edition, November 2004. URL: https://ideas.repec.org/h/wsi/wschap/9789812562586_0013.html.")\
\].
* Entropic Drawdown at Risk of uncompounded cumulative returns \[[A18](https://riskfolio-lib.readthedocs.io/en/latest/portfolio.html#id219 "Dany Cajas. Entropic portfolio optimization: a disciplined convex programming framework. SSRN Electronic Journal, 2021. URL: https://doi.org/10.2139/ssrn.3792520, doi:10.2139/ssrn.3792520.")\
\].
* Relativistic Drawdown at Risk of uncompounded cumulative returns \[[A19](https://riskfolio-lib.readthedocs.io/en/latest/portfolio.html#id245 "Dany Cajas. Portfolio optimization of relativistic value at risk. SSRN Electronic Journal, 2023. URL: https://doi.org/10.2139/ssrn.4378498, doi:10.2139/ssrn.4378498.")\
\].
* Maximum Drawdown of uncompounded cumulative returns (Calmar Ratio) \[[A21](https://riskfolio-lib.readthedocs.io/en/latest/portfolio.html#id195 "A. Chekhlov, S. Uryasev, and M. Zabarankin. Portfolio optimization with drawdown constraints. In Panos M Pardalos, Athanasios Migdalas, and George Baourakis, editors, Supply Chain And Finance, volume of World Scientific Book Chapters, chapter 13, pages 209-228. World Scientific Publishing Co. Pte. Ltd., edition, November 2004. URL: https://ideas.repec.org/h/wsi/wschap/9789812562586_0013.html.")\
\].
ci: are maximum values on each risk measure.
rf: is the risk free rate. When the risk measure is the first or second lower partial moment, rf is the minimum acceptable return MAR.
λ: is the risk aversion coefficient of the investor.
### Risk Parity Portfolio Optimization[¶](https://riskfolio-lib.readthedocs.io/en/latest/portfolio.html#risk-parity-portfolio-optimization "Link to this heading")
Riskfolio-Lib allows to calculate optimum portfolios that results from optimize the general vanilla risk parity model \[[A23](https://riskfolio-lib.readthedocs.io/en/latest/portfolio.html#id210 "Benjamin Bruder and Thierry Roncalli. Managing risk exposures using the risk budgeting approach. SSRN Electronic Journal, pages, 01 2012. doi:10.2139/ssrn.2009778.")\
\] \[[A24](https://riskfolio-lib.readthedocs.io/en/latest/portfolio.html#id235 "Jean-Charles Richard and Thierry Roncalli. Constrained Risk Budgeting Portfolios: Theory, Algorithms, Applications & Puzzles. Papers 1902.05710, arXiv.org, February 2019. URL: https://ideas.repec.org/p/arx/papers/1902.05710.html.")\
\]:
minwϱ(w)s.t.b′log(w)≥cμw≥μ―Aw≤bw≥0
where:
w: is the vector of weights of the optimum portfolio.
μ: is the vector of expected returns.
b: is a vector of risk contribution targets.
Aw≤b: is a set of linear constraints.
c: is an arbitrary constant.
ϱ(w): are 20 available risk measures. The available risk measures are:
* Standard Deviation \[[A4](https://riskfolio-lib.readthedocs.io/en/latest/portfolio.html#id175 "Harry Markowitz. Portfolio selection. The Journal of Finance, 7(1):77–91, 1952. URL: http://www.jstor.org/stable/2975974.")\
\].
* Square Root Kurtosis \[[A5](https://riskfolio-lib.readthedocs.io/en/latest/portfolio.html#id243 "Dany Cajas. Convex optimization of portfolio kurtosis. SSRN Electronic Journal, 2022. URL: https://doi.org/10.2139/ssrn.4202967, doi:10.2139/ssrn.4202967.")\
\], \[[A6](https://riskfolio-lib.readthedocs.io/en/latest/portfolio.html#id247 "Dany Cajas. Approximation of portfolio kurtosis through sum of squared quadratic forms. SSRN Electronic Journal, 6 2023. doi:10.2139/ssrn.4472793.")\
\].
* Mean Absolute Deviation \[[A7](https://riskfolio-lib.readthedocs.io/en/latest/portfolio.html#id193 "Hiroshi Konno and Hiroaki Yamazaki. Mean-absolute deviation portfolio optimization model and its applications to tokyo stock market. Management Science, 37(5):519-531, 1991. URL: https://EconPapers.repec.org/RePEc:inm:ormnsc:v:37:y:1991:i:5:p:519-531.")\
\].
* Gini Mean Difference \[[A8](https://riskfolio-lib.readthedocs.io/en/latest/portfolio.html#id240 "Shlomo Yitzhaki. Stochastic dominance, mean variance, and gini's mean difference. American Economic Review, 72:178-85, 01 1982.")\
\], \[[A9](https://riskfolio-lib.readthedocs.io/en/latest/portfolio.html#id239 "Dany Cajas. Owa portfolio optimization: a disciplined convex programming framework. SSRN Electronic Journal, 2021. URL: https://doi.org/10.2139/ssrn.3988927, doi:10.2139/ssrn.3988927.")\
\], \[[A10](https://riskfolio-lib.readthedocs.io/en/latest/portfolio.html#id264 "Dany Cajas. Efficient gini mean difference and tail gini portfolio optimization based on p-norms. SSRN Electronic Journal, 2024. URL: http://dx.doi.org/10.2139/ssrn.4711326, doi:10.2139/ssrn.4711326.")\
\].
* Conditional Value at Risk Range \[[A9](https://riskfolio-lib.readthedocs.io/en/latest/portfolio.html#id239 "Dany Cajas. Owa portfolio optimization: a disciplined convex programming framework. SSRN Electronic Journal, 2021. URL: https://doi.org/10.2139/ssrn.3988927, doi:10.2139/ssrn.3988927.")\
\], \[[A11](https://riskfolio-lib.readthedocs.io/en/latest/portfolio.html#id263 "Dany Cajas. Advanced portfolio optimization. Springer International Publishing, Cham, Switzerland, April 2025.")\
\].
* Tail Gini Range \[[A9](https://riskfolio-lib.readthedocs.io/en/latest/portfolio.html#id239 "Dany Cajas. Owa portfolio optimization: a disciplined convex programming framework. SSRN Electronic Journal, 2021. URL: https://doi.org/10.2139/ssrn.3988927, doi:10.2139/ssrn.3988927.")\
\], \[[A11](https://riskfolio-lib.readthedocs.io/en/latest/portfolio.html#id263 "Dany Cajas. Advanced portfolio optimization. Springer International Publishing, Cham, Switzerland, April 2025.")\
\].
* Entropic Value at Risk Range \[[A11](https://riskfolio-lib.readthedocs.io/en/latest/portfolio.html#id263 "Dany Cajas. Advanced portfolio optimization. Springer International Publishing, Cham, Switzerland, April 2025.")\
\].
* Relativistic Value at Risk Range \[[A11](https://riskfolio-lib.readthedocs.io/en/latest/portfolio.html#id263 "Dany Cajas. Advanced portfolio optimization. Springer International Publishing, Cham, Switzerland, April 2025.")\
\].
* Semi Standard Deviation \[[A12](https://riskfolio-lib.readthedocs.io/en/latest/portfolio.html#id199 "Renata Mansini, W. Ogryczak, and M.Grazia Speranza. Twenty years of linear programming based portfolio optimization. European Journal of Operational Research, 234:518-535, 04 2014. doi:10.1016/j.ejor.2013.08.035.")\
\].
* Square Root Semi Kurtosis \[[A5](https://riskfolio-lib.readthedocs.io/en/latest/portfolio.html#id243 "Dany Cajas. Convex optimization of portfolio kurtosis. SSRN Electronic Journal, 2022. URL: https://doi.org/10.2139/ssrn.4202967, doi:10.2139/ssrn.4202967.")\
\], \[[A6](https://riskfolio-lib.readthedocs.io/en/latest/portfolio.html#id247 "Dany Cajas. Approximation of portfolio kurtosis through sum of squared quadratic forms. SSRN Electronic Journal, 6 2023. doi:10.2139/ssrn.4472793.")\
\].
* First Lower Partial Moment (Omega Ratio) \[[A13](https://riskfolio-lib.readthedocs.io/en/latest/portfolio.html#id197 "Renata Mansini, W. Ogryczak, and M.Grazia Speranza. Linear Models for Portfolio Optimization, pages 19-45. Springer, 01 2015. doi:10.1007/978-3-319-18482-1_2.")\
\].
* Second Lower Partial Moment (Sortino Ratio) \[[A13](https://riskfolio-lib.readthedocs.io/en/latest/portfolio.html#id197 "Renata Mansini, W. Ogryczak, and M.Grazia Speranza. Linear Models for Portfolio Optimization, pages 19-45. Springer, 01 2015. doi:10.1007/978-3-319-18482-1_2.")\
\].
* Conditional Value at Risk \[[A14](https://riskfolio-lib.readthedocs.io/en/latest/portfolio.html#id194 "R. Tyrrell Rockafellar and Stanislav Uryasev. Optimization of conditional value-at-risk. Journal of Risk, 2:21–41, 2000.")\
\].
* Tail Gini \[[A15](https://riskfolio-lib.readthedocs.io/en/latest/portfolio.html#id241 "W. Ogryczak and Andrzej Ruszczynskia. Dual stochastic dominance and quantile risk measures. International Transactions in Operational Research, 9:661-680, 09 2002. doi:10.1111/1475-3995.00380.")\
\], \[[A9](https://riskfolio-lib.readthedocs.io/en/latest/portfolio.html#id239 "Dany Cajas. Owa portfolio optimization: a disciplined convex programming framework. SSRN Electronic Journal, 2021. URL: https://doi.org/10.2139/ssrn.3988927, doi:10.2139/ssrn.3988927.")\
\], \[[A10](https://riskfolio-lib.readthedocs.io/en/latest/portfolio.html#id264 "Dany Cajas. Efficient gini mean difference and tail gini portfolio optimization based on p-norms. SSRN Electronic Journal, 2024. URL: http://dx.doi.org/10.2139/ssrn.4711326, doi:10.2139/ssrn.4711326.")\
\].
* Entropic Value at Risk \[[A16](https://riskfolio-lib.readthedocs.io/en/latest/portfolio.html#id217 "Amir Ahmadi Javid. Entropic value-at-risk: a new coherent risk measure. Journal of Optimization Theory and Applications, 12 2012. doi:10.1007/s10957-011-9968-2.")\
\], \[[A17](https://riskfolio-lib.readthedocs.io/en/latest/portfolio.html#id216 "Amir Ahmadi Javid and Malihe Fallah. Portfolio optimization with entropic value-at-risk. European Journal of Operational Research, 08 2017. doi:10.1016/j.ejor.2019.02.007.")\
\], \[[A18](https://riskfolio-lib.readthedocs.io/en/latest/portfolio.html#id219 "Dany Cajas. Entropic portfolio optimization: a disciplined convex programming framework. SSRN Electronic Journal, 2021. URL: https://doi.org/10.2139/ssrn.3792520, doi:10.2139/ssrn.3792520.")\
\].
* Relativistic Value at Risk \[[A19](https://riskfolio-lib.readthedocs.io/en/latest/portfolio.html#id245 "Dany Cajas. Portfolio optimization of relativistic value at risk. SSRN Electronic Journal, 2023. URL: https://doi.org/10.2139/ssrn.4378498, doi:10.2139/ssrn.4378498.")\
\].
* Ulcer Index of uncompounded cumulative returns \[[A22](https://riskfolio-lib.readthedocs.io/en/latest/portfolio.html#id215 "Peter Martin. The investor's guide to fidelity funds. Wiley, New York, 1989. ISBN 978-0471622581.")\
\].
* Conditional Drawdown at Risk of uncompounded cumulative returns \[[A21](https://riskfolio-lib.readthedocs.io/en/latest/portfolio.html#id195 "A. Chekhlov, S. Uryasev, and M. Zabarankin. Portfolio optimization with drawdown constraints. In Panos M Pardalos, Athanasios Migdalas, and George Baourakis, editors, Supply Chain And Finance, volume of World Scientific Book Chapters, chapter 13, pages 209-228. World Scientific Publishing Co. Pte. Ltd., edition, November 2004. URL: https://ideas.repec.org/h/wsi/wschap/9789812562586_0013.html.")\
\].
* Entropic Drawdown at Risk of uncompounded cumulative returns \[[A18](https://riskfolio-lib.readthedocs.io/en/latest/portfolio.html#id219 "Dany Cajas. Entropic portfolio optimization: a disciplined convex programming framework. SSRN Electronic Journal, 2021. URL: https://doi.org/10.2139/ssrn.3792520, doi:10.2139/ssrn.3792520.")\
\].
* Relativistic Drawdown at Risk of uncompounded cumulative returns \[[A19](https://riskfolio-lib.readthedocs.io/en/latest/portfolio.html#id245 "Dany Cajas. Portfolio optimization of relativistic value at risk. SSRN Electronic Journal, 2023. URL: https://doi.org/10.2139/ssrn.4378498, doi:10.2139/ssrn.4378498.")\
\].
c: is an arbitrary constant.
### Relaxed Risk Parity Portfolio Optimization[¶](https://riskfolio-lib.readthedocs.io/en/latest/portfolio.html#relaxed-risk-parity-portfolio-optimization "Link to this heading")
Riskfolio-Lib allows to calculate optimum portfolios that results from optimize the relaxed risk parity model \[[A25](https://riskfolio-lib.readthedocs.io/en/latest/portfolio.html#id234 "Vaughn Gambeta and Roy Kwon. Risk return trade-off in relaxed risk parity portfolio optimization. Journal of Risk and Financial Management, 2020. URL: https://www.mdpi.com/1911-8074/13/10/237, doi:10.3390/jrfm13100237.")\
\]:
minwψ−γs.t.ζ\=Σww′Σw≤(ψ2−ρ2)wiζi≥γ2bi∀i\=1,…,Nλw′Θw≤ρ2μw≥μ―Aw≤b∑i\=1Nwi\=1ψ,γ,ρ,w≥0
where:
w: is the vector of weights of the optimum portfolio.
μ: is the vector of expected returns.
Σ: is the covariance matrix of assets returns.
ψ: is the average risk of the portfolio.
γ: is the lower bound of each asset risk contribution.
b: is the vector of risk contribution targets.
ζi: is the marginal risk of asset i.
ρ: is a regularization variable.
λ: is a penalty parameter of ρ.
Θ\=diag(Σ)
Aw≤b: is a set of linear constraints.
### Worst Case Mean Variance Portfolio Optimization[¶](https://riskfolio-lib.readthedocs.io/en/latest/portfolio.html#worst-case-mean-variance-portfolio-optimization "Link to this heading")
Riskfolio-Lib allows to calculate worst case mean variance optimum portfolios \[[A26](https://riskfolio-lib.readthedocs.io/en/latest/portfolio.html#id212 "Miguel Sousa Lobo and Stephen Boyd. The worst-case risk of a portfolio. 10 2000.")\
\] \[[A27](https://riskfolio-lib.readthedocs.io/en/latest/portfolio.html#id211 "Frank Fabozzi. Robust portfolio optimization and management. John Wiley, Hoboken, N.J, 2007. ISBN 978-0-471-92122-6.")\
\] \[[A28](https://riskfolio-lib.readthedocs.io/en/latest/portfolio.html#id213 "R.H. Tütüncü and M. Koenig. Robust asset allocation. Annals of Operations Research, 132:157-187, 01 2004. doi:10.1023/B:ANOR.0000045281.41041.ed.")\
\] \[[A29](https://riskfolio-lib.readthedocs.io/en/latest/portfolio.html#id214 "Daniel Palomar. Robust optimization with applications. URL: https://palomar.home.ece.ust.hk/ELEC5470_lectures/slides_robust_optim.pdf.")\
\] that results from optimize one of the following 4 objective functions:
* **Worst Case Maximum Return Portfolio:**
maxwminμ∈Uμμws.t.Aw≤b
* **Worst Case Minimum Risk Portfolio:**
minwmaxΣ∈UΣw′Σws.t.Aw≤b
* **Worst Case Maximum Risk Adjusted Return Ratio Portfolio:**
maxwminμ∈Uμμw−rfmaxΣ∈UΣw′Σws.t.Aw≤b
* **Worst Case Maximum Utility Portfolio:**
maxwminμ∈Uμμw−maxΣ∈UΣλw′Σws.t.Aw≤b
where:
w are the weights of the portfolio.
μ: is the vector of expected returns.
Σ is the covariance matrix.
Uμ is the uncertainty set of the mean vector. The uncertainty sets can be:
Uμbox\={μ||μ−μ^|≤δ}Uμellip\={μ|(μ−μ^)Σμ−1(μ−μ^)′≤kμ2}
UΣ is the uncertainty set of the covariance matrix. The uncertainty sets can be:
UΣbox\={Σ|Σlower≤Σ≤Σupper,Σ⪰0}UΣellip\={Σ|(vec(Σ)−vec(Σ^))ΣΣ−1(vec(Σ)−vec(Σ^))′≤kΣ2,Σ⪰0}
Aw≤b: is a set of linear constraints.
rf: is the risk free rate.
λ: is the risk aversion coefficient of the investor.
### Mean Variance Portfolio Optimization with Factor Risk Contribution Constraints[¶](https://riskfolio-lib.readthedocs.io/en/latest/portfolio.html#mean-variance-portfolio-optimization-with-factor-risk-contribution-constraints "Link to this heading")
Riskfolio-Lib allows to calculate optimum portfolios that results from optimize one of the following 4 objective functions:
* **Maximum Return Portfolio:**
maxwR(w)s.t.\[WFWFwF′1\]⪰0w\=(B′)+WFAw≤bAFRCdiag(Σ¯WF)≤bFRCTr(Σ¯WF)Tr(Σ¯WF)≤cR(w)≥μ―WF∈Sm
* **Minimum Risk Portfolio:**
minwTr(Σ¯WF)s.t.\[WFwFwF′1\]⪰0w\=(B′)+wFAw≤bAFRCdiag(Σ¯WF)≤bFRCTr(Σ¯WF)Tr(Σ¯WF)≤cR(w)≥μ―WF∈Sm
* **Maximum Risk Adjusted Return Ratio Portfolio:**
maxwR(w)−rfTr(Σ¯WF)s.t.\[WFwFwF′1\]⪰0w\=(B′)+wFAw≤bAFRCdiag(Σ¯WF)≤bFRCTr(Σ¯WF)Tr(Σ¯WF)≤cR(w)≥μ―WF∈Sm
* **Maximum Utility Portfolio:**
maxwR(w)−λTr(Σ¯WF)s.t.\[WFwFwF′1\]⪰0w\=(B′)+wFAw≤bAFRCdiag(Σ¯WF)≤bFRCTr(Σ¯WF)Tr(Σ¯WF)≤cR(w)≥μ―WF∈Sm
where:
R(w) is the return function, possible values are:
> * μw: arithmetic return.
>
> * μw−0.5wτΣw: approximate logarithmic return \[[A1](https://riskfolio-lib.readthedocs.io/en/latest/portfolio.html#id221 "Edward Thorp. The kelly criterion in blackjack, sports betting, and the stock market. Handbook of Asset and Liability Management, 1:, 12 2008. doi:10.1016/B978-044453248-0.50015-0.")\
> \].
>
> * 1T∑i\=1Tln(1+riw): exact logarithmic return \[[A2](https://riskfolio-lib.readthedocs.io/en/latest/portfolio.html#id222 "Dany Cajas. Kelly portfolio optimization: a disciplined convex programming framework. SSRN Electronic Journal, 2021. URL: https://doi.org/10.2139/ssrn.3833617, doi:10.2139/ssrn.3833617.")\
> \].
>
wf are the weights of the risk factors.
Wf: is the symmetric matrix variable that approximates wfwf′.
B is the loadings matrix.
μ: is the vector of expected returns.
Σ: is the covariance matrix of assets returns.
r: is the matrix of assets returns.
c: is the upper bound of risk measure.
Σ¯\=((B′)+)′Σ(B′)+.
Aw≤b: is a set of linear constraints.
AFRCdiag(Σ¯WF)≤bFRCTr(Σ¯WF) is a set of linear factor risk contribution constraints for variance based on \[[A3](https://riskfolio-lib.readthedocs.io/en/latest/portfolio.html#id265 "Dany Cajas. A semidefinite programming approach to risk parity portfolio optimization. SSRN Electronic Journal, 2025. URL: http://dx.doi.org/10.2139/ssrn.5097869, doi:10.2139/ssrn.5097869.")\
\].
### Ordered Weighted Averaging (OWA) Portfolio[¶](https://riskfolio-lib.readthedocs.io/en/latest/portfolio.html#ordered-weighted-averaging-owa-portfolio "Link to this heading")
Riskfolio-Lib allows to calculate the OWA portfolio optimization model \[[A9](https://riskfolio-lib.readthedocs.io/en/latest/portfolio.html#id239 "Dany Cajas. Owa portfolio optimization: a disciplined convex programming framework. SSRN Electronic Journal, 2021. URL: https://doi.org/10.2139/ssrn.3988927, doi:10.2139/ssrn.3988927.")\
\]. We can use this function to calculate the Higher L-Moment portfolio optimization model \[[A30](https://riskfolio-lib.readthedocs.io/en/latest/portfolio.html#id246 "Dany Cajas. Higher order moment portfolio optimization with l-moments. SSRN Electronic Journal, 2023. URL: https://papers.ssrn.com/sol3/papers.cfm?abstract_id=4393155, doi:10.2139/ssrn.4393155.")\
\].
* **Maximum Return Portfolio:**
minwR(w)s.t.Aw≤by\=rw∑i\=0Tv\[i\]y\[i\]≤c
* **Minimum Risk Portfolio:**
minw∑i\=0Tv\[i\]y\[i\]s.t.Aw≤by\=rwR(w)≥μ―
* **Maximum Risk Adjusted Return Ratio Portfolio:**
maxwR(w)−rf∑i\=0Tv\[i\]y\[i\]s.t.Aw≤by\=rwR(w)≥μ―
* **Maximum Utility Portfolio:**
maxwR(w)−λ(∑i\=0Tv\[i\]y\[i\])s.t.Aw≤by\=rwR(w)≥μ―
Where:
w are the weights of the portfolio.
v are the weights of the owa operator.
c: is the upper bound of risk measure.
μ: is the vector of expected returns.
X\[i\]: is the element of order i in ascending order of vector X.
Module Methods[¶](https://riskfolio-lib.readthedocs.io/en/latest/portfolio.html#module-Portfolio "Link to this heading")
-------------------------------------------------------------------------------------------------------------------------
_class_ Portfolio.Portfolio(_[returns](https://riskfolio-lib.readthedocs.io/en/latest/portfolio.html#Portfolio.Portfolio.__init__.returns "Portfolio.Portfolio.__init__.returns (Python parameter) — Assets returns DataFrame, where n_samples is the number of observations and n_assets is the number of assets. The default is None.")
\=`None`_, _[sht](https://riskfolio-lib.readthedocs.io/en/latest/portfolio.html#Portfolio.Portfolio.__init__.sht "Portfolio.Portfolio.__init__.sht (Python parameter) — Indicate if the portfolio consider short positions (negative weights). The default is False.")
\=`False`_, _[uppersht](https://riskfolio-lib.readthedocs.io/en/latest/portfolio.html#Portfolio.Portfolio.__init__.uppersht "Portfolio.Portfolio.__init__.uppersht (Python parameter) — Indicate the maximum absolute value of short positions (negative weights).")
\=`0.2`_, _[upperlng](https://riskfolio-lib.readthedocs.io/en/latest/portfolio.html#Portfolio.Portfolio.__init__.upperlng "Portfolio.Portfolio.__init__.upperlng (Python parameter) — Indicate the maximum value of long positions (positive weights). The default is 1.")
\=`1`_, _[lowerlng](https://riskfolio-lib.readthedocs.io/en/latest/portfolio.html#Portfolio.Portfolio "Portfolio.Portfolio.__init__.lowerlng (Python parameter)")
\=`0`_, _[budget](https://riskfolio-lib.readthedocs.io/en/latest/portfolio.html#Portfolio.Portfolio.__init__.budget "Portfolio.Portfolio.__init__.budget (Python parameter) — Indicate the maximum value of the sum of long positions (positive weights) and short positions (negative weights).")
\=`1`_, _[budgetsht](https://riskfolio-lib.readthedocs.io/en/latest/portfolio.html#Portfolio.Portfolio.__init__.budgetsht "Portfolio.Portfolio.__init__.budgetsht (Python parameter) — Indicate the maximum value of the sum of absolute value of short positions (negative weights).")
\=`0.2`_, _[nea](https://riskfolio-lib.readthedocs.io/en/latest/portfolio.html#Portfolio.Portfolio.__init__.nea "Portfolio.Portfolio.__init__.nea (Python parameter) — Indicate the minimum number of effective assets (NEA) used in portfolio.")
\=`None`_, _[card](https://riskfolio-lib.readthedocs.io/en/latest/portfolio.html#Portfolio.Portfolio.__init__.card "Portfolio.Portfolio.__init__.card (Python parameter) — Indicate the maximum number of assets used in portfolio.")
\=`None`_, _[factors](https://riskfolio-lib.readthedocs.io/en/latest/portfolio.html#Portfolio.Portfolio.__init__.factors "Portfolio.Portfolio.__init__.factors (Python parameter) — A dataframe that containts the returns of the factors. The default is None.")
\=`None`_, _[B](https://riskfolio-lib.readthedocs.io/en/latest/portfolio.html#Portfolio.Portfolio.__init__.B "Portfolio.Portfolio.__init__.B (Python parameter) — Loadings matrix, where n_assets is the number assets and n_factors is the number of risk factors.")
\=`None`_, _[alpha](https://riskfolio-lib.readthedocs.io/en/latest/portfolio.html#Portfolio.Portfolio.__init__.alpha "Portfolio.Portfolio.__init__.alpha (Python parameter) — Significance level of CVaR, EVaR, CDaR, EDaR and Tail Gini of losses.")
\=`0.05`_, _[a\_sim](https://riskfolio-lib.readthedocs.io/en/latest/portfolio.html#Portfolio.Portfolio.__init__.a_sim "Portfolio.Portfolio.__init__.a_sim (Python parameter) — Number of CVaRs used to approximate Tail Gini of losses.")
\=`100`_, _[beta](https://riskfolio-lib.readthedocs.io/en/latest/portfolio.html#Portfolio.Portfolio.__init__.beta "Portfolio.Portfolio.__init__.beta (Python parameter) — Significance level of CVaR and Tail Gini of gains.")
\=`None`_, _[b\_sim](https://riskfolio-lib.readthedocs.io/en/latest/portfolio.html#Portfolio.Portfolio.__init__.b_sim "Portfolio.Portfolio.__init__.b_sim (Python parameter) — Number of CVaRs used to approximate Tail Gini of gains.")
\=`None`_, _[kappa](https://riskfolio-lib.readthedocs.io/en/latest/portfolio.html#Portfolio.Portfolio.__init__.kappa "Portfolio.Portfolio.__init__.kappa (Python parameter) — Deformation parameter of RLVaR and RLDaR, must be between 0 and 1.")
\=`0.3`_, _[kappa\_g](https://riskfolio-lib.readthedocs.io/en/latest/portfolio.html#Portfolio.Portfolio.__init__.kappa_g "Portfolio.Portfolio.__init__.kappa_g (Python parameter) — Deformation parameter of RLVaR of gains used in RLVaR Range, must be between 0 and 1.")
\=`None`_, _[n\_max\_kurt](https://riskfolio-lib.readthedocs.io/en/latest/portfolio.html#Portfolio.Portfolio.__init__.n_max_kurt "Portfolio.Portfolio.__init__.n_max_kurt (Python parameter) — Maximum number of assets to use Kurtosis model based on semidefinte formulation.")
\=`50`_, _[kindbench](https://riskfolio-lib.readthedocs.io/en/latest/portfolio.html#Portfolio.Portfolio.__init__.kindbench "Portfolio.Portfolio.__init__.kindbench (Python parameter) — True if the benchmark is a portfolio with detailed weights and False if the benchmark is an index.")
\=`True`_, _[allowTO](https://riskfolio-lib.readthedocs.io/en/latest/portfolio.html#Portfolio.Portfolio.__init__.allowTO "Portfolio.Portfolio.__init__.allowTO (Python parameter) — Indicate if there is turnover constraints.")
\=`False`_, _[turnover](https://riskfolio-lib.readthedocs.io/en/latest/portfolio.html#Portfolio.Portfolio.__init__.turnover "Portfolio.Portfolio.__init__.turnover (Python parameter) — The maximum limit of turnover deviations.")
\=`0.05`_, _[allowTE](https://riskfolio-lib.readthedocs.io/en/latest/portfolio.html#Portfolio.Portfolio.__init__.allowTE "Portfolio.Portfolio.__init__.allowTE (Python parameter) — Indicate if there is tracking error constraints..")
\=`False`_, _[TE](https://riskfolio-lib.readthedocs.io/en/latest/portfolio.html#Portfolio.Portfolio.__init__.TE "Portfolio.Portfolio.__init__.TE (Python parameter) — The maximum limit of tracking error deviations.")
\=`0.05`_, _[benchindex](https://riskfolio-lib.readthedocs.io/en/latest/portfolio.html#Portfolio.Portfolio.__init__.benchindex "Portfolio.Portfolio.__init__.benchindex (Python parameter) — A dataframe that containts the returns of an index.")
\=`None`_, _[benchweights](https://riskfolio-lib.readthedocs.io/en/latest/portfolio.html#Portfolio.Portfolio.__init__.benchweights "Portfolio.Portfolio.__init__.benchweights (Python parameter) — A dataframe that containts the weights of an index.")
\=`None`_, _[ainequality](https://riskfolio-lib.readthedocs.io/en/latest/portfolio.html#Portfolio.Portfolio.__init__.ainequality "Portfolio.Portfolio.__init__.ainequality (Python parameter) — The matrix A of the linear constraint A \leq b. The default is None.")
\=`None`_, _[binequality](https://riskfolio-lib.readthedocs.io/en/latest/portfolio.html#Portfolio.Portfolio.__init__.binequality "Portfolio.Portfolio.__init__.binequality (Python parameter) — The matrix b of the linear constraint A \leq b. The default is None.")
\=`None`_, _[arcinequality](https://riskfolio-lib.readthedocs.io/en/latest/portfolio.html#Portfolio.Portfolio.__init__.arcinequality "Portfolio.Portfolio.__init__.arcinequality (Python parameter) — The matrix A_{RC} of the linear constraint A_{RC} \text{diag}(\text{Tr}(\Sigma X)) \leq b_{RC} \text{Tr}(\Sigma X). The default is None.")
\=`None`_, _[brcinequality](https://riskfolio-lib.readthedocs.io/en/latest/portfolio.html#Portfolio.Portfolio.__init__.brcinequality "Portfolio.Portfolio.__init__.brcinequality (Python parameter) — The matrix B_{RC} of the linear constraint A_{RC} \text{diag}(\text{Tr}(\Sigma X)) \leq b_{RC} \text{Tr}(\Sigma X). The default is None.")
\=`None`_, _[afrcinequality](https://riskfolio-lib.readthedocs.io/en/latest/portfolio.html#Portfolio.Portfolio.__init__.afrcinequality "Portfolio.Portfolio.__init__.afrcinequality (Python parameter) — The matrix A_{FRC} of the linear constraint A_{FRC} \text{diag}\left ( \bar{\Sigma} W_{F} \right) \leq b_{FRC} \, \text{Tr} \left ( \bar{\Sigma} W_{F} \right ). The default is None.")
\=`None`_, _[bfrcinequality](https://riskfolio-lib.readthedocs.io/en/latest/portfolio.html#Portfolio.Portfolio.__init__.bfrcinequality "Portfolio.Portfolio.__init__.bfrcinequality (Python parameter) — The matrix b_{FRC} of the linear constraint A_{FRC} \text{diag}\left ( \bar{\Sigma} W_{F} \right) \leq b_{FRC} \, \text{Tr} \left ( \bar{\Sigma} W_{F} \right ). The default is None.")
\=`None`_, _[aintinequality](https://riskfolio-lib.readthedocs.io/en/latest/portfolio.html#Portfolio.Portfolio "Portfolio.Portfolio.__init__.aintinequality (Python parameter)")
\=`None`_, _[bintinequality](https://riskfolio-lib.readthedocs.io/en/latest/portfolio.html#Portfolio.Portfolio "Portfolio.Portfolio.__init__.bintinequality (Python parameter)")
\=`None`_, _[cintinequality](https://riskfolio-lib.readthedocs.io/en/latest/portfolio.html#Portfolio.Portfolio "Portfolio.Portfolio.__init__.cintinequality (Python parameter)")
\=`None`_, _[dintinequality](https://riskfolio-lib.readthedocs.io/en/latest/portfolio.html#Portfolio.Portfolio "Portfolio.Portfolio.__init__.dintinequality (Python parameter)")
\=`None`_, _[eintinequality](https://riskfolio-lib.readthedocs.io/en/latest/portfolio.html#Portfolio.Portfolio "Portfolio.Portfolio.__init__.eintinequality (Python parameter)")
\=`None`_, _[fintinequality](https://riskfolio-lib.readthedocs.io/en/latest/portfolio.html#Portfolio.Portfolio "Portfolio.Portfolio.__init__.fintinequality (Python parameter)")
\=`None`_, _[b](https://riskfolio-lib.readthedocs.io/en/latest/portfolio.html#Portfolio.Portfolio.__init__.b "Portfolio.Portfolio.__init__.b (Python parameter) — The risk budgeting constraint vector.")
\=`None`_, _[network\_sdp](https://riskfolio-lib.readthedocs.io/en/latest/portfolio.html#Portfolio.Portfolio.__init__.network_sdp "Portfolio.Portfolio.__init__.network_sdp (Python parameter) — Connection matrix for semidefinite programming (SDP) network constraint. Users cannot use network_sdp and network_ip at the same time, when a value is assigned to network_sdp automatically network_ip becomes None. This constraint is based on a-Cajas10 and a-Cajas11. The default is None.")
\=`None`_, _[cluster\_sdp](https://riskfolio-lib.readthedocs.io/en/latest/portfolio.html#Portfolio.Portfolio.__init__.cluster_sdp "Portfolio.Portfolio.__init__.cluster_sdp (Python parameter) — Adjacency label matrix for semidefinite programming (SDP) cluster constraint. Users cannot use cluster_sdp and cluster_ip at the same time, when a value is assigned to cluster_sdp automatically cluster_ip becomes None. This constraint is based on a-Cajas10 and a-Cajas11. The default is None.")
\=`None`_, _[network\_ip](https://riskfolio-lib.readthedocs.io/en/latest/portfolio.html#Portfolio.Portfolio.__init__.network_ip "Portfolio.Portfolio.__init__.network_ip (Python parameter) — Connection matrix for integer programming (IP) network constraint.")
\=`None`_, _[cluster\_ip](https://riskfolio-lib.readthedocs.io/en/latest/portfolio.html#Portfolio.Portfolio.__init__.cluster_ip "Portfolio.Portfolio.__init__.cluster_ip (Python parameter) — Adjacency label matrix for integer programming (IP) cluster constraint.")
\=`None`_, _[graph\_penalty](https://riskfolio-lib.readthedocs.io/en/latest/portfolio.html#Portfolio.Portfolio.__init__.graph_penalty "Portfolio.Portfolio.__init__.graph_penalty (Python parameter) — The weight of SDP network constraint when the risk measure is not 'MV'. This constraint is based on a-Cajas10 and a-Cajas11. The default is 0.05.")
\=`0.05`_, _[acentrality](https://riskfolio-lib.readthedocs.io/en/latest/portfolio.html#Portfolio.Portfolio.__init__.acentrality "Portfolio.Portfolio.__init__.acentrality (Python parameter) — The matrix A_c of the centrality constraint A_c = B_c. This constraint is based on a-Cajas10. The default is None.")
\=`None`_, _[bcentrality](https://riskfolio-lib.readthedocs.io/en/latest/portfolio.html#Portfolio.Portfolio.__init__.bcentrality "Portfolio.Portfolio.__init__.bcentrality (Python parameter) — The matrix B_c of the centrality constraint A_c = B_c. This constraint is based on a-Cajas10. The default is None.")
\=`None`_, _[lowerret](https://riskfolio-lib.readthedocs.io/en/latest/portfolio.html#Portfolio.Portfolio.__init__.lowerret "Portfolio.Portfolio.__init__.lowerret (Python parameter) — Constraint on min level of expected return.")
\=`None`_, _[upperdev](https://riskfolio-lib.readthedocs.io/en/latest/portfolio.html#Portfolio.Portfolio.__init__.upperdev "Portfolio.Portfolio.__init__.upperdev (Python parameter) — Constraint on max level of standard deviation.")
\=`None`_, _[upperkt](https://riskfolio-lib.readthedocs.io/en/latest/portfolio.html#Portfolio.Portfolio.__init__.upperkt "Portfolio.Portfolio.__init__.upperkt (Python parameter) — Constraint on max level of square root kurtosis.")
\=`None`_, _[uppermad](https://riskfolio-lib.readthedocs.io/en/latest/portfolio.html#Portfolio.Portfolio.__init__.uppermad "Portfolio.Portfolio.__init__.uppermad (Python parameter) — Constraint on max level of MAD.")
\=`None`_, _[uppergmd](https://riskfolio-lib.readthedocs.io/en/latest/portfolio.html#Portfolio.Portfolio.__init__.uppergmd "Portfolio.Portfolio.__init__.uppergmd (Python parameter) — Constraint on max level of GMD.")
\=`None`_, _[uppersdev](https://riskfolio-lib.readthedocs.io/en/latest/portfolio.html#Portfolio.Portfolio.__init__.uppersdev "Portfolio.Portfolio.__init__.uppersdev (Python parameter) — Constraint on max level of semi standard deviation.")
\=`None`_, _[upperskt](https://riskfolio-lib.readthedocs.io/en/latest/portfolio.html#Portfolio.Portfolio.__init__.upperskt "Portfolio.Portfolio.__init__.upperskt (Python parameter) — Constraint on max level of square root semi kurtosis.")
\=`None`_, _[upperflpm](https://riskfolio-lib.readthedocs.io/en/latest/portfolio.html#Portfolio.Portfolio.__init__.upperflpm "Portfolio.Portfolio.__init__.upperflpm (Python parameter) — Constraint on max level of first lower partial moment. The default is None.")
\=`None`_, _[upperslpm](https://riskfolio-lib.readthedocs.io/en/latest/portfolio.html#Portfolio.Portfolio.__init__.upperslpm "Portfolio.Portfolio.__init__.upperslpm (Python parameter) — Constraint on max level of second lower partial moment. The default is None.")
\=`None`_, _[upperCVaR](https://riskfolio-lib.readthedocs.io/en/latest/portfolio.html#Portfolio.Portfolio.__init__.upperCVaR "Portfolio.Portfolio.__init__.upperCVaR (Python parameter) — Constraint on max level of conditional value at risk (CVaR).")
\=`None`_, _[uppertg](https://riskfolio-lib.readthedocs.io/en/latest/portfolio.html#Portfolio.Portfolio.__init__.uppertg "Portfolio.Portfolio.__init__.uppertg (Python parameter) — Constraint on max level of Tail Gini.")
\=`None`_, _[upperEVaR](https://riskfolio-lib.readthedocs.io/en/latest/portfolio.html#Portfolio.Portfolio.__init__.upperEVaR "Portfolio.Portfolio.__init__.upperEVaR (Python parameter) — Constraint on max level of entropic value at risk (EVaR).")
\=`None`_, _[upperRLVaR](https://riskfolio-lib.readthedocs.io/en/latest/portfolio.html#Portfolio.Portfolio.__init__.upperRLVaR "Portfolio.Portfolio.__init__.upperRLVaR (Python parameter) — Constraint on max level of relativistic value at risk (RLVaR).")
\=`None`_, _[upperwr](https://riskfolio-lib.readthedocs.io/en/latest/portfolio.html#Portfolio.Portfolio.__init__.upperwr "Portfolio.Portfolio.__init__.upperwr (Python parameter) — Constraint on max level of worst realization.")
\=`None`_, _[uppercvrg](https://riskfolio-lib.readthedocs.io/en/latest/portfolio.html#Portfolio.Portfolio.__init__.uppercvrg "Portfolio.Portfolio.__init__.uppercvrg (Python parameter) — Constraint on max level of CVaR range.")
\=`None`_, _[uppertgrg](https://riskfolio-lib.readthedocs.io/en/latest/portfolio.html#Portfolio.Portfolio.__init__.uppertgrg "Portfolio.Portfolio.__init__.uppertgrg (Python parameter) — Constraint on max level of Tail Gini range.")
\=`None`_, _[upperevrg](https://riskfolio-lib.readthedocs.io/en/latest/portfolio.html#Portfolio.Portfolio.__init__.upperevrg "Portfolio.Portfolio.__init__.upperevrg (Python parameter) — Constraint on max level of EVaR range.")
\=`None`_, _[upperrvrg](https://riskfolio-lib.readthedocs.io/en/latest/portfolio.html#Portfolio.Portfolio.__init__.upperrvrg "Portfolio.Portfolio.__init__.upperrvrg (Python parameter) — Constraint on max level of RLVaR range.")
\=`None`_, _[upperrg](https://riskfolio-lib.readthedocs.io/en/latest/portfolio.html#Portfolio.Portfolio.__init__.upperrg "Portfolio.Portfolio.__init__.upperrg (Python parameter) — Constraint on max level of range.")
\=`None`_, _[uppermdd](https://riskfolio-lib.readthedocs.io/en/latest/portfolio.html#Portfolio.Portfolio.__init__.uppermdd "Portfolio.Portfolio.__init__.uppermdd (Python parameter) — Constraint on max level of maximum drawdown of uncompounded cumulative returns.")
\=`None`_, _[upperadd](https://riskfolio-lib.readthedocs.io/en/latest/portfolio.html#Portfolio.Portfolio.__init__.upperadd "Portfolio.Portfolio.__init__.upperadd (Python parameter) — Constraint on max level of average drawdown of uncompounded cumulative returns.")
\=`None`_, _[upperCDaR](https://riskfolio-lib.readthedocs.io/en/latest/portfolio.html#Portfolio.Portfolio.__init__.upperCDaR "Portfolio.Portfolio.__init__.upperCDaR (Python parameter) — Constraint on max level of conditional drawdown at risk (CDaR) of uncompounded cumulative returns.")
\=`None`_, _[upperEDaR](https://riskfolio-lib.readthedocs.io/en/latest/portfolio.html#Portfolio.Portfolio.__init__.upperEDaR "Portfolio.Portfolio.__init__.upperEDaR (Python parameter) — Constraint on max level of entropic drawdown at risk (EDaR) of uncompounded cumulative returns.")
\=`None`_, _[upperRLDaR](https://riskfolio-lib.readthedocs.io/en/latest/portfolio.html#Portfolio.Portfolio.__init__.upperRLDaR "Portfolio.Portfolio.__init__.upperRLDaR (Python parameter) — Constraint on max level of relativistic drawdown at risk (RLDaR) of uncompounded cumulative returns.")
\=`None`_, _[upperuci](https://riskfolio-lib.readthedocs.io/en/latest/portfolio.html#Portfolio.Portfolio.__init__.upperuci "Portfolio.Portfolio.__init__.upperuci (Python parameter) — Constraint on max level of ulcer index (UCI) of uncompounded cumulative returns.")
\=`None`_, _[p\_1](https://riskfolio-lib.readthedocs.io/en/latest/portfolio.html#Portfolio.Portfolio.__init__.p_1 "Portfolio.Portfolio.__init__.p_1 (Python parameter) — First p-norm used to approximate GMD, TG and TGRG.")
\=`2`_, _[p\_2](https://riskfolio-lib.readthedocs.io/en/latest/portfolio.html#Portfolio.Portfolio.__init__.p_2 "Portfolio.Portfolio.__init__.p_2 (Python parameter) — Second p-norm used to approximate GMD, TG and TGRG.")
\=`3`_, _[p\_3](https://riskfolio-lib.readthedocs.io/en/latest/portfolio.html#Portfolio.Portfolio.__init__.p_3 "Portfolio.Portfolio.__init__.p_3 (Python parameter) — Third p-norm used to approximate GMD, TG and TGRG.")
\=`4`_, _[p\_4](https://riskfolio-lib.readthedocs.io/en/latest/portfolio.html#Portfolio.Portfolio.__init__.p_4 "Portfolio.Portfolio.__init__.p_4 (Python parameter) — Fourth p-norm used to approximate GMD, TG and TGRG.")
\=`10`_, _[p\_5](https://riskfolio-lib.readthedocs.io/en/latest/portfolio.html#Portfolio.Portfolio.__init__.p_5 "Portfolio.Portfolio.__init__.p_5 (Python parameter) — Fifth p-norm used to approximate GMD, TG and TGRG.")
\=`50`_)[\[source\]](https://riskfolio-lib.readthedocs.io/en/latest/_modules/Portfolio.html#Portfolio)
[¶](https://riskfolio-lib.readthedocs.io/en/latest/portfolio.html#Portfolio.Portfolio "Link to this definition")
Class that creates a portfolio object with all properties needed to calculate optimal portfolios.
Parameters:[¶](https://riskfolio-lib.readthedocs.io/en/latest/portfolio.html#Portfolio.Portfolio-parameters "Permalink to this headline")
returns : DataFrame of shape (n\_samples, n\_assets), optional[¶](https://riskfolio-lib.readthedocs.io/en/latest/portfolio.html#Portfolio.Portfolio.__init__.returns "Permalink to this definition")
Assets returns DataFrame, where n\_samples is the number of observations and n\_assets is the number of assets. The default is None.
sht : [bool](https://docs.python.org/3.11/library/functions.html#bool "(in Python v3.11)")
, optional[¶](https://riskfolio-lib.readthedocs.io/en/latest/portfolio.html#Portfolio.Portfolio.__init__.sht "Permalink to this definition")
Indicate if the portfolio consider short positions (negative weights). The default is False.
uppersht : [float](https://docs.python.org/3.11/library/functions.html#float "(in Python v3.11)")
, optional[¶](https://riskfolio-lib.readthedocs.io/en/latest/portfolio.html#Portfolio.Portfolio.__init__.uppersht "Permalink to this definition")
Indicate the maximum absolute value of short positions (negative weights). The default is 0.2.
upperlng : [float](https://docs.python.org/3.11/library/functions.html#float "(in Python v3.11)")
, optional[¶](https://riskfolio-lib.readthedocs.io/en/latest/portfolio.html#Portfolio.Portfolio.__init__.upperlng "Permalink to this definition")
Indicate the maximum value of long positions (positive weights). The default is 1.
budget : [float](https://docs.python.org/3.11/library/functions.html#float "(in Python v3.11)")
, optional[¶](https://riskfolio-lib.readthedocs.io/en/latest/portfolio.html#Portfolio.Portfolio.__init__.budget "Permalink to this definition")
Indicate the maximum value of the sum of long positions (positive weights) and short positions (negative weights). The default is 1.
budgetsht : [float](https://docs.python.org/3.11/library/functions.html#float "(in Python v3.11)")
, optional[¶](https://riskfolio-lib.readthedocs.io/en/latest/portfolio.html#Portfolio.Portfolio.__init__.budgetsht "Permalink to this definition")
Indicate the maximum value of the sum of absolute value of short positions (negative weights). The default is 0.2.
nea : [int](https://docs.python.org/3.11/library/functions.html#int "(in Python v3.11)")
, optional[¶](https://riskfolio-lib.readthedocs.io/en/latest/portfolio.html#Portfolio.Portfolio.__init__.nea "Permalink to this definition")
Indicate the minimum number of effective assets (NEA) used in portfolio. This value is the inverse of Herfindahl-Hirschman index of portfolio’s weights. The default is None.
card : [int](https://docs.python.org/3.11/library/functions.html#int "(in Python v3.11)")
, optional[¶](https://riskfolio-lib.readthedocs.io/en/latest/portfolio.html#Portfolio.Portfolio.__init__.card "Permalink to this definition")
Indicate the maximum number of assets used in portfolio. It requires a solver that supports Mixed Integer Programs (MIP), see [Solvers](https://www.cvxpy.org/tutorial/advanced/index.html#solve-method-options)
for more details. This constraint is based on \[[A31](https://riskfolio-lib.readthedocs.io/en/latest/portfolio.html#id229 "Dajun Yue and Fengqi You. Reformulation-linearization method for global optimization of mixed integer linear fractional programming problems with application on sustainable batch scheduling. In Jiří Jaromír Klemeš, Petar Sabev Varbanov, and Peng Yen Liew, editors, 24th European Symposium on Computer Aided Process Engineering, volume 33 of Computer Aided Chemical Engineering, pages 949-954. Elsevier, 2014. URL: https://www.sciencedirect.com/science/article/pii/B9780444634566501599, doi:https://doi.org/10.1016/B978-0-444-63456-6.50159-9.")\
\]. The default is None.
factors : DataFrame, optional[¶](https://riskfolio-lib.readthedocs.io/en/latest/portfolio.html#Portfolio.Portfolio.__init__.factors "Permalink to this definition")
A dataframe that containts the returns of the factors. The default is None.
B : DataFrame of shape (n\_assets, n\_factors), optional[¶](https://riskfolio-lib.readthedocs.io/en/latest/portfolio.html#Portfolio.Portfolio.__init__.B "Permalink to this definition")
Loadings matrix, where n\_assets is the number assets and n\_factors is the number of risk factors. The default is None.
alpha : [float](https://docs.python.org/3.11/library/functions.html#float "(in Python v3.11)")
, optional[¶](https://riskfolio-lib.readthedocs.io/en/latest/portfolio.html#Portfolio.Portfolio.__init__.alpha "Permalink to this definition")
Significance level of CVaR, EVaR, CDaR, EDaR and Tail Gini of losses. The default is 0.05.
a\_sim : [float](https://docs.python.org/3.11/library/functions.html#float "(in Python v3.11)")
, optional[¶](https://riskfolio-lib.readthedocs.io/en/latest/portfolio.html#Portfolio.Portfolio.__init__.a_sim "Permalink to this definition")
Number of CVaRs used to approximate Tail Gini of losses. The default is 100.
beta : [float](https://docs.python.org/3.11/library/functions.html#float "(in Python v3.11)")
, optional[¶](https://riskfolio-lib.readthedocs.io/en/latest/portfolio.html#Portfolio.Portfolio.__init__.beta "Permalink to this definition")
Significance level of CVaR and Tail Gini of gains. If None it duplicates alpha value. The default is None.
b\_sim : [float](https://docs.python.org/3.11/library/functions.html#float "(in Python v3.11)")
, optional[¶](https://riskfolio-lib.readthedocs.io/en/latest/portfolio.html#Portfolio.Portfolio.__init__.b_sim "Permalink to this definition")
Number of CVaRs used to approximate Tail Gini of gains. If None it duplicates a\_sim value. The default is None.
kappa : [float](https://docs.python.org/3.11/library/functions.html#float "(in Python v3.11)")
, optional[¶](https://riskfolio-lib.readthedocs.io/en/latest/portfolio.html#Portfolio.Portfolio.__init__.kappa "Permalink to this definition")
Deformation parameter of RLVaR and RLDaR, must be between 0 and 1. The default is 0.30.
kappa\_g : [float](https://docs.python.org/3.11/library/functions.html#float "(in Python v3.11)")
, optional[¶](https://riskfolio-lib.readthedocs.io/en/latest/portfolio.html#Portfolio.Portfolio.__init__.kappa_g "Permalink to this definition")
Deformation parameter of RLVaR of gains used in RLVaR Range, must be between 0 and 1. The default is None.
n\_max\_kurt : [int](https://docs.python.org/3.11/library/functions.html#int "(in Python v3.11)")
, optional[¶](https://riskfolio-lib.readthedocs.io/en/latest/portfolio.html#Portfolio.Portfolio.__init__.n_max_kurt "Permalink to this definition")
Maximum number of assets to use Kurtosis model based on semidefinte formulation. If number of assets is higher than n\_max\_kurt, it uses relaxed kurtosis model based on second order cone. The default is 50.
kindbench : [bool](https://docs.python.org/3.11/library/functions.html#bool "(in Python v3.11)")
, optional[¶](https://riskfolio-lib.readthedocs.io/en/latest/portfolio.html#Portfolio.Portfolio.__init__.kindbench "Permalink to this definition")
True if the benchmark is a portfolio with detailed weights and False if the benchmark is an index. The default is True.
allowTO : [bool](https://docs.python.org/3.11/library/functions.html#bool "(in Python v3.11)")
, optional[¶](https://riskfolio-lib.readthedocs.io/en/latest/portfolio.html#Portfolio.Portfolio.__init__.allowTO "Permalink to this definition")
Indicate if there is turnover constraints. The default is False.
turnover : [float](https://docs.python.org/3.11/library/functions.html#float "(in Python v3.11)")
, optional[¶](https://riskfolio-lib.readthedocs.io/en/latest/portfolio.html#Portfolio.Portfolio.__init__.turnover "Permalink to this definition")
The maximum limit of turnover deviations. The default is 0.05.
allowTE : [bool](https://docs.python.org/3.11/library/functions.html#bool "(in Python v3.11)")
, optional[¶](https://riskfolio-lib.readthedocs.io/en/latest/portfolio.html#Portfolio.Portfolio.__init__.allowTE "Permalink to this definition")
Indicate if there is tracking error constraints.. The default is False.
TE : [float](https://docs.python.org/3.11/library/functions.html#float "(in Python v3.11)")
, optional[¶](https://riskfolio-lib.readthedocs.io/en/latest/portfolio.html#Portfolio.Portfolio.__init__.TE "Permalink to this definition")
The maximum limit of tracking error deviations. The default is 0.05.
benchindex : DataFrame, optional[¶](https://riskfolio-lib.readthedocs.io/en/latest/portfolio.html#Portfolio.Portfolio.__init__.benchindex "Permalink to this definition")
A dataframe that containts the returns of an index. If kindbench is False the tracking error constraints are calculated respect to this index. The default is None.
benchweights : DataFrame, optional[¶](https://riskfolio-lib.readthedocs.io/en/latest/portfolio.html#Portfolio.Portfolio.__init__.benchweights "Permalink to this definition")
A dataframe that containts the weights of an index. The default is the equally weighted portfolio 1/N.
ainequality : nd-array, optional[¶](https://riskfolio-lib.readthedocs.io/en/latest/portfolio.html#Portfolio.Portfolio.__init__.ainequality "Permalink to this definition")
The matrix A of the linear constraint A≤b. The default is None.
binequality : 1d-array, optional[¶](https://riskfolio-lib.readthedocs.io/en/latest/portfolio.html#Portfolio.Portfolio.__init__.binequality "Permalink to this definition")
The matrix b of the linear constraint A≤b. The default is None.
arcinequality : nd-array, optional[¶](https://riskfolio-lib.readthedocs.io/en/latest/portfolio.html#Portfolio.Portfolio.__init__.arcinequality "Permalink to this definition")
The matrix ARC of the linear constraint ARCdiag(Tr(ΣX))≤bRCTr(ΣX). The default is None.
brcinequality : 1d-array, optional[¶](https://riskfolio-lib.readthedocs.io/en/latest/portfolio.html#Portfolio.Portfolio.__init__.brcinequality "Permalink to this definition")
The matrix BRC of the linear constraint ARCdiag(Tr(ΣX))≤bRCTr(ΣX). The default is None.
afrcinequality : nd-array, optional[¶](https://riskfolio-lib.readthedocs.io/en/latest/portfolio.html#Portfolio.Portfolio.__init__.afrcinequality "Permalink to this definition")
The matrix AFRC of the linear constraint AFRCdiag(Σ¯WF)≤bFRCTr(Σ¯WF). The default is None.
bfrcinequality : 1d-array, optional[¶](https://riskfolio-lib.readthedocs.io/en/latest/portfolio.html#Portfolio.Portfolio.__init__.bfrcinequality "Permalink to this definition")
The matrix bFRC of the linear constraint AFRCdiag(Σ¯WF)≤bFRCTr(Σ¯WF). The default is None.
b : 1d-array, optional[¶](https://riskfolio-lib.readthedocs.io/en/latest/portfolio.html#Portfolio.Portfolio.__init__.b "Permalink to this definition")
The risk budgeting constraint vector. The default is None.
network\_sdp : nd-array, optional[¶](https://riskfolio-lib.readthedocs.io/en/latest/portfolio.html#Portfolio.Portfolio.__init__.network_sdp "Permalink to this definition")
Connection matrix for semidefinite programming (SDP) network constraint. Users cannot use network\_sdp and network\_ip at the same time, when a value is assigned to network\_sdp automatically network\_ip becomes None. This constraint is based on \[[A32](https://riskfolio-lib.readthedocs.io/en/latest/portfolio.html#id250 "Dany Cajas. A graph theory approach to portfolio optimization. SSRN Electronic Journal, 10 2023. doi:10.2139/ssrn.4602019.")\
\] and \[[A33](https://riskfolio-lib.readthedocs.io/en/latest/portfolio.html#id251 "Dany Cajas. A graph theory approach to portfolio optimization part ii. SSRN Electronic Journal, 12 2023. doi:10.2139/ssrn.4540021.")\
\]. The default is None.
cluster\_sdp : nd-array, optional[¶](https://riskfolio-lib.readthedocs.io/en/latest/portfolio.html#Portfolio.Portfolio.__init__.cluster_sdp "Permalink to this definition")
Adjacency label matrix for semidefinite programming (SDP) cluster constraint. Users cannot use cluster\_sdp and cluster\_ip at the same time, when a value is assigned to cluster\_sdp automatically cluster\_ip becomes None. This constraint is based on \[[A32](https://riskfolio-lib.readthedocs.io/en/latest/portfolio.html#id250 "Dany Cajas. A graph theory approach to portfolio optimization. SSRN Electronic Journal, 10 2023. doi:10.2139/ssrn.4602019.")\
\] and \[[A33](https://riskfolio-lib.readthedocs.io/en/latest/portfolio.html#id251 "Dany Cajas. A graph theory approach to portfolio optimization part ii. SSRN Electronic Journal, 12 2023. doi:10.2139/ssrn.4540021.")\
\]. The default is None.
network\_ip : nd-array, optional[¶](https://riskfolio-lib.readthedocs.io/en/latest/portfolio.html#Portfolio.Portfolio.__init__.network_ip "Permalink to this definition")
Connection matrix for integer programming (IP) network constraint. Users cannot use network\_sdp and network\_ip at the same time, when a value is assigned to network\_ip automatically network\_sdp becomes None. This constraint is based on \[[A32](https://riskfolio-lib.readthedocs.io/en/latest/portfolio.html#id250 "Dany Cajas. A graph theory approach to portfolio optimization. SSRN Electronic Journal, 10 2023. doi:10.2139/ssrn.4602019.")\
\] and \[[A33](https://riskfolio-lib.readthedocs.io/en/latest/portfolio.html#id251 "Dany Cajas. A graph theory approach to portfolio optimization part ii. SSRN Electronic Journal, 12 2023. doi:10.2139/ssrn.4540021.")\
\]. The default is None.
cluster\_ip : nd-array, optional[¶](https://riskfolio-lib.readthedocs.io/en/latest/portfolio.html#Portfolio.Portfolio.__init__.cluster_ip "Permalink to this definition")
Adjacency label matrix for integer programming (IP) cluster constraint. Users cannot use cluster\_sdp and cluster\_ip at the same time, when a value is assigned to cluster\_ip automatically cluster\_sdp becomes None. This constraint is based on \[[A32](https://riskfolio-lib.readthedocs.io/en/latest/portfolio.html#id250 "Dany Cajas. A graph theory approach to portfolio optimization. SSRN Electronic Journal, 10 2023. doi:10.2139/ssrn.4602019.")\
\] and \[[A33](https://riskfolio-lib.readthedocs.io/en/latest/portfolio.html#id251 "Dany Cajas. A graph theory approach to portfolio optimization part ii. SSRN Electronic Journal, 12 2023. doi:10.2139/ssrn.4540021.")\
\]. The default is None.
graph\_penalty : [float](https://docs.python.org/3.11/library/functions.html#float "(in Python v3.11)")
, optional[¶](https://riskfolio-lib.readthedocs.io/en/latest/portfolio.html#Portfolio.Portfolio.__init__.graph_penalty "Permalink to this definition")
The weight of SDP network constraint when the risk measure is not ‘MV’. This constraint is based on \[[A32](https://riskfolio-lib.readthedocs.io/en/latest/portfolio.html#id250 "Dany Cajas. A graph theory approach to portfolio optimization. SSRN Electronic Journal, 10 2023. doi:10.2139/ssrn.4602019.")\
\] and \[[A33](https://riskfolio-lib.readthedocs.io/en/latest/portfolio.html#id251 "Dany Cajas. A graph theory approach to portfolio optimization part ii. SSRN Electronic Journal, 12 2023. doi:10.2139/ssrn.4540021.")\
\]. The default is 0.05.
acentrality : nd-array, optional[¶](https://riskfolio-lib.readthedocs.io/en/latest/portfolio.html#Portfolio.Portfolio.__init__.acentrality "Permalink to this definition")
The matrix Ac of the centrality constraint Ac\=Bc. This constraint is based on \[[A32](https://riskfolio-lib.readthedocs.io/en/latest/portfolio.html#id250 "Dany Cajas. A graph theory approach to portfolio optimization. SSRN Electronic Journal, 10 2023. doi:10.2139/ssrn.4602019.")\
\]. The default is None.
bcentrality : nd-array, optional[¶](https://riskfolio-lib.readthedocs.io/en/latest/portfolio.html#Portfolio.Portfolio.__init__.bcentrality "Permalink to this definition")
The matrix Bc of the centrality constraint Ac\=Bc. This constraint is based on \[[A32](https://riskfolio-lib.readthedocs.io/en/latest/portfolio.html#id250 "Dany Cajas. A graph theory approach to portfolio optimization. SSRN Electronic Journal, 10 2023. doi:10.2139/ssrn.4602019.")\
\]. The default is None.
lowerret : [float](https://docs.python.org/3.11/library/functions.html#float "(in Python v3.11)")
, optional[¶](https://riskfolio-lib.readthedocs.io/en/latest/portfolio.html#Portfolio.Portfolio.__init__.lowerret "Permalink to this definition")
Constraint on min level of expected return. The default is None.
upperdev : [float](https://docs.python.org/3.11/library/functions.html#float "(in Python v3.11)")
, optional[¶](https://riskfolio-lib.readthedocs.io/en/latest/portfolio.html#Portfolio.Portfolio.__init__.upperdev "Permalink to this definition")
Constraint on max level of standard deviation. The default is None.
upperkt : [float](https://docs.python.org/3.11/library/functions.html#float "(in Python v3.11)")
, optional[¶](https://riskfolio-lib.readthedocs.io/en/latest/portfolio.html#Portfolio.Portfolio.__init__.upperkt "Permalink to this definition")
Constraint on max level of square root kurtosis. The default is None.
uppermad : [float](https://docs.python.org/3.11/library/functions.html#float "(in Python v3.11)")
, optional[¶](https://riskfolio-lib.readthedocs.io/en/latest/portfolio.html#Portfolio.Portfolio.__init__.uppermad "Permalink to this definition")
Constraint on max level of MAD. The default is None.
uppergmd : [float](https://docs.python.org/3.11/library/functions.html#float "(in Python v3.11)")
, optional[¶](https://riskfolio-lib.readthedocs.io/en/latest/portfolio.html#Portfolio.Portfolio.__init__.uppergmd "Permalink to this definition")
Constraint on max level of GMD. The default is None.
uppersdev : [float](https://docs.python.org/3.11/library/functions.html#float "(in Python v3.11)")
, optional[¶](https://riskfolio-lib.readthedocs.io/en/latest/portfolio.html#Portfolio.Portfolio.__init__.uppersdev "Permalink to this definition")
Constraint on max level of semi standard deviation. The default is None.
upperskt : [float](https://docs.python.org/3.11/library/functions.html#float "(in Python v3.11)")
, optional[¶](https://riskfolio-lib.readthedocs.io/en/latest/portfolio.html#Portfolio.Portfolio.__init__.upperskt "Permalink to this definition")
Constraint on max level of square root semi kurtosis. The default is None.
upperflpm : [float](https://docs.python.org/3.11/library/functions.html#float "(in Python v3.11)")
, optional[¶](https://riskfolio-lib.readthedocs.io/en/latest/portfolio.html#Portfolio.Portfolio.__init__.upperflpm "Permalink to this definition")
Constraint on max level of first lower partial moment. The default is None.
upperslpm : [float](https://docs.python.org/3.11/library/functions.html#float "(in Python v3.11)")
, optional[¶](https://riskfolio-lib.readthedocs.io/en/latest/portfolio.html#Portfolio.Portfolio.__init__.upperslpm "Permalink to this definition")
Constraint on max level of second lower partial moment. The default is None.
upperCVaR : [float](https://docs.python.org/3.11/library/functions.html#float "(in Python v3.11)")
, optional[¶](https://riskfolio-lib.readthedocs.io/en/latest/portfolio.html#Portfolio.Portfolio.__init__.upperCVaR "Permalink to this definition")
Constraint on max level of conditional value at risk (CVaR). The default is None.
uppertg : [float](https://docs.python.org/3.11/library/functions.html#float "(in Python v3.11)")
, optional[¶](https://riskfolio-lib.readthedocs.io/en/latest/portfolio.html#Portfolio.Portfolio.__init__.uppertg "Permalink to this definition")
Constraint on max level of Tail Gini. The default is None.
upperEVaR : [float](https://docs.python.org/3.11/library/functions.html#float "(in Python v3.11)")
, optional[¶](https://riskfolio-lib.readthedocs.io/en/latest/portfolio.html#Portfolio.Portfolio.__init__.upperEVaR "Permalink to this definition")
Constraint on max level of entropic value at risk (EVaR). The default is None.
upperRLVaR : [float](https://docs.python.org/3.11/library/functions.html#float "(in Python v3.11)")
, optional[¶](https://riskfolio-lib.readthedocs.io/en/latest/portfolio.html#Portfolio.Portfolio.__init__.upperRLVaR "Permalink to this definition")
Constraint on max level of relativistic value at risk (RLVaR). The default is None.
upperwr : [float](https://docs.python.org/3.11/library/functions.html#float "(in Python v3.11)")
, optional[¶](https://riskfolio-lib.readthedocs.io/en/latest/portfolio.html#Portfolio.Portfolio.__init__.upperwr "Permalink to this definition")
Constraint on max level of worst realization. The default is None.
upperrg : [float](https://docs.python.org/3.11/library/functions.html#float "(in Python v3.11)")
, optional[¶](https://riskfolio-lib.readthedocs.io/en/latest/portfolio.html#Portfolio.Portfolio.__init__.upperrg "Permalink to this definition")
Constraint on max level of range. The default is None.
uppercvrg : [float](https://docs.python.org/3.11/library/functions.html#float "(in Python v3.11)")
, optional[¶](https://riskfolio-lib.readthedocs.io/en/latest/portfolio.html#Portfolio.Portfolio.__init__.uppercvrg "Permalink to this definition")
Constraint on max level of CVaR range. The default is None.
uppertgrg : [float](https://docs.python.org/3.11/library/functions.html#float "(in Python v3.11)")
, optional[¶](https://riskfolio-lib.readthedocs.io/en/latest/portfolio.html#Portfolio.Portfolio.__init__.uppertgrg "Permalink to this definition")
Constraint on max level of Tail Gini range. The default is None.
upperevrg : [float](https://docs.python.org/3.11/library/functions.html#float "(in Python v3.11)")
, optional[¶](https://riskfolio-lib.readthedocs.io/en/latest/portfolio.html#Portfolio.Portfolio.__init__.upperevrg "Permalink to this definition")
Constraint on max level of EVaR range. The default is None.
upperrvrg : [float](https://docs.python.org/3.11/library/functions.html#float "(in Python v3.11)")
, optional[¶](https://riskfolio-lib.readthedocs.io/en/latest/portfolio.html#Portfolio.Portfolio.__init__.upperrvrg "Permalink to this definition")
Constraint on max level of RLVaR range. The default is None.
uppermdd : [float](https://docs.python.org/3.11/library/functions.html#float "(in Python v3.11)")
, optional[¶](https://riskfolio-lib.readthedocs.io/en/latest/portfolio.html#Portfolio.Portfolio.__init__.uppermdd "Permalink to this definition")
Constraint on max level of maximum drawdown of uncompounded cumulative returns. The default is None.
upperadd : [float](https://docs.python.org/3.11/library/functions.html#float "(in Python v3.11)")
, optional[¶](https://riskfolio-lib.readthedocs.io/en/latest/portfolio.html#Portfolio.Portfolio.__init__.upperadd "Permalink to this definition")
Constraint on max level of average drawdown of uncompounded cumulative returns. The default is None.
upperCDaR : [float](https://docs.python.org/3.11/library/functions.html#float "(in Python v3.11)")
, optional[¶](https://riskfolio-lib.readthedocs.io/en/latest/portfolio.html#Portfolio.Portfolio.__init__.upperCDaR "Permalink to this definition")
Constraint on max level of conditional drawdown at risk (CDaR) of uncompounded cumulative returns. The default is None.
upperEDaR : [float](https://docs.python.org/3.11/library/functions.html#float "(in Python v3.11)")
, optional[¶](https://riskfolio-lib.readthedocs.io/en/latest/portfolio.html#Portfolio.Portfolio.__init__.upperEDaR "Permalink to this definition")
Constraint on max level of entropic drawdown at risk (EDaR) of uncompounded cumulative returns. The default is None.
upperRLDaR : [float](https://docs.python.org/3.11/library/functions.html#float "(in Python v3.11)")
, optional[¶](https://riskfolio-lib.readthedocs.io/en/latest/portfolio.html#Portfolio.Portfolio.__init__.upperRLDaR "Permalink to this definition")
Constraint on max level of relativistic drawdown at risk (RLDaR) of uncompounded cumulative returns. The default is None.
upperuci : [float](https://docs.python.org/3.11/library/functions.html#float "(in Python v3.11)")
, optional[¶](https://riskfolio-lib.readthedocs.io/en/latest/portfolio.html#Portfolio.Portfolio.__init__.upperuci "Permalink to this definition")
Constraint on max level of ulcer index (UCI) of uncompounded cumulative returns. The default is None.
p\_1 : [float](https://docs.python.org/3.11/library/functions.html#float "(in Python v3.11)")
, optional[¶](https://riskfolio-lib.readthedocs.io/en/latest/portfolio.html#Portfolio.Portfolio.__init__.p_1 "Permalink to this definition")
First p-norm used to approximate GMD, TG and TGRG. The default is 2.
p\_2 : [float](https://docs.python.org/3.11/library/functions.html#float "(in Python v3.11)")
, optional[¶](https://riskfolio-lib.readthedocs.io/en/latest/portfolio.html#Portfolio.Portfolio.__init__.p_2 "Permalink to this definition")
Second p-norm used to approximate GMD, TG and TGRG. The default is 3.
p\_3 : [float](https://docs.python.org/3.11/library/functions.html#float "(in Python v3.11)")
, optional[¶](https://riskfolio-lib.readthedocs.io/en/latest/portfolio.html#Portfolio.Portfolio.__init__.p_3 "Permalink to this definition")
Third p-norm used to approximate GMD, TG and TGRG. The default is 4.
p\_4 : [float](https://docs.python.org/3.11/library/functions.html#float "(in Python v3.11)")
, optional[¶](https://riskfolio-lib.readthedocs.io/en/latest/portfolio.html#Portfolio.Portfolio.__init__.p_4 "Permalink to this definition")
Fourth p-norm used to approximate GMD, TG and TGRG. The default is 10.
p\_5 : [float](https://docs.python.org/3.11/library/functions.html#float "(in Python v3.11)")
, optional[¶](https://riskfolio-lib.readthedocs.io/en/latest/portfolio.html#Portfolio.Portfolio.__init__.p_5 "Permalink to this definition")
Fifth p-norm used to approximate GMD, TG and TGRG. The default is 50.
assets\_stats(_[method\_mu](https://riskfolio-lib.readthedocs.io/en/latest/portfolio.html#Portfolio.Portfolio.assets_stats.method_mu "Portfolio.Portfolio.assets_stats.method_mu (Python parameter) — The method used to estimate the expected returns. The default value is 'hist'.")
\=`'hist'`_, _[method\_cov](https://riskfolio-lib.readthedocs.io/en/latest/portfolio.html#Portfolio.Portfolio.assets_stats.method_cov "Portfolio.Portfolio.assets_stats.method_cov (Python parameter) — The method used to estimate the covariance matrix. The default is 'hist'.")
\=`'hist'`_, _[method\_kurt](https://riskfolio-lib.readthedocs.io/en/latest/portfolio.html#Portfolio.Portfolio.assets_stats.method_kurt "Portfolio.Portfolio.assets_stats.method_kurt (Python parameter) — The method used to estimate the kurtosis square matrix: The default is None.")
\=`None`_, _[dict\_mu](https://riskfolio-lib.readthedocs.io/en/latest/portfolio.html#Portfolio.Portfolio.assets_stats.dict_mu "Portfolio.Portfolio.assets_stats.dict_mu (Python parameter) — Other variables related to the mean vector estimation method.")
\=`{}`_, _[dict\_cov](https://riskfolio-lib.readthedocs.io/en/latest/portfolio.html#Portfolio.Portfolio.assets_stats.dict_cov "Portfolio.Portfolio.assets_stats.dict_cov (Python parameter) — Other variables related to the covariance estimation method.")
\=`{}`_, _[dict\_kurt](https://riskfolio-lib.readthedocs.io/en/latest/portfolio.html#Portfolio.Portfolio.assets_stats.dict_kurt "Portfolio.Portfolio.assets_stats.dict_kurt (Python parameter) — Other variables related to the cokurtosis estimation method.")
\=`{}`_)[\[source\]](https://riskfolio-lib.readthedocs.io/en/latest/_modules/Portfolio.html#Portfolio.assets_stats)
[¶](https://riskfolio-lib.readthedocs.io/en/latest/portfolio.html#Portfolio.Portfolio.assets_stats "Link to this definition")
Calculate the inputs that will be used by the optimization method when we select the input model=’Classic’.
Parameters:[¶](https://riskfolio-lib.readthedocs.io/en/latest/portfolio.html#Portfolio.Portfolio.assets_stats-parameters "Permalink to this headline")
method\_mu : [str](https://docs.python.org/3.11/library/stdtypes.html#str "(in Python v3.11)")
, optional[¶](https://riskfolio-lib.readthedocs.io/en/latest/portfolio.html#Portfolio.Portfolio.assets_stats.method_mu "Permalink to this definition")
The method used to estimate the expected returns. The default value is ‘hist’. Possible values are:
* ’hist’: use historical estimates.
* ’ewma1’’: use ewma with adjust=True, see [EWM](https://pandas.pydata.org/pandas-docs/stable/user_guide/computation.html#exponentially-weighted-windows)
for more details.
* ’ewma2’: use ewma with adjust=False, see [EWM](https://pandas.pydata.org/pandas-docs/stable/user_guide/computation.html#exponentially-weighted-windows)
for more details.
* ’JS’: James-Stein estimator. For more information see \[[A34](https://riskfolio-lib.readthedocs.io/en/latest/portfolio.html#id252 "Attilio Meucci. Risk and Asset Allocation. Springer Berlin Heidelberg, 2005. URL: https://doi.org/10.1007/978-3-540-27904-4, doi:10.1007/978-3-540-27904-4.")\
\] and \[[A35](https://riskfolio-lib.readthedocs.io/en/latest/portfolio.html#id253 "Yiyong Feng and Daniel P. Palomar. A signal processing perspective of financial engineering. Foundations and Trends® in Signal Processing, 9(1-2):1–231, 2016. URL: https://doi.org/10.1561/2000000072, doi:10.1561/2000000072.")\
\].
* ’BS’: Bayes-Stein estimator. For more information see \[[A36](https://riskfolio-lib.readthedocs.io/en/latest/portfolio.html#id254 "Philippe Jorion. Bayes-stein estimation for portfolio analysis. The Journal of Financial and Quantitative Analysis, 21(3):279, September 1986. URL: https://doi.org/10.2307/2331042, doi:10.2307/2331042.")\
\].
* ’BOP’: BOP estimator. For more information see \[[A37](https://riskfolio-lib.readthedocs.io/en/latest/portfolio.html#id255 "Taras Bodnar, Ostap Okhrin, and Nestor Parolya. Optimal shrinkage estimator for high-dimensional mean vector. Journal of Multivariate Analysis, 170:63–79, 03 2019. URL: https://doi.org/10.1016\%2Fj.jmva.2018.07.004, doi:10.1016/j.jmva.2018.07.004.")\
\].
method\_cov : [str](https://docs.python.org/3.11/library/stdtypes.html#str "(in Python v3.11)")
, optional[¶](https://riskfolio-lib.readthedocs.io/en/latest/portfolio.html#Portfolio.Portfolio.assets_stats.method_cov "Permalink to this definition")
The method used to estimate the covariance matrix. The default is ‘hist’. Possible values are:
* ’hist’: use historical estimates.
* ’ewma1’’: use ewma with adjust=True, see [EWM](https://pandas.pydata.org/pandas-docs/stable/user_guide/computation.html#exponentially-weighted-windows)
for more details.
* ’ewma2’: use ewma with adjust=False, see [EWM](https://pandas.pydata.org/pandas-docs/stable/user_guide/computation.html#exponentially-weighted-windows)
for more details.
* ’ledoit’: use the Ledoit and Wolf Shrinkage method.
* ’oas’: use the Oracle Approximation Shrinkage method.
* ’shrunk’: use the basic Shrunk Covariance method.
* ’gl’: use the basic Graphical Lasso Covariance method.
* ’jlogo’: use the j-LoGo Covariance method. For more information see: \[[A38](https://riskfolio-lib.readthedocs.io/en/latest/portfolio.html#id237 "Wolfram Barfuss, Guido Previde Massara, T. Di Matteo, and Tomaso Aste. Parsimonious modeling with information filtering networks. Physical Review E, 12 2016. URL: http://dx.doi.org/10.1103/PhysRevE.94.062306, doi:10.1103/physreve.94.062306.")\
\].
* ’fixed’: denoise using fixed method. For more information see chapter 2 of \[[A39](https://riskfolio-lib.readthedocs.io/en/latest/portfolio.html#id238 "Marcos M. López de Prado. Machine Learning for Asset Managers. Elements in Quantitative Finance. Cambridge University Press, 2020. doi:10.1017/9781108883658.")\
\].
* ’spectral’: denoise using spectral method. For more information see chapter 2 of \[[A39](https://riskfolio-lib.readthedocs.io/en/latest/portfolio.html#id238 "Marcos M. López de Prado. Machine Learning for Asset Managers. Elements in Quantitative Finance. Cambridge University Press, 2020. doi:10.1017/9781108883658.")\
\].
* ’shrink’: denoise using shrink method. For more information see chapter 2 of \[[A39](https://riskfolio-lib.readthedocs.io/en/latest/portfolio.html#id238 "Marcos M. López de Prado. Machine Learning for Asset Managers. Elements in Quantitative Finance. Cambridge University Press, 2020. doi:10.1017/9781108883658.")\
\].
* ’gerber1’: use the Gerber statistic 1. For more information see: \[[A40](https://riskfolio-lib.readthedocs.io/en/latest/portfolio.html#id242 "Sander Gerber, Harry Markowitz, Philip Ernst, Yinsen Miao, Babak Javid, and Paul Sargen. The gerber statistic: a robust co-movement measure for portfolio optimization. SSRN Electronic Journal, 2021. URL: https://doi.org/10.2139/ssrn.3880054, doi:10.2139/ssrn.3880054.")\
\].
* ’gerber2’: use the Gerber statistic 2. For more information see: \[[A40](https://riskfolio-lib.readthedocs.io/en/latest/portfolio.html#id242 "Sander Gerber, Harry Markowitz, Philip Ernst, Yinsen Miao, Babak Javid, and Paul Sargen. The gerber statistic: a robust co-movement measure for portfolio optimization. SSRN Electronic Journal, 2021. URL: https://doi.org/10.2139/ssrn.3880054, doi:10.2139/ssrn.3880054.")\
\].
method\_kurt : [str](https://docs.python.org/3.11/library/stdtypes.html#str "(in Python v3.11)")
, optional[¶](https://riskfolio-lib.readthedocs.io/en/latest/portfolio.html#Portfolio.Portfolio.assets_stats.method_kurt "Permalink to this definition")
The method used to estimate the kurtosis square matrix: The default is None. Possible values are:
* None: do not calculate kurtosis square matrix.
* ’hist’: use historical estimates. For more information see \[[A5](https://riskfolio-lib.readthedocs.io/en/latest/portfolio.html#id243 "Dany Cajas. Convex optimization of portfolio kurtosis. SSRN Electronic Journal, 2022. URL: https://doi.org/10.2139/ssrn.4202967, doi:10.2139/ssrn.4202967.")\
\].
* ’semi’: use semi cokurtosis square matrix. For more information see \[[A5](https://riskfolio-lib.readthedocs.io/en/latest/portfolio.html#id243 "Dany Cajas. Convex optimization of portfolio kurtosis. SSRN Electronic Journal, 2022. URL: https://doi.org/10.2139/ssrn.4202967, doi:10.2139/ssrn.4202967.")\
\].
* ’fixed’: denoise using fixed method. For more information see chapter 2 of \[[A39](https://riskfolio-lib.readthedocs.io/en/latest/portfolio.html#id238 "Marcos M. López de Prado. Machine Learning for Asset Managers. Elements in Quantitative Finance. Cambridge University Press, 2020. doi:10.1017/9781108883658.")\
\].
* ’spectral’: denoise using spectral method. For more information see chapter 2 of \[[A39](https://riskfolio-lib.readthedocs.io/en/latest/portfolio.html#id238 "Marcos M. López de Prado. Machine Learning for Asset Managers. Elements in Quantitative Finance. Cambridge University Press, 2020. doi:10.1017/9781108883658.")\
\].
* ’shrink’: denoise using shrink method. For more information see chapter 2 of \[[A39](https://riskfolio-lib.readthedocs.io/en/latest/portfolio.html#id238 "Marcos M. López de Prado. Machine Learning for Asset Managers. Elements in Quantitative Finance. Cambridge University Press, 2020. doi:10.1017/9781108883658.")\
\].
dict\_mu : [dict](https://docs.python.org/3.11/library/stdtypes.html#dict "(in Python v3.11)")
[¶](https://riskfolio-lib.readthedocs.io/en/latest/portfolio.html#Portfolio.Portfolio.assets_stats.dict_mu "Permalink to this definition")
Other variables related to the mean vector estimation method.
dict\_cov : [dict](https://docs.python.org/3.11/library/stdtypes.html#dict "(in Python v3.11)")
[¶](https://riskfolio-lib.readthedocs.io/en/latest/portfolio.html#Portfolio.Portfolio.assets_stats.dict_cov "Permalink to this definition")
Other variables related to the covariance estimation method.
dict\_kurt : [dict](https://docs.python.org/3.11/library/stdtypes.html#dict "(in Python v3.11)")
[¶](https://riskfolio-lib.readthedocs.io/en/latest/portfolio.html#Portfolio.Portfolio.assets_stats.dict_kurt "Permalink to this definition")
Other variables related to the cokurtosis estimation method.
See also
`riskfolio.src.ParamsEstimation.mean_vector`, `riskfolio.src.ParamsEstimation.covar_matrix`, `riskfolio.src.ParamsEstimation.cokurt_matrix`
blacklitterman\_stats(_[P](https://riskfolio-lib.readthedocs.io/en/latest/portfolio.html#Portfolio.Portfolio.blacklitterman_stats.P "Portfolio.Portfolio.blacklitterman_stats.P (Python parameter) — Analyst's views matrix, can be relative or absolute.")
_, _[Q](https://riskfolio-lib.readthedocs.io/en/latest/portfolio.html#Portfolio.Portfolio.blacklitterman_stats.Q "Portfolio.Portfolio.blacklitterman_stats.Q (Python parameter) — Expected returns of analyst's views.")
_, _[rf](https://riskfolio-lib.readthedocs.io/en/latest/portfolio.html#Portfolio.Portfolio.blacklitterman_stats.rf "Portfolio.Portfolio.blacklitterman_stats.rf (Python parameter) — Risk free rate.")
\=`0`_, _[w](https://riskfolio-lib.readthedocs.io/en/latest/portfolio.html#Portfolio.Portfolio.blacklitterman_stats.w "Portfolio.Portfolio.blacklitterman_stats.w (Python parameter) — Weights matrix, where n_assets is the number of assets. The default is None.")
\=`None`_, _[delta](https://riskfolio-lib.readthedocs.io/en/latest/portfolio.html#Portfolio.Portfolio.blacklitterman_stats.delta "Portfolio.Portfolio.blacklitterman_stats.delta (Python parameter) — Risk aversion factor.")
\=`None`_, _[eq](https://riskfolio-lib.readthedocs.io/en/latest/portfolio.html#Portfolio.Portfolio.blacklitterman_stats.eq "Portfolio.Portfolio.blacklitterman_stats.eq (Python parameter) — Indicates if use equilibrium or historical excess returns. The default is True.")
\=`True`_, _[method\_mu](https://riskfolio-lib.readthedocs.io/en/latest/portfolio.html#Portfolio.Portfolio.blacklitterman_stats.method_mu "Portfolio.Portfolio.blacklitterman_stats.method_mu (Python parameter) — The method used to estimate the expected returns. The default value is 'hist'.")
\=`'hist'`_, _[method\_cov](https://riskfolio-lib.readthedocs.io/en/latest/portfolio.html#Portfolio.Portfolio.blacklitterman_stats.method_cov "Portfolio.Portfolio.blacklitterman_stats.method_cov (Python parameter) — The method used to estimate the covariance matrix. The default is 'hist'.")
\=`'hist'`_, _[dict\_mu](https://riskfolio-lib.readthedocs.io/en/latest/portfolio.html#Portfolio.Portfolio.blacklitterman_stats.dict_mu "Portfolio.Portfolio.blacklitterman_stats.dict_mu (Python parameter) — Other variables related to the mean vector estimation method.")
\=`{}`_, _[dict\_cov](https://riskfolio-lib.readthedocs.io/en/latest/portfolio.html#Portfolio.Portfolio.blacklitterman_stats.dict_cov "Portfolio.Portfolio.blacklitterman_stats.dict_cov (Python parameter) — Other variables related to the covariance estimation method.")
\=`{}`_)[\[source\]](https://riskfolio-lib.readthedocs.io/en/latest/_modules/Portfolio.html#Portfolio.blacklitterman_stats)
[¶](https://riskfolio-lib.readthedocs.io/en/latest/portfolio.html#Portfolio.Portfolio.blacklitterman_stats "Link to this definition")
Calculate the inputs that will be used by the optimization method when we select the input model=’BL’.
Parameters:[¶](https://riskfolio-lib.readthedocs.io/en/latest/portfolio.html#Portfolio.Portfolio.blacklitterman_stats-parameters "Permalink to this headline")
P : DataFrame of shape (n\_views, n\_assets)[¶](https://riskfolio-lib.readthedocs.io/en/latest/portfolio.html#Portfolio.Portfolio.blacklitterman_stats.P "Permalink to this definition")
Analyst’s views matrix, can be relative or absolute.
Q : DataFrame of shape (n\_views, 1)[¶](https://riskfolio-lib.readthedocs.io/en/latest/portfolio.html#Portfolio.Portfolio.blacklitterman_stats.Q "Permalink to this definition")
Expected returns of analyst’s views.
delta : [float](https://docs.python.org/3.11/library/functions.html#float "(in Python v3.11)")
[¶](https://riskfolio-lib.readthedocs.io/en/latest/portfolio.html#Portfolio.Portfolio.blacklitterman_stats.delta "Permalink to this definition")
Risk aversion factor. The default value is 1.
rf : scalar, optional[¶](https://riskfolio-lib.readthedocs.io/en/latest/portfolio.html#Portfolio.Portfolio.blacklitterman_stats.rf "Permalink to this definition")
Risk free rate. The default is 0.
w : DataFrame of shape (n\_assets, 1)[¶](https://riskfolio-lib.readthedocs.io/en/latest/portfolio.html#Portfolio.Portfolio.blacklitterman_stats.w "Permalink to this definition")
Weights matrix, where n\_assets is the number of assets. The default is None.
eq : [bool](https://docs.python.org/3.11/library/functions.html#bool "(in Python v3.11)")
, optional[¶](https://riskfolio-lib.readthedocs.io/en/latest/portfolio.html#Portfolio.Portfolio.blacklitterman_stats.eq "Permalink to this definition")
Indicates if use equilibrium or historical excess returns. The default is True.
method\_mu : [str](https://docs.python.org/3.11/library/stdtypes.html#str "(in Python v3.11)")
, optional[¶](https://riskfolio-lib.readthedocs.io/en/latest/portfolio.html#Portfolio.Portfolio.blacklitterman_stats.method_mu "Permalink to this definition")
The method used to estimate the expected returns. The default value is ‘hist’. Possible values are:
* ’hist’: use historical estimates.
* ’ewma1’’: use ewma with adjust=True, see [EWM](https://pandas.pydata.org/pandas-docs/stable/user_guide/computation.html#exponentially-weighted-windows)
for more details.
* ’ewma2’: use ewma with adjust=False, see [EWM](https://pandas.pydata.org/pandas-docs/stable/user_guide/computation.html#exponentially-weighted-windows)
for more details.
* ’JS’: James-Stein estimator. For more information see \[[A34](https://riskfolio-lib.readthedocs.io/en/latest/portfolio.html#id252 "Attilio Meucci. Risk and Asset Allocation. Springer Berlin Heidelberg, 2005. URL: https://doi.org/10.1007/978-3-540-27904-4, doi:10.1007/978-3-540-27904-4.")\
\] and \[[A35](https://riskfolio-lib.readthedocs.io/en/latest/portfolio.html#id253 "Yiyong Feng and Daniel P. Palomar. A signal processing perspective of financial engineering. Foundations and Trends® in Signal Processing, 9(1-2):1–231, 2016. URL: https://doi.org/10.1561/2000000072, doi:10.1561/2000000072.")\
\].
* ’BS’: Bayes-Stein estimator. For more information see \[[A36](https://riskfolio-lib.readthedocs.io/en/latest/portfolio.html#id254 "Philippe Jorion. Bayes-stein estimation for portfolio analysis. The Journal of Financial and Quantitative Analysis, 21(3):279, September 1986. URL: https://doi.org/10.2307/2331042, doi:10.2307/2331042.")\
\].
* ’BOP’: BOP estimator. For more information see \[[A37](https://riskfolio-lib.readthedocs.io/en/latest/portfolio.html#id255 "Taras Bodnar, Ostap Okhrin, and Nestor Parolya. Optimal shrinkage estimator for high-dimensional mean vector. Journal of Multivariate Analysis, 170:63–79, 03 2019. URL: https://doi.org/10.1016\%2Fj.jmva.2018.07.004, doi:10.1016/j.jmva.2018.07.004.")\
\].
method\_cov : [str](https://docs.python.org/3.11/library/stdtypes.html#str "(in Python v3.11)")
, optional[¶](https://riskfolio-lib.readthedocs.io/en/latest/portfolio.html#Portfolio.Portfolio.blacklitterman_stats.method_cov "Permalink to this definition")
The method used to estimate the covariance matrix. The default is ‘hist’. Possible values are:
* ’hist’: use historical estimates.
* ’ewma1’’: use ewma with adjust=True, see [EWM](https://pandas.pydata.org/pandas-docs/stable/user_guide/computation.html#exponentially-weighted-windows)
for more details.
* ’ewma2’: use ewma with adjust=False, see [EWM](https://pandas.pydata.org/pandas-docs/stable/user_guide/computation.html#exponentially-weighted-windows)
for more details.
* ’ledoit’: use the Ledoit and Wolf Shrinkage method.
* ’oas’: use the Oracle Approximation Shrinkage method.
* ’shrunk’: use the basic Shrunk Covariance method.
* ’gl’: use the basic Graphical Lasso Covariance method.
* ’jlogo’: use the j-LoGo Covariance method. For more information see: \[[A38](https://riskfolio-lib.readthedocs.io/en/latest/portfolio.html#id237 "Wolfram Barfuss, Guido Previde Massara, T. Di Matteo, and Tomaso Aste. Parsimonious modeling with information filtering networks. Physical Review E, 12 2016. URL: http://dx.doi.org/10.1103/PhysRevE.94.062306, doi:10.1103/physreve.94.062306.")\
\].
* ’fixed’: denoise using fixed method. For more information see chapter 2 of \[[A39](https://riskfolio-lib.readthedocs.io/en/latest/portfolio.html#id238 "Marcos M. López de Prado. Machine Learning for Asset Managers. Elements in Quantitative Finance. Cambridge University Press, 2020. doi:10.1017/9781108883658.")\
\].
* ’spectral’: denoise using spectral method. For more information see chapter 2 of \[[A39](https://riskfolio-lib.readthedocs.io/en/latest/portfolio.html#id238 "Marcos M. López de Prado. Machine Learning for Asset Managers. Elements in Quantitative Finance. Cambridge University Press, 2020. doi:10.1017/9781108883658.")\
\].
* ’shrink’: denoise using shrink method. For more information see chapter 2 of \[[A39](https://riskfolio-lib.readthedocs.io/en/latest/portfolio.html#id238 "Marcos M. López de Prado. Machine Learning for Asset Managers. Elements in Quantitative Finance. Cambridge University Press, 2020. doi:10.1017/9781108883658.")\
\].
* ’gerber1’: use the Gerber statistic 1. For more information see: \[[A40](https://riskfolio-lib.readthedocs.io/en/latest/portfolio.html#id242 "Sander Gerber, Harry Markowitz, Philip Ernst, Yinsen Miao, Babak Javid, and Paul Sargen. The gerber statistic: a robust co-movement measure for portfolio optimization. SSRN Electronic Journal, 2021. URL: https://doi.org/10.2139/ssrn.3880054, doi:10.2139/ssrn.3880054.")\
\].
* ’gerber2’: use the Gerber statistic 2. For more information see: \[[A40](https://riskfolio-lib.readthedocs.io/en/latest/portfolio.html#id242 "Sander Gerber, Harry Markowitz, Philip Ernst, Yinsen Miao, Babak Javid, and Paul Sargen. The gerber statistic: a robust co-movement measure for portfolio optimization. SSRN Electronic Journal, 2021. URL: https://doi.org/10.2139/ssrn.3880054, doi:10.2139/ssrn.3880054.")\
\].
dict\_mu : [dict](https://docs.python.org/3.11/library/stdtypes.html#dict "(in Python v3.11)")
[¶](https://riskfolio-lib.readthedocs.io/en/latest/portfolio.html#Portfolio.Portfolio.blacklitterman_stats.dict_mu "Permalink to this definition")
Other variables related to the mean vector estimation method.
dict\_cov : [dict](https://docs.python.org/3.11/library/stdtypes.html#dict "(in Python v3.11)")
[¶](https://riskfolio-lib.readthedocs.io/en/latest/portfolio.html#Portfolio.Portfolio.blacklitterman_stats.dict_cov "Permalink to this definition")
Other variables related to the covariance estimation method.
See also
`riskfolio.src.ParamsEstimation.black_litterman`
factors\_stats(_[method\_mu](https://riskfolio-lib.readthedocs.io/en/latest/portfolio.html#Portfolio.Portfolio.factors_stats.method_mu "Portfolio.Portfolio.factors_stats.method_mu (Python parameter) — The method used to estimate the expected returns. The default value is 'hist'.")
\=`'hist'`_, _[method\_cov](https://riskfolio-lib.readthedocs.io/en/latest/portfolio.html#Portfolio.Portfolio.factors_stats.method_cov "Portfolio.Portfolio.factors_stats.method_cov (Python parameter) — The method used to estimate the covariance matrix. The default is 'hist'.")
\=`'hist'`_, _[method\_kurt](https://riskfolio-lib.readthedocs.io/en/latest/portfolio.html#Portfolio.Portfolio.factors_stats.method_kurt "Portfolio.Portfolio.factors_stats.method_kurt (Python parameter) — The method used to estimate the cokurtosis square matrix: The default is 'hist'.")
\=`'hist'`_, _[B](https://riskfolio-lib.readthedocs.io/en/latest/portfolio.html#Portfolio.Portfolio.factors_stats.B "Portfolio.Portfolio.factors_stats.B (Python parameter) — Loadings matrix, where the number of rows represent the assets and the columns the risk factors.")
\=`None`_, _[const](https://riskfolio-lib.readthedocs.io/en/latest/portfolio.html#Portfolio.Portfolio.factors_stats.const "Portfolio.Portfolio.factors_stats.const (Python parameter) — Indicate if the loadings matrix has a constant. The default is False.")
\=`True`_, _[higher\_comoments](https://riskfolio-lib.readthedocs.io/en/latest/portfolio.html#Portfolio.Portfolio.factors_stats "Portfolio.Portfolio.factors_stats.higher_comoments (Python parameter)")
\=`False`_, _[dict\_load](https://riskfolio-lib.readthedocs.io/en/latest/portfolio.html#Portfolio.Portfolio.factors_stats.dict_load "Portfolio.Portfolio.factors_stats.dict_load (Python parameter) — Other variables related to the loadings matrix estimation.")
\=`{}`_, _[dict\_mu](https://riskfolio-lib.readthedocs.io/en/latest/portfolio.html#Portfolio.Portfolio.factors_stats.dict_mu "Portfolio.Portfolio.factors_stats.dict_mu (Python parameter) — Other variables related to the mean vector estimation method.")
\=`{}`_, _[dict\_cov](https://riskfolio-lib.readthedocs.io/en/latest/portfolio.html#Portfolio.Portfolio.factors_stats.dict_cov "Portfolio.Portfolio.factors_stats.dict_cov (Python parameter) — Other variables related to the covariance estimation method.")
\=`{}`_, _[dict\_kurt](https://riskfolio-lib.readthedocs.io/en/latest/portfolio.html#Portfolio.Portfolio.factors_stats.dict_kurt "Portfolio.Portfolio.factors_stats.dict_kurt (Python parameter) — Other variables related to the cokurtosis estimation.")
\=`{}`_)[\[source\]](https://riskfolio-lib.readthedocs.io/en/latest/_modules/Portfolio.html#Portfolio.factors_stats)
[¶](https://riskfolio-lib.readthedocs.io/en/latest/portfolio.html#Portfolio.Portfolio.factors_stats "Link to this definition")
Calculate the inputs that will be used by the optimization method when we select the input model=’FM’.
Parameters:[¶](https://riskfolio-lib.readthedocs.io/en/latest/portfolio.html#Portfolio.Portfolio.factors_stats-parameters "Permalink to this headline")
method\_mu : [str](https://docs.python.org/3.11/library/stdtypes.html#str "(in Python v3.11)")
, optional[¶](https://riskfolio-lib.readthedocs.io/en/latest/portfolio.html#Portfolio.Portfolio.factors_stats.method_mu "Permalink to this definition")
The method used to estimate the expected returns. The default value is ‘hist’. Possible values are:
* ’hist’: use historical estimates.
* ’ewma1’’: use ewma with adjust=True, see [EWM](https://pandas.pydata.org/pandas-docs/stable/user_guide/computation.html#exponentially-weighted-windows)
for more details.
* ’ewma2’: use ewma with adjust=False, see [EWM](https://pandas.pydata.org/pandas-docs/stable/user_guide/computation.html#exponentially-weighted-windows)
for more details.
* ’JS’: James-Stein estimator. For more information see \[[A34](https://riskfolio-lib.readthedocs.io/en/latest/portfolio.html#id252 "Attilio Meucci. Risk and Asset Allocation. Springer Berlin Heidelberg, 2005. URL: https://doi.org/10.1007/978-3-540-27904-4, doi:10.1007/978-3-540-27904-4.")\
\] and \[[A35](https://riskfolio-lib.readthedocs.io/en/latest/portfolio.html#id253 "Yiyong Feng and Daniel P. Palomar. A signal processing perspective of financial engineering. Foundations and Trends® in Signal Processing, 9(1-2):1–231, 2016. URL: https://doi.org/10.1561/2000000072, doi:10.1561/2000000072.")\
\].
* ’BS’: Bayes-Stein estimator. For more information see \[[A36](https://riskfolio-lib.readthedocs.io/en/latest/portfolio.html#id254 "Philippe Jorion. Bayes-stein estimation for portfolio analysis. The Journal of Financial and Quantitative Analysis, 21(3):279, September 1986. URL: https://doi.org/10.2307/2331042, doi:10.2307/2331042.")\
\].
* ’BOP’: BOP estimator. For more information see \[[A37](https://riskfolio-lib.readthedocs.io/en/latest/portfolio.html#id255 "Taras Bodnar, Ostap Okhrin, and Nestor Parolya. Optimal shrinkage estimator for high-dimensional mean vector. Journal of Multivariate Analysis, 170:63–79, 03 2019. URL: https://doi.org/10.1016\%2Fj.jmva.2018.07.004, doi:10.1016/j.jmva.2018.07.004.")\
\].
method\_cov : [str](https://docs.python.org/3.11/library/stdtypes.html#str "(in Python v3.11)")
, optional[¶](https://riskfolio-lib.readthedocs.io/en/latest/portfolio.html#Portfolio.Portfolio.factors_stats.method_cov "Permalink to this definition")
The method used to estimate the covariance matrix. The default is ‘hist’. Possible values are:
* ’hist’: use historical estimates.
* ’ewma1’’: use ewma with adjust=True, see [EWM](https://pandas.pydata.org/pandas-docs/stable/user_guide/computation.html#exponentially-weighted-windows)
for more details.
* ’ewma2’: use ewma with adjust=False, see [EWM](https://pandas.pydata.org/pandas-docs/stable/user_guide/computation.html#exponentially-weighted-windows)
for more details.
* ’ledoit’: use the Ledoit and Wolf Shrinkage method.
* ’oas’: use the Oracle Approximation Shrinkage method.
* ’shrunk’: use the basic Shrunk Covariance method.
* ’gl’: use the basic Graphical Lasso Covariance method.
* ’jlogo’: use the j-LoGo Covariance method. For more information see: \[[A38](https://riskfolio-lib.readthedocs.io/en/latest/portfolio.html#id237 "Wolfram Barfuss, Guido Previde Massara, T. Di Matteo, and Tomaso Aste. Parsimonious modeling with information filtering networks. Physical Review E, 12 2016. URL: http://dx.doi.org/10.1103/PhysRevE.94.062306, doi:10.1103/physreve.94.062306.")\
\].
* ’fixed’: denoise using fixed method. For more information see chapter 2 of \[[A39](https://riskfolio-lib.readthedocs.io/en/latest/portfolio.html#id238 "Marcos M. López de Prado. Machine Learning for Asset Managers. Elements in Quantitative Finance. Cambridge University Press, 2020. doi:10.1017/9781108883658.")\
\].
* ’spectral’: denoise using spectral method. For more information see chapter 2 of \[[A39](https://riskfolio-lib.readthedocs.io/en/latest/portfolio.html#id238 "Marcos M. López de Prado. Machine Learning for Asset Managers. Elements in Quantitative Finance. Cambridge University Press, 2020. doi:10.1017/9781108883658.")\
\].
* ’shrink’: denoise using shrink method. For more information see chapter 2 of \[[A39](https://riskfolio-lib.readthedocs.io/en/latest/portfolio.html#id238 "Marcos M. López de Prado. Machine Learning for Asset Managers. Elements in Quantitative Finance. Cambridge University Press, 2020. doi:10.1017/9781108883658.")\
\].
* ’gerber1’: use the Gerber statistic 1. For more information see: \[[A40](https://riskfolio-lib.readthedocs.io/en/latest/portfolio.html#id242 "Sander Gerber, Harry Markowitz, Philip Ernst, Yinsen Miao, Babak Javid, and Paul Sargen. The gerber statistic: a robust co-movement measure for portfolio optimization. SSRN Electronic Journal, 2021. URL: https://doi.org/10.2139/ssrn.3880054, doi:10.2139/ssrn.3880054.")\
\].
* ’gerber2’: use the Gerber statistic 2. For more information see: \[[A40](https://riskfolio-lib.readthedocs.io/en/latest/portfolio.html#id242 "Sander Gerber, Harry Markowitz, Philip Ernst, Yinsen Miao, Babak Javid, and Paul Sargen. The gerber statistic: a robust co-movement measure for portfolio optimization. SSRN Electronic Journal, 2021. URL: https://doi.org/10.2139/ssrn.3880054, doi:10.2139/ssrn.3880054.")\
\].
method\_kurt : [str](https://docs.python.org/3.11/library/stdtypes.html#str "(in Python v3.11)")
, optional[¶](https://riskfolio-lib.readthedocs.io/en/latest/portfolio.html#Portfolio.Portfolio.factors_stats.method_kurt "Permalink to this definition")
The method used to estimate the cokurtosis square matrix: The default is ‘hist’. Possible values are:
* ’hist’: use historical estimates.
* ’semi’: use semi lower cokurtosis square matrix.
* ’fixed’: denoise using fixed method. For more information see chapter 2 of \[[B1](https://riskfolio-lib.readthedocs.io/en/latest/parameters.html#id142 "Marcos M. López de Prado. Machine Learning for Asset Managers. Elements in Quantitative Finance. Cambridge University Press, 2020. doi:10.1017/9781108883658.")\
\].
* ’spectral’: denoise using spectral method. For more information see chapter 2 of \[[B1](https://riskfolio-lib.readthedocs.io/en/latest/parameters.html#id142 "Marcos M. López de Prado. Machine Learning for Asset Managers. Elements in Quantitative Finance. Cambridge University Press, 2020. doi:10.1017/9781108883658.")\
\].
* ’shrink’: denoise using shrink method. For more information see chapter 2 of \[[B1](https://riskfolio-lib.readthedocs.io/en/latest/parameters.html#id142 "Marcos M. López de Prado. Machine Learning for Asset Managers. Elements in Quantitative Finance. Cambridge University Press, 2020. doi:10.1017/9781108883658.")\
\].
B : DataFrame of shape (n\_assets, n\_factors), optional[¶](https://riskfolio-lib.readthedocs.io/en/latest/portfolio.html#Portfolio.Portfolio.factors_stats.B "Permalink to this definition")
Loadings matrix, where the number of rows represent the assets and the columns the risk factors. If is not specified, is estimated using stepwise regression. The default is None.
const : [bool](https://docs.python.org/3.11/library/functions.html#bool "(in Python v3.11)")
, optional[¶](https://riskfolio-lib.readthedocs.io/en/latest/portfolio.html#Portfolio.Portfolio.factors_stats.const "Permalink to this definition")
Indicate if the loadings matrix has a constant. The default is False.
dict\_load : [dict](https://docs.python.org/3.11/library/stdtypes.html#dict "(in Python v3.11)")
[¶](https://riskfolio-lib.readthedocs.io/en/latest/portfolio.html#Portfolio.Portfolio.factors_stats.dict_load "Permalink to this definition")
Other variables related to the loadings matrix estimation.
dict\_mu : [dict](https://docs.python.org/3.11/library/stdtypes.html#dict "(in Python v3.11)")
[¶](https://riskfolio-lib.readthedocs.io/en/latest/portfolio.html#Portfolio.Portfolio.factors_stats.dict_mu "Permalink to this definition")
Other variables related to the mean vector estimation method.
dict\_cov : [dict](https://docs.python.org/3.11/library/stdtypes.html#dict "(in Python v3.11)")
[¶](https://riskfolio-lib.readthedocs.io/en/latest/portfolio.html#Portfolio.Portfolio.factors_stats.dict_cov "Permalink to this definition")
Other variables related to the covariance estimation method.
dict\_kurt : [dict](https://docs.python.org/3.11/library/stdtypes.html#dict "(in Python v3.11)")
[¶](https://riskfolio-lib.readthedocs.io/en/latest/portfolio.html#Portfolio.Portfolio.factors_stats.dict_kurt "Permalink to this definition")
Other variables related to the cokurtosis estimation.
See also
`riskfolio.src.ParamsEstimation.forward_regression`, `riskfolio.src.ParamsEstimation.backward_regression`, `riskfolio.src.ParamsEstimation.loadings_matrix`, `riskfolio.src.ParamsEstimation.risk_factors`
blfactors\_stats(_[flavor](https://riskfolio-lib.readthedocs.io/en/latest/portfolio.html#Portfolio.Portfolio.blfactors_stats.flavor "Portfolio.Portfolio.blfactors_stats.flavor (Python parameter) — Model used, can be 'BLB' for Black Litterman Bayesian or 'ABL' for Augmented Black Litterman.")
\=`'BLB'`_, _[B](https://riskfolio-lib.readthedocs.io/en/latest/portfolio.html#Portfolio.Portfolio.blfactors_stats.B "Portfolio.Portfolio.blfactors_stats.B (Python parameter) — Loadings matrix.")
\=`None`_, _[P](https://riskfolio-lib.readthedocs.io/en/latest/portfolio.html#Portfolio.Portfolio.blfactors_stats.P "Portfolio.Portfolio.blfactors_stats.P (Python parameter) — Analyst's views matrix, can be relative or absolute.")
\=`None`_, _[Q](https://riskfolio-lib.readthedocs.io/en/latest/portfolio.html#Portfolio.Portfolio.blfactors_stats.Q "Portfolio.Portfolio.blfactors_stats.Q (Python parameter) — Expected returns of analyst's views.")
\=`None`_, _[P\_f](https://riskfolio-lib.readthedocs.io/en/latest/portfolio.html#Portfolio.Portfolio.blfactors_stats.P_f "Portfolio.Portfolio.blfactors_stats.P_f (Python parameter) — Analyst's factors views matrix, can be relative or absolute.")
\=`None`_, _[Q\_f](https://riskfolio-lib.readthedocs.io/en/latest/portfolio.html#Portfolio.Portfolio.blfactors_stats.Q_f "Portfolio.Portfolio.blfactors_stats.Q_f (Python parameter) — Expected returns of analyst's factors views.")
\=`None`_, _[rf](https://riskfolio-lib.readthedocs.io/en/latest/portfolio.html#Portfolio.Portfolio.blfactors_stats.rf "Portfolio.Portfolio.blfactors_stats.rf (Python parameter) — Risk free rate.")
\=`0`_, _[w](https://riskfolio-lib.readthedocs.io/en/latest/portfolio.html#Portfolio.Portfolio.blfactors_stats.w "Portfolio.Portfolio.blfactors_stats.w (Python parameter) — Weights matrix, where n_assets is the number of assets. The default is None.")
\=`None`_, _[delta](https://riskfolio-lib.readthedocs.io/en/latest/portfolio.html#Portfolio.Portfolio.blfactors_stats.delta "Portfolio.Portfolio.blfactors_stats.delta (Python parameter) — Risk aversion factor.")
\=`None`_, _[eq](https://riskfolio-lib.readthedocs.io/en/latest/portfolio.html#Portfolio.Portfolio.blfactors_stats.eq "Portfolio.Portfolio.blfactors_stats.eq (Python parameter) — Indicates if use equilibrium or historical excess returns. The default is True.")
\=`True`_, _[const](https://riskfolio-lib.readthedocs.io/en/latest/portfolio.html#Portfolio.Portfolio.blfactors_stats.const "Portfolio.Portfolio.blfactors_stats.const (Python parameter) — Indicate if the loadings matrix has a constant. The default is False.")
\=`True`_, _[method\_mu](https://riskfolio-lib.readthedocs.io/en/latest/portfolio.html#Portfolio.Portfolio.blfactors_stats.method_mu "Portfolio.Portfolio.blfactors_stats.method_mu (Python parameter) — The method used to estimate the expected returns. The default value is 'hist'.")
\=`'hist'`_, _[method\_cov](https://riskfolio-lib.readthedocs.io/en/latest/portfolio.html#Portfolio.Portfolio.blfactors_stats.method_cov "Portfolio.Portfolio.blfactors_stats.method_cov (Python parameter) — The method used to estimate the covariance matrix: The default is 'hist'.")
\=`'hist'`_, _[dict\_load](https://riskfolio-lib.readthedocs.io/en/latest/portfolio.html#Portfolio.Portfolio.blfactors_stats.dict_load "Portfolio.Portfolio.blfactors_stats.dict_load (Python parameter) — Other variables related to the loadings matrix estimation.")
\=`{}`_, _[dict\_mu](https://riskfolio-lib.readthedocs.io/en/latest/portfolio.html#Portfolio.Portfolio.blfactors_stats.dict_mu "Portfolio.Portfolio.blfactors_stats.dict_mu (Python parameter) — Other variables related to the mean vector estimation method.")
\=`{}`_, _[dict\_cov](https://riskfolio-lib.readthedocs.io/en/latest/portfolio.html#Portfolio.Portfolio.blfactors_stats.dict_cov "Portfolio.Portfolio.blfactors_stats.dict_cov (Python parameter) — Other variables related to the covariance estimation method.")
\=`{}`_)[\[source\]](https://riskfolio-lib.readthedocs.io/en/latest/_modules/Portfolio.html#Portfolio.blfactors_stats)
[¶](https://riskfolio-lib.readthedocs.io/en/latest/portfolio.html#Portfolio.Portfolio.blfactors_stats "Link to this definition")
Calculate the inputs that will be used by the optimization method when we select the input model=’BL’.
Parameters:[¶](https://riskfolio-lib.readthedocs.io/en/latest/portfolio.html#Portfolio.Portfolio.blfactors_stats-parameters "Permalink to this headline")
flavor : [str](https://docs.python.org/3.11/library/stdtypes.html#str "(in Python v3.11)")
[¶](https://riskfolio-lib.readthedocs.io/en/latest/portfolio.html#Portfolio.Portfolio.blfactors_stats.flavor "Permalink to this definition")
Model used, can be ‘BLB’ for Black Litterman Bayesian or ‘ABL’ for Augmented Black Litterman. The default value is ‘BLB’.
B : DataFrame of shape (n\_assets, n\_features)[¶](https://riskfolio-lib.readthedocs.io/en/latest/portfolio.html#Portfolio.Portfolio.blfactors_stats.B "Permalink to this definition")
Loadings matrix. The default value is None.
P : DataFrame of shape (n\_views, n\_assets)[¶](https://riskfolio-lib.readthedocs.io/en/latest/portfolio.html#Portfolio.Portfolio.blfactors_stats.P "Permalink to this definition")
Analyst’s views matrix, can be relative or absolute.
Q : DataFrame of shape (n\_views, 1)[¶](https://riskfolio-lib.readthedocs.io/en/latest/portfolio.html#Portfolio.Portfolio.blfactors_stats.Q "Permalink to this definition")
Expected returns of analyst’s views.
P\_f : DataFrame of shape (n\_views, n\_assets)[¶](https://riskfolio-lib.readthedocs.io/en/latest/portfolio.html#Portfolio.Portfolio.blfactors_stats.P_f "Permalink to this definition")
Analyst’s factors views matrix, can be relative or absolute.
Q\_f : DataFrame of shape (n\_views, 1)[¶](https://riskfolio-lib.readthedocs.io/en/latest/portfolio.html#Portfolio.Portfolio.blfactors_stats.Q_f "Permalink to this definition")
Expected returns of analyst’s factors views.
delta : [float](https://docs.python.org/3.11/library/functions.html#float "(in Python v3.11)")
[¶](https://riskfolio-lib.readthedocs.io/en/latest/portfolio.html#Portfolio.Portfolio.blfactors_stats.delta "Permalink to this definition")
Risk aversion factor. The default value is 1.
rf : scalar, optional[¶](https://riskfolio-lib.readthedocs.io/en/latest/portfolio.html#Portfolio.Portfolio.blfactors_stats.rf "Permalink to this definition")
Risk free rate. The default is 0.
w : DataFrame of shape (n\_assets, 1)[¶](https://riskfolio-lib.readthedocs.io/en/latest/portfolio.html#Portfolio.Portfolio.blfactors_stats.w "Permalink to this definition")
Weights matrix, where n\_assets is the number of assets. The default is None.
eq : [bool](https://docs.python.org/3.11/library/functions.html#bool "(in Python v3.11)")
, optional[¶](https://riskfolio-lib.readthedocs.io/en/latest/portfolio.html#Portfolio.Portfolio.blfactors_stats.eq "Permalink to this definition")
Indicates if use equilibrium or historical excess returns. The default is True.
const : [bool](https://docs.python.org/3.11/library/functions.html#bool "(in Python v3.11)")
, optional[¶](https://riskfolio-lib.readthedocs.io/en/latest/portfolio.html#Portfolio.Portfolio.blfactors_stats.const "Permalink to this definition")
Indicate if the loadings matrix has a constant. The default is False.
method\_mu : [str](https://docs.python.org/3.11/library/stdtypes.html#str "(in Python v3.11)")
, optional[¶](https://riskfolio-lib.readthedocs.io/en/latest/portfolio.html#Portfolio.Portfolio.blfactors_stats.method_mu "Permalink to this definition")
The method used to estimate the expected returns. The default value is ‘hist’. Possible values are:
* ’hist’: use historical estimates.
* ’ewma1’’: use ewma with adjust=True, see [EWM](https://pandas.pydata.org/pandas-docs/stable/user_guide/computation.html#exponentially-weighted-windows)
for more details.
* ’ewma2’: use ewma with adjust=False, see [EWM](https://pandas.pydata.org/pandas-docs/stable/user_guide/computation.html#exponentially-weighted-windows)
for more details.
* ’JS’: James-Stein estimator. For more information see \[[A34](https://riskfolio-lib.readthedocs.io/en/latest/portfolio.html#id252 "Attilio Meucci. Risk and Asset Allocation. Springer Berlin Heidelberg, 2005. URL: https://doi.org/10.1007/978-3-540-27904-4, doi:10.1007/978-3-540-27904-4.")\
\] and \[[A35](https://riskfolio-lib.readthedocs.io/en/latest/portfolio.html#id253 "Yiyong Feng and Daniel P. Palomar. A signal processing perspective of financial engineering. Foundations and Trends® in Signal Processing, 9(1-2):1–231, 2016. URL: https://doi.org/10.1561/2000000072, doi:10.1561/2000000072.")\
\].
* ’BS’: Bayes-Stein estimator. For more information see \[[A36](https://riskfolio-lib.readthedocs.io/en/latest/portfolio.html#id254 "Philippe Jorion. Bayes-stein estimation for portfolio analysis. The Journal of Financial and Quantitative Analysis, 21(3):279, September 1986. URL: https://doi.org/10.2307/2331042, doi:10.2307/2331042.")\
\].
* ’BOP’: BOP estimator. For more information see \[[A37](https://riskfolio-lib.readthedocs.io/en/latest/portfolio.html#id255 "Taras Bodnar, Ostap Okhrin, and Nestor Parolya. Optimal shrinkage estimator for high-dimensional mean vector. Journal of Multivariate Analysis, 170:63–79, 03 2019. URL: https://doi.org/10.1016\%2Fj.jmva.2018.07.004, doi:10.1016/j.jmva.2018.07.004.")\
\].
method\_cov : [str](https://docs.python.org/3.11/library/stdtypes.html#str "(in Python v3.11)")
, optional[¶](https://riskfolio-lib.readthedocs.io/en/latest/portfolio.html#Portfolio.Portfolio.blfactors_stats.method_cov "Permalink to this definition")
The method used to estimate the covariance matrix: The default is ‘hist’. Possible values are:
* ’hist’: use historical estimates.
* ’ewma1’’: use ewma with adjust=True, see [EWM](https://pandas.pydata.org/pandas-docs/stable/user_guide/computation.html#exponentially-weighted-windows)
for more details.
* ’ewma2’: use ewma with adjust=False, see [EWM](https://pandas.pydata.org/pandas-docs/stable/user_guide/computation.html#exponentially-weighted-windows)
for more details.
* ’ledoit’: use the Ledoit and Wolf Shrinkage method.
* ’oas’: use the Oracle Approximation Shrinkage method.
* ’shrunk’: use the basic Shrunk Covariance method.
* ’gl’: use the basic Graphical Lasso Covariance method.
* ’jlogo’: use the j-LoGo Covariance method. For more information see: \[[A38](https://riskfolio-lib.readthedocs.io/en/latest/portfolio.html#id237 "Wolfram Barfuss, Guido Previde Massara, T. Di Matteo, and Tomaso Aste. Parsimonious modeling with information filtering networks. Physical Review E, 12 2016. URL: http://dx.doi.org/10.1103/PhysRevE.94.062306, doi:10.1103/physreve.94.062306.")\
\].
* ’fixed’: denoise using fixed method. For more information see chapter 2 of \[[A39](https://riskfolio-lib.readthedocs.io/en/latest/portfolio.html#id238 "Marcos M. López de Prado. Machine Learning for Asset Managers. Elements in Quantitative Finance. Cambridge University Press, 2020. doi:10.1017/9781108883658.")\
\].
* ’spectral’: denoise using spectral method. For more information see chapter 2 of \[[A39](https://riskfolio-lib.readthedocs.io/en/latest/portfolio.html#id238 "Marcos M. López de Prado. Machine Learning for Asset Managers. Elements in Quantitative Finance. Cambridge University Press, 2020. doi:10.1017/9781108883658.")\
\].
* ’shrink’: denoise using shrink method. For more information see chapter 2 of \[[A39](https://riskfolio-lib.readthedocs.io/en/latest/portfolio.html#id238 "Marcos M. López de Prado. Machine Learning for Asset Managers. Elements in Quantitative Finance. Cambridge University Press, 2020. doi:10.1017/9781108883658.")\
\].
* ’gerber1’: use the Gerber statistic 1. For more information see: \[[A40](https://riskfolio-lib.readthedocs.io/en/latest/portfolio.html#id242 "Sander Gerber, Harry Markowitz, Philip Ernst, Yinsen Miao, Babak Javid, and Paul Sargen. The gerber statistic: a robust co-movement measure for portfolio optimization. SSRN Electronic Journal, 2021. URL: https://doi.org/10.2139/ssrn.3880054, doi:10.2139/ssrn.3880054.")\
\].
* ’gerber2’: use the Gerber statistic 2. For more information see: \[[A40](https://riskfolio-lib.readthedocs.io/en/latest/portfolio.html#id242 "Sander Gerber, Harry Markowitz, Philip Ernst, Yinsen Miao, Babak Javid, and Paul Sargen. The gerber statistic: a robust co-movement measure for portfolio optimization. SSRN Electronic Journal, 2021. URL: https://doi.org/10.2139/ssrn.3880054, doi:10.2139/ssrn.3880054.")\
\].
dict\_load : [dict](https://docs.python.org/3.11/library/stdtypes.html#dict "(in Python v3.11)")
[¶](https://riskfolio-lib.readthedocs.io/en/latest/portfolio.html#Portfolio.Portfolio.blfactors_stats.dict_load "Permalink to this definition")
Other variables related to the loadings matrix estimation.
dict\_mu : [dict](https://docs.python.org/3.11/library/stdtypes.html#dict "(in Python v3.11)")
[¶](https://riskfolio-lib.readthedocs.io/en/latest/portfolio.html#Portfolio.Portfolio.blfactors_stats.dict_mu "Permalink to this definition")
Other variables related to the mean vector estimation method.
dict\_cov : [dict](https://docs.python.org/3.11/library/stdtypes.html#dict "(in Python v3.11)")
[¶](https://riskfolio-lib.readthedocs.io/en/latest/portfolio.html#Portfolio.Portfolio.blfactors_stats.dict_cov "Permalink to this definition")
Other variables related to the covariance estimation method.
See also
`riskfolio.src.ParamsEstimation.augmented_black_litterman`, `riskfolio.src.ParamsEstimation.black_litterman_bayesian`
wc\_stats(_[box](https://riskfolio-lib.readthedocs.io/en/latest/portfolio.html#Portfolio.Portfolio.wc_stats.box "Portfolio.Portfolio.wc_stats.box (Python parameter) — The method used to estimate the box uncertainty sets.")
\=`'s'`_, _[ellip](https://riskfolio-lib.readthedocs.io/en/latest/portfolio.html#Portfolio.Portfolio.wc_stats.ellip "Portfolio.Portfolio.wc_stats.ellip (Python parameter) — The method used to estimate the elliptical uncertainty sets.")
\=`'s'`_, _[q](https://riskfolio-lib.readthedocs.io/en/latest/portfolio.html#Portfolio.Portfolio.wc_stats.q "Portfolio.Portfolio.wc_stats.q (Python parameter) — Significance level of the selected bootstrapping method. The default is 0.05.")
\=`0.05`_, _[n\_sim](https://riskfolio-lib.readthedocs.io/en/latest/portfolio.html#Portfolio.Portfolio.wc_stats.n_sim "Portfolio.Portfolio.wc_stats.n_sim (Python parameter) — Number of simulations of the bootstrapping method. The default is 3000.")
\=`3000`_, _[window](https://riskfolio-lib.readthedocs.io/en/latest/portfolio.html#Portfolio.Portfolio.wc_stats.window "Portfolio.Portfolio.wc_stats.window (Python parameter) — Block size of the bootstrapping method.")
\=`3`_, _[diag](https://riskfolio-lib.readthedocs.io/en/latest/portfolio.html#Portfolio.Portfolio.wc_stats.diag "Portfolio.Portfolio.wc_stats.diag (Python parameter) — If consider only the main diagonal of covariance matrices of estimation errors following a-fabozzi2007robust.")
\=`False`_, _[threshold](https://riskfolio-lib.readthedocs.io/en/latest/portfolio.html#Portfolio.Portfolio.wc_stats.threshold "Portfolio.Portfolio.wc_stats.threshold (Python parameter) — Parameter used to fix covariance matrices in case they are not positive semidefinite. The default is 1e-10.")
\=`1e-15`_, _[dmu](https://riskfolio-lib.readthedocs.io/en/latest/portfolio.html#Portfolio.Portfolio.wc_stats.dmu "Portfolio.Portfolio.wc_stats.dmu (Python parameter) — Percentage used by delta method to increase and decrease the mean vector in box constraints. The default is 0.1.")
\=`0.1`_, _[dcov](https://riskfolio-lib.readthedocs.io/en/latest/portfolio.html#Portfolio.Portfolio.wc_stats.dcov "Portfolio.Portfolio.wc_stats.dcov (Python parameter) — Percentage used by delta method to increase and decrease the covariance matrix in box constraints. The default is 0.1.")
\=`0.1`_, _[method\_k\_mu](https://riskfolio-lib.readthedocs.io/en/latest/portfolio.html#Portfolio.Portfolio.wc_stats.method_k_mu "Portfolio.Portfolio.wc_stats.method_k_mu (Python parameter) — Method used to calculate the distance parameter of the elliptical uncertainty set of the mean. The default is 'normal'.")
\=`'normal'`_, _[method\_k\_sigma](https://riskfolio-lib.readthedocs.io/en/latest/portfolio.html#Portfolio.Portfolio.wc_stats.method_k_sigma "Portfolio.Portfolio.wc_stats.method_k_sigma (Python parameter) — Method used to calculate the distance parameter of the elliptical uncertainty set of the covariance matrix. The default is 'normal'.")
\=`'normal'`_, _[seed](https://riskfolio-lib.readthedocs.io/en/latest/portfolio.html#Portfolio.Portfolio.wc_stats.seed "Portfolio.Portfolio.wc_stats.seed (Python parameter) — Seed used to generate the boostrapping sample.")
\=`0`_)[\[source\]](https://riskfolio-lib.readthedocs.io/en/latest/_modules/Portfolio.html#Portfolio.wc_stats)
[¶](https://riskfolio-lib.readthedocs.io/en/latest/portfolio.html#Portfolio.Portfolio.wc_stats "Link to this definition")
Calculate the inputs that will be used by the wc\_optimization method.
Parameters:[¶](https://riskfolio-lib.readthedocs.io/en/latest/portfolio.html#Portfolio.Portfolio.wc_stats-parameters "Permalink to this headline")
box : string[¶](https://riskfolio-lib.readthedocs.io/en/latest/portfolio.html#Portfolio.Portfolio.wc_stats.box "Permalink to this definition")
The method used to estimate the box uncertainty sets. The default is ‘s’. Possible values are:
* ’s’: stationary bootstrapping method.
* ’c’: circular bootstrapping method.
* ’m’: moving bootstrapping method.
* ’n’: assuming normal returns to calculate confidence levels.
* ’d’: delta method, this method increase and decrease by a percentage.
ellip : string[¶](https://riskfolio-lib.readthedocs.io/en/latest/portfolio.html#Portfolio.Portfolio.wc_stats.ellip "Permalink to this definition")
The method used to estimate the elliptical uncertainty sets. The default is ‘s’. Possible values are:
* ’s’: stationary bootstrapping method.
* ’c’: circular bootstrapping method.
* ’m’: moving bootstrapping method.
* ’n’: assuming normal returns to calculate confidence levels.
q : scalar[¶](https://riskfolio-lib.readthedocs.io/en/latest/portfolio.html#Portfolio.Portfolio.wc_stats.q "Permalink to this definition")
Significance level of the selected bootstrapping method. The default is 0.05.
n\_sim : scalar[¶](https://riskfolio-lib.readthedocs.io/en/latest/portfolio.html#Portfolio.Portfolio.wc_stats.n_sim "Permalink to this definition")
Number of simulations of the bootstrapping method. The default is 3000.
window\=`3`[¶](https://riskfolio-lib.readthedocs.io/en/latest/portfolio.html#Portfolio.Portfolio.wc_stats.window "Permalink to this definition")
Block size of the bootstrapping method. Must be greather than 1 and lower than the n\_samples - n\_features + 1 The default is 3.
diag : [bool](https://docs.python.org/3.11/library/functions.html#bool "(in Python v3.11)")
[¶](https://riskfolio-lib.readthedocs.io/en/latest/portfolio.html#Portfolio.Portfolio.wc_stats.diag "Permalink to this definition")
If consider only the main diagonal of covariance matrices of estimation errors following \[[A27](https://riskfolio-lib.readthedocs.io/en/latest/portfolio.html#id211 "Frank Fabozzi. Robust portfolio optimization and management. John Wiley, Hoboken, N.J, 2007. ISBN 978-0-471-92122-6.")\
\]. The default is False.
threshold : [float](https://docs.python.org/3.11/library/functions.html#float "(in Python v3.11)")
[¶](https://riskfolio-lib.readthedocs.io/en/latest/portfolio.html#Portfolio.Portfolio.wc_stats.threshold "Permalink to this definition")
Parameter used to fix covariance matrices in case they are not positive semidefinite. The default is 1e-10.
dmu : scalar[¶](https://riskfolio-lib.readthedocs.io/en/latest/portfolio.html#Portfolio.Portfolio.wc_stats.dmu "Permalink to this definition")
Percentage used by delta method to increase and decrease the mean vector in box constraints. The default is 0.1.
dcov : scalar[¶](https://riskfolio-lib.readthedocs.io/en/latest/portfolio.html#Portfolio.Portfolio.wc_stats.dcov "Permalink to this definition")
Percentage used by delta method to increase and decrease the covariance matrix in box constraints. The default is 0.1.
method\_k\_mu : string or [int](https://docs.python.org/3.11/library/functions.html#int "(in Python v3.11)")
or [float](https://docs.python.org/3.11/library/functions.html#float "(in Python v3.11)")
[¶](https://riskfolio-lib.readthedocs.io/en/latest/portfolio.html#Portfolio.Portfolio.wc_stats.method_k_mu "Permalink to this definition")
Method used to calculate the distance parameter of the elliptical uncertainty set of the mean. The default is ‘normal’. Possible values are:
> * ’normal’: assumes normal distribution of returns. Uses a bootstrapping method. \[[A41](https://riskfolio-lib.readthedocs.io/en/latest/portfolio.html#id257 "Mingyu Yang. Uncertainty set sizes, sensitivity analysis, in robust portfolio optimization. Master's thesis, University of Waterloo, 2019. URL: https://www.math.uwaterloo.ca/~hwolkowi/henry/reports/MingyuYangCM-eresearchpaper-printcopy.pdf.")\
> \] and \[[A42](https://riskfolio-lib.readthedocs.io/en/latest/portfolio.html#id259 "Reha H. Tütüncü and Matthias Koenig. Robust asset allocation. Annals of Operations Research, 132:157-187, 2004. URL: https://api.semanticscholar.org/CorpusID:2669348.")\
> \] .
>
> * ’general’: for any possible distribution of returns. Uses the ratio √((1-q)/q). \[[A43](https://riskfolio-lib.readthedocs.io/en/latest/portfolio.html#id202 "Frank J Fabozzi, Petter N Kolm, Dessislava A Pachamanova, and Sergio M Focardi. Robust Portfolio Optimization and Management. John Wiley & Sons, Nashville, TN, 05 2007.")\
> \] and \[[A44](https://riskfolio-lib.readthedocs.io/en/latest/portfolio.html#id260 "Laurent El Ghaoui, Maksim Oks, and Francois Oustry. Worst-case value-at-risk and robust portfolio optimization: a conic programming approach. Oper. Res., 51(4):543–556, 2003.")\
> \].
>
> * int or float value: we can use a custom distance parameter, that following lobo could be 1 or a near parameter. \[[A26](https://riskfolio-lib.readthedocs.io/en/latest/portfolio.html#id212 "Miguel Sousa Lobo and Stephen Boyd. The worst-case risk of a portfolio. 10 2000.")\
> \].
>
method\_k\_sigma : string or [int](https://docs.python.org/3.11/library/functions.html#int "(in Python v3.11)")
or [float](https://docs.python.org/3.11/library/functions.html#float "(in Python v3.11)")
[¶](https://riskfolio-lib.readthedocs.io/en/latest/portfolio.html#Portfolio.Portfolio.wc_stats.method_k_sigma "Permalink to this definition")
Method used to calculate the distance parameter of the elliptical uncertainty set of the covariance matrix. The default is ‘normal’. Possible values are:
> * ’normal’: assumes normal distribution of returns. Uses a bootstrapping method. \[[A41](https://riskfolio-lib.readthedocs.io/en/latest/portfolio.html#id257 "Mingyu Yang. Uncertainty set sizes, sensitivity analysis, in robust portfolio optimization. Master's thesis, University of Waterloo, 2019. URL: https://www.math.uwaterloo.ca/~hwolkowi/henry/reports/MingyuYangCM-eresearchpaper-printcopy.pdf.")\
> \] and \[[A42](https://riskfolio-lib.readthedocs.io/en/latest/portfolio.html#id259 "Reha H. Tütüncü and Matthias Koenig. Robust asset allocation. Annals of Operations Research, 132:157-187, 2004. URL: https://api.semanticscholar.org/CorpusID:2669348.")\
> \] .
>
> * ’general’: for any possible distribution of returns. Uses the ratio √((1-q)/q). \[[A43](https://riskfolio-lib.readthedocs.io/en/latest/portfolio.html#id202 "Frank J Fabozzi, Petter N Kolm, Dessislava A Pachamanova, and Sergio M Focardi. Robust Portfolio Optimization and Management. John Wiley & Sons, Nashville, TN, 05 2007.")\
> \] and \[[A44](https://riskfolio-lib.readthedocs.io/en/latest/portfolio.html#id260 "Laurent El Ghaoui, Maksim Oks, and Francois Oustry. Worst-case value-at-risk and robust portfolio optimization: a conic programming approach. Oper. Res., 51(4):543–556, 2003.")\
> \].
>
> * int or float value: we can use a custom distance parameter, that following lobo could be 1 or a near parameter. \[[A26](https://riskfolio-lib.readthedocs.io/en/latest/portfolio.html#id212 "Miguel Sousa Lobo and Stephen Boyd. The worst-case risk of a portfolio. 10 2000.")\
> \].
>
seed : [int](https://docs.python.org/3.11/library/functions.html#int "(in Python v3.11)")
[¶](https://riskfolio-lib.readthedocs.io/en/latest/portfolio.html#Portfolio.Portfolio.wc_stats.seed "Permalink to this definition")
Seed used to generate the boostrapping sample. The defailt is 0.
See also
`riskfolio.src.ParamsEstimation.bootstrapping`
optimization(_[model](https://riskfolio-lib.readthedocs.io/en/latest/portfolio.html#Portfolio.Portfolio.optimization.model "Portfolio.Portfolio.optimization.model (Python parameter) — The model used for optimize the portfolio. The default is 'Classic'.")
\=`'Classic'`_, _[rm](https://riskfolio-lib.readthedocs.io/en/latest/portfolio.html#Portfolio.Portfolio.optimization.rm "Portfolio.Portfolio.optimization.rm (Python parameter) — The risk measure used to optimize the portfolio. The default is 'MV'.")
\=`'MV'`_, _[obj](https://riskfolio-lib.readthedocs.io/en/latest/portfolio.html#Portfolio.Portfolio.optimization.obj "Portfolio.Portfolio.optimization.obj (Python parameter) — Objective function of the optimization model. The default is 'Sharpe'.")
\=`'Sharpe'`_, _[kelly](https://riskfolio-lib.readthedocs.io/en/latest/portfolio.html#Portfolio.Portfolio.optimization.kelly "Portfolio.Portfolio.optimization.kelly (Python parameter) — Method used to calculate mean return.")
\=`None`_, _[rf](https://riskfolio-lib.readthedocs.io/en/latest/portfolio.html#Portfolio.Portfolio.optimization.rf "Portfolio.Portfolio.optimization.rf (Python parameter) — Risk free rate, must be in the same period of assets returns. The default is 0.")
\=`0`_, _[l](https://riskfolio-lib.readthedocs.io/en/latest/portfolio.html#Portfolio.Portfolio.optimization.l "Portfolio.Portfolio.optimization.l (Python parameter) — Risk aversion factor of the 'Utility' objective function. The default is 2.")
\=`2`_, _[hist](https://riskfolio-lib.readthedocs.io/en/latest/portfolio.html#Portfolio.Portfolio.optimization.hist "Portfolio.Portfolio.optimization.hist (Python parameter) — Indicate what kind of returns are used to calculate risk measures that depends on scenarios (All except 'MV' risk measure). If model = 'BL', True means historical covariance and returns and False Black Litterman covariance and historical returns. If model = 'FM', True means historical covariance and returns and False Risk Factor model for covariance and returns. If model = 'BL_FM', True means historical covariance and returns, False Black Litterman with Risk Factor model for covariance and Risk Factor model for returns, and '2' Risk Factor model for covariance and returns.")
\=`True`_)[\[source\]](https://riskfolio-lib.readthedocs.io/en/latest/_modules/Portfolio.html#Portfolio.optimization)
[¶](https://riskfolio-lib.readthedocs.io/en/latest/portfolio.html#Portfolio.Portfolio.optimization "Link to this definition")
This method that calculates the optimal portfolio according to the optimization model selected by the user. The general problem that solves is:
optimizewF(w)s.t.Aw≤bARCdiag(ΣW)≤bRCTr(ΣW)ϕi(w)≤ci
Where:
F(w) is the objective function.
Aw≤b is a set of linear constraints on asset weights.
ARCdiag(ΣW)≤bRCTr(ΣW)
is a set of linear risk contribution constraints for variance.
ϕi(w)≤ci are constraints on maximum values of several risk measures.
Parameters:[¶](https://riskfolio-lib.readthedocs.io/en/latest/portfolio.html#Portfolio.Portfolio.optimization-parameters "Permalink to this headline")
model : str can be {'Classic', 'BL', 'FM' or 'BLFM'}[¶](https://riskfolio-lib.readthedocs.io/en/latest/portfolio.html#Portfolio.Portfolio.optimization.model "Permalink to this definition")
The model used for optimize the portfolio. The default is ‘Classic’. Possible values are:
* ’Classic’: use estimates of expected return vector and covariance matrix that depends on historical data.
* ’BL’: use estimates of expected return vector and covariance matrix based on the Black Litterman model.
* ’FM’: use estimates of expected return vector and covariance matrix based on a Risk Factor model specified by the user.
* ’BLFM’: use estimates of expected return vector and covariance matrix based on Black Litterman applied to a Risk Factor model specified by the user.
rm : [str](https://docs.python.org/3.11/library/stdtypes.html#str "(in Python v3.11)")
, optional[¶](https://riskfolio-lib.readthedocs.io/en/latest/portfolio.html#Portfolio.Portfolio.optimization.rm "Permalink to this definition")
The risk measure used to optimize the portfolio. The default is ‘MV’. Possible values are:
* ’MV’: Standard Deviation.
* ’KT’: Square Root of Kurtosis.
* ’MAD’: Mean Absolute Deviation.
* ’GMD’: Gini Mean Difference.
* ’MSV’: Semi Standard Deviation.
* ’SKT’: Square Root of Semi Kurtosis.
* ’FLPM’: First Lower Partial Moment (Omega Ratio).
* ’SLPM’: Second Lower Partial Moment (Sortino Ratio).
* ’CVaR’: Conditional Value at Risk.
* ’TG’: Tail Gini.
* ’EVaR’: Entropic Value at Risk.
* ’RLVaR’: Relativistic Value at Risk. I recommend only use this function with MOSEK solver.
* ’WR’: Worst Realization (Minimax).
* ’RG’: Range of returns.
* ’CVRG’: CVaR range of returns.
* ’TGRG’: Tail Gini range of returns.
* ’EVRG’: EVaR range of returns.
* ’RVRG’: RLVaR range of returns. I recommend only use this function with MOSEK solver.
* ’MDD’: Maximum Drawdown of uncompounded cumulative returns (Calmar Ratio).
* ’ADD’: Average Drawdown of uncompounded cumulative returns.
* ’CDaR’: Conditional Drawdown at Risk of uncompounded cumulative returns.
* ’EDaR’: Entropic Drawdown at Risk of uncompounded cumulative returns.
* ’RLDaR’: Relativistic Drawdown at Risk of uncompounded cumulative returns. I recommend only use this function with MOSEK solver.
* ’UCI’: Ulcer Index of uncompounded cumulative returns.
obj : str can be {'MinRisk', 'Utility', 'Sharpe' or 'MaxRet'}.[¶](https://riskfolio-lib.readthedocs.io/en/latest/portfolio.html#Portfolio.Portfolio.optimization.obj "Permalink to this definition")
Objective function of the optimization model. The default is ‘Sharpe’. Possible values are:
* ’MinRisk’: Minimize the selected risk measure.
* ’Utility’: Maximize the Utility function μw−lϕi(w).
* ’Sharpe’: Maximize the risk adjusted return ratio based on the selected risk measure.
* ’MaxRet’: Maximize the expected return of the portfolio.
kelly : [str](https://docs.python.org/3.11/library/stdtypes.html#str "(in Python v3.11)")
, optional[¶](https://riskfolio-lib.readthedocs.io/en/latest/portfolio.html#Portfolio.Portfolio.optimization.kelly "Permalink to this definition")
Method used to calculate mean return. Possible values are: None for arithmetic mean return, “approx” for approximate mean logarithmic return using first and second moment and “exact” for mean logarithmic return. The default is None.
rf : [float](https://docs.python.org/3.11/library/functions.html#float "(in Python v3.11)")
, optional[¶](https://riskfolio-lib.readthedocs.io/en/latest/portfolio.html#Portfolio.Portfolio.optimization.rf "Permalink to this definition")
Risk free rate, must be in the same period of assets returns. The default is 0.
l : scalar, optional[¶](https://riskfolio-lib.readthedocs.io/en/latest/portfolio.html#Portfolio.Portfolio.optimization.l "Permalink to this definition")
Risk aversion factor of the ‘Utility’ objective function. The default is 2.
hist : [bool](https://docs.python.org/3.11/library/functions.html#bool "(in Python v3.11)")
, optional[¶](https://riskfolio-lib.readthedocs.io/en/latest/portfolio.html#Portfolio.Portfolio.optimization.hist "Permalink to this definition")
Indicate what kind of returns are used to calculate risk measures that depends on scenarios (All except ‘MV’ risk measure). If model = ‘BL’, True means historical covariance and returns and False Black Litterman covariance and historical returns. If model = ‘FM’, True means historical covariance and returns and False Risk Factor model for covariance and returns. If model = ‘BL\_FM’, True means historical covariance and returns, False Black Litterman with Risk Factor model for covariance and Risk Factor model for returns, and ‘2’ Risk Factor model for covariance and returns. The default is True.
Returns:[¶](https://riskfolio-lib.readthedocs.io/en/latest/portfolio.html#Portfolio.Portfolio.optimization-returns "Permalink to this headline")
**w** – The weights of optimal portfolio.
Return type:[¶](https://riskfolio-lib.readthedocs.io/en/latest/portfolio.html#Portfolio.Portfolio.optimization-return-type "Permalink to this headline")
DataFrame
rp\_optimization(_[model](https://riskfolio-lib.readthedocs.io/en/latest/portfolio.html#Portfolio.Portfolio.rp_optimization.model "Portfolio.Portfolio.rp_optimization.model (Python parameter) — The model used for optimize the portfolio. The default is 'Classic'.")
\=`'Classic'`_, _[rm](https://riskfolio-lib.readthedocs.io/en/latest/portfolio.html#Portfolio.Portfolio.rp_optimization.rm "Portfolio.Portfolio.rp_optimization.rm (Python parameter) — The risk measure used to optimize the portfolio. The default is 'MV'.")
\=`'MV'`_, _[rf](https://riskfolio-lib.readthedocs.io/en/latest/portfolio.html#Portfolio.Portfolio.rp_optimization.rf "Portfolio.Portfolio.rp_optimization.rf (Python parameter) — Risk free rate, must be in the same period of assets returns. Used for 'FLPM' and 'SLPM'. The default is 0.")
\=`0`_, _[b](https://riskfolio-lib.readthedocs.io/en/latest/portfolio.html#Portfolio.Portfolio.rp_optimization.b "Portfolio.Portfolio.rp_optimization.b (Python parameter) — The vector of risk constraints per asset. The default is 1/n (number of assets).")
\=`None`_, _[b\_f](https://riskfolio-lib.readthedocs.io/en/latest/portfolio.html#Portfolio.Portfolio.rp_optimization.b_f "Portfolio.Portfolio.rp_optimization.b_f (Python parameter) — The vector of risk constraints per risk factor. The default is 1/n_f (number of risk factors).")
\=`None`_, _[hist](https://riskfolio-lib.readthedocs.io/en/latest/portfolio.html#Portfolio.Portfolio.rp_optimization.hist "Portfolio.Portfolio.rp_optimization.hist (Python parameter) — Indicate what kind of returns are used to calculate risk measures that depends on scenarios (All except 'MV' risk measure). If model = 'FM', True means historical covariance and returns and False means Risk Factor model for covariance and returns.")
\=`True`_)[\[source\]](https://riskfolio-lib.readthedocs.io/en/latest/_modules/Portfolio.html#Portfolio.rp_optimization)
[¶](https://riskfolio-lib.readthedocs.io/en/latest/portfolio.html#Portfolio.Portfolio.rp_optimization "Link to this definition")
This method that calculates the risk parity portfolio using the risk budgeting approach \[[A23](https://riskfolio-lib.readthedocs.io/en/latest/portfolio.html#id210 "Benjamin Bruder and Thierry Roncalli. Managing risk exposures using the risk budgeting approach. SSRN Electronic Journal, pages, 01 2012. doi:10.2139/ssrn.2009778.")\
\] \[[A24](https://riskfolio-lib.readthedocs.io/en/latest/portfolio.html#id235 "Jean-Charles Richard and Thierry Roncalli. Constrained Risk Budgeting Portfolios: Theory, Algorithms, Applications & Puzzles. Papers 1902.05710, arXiv.org, February 2019. URL: https://ideas.repec.org/p/arx/papers/1902.05710.html.")\
\] and the risk parity with risk factors approach \[[A45](https://riskfolio-lib.readthedocs.io/en/latest/portfolio.html#id261 "Thierry Roncalli and Guillaume Weisang. Risk parity portfolios with risk factors. SSRN Electronic Journal, 09 2012. doi:10.2139/ssrn.2155159.")\
\] according to the optimization model selected by the user. The general problem that solves is:
minwϕ(w)s.t.b′log(w)≥cμw≥μ―Aw≤bw≥0
Where:
w are the weights of the portfolio.
μ: is the vector of expected returns.
b is a vector of risk contribution targets.
Aw≤b: is a set of linear constraints on asset weights.
ϕ(w): is a risk measure.
c: is an arbitrary constant.
Parameters:[¶](https://riskfolio-lib.readthedocs.io/en/latest/portfolio.html#Portfolio.Portfolio.rp_optimization-parameters "Permalink to this headline")
model : str can be 'Classic' or 'FM'[¶](https://riskfolio-lib.readthedocs.io/en/latest/portfolio.html#Portfolio.Portfolio.rp_optimization.model "Permalink to this definition")
The model used for optimize the portfolio. The default is ‘Classic’. Possible values are:
* ’Classic’: uses estimates of expected return vector and covariance matrix that depends on historical data.
* ’FM’: uses estimates of expected return vector and covariance matrix based on a Risk Factor model specified by the user.
* ’FC’: uses risk contributions based on risk factors.
rm : [str](https://docs.python.org/3.11/library/stdtypes.html#str "(in Python v3.11)")
, optional[¶](https://riskfolio-lib.readthedocs.io/en/latest/portfolio.html#Portfolio.Portfolio.rp_optimization.rm "Permalink to this definition")
The risk measure used to optimize the portfolio. The default is ‘MV’. Possible values are:
* ’MV’: Standard Deviation.
* ’KT’: Square Root of Kurtosis.
* ’MAD’: Mean Absolute Deviation.
* ’GMD’: Gini Mean Difference.
* ’MSV’: Semi Standard Deviation.
* ’SKT’: Square Root of Semi Kurtosis.
* ’FLPM’: First Lower Partial Moment (Omega Ratio).
* ’SLPM’: Second Lower Partial Moment (Sortino Ratio).
* ’CVaR’: Conditional Value at Risk.
* ’TG’: Tail Gini.
* ’EVaR’: Entropic Value at Risk.
* ’RLVaR’: Relativistic Value at Risk.
* ’CVRG’: CVaR range of returns.
* ’TGRG’: Tail Gini range of returns.
* ’EVRG’: EVaR range of returns.
* ’RVRG’: RLVaR range of returns.
* ’CDaR’: Conditional Drawdown at Risk of uncompounded cumulative returns.
* ’EDaR’: Entropic Drawdown at Risk of uncompounded cumulative returns.
* ’RLDaR’: Relativistic Drawdown at Risk of uncompounded cumulative returns.
* ’UCI’: Ulcer Index of uncompounded cumulative returns.
rf : [float](https://docs.python.org/3.11/library/functions.html#float "(in Python v3.11)")
, optional[¶](https://riskfolio-lib.readthedocs.io/en/latest/portfolio.html#Portfolio.Portfolio.rp_optimization.rf "Permalink to this definition")
Risk free rate, must be in the same period of assets returns. Used for ‘FLPM’ and ‘SLPM’. The default is 0.
b : [float](https://docs.python.org/3.11/library/functions.html#float "(in Python v3.11)")
, optional[¶](https://riskfolio-lib.readthedocs.io/en/latest/portfolio.html#Portfolio.Portfolio.rp_optimization.b "Permalink to this definition")
The vector of risk constraints per asset. The default is 1/n (number of assets).
b\_f : [float](https://docs.python.org/3.11/library/functions.html#float "(in Python v3.11)")
, optional[¶](https://riskfolio-lib.readthedocs.io/en/latest/portfolio.html#Portfolio.Portfolio.rp_optimization.b_f "Permalink to this definition")
The vector of risk constraints per risk factor. The default is 1/n\_f (number of risk factors).
hist : [bool](https://docs.python.org/3.11/library/functions.html#bool "(in Python v3.11)")
, optional[¶](https://riskfolio-lib.readthedocs.io/en/latest/portfolio.html#Portfolio.Portfolio.rp_optimization.hist "Permalink to this definition")
Indicate what kind of returns are used to calculate risk measures that depends on scenarios (All except ‘MV’ risk measure). If model = ‘FM’, True means historical covariance and returns and False means Risk Factor model for covariance and returns. The default is True.
Returns:[¶](https://riskfolio-lib.readthedocs.io/en/latest/portfolio.html#Portfolio.Portfolio.rp_optimization-returns "Permalink to this headline")
**w** – The weights of optimal portfolio.
Return type:[¶](https://riskfolio-lib.readthedocs.io/en/latest/portfolio.html#Portfolio.Portfolio.rp_optimization-return-type "Permalink to this headline")
DataFrame
rrp\_optimization(_[model](https://riskfolio-lib.readthedocs.io/en/latest/portfolio.html#Portfolio.Portfolio.rrp_optimization.model "Portfolio.Portfolio.rrp_optimization.model (Python parameter) — The model used for optimize the portfolio. The default is 'Classic'.")
\=`'Classic'`_, _[version](https://riskfolio-lib.readthedocs.io/en/latest/portfolio.html#Portfolio.Portfolio.rrp_optimization.version "Portfolio.Portfolio.rrp_optimization.version (Python parameter) — Relaxed risk parity model version proposed in a-RichardRoncalli. The default is 'A'.")
\=`'A'`_, _[l](https://riskfolio-lib.readthedocs.io/en/latest/portfolio.html#Portfolio.Portfolio.rrp_optimization.l "Portfolio.Portfolio.rrp_optimization.l (Python parameter) — The penalization factor of penalization constraints.")
\=`1`_, _[b](https://riskfolio-lib.readthedocs.io/en/latest/portfolio.html#Portfolio.Portfolio.rrp_optimization.b "Portfolio.Portfolio.rrp_optimization.b (Python parameter) — The vector of risk constraints per asset. The default is 1/n (number of assets).")
\=`None`_, _[hist](https://riskfolio-lib.readthedocs.io/en/latest/portfolio.html#Portfolio.Portfolio.rrp_optimization.hist "Portfolio.Portfolio.rrp_optimization.hist (Python parameter) — Indicate what kind of covariance matrix is used. If model = 'FM', True means historical covariance and False means Risk Factor model for covariance.")
\=`True`_)[\[source\]](https://riskfolio-lib.readthedocs.io/en/latest/_modules/Portfolio.html#Portfolio.rrp_optimization)
[¶](https://riskfolio-lib.readthedocs.io/en/latest/portfolio.html#Portfolio.Portfolio.rrp_optimization "Link to this definition")
This method that calculates the relaxed risk parity portfolio according to the optimization model and version selected by the user \[[A25](https://riskfolio-lib.readthedocs.io/en/latest/portfolio.html#id234 "Vaughn Gambeta and Roy Kwon. Risk return trade-off in relaxed risk parity portfolio optimization. Journal of Risk and Financial Management, 2020. URL: https://www.mdpi.com/1911-8074/13/10/237, doi:10.3390/jrfm13100237.")\
\]. The general problem that solves is:
minwψ−γs.t.ζ\=ΣwwTΣw≤(ψ2−ρ2)wiζi≥γ2bi∀i\=1,…,NλwTΘw≤ρ2μw≥μ―Aw≤b∑i\=1Nwi\=1ψ,γ,ρ,w≥0
Where:
w: is the vector of weights of the optimum portfolio.
μ: is the vector of expected returns.
Σ: is the covariance matrix of assets returns.
ψ: is the average risk of the portfolio.
γ: is the lower bound of each asset risk constribution.
b: is the vector of risk constribution targets.
ζi: is the marginal risk of asset i.
ρ: is a regularization variable.
λ: is a penalty parameter of ρ.
Θ\=diag(Σ)
Aw≤b: is a set of linear constraints on asset weights.
Parameters:[¶](https://riskfolio-lib.readthedocs.io/en/latest/portfolio.html#Portfolio.Portfolio.rrp_optimization-parameters "Permalink to this headline")
model : str can be 'Classic' or 'FM'[¶](https://riskfolio-lib.readthedocs.io/en/latest/portfolio.html#Portfolio.Portfolio.rrp_optimization.model "Permalink to this definition")
The model used for optimize the portfolio. The default is ‘Classic’. Possible values are:
* ’Classic’: use estimates of expected return vector and covariance matrix that depends on historical data.
* ’FM’: use estimates of expected return vector and covariance matrix based on a Risk Factor model specified by the user.
version : str can be 'A', 'B' or 'C'[¶](https://riskfolio-lib.readthedocs.io/en/latest/portfolio.html#Portfolio.Portfolio.rrp_optimization.version "Permalink to this definition")
Relaxed risk parity model version proposed in \[[A24](https://riskfolio-lib.readthedocs.io/en/latest/portfolio.html#id235 "Jean-Charles Richard and Thierry Roncalli. Constrained Risk Budgeting Portfolios: Theory, Algorithms, Applications & Puzzles. Papers 1902.05710, arXiv.org, February 2019. URL: https://ideas.repec.org/p/arx/papers/1902.05710.html.")\
\]. The default is ‘A’. Possible values are:
* ’A’: without regularization and penalization constraints.
* ’B’: with regularization constraint but without penalization constraint.
* ’C’: with regularization and penalization constraints.
l : [float](https://docs.python.org/3.11/library/functions.html#float "(in Python v3.11)")
, optional[¶](https://riskfolio-lib.readthedocs.io/en/latest/portfolio.html#Portfolio.Portfolio.rrp_optimization.l "Permalink to this definition")
The penalization factor of penalization constraints. Only used with version ‘C’. The default is 1.
b : [float](https://docs.python.org/3.11/library/functions.html#float "(in Python v3.11)")
, optional[¶](https://riskfolio-lib.readthedocs.io/en/latest/portfolio.html#Portfolio.Portfolio.rrp_optimization.b "Permalink to this definition")
The vector of risk constraints per asset. The default is 1/n (number of assets).
hist : [bool](https://docs.python.org/3.11/library/functions.html#bool "(in Python v3.11)")
, optional[¶](https://riskfolio-lib.readthedocs.io/en/latest/portfolio.html#Portfolio.Portfolio.rrp_optimization.hist "Permalink to this definition")
Indicate what kind of covariance matrix is used. If model = ‘FM’, True means historical covariance and False means Risk Factor model for covariance. The default is True.
Returns:[¶](https://riskfolio-lib.readthedocs.io/en/latest/portfolio.html#Portfolio.Portfolio.rrp_optimization-returns "Permalink to this headline")
**w** – The weights of optimal portfolio.
Return type:[¶](https://riskfolio-lib.readthedocs.io/en/latest/portfolio.html#Portfolio.Portfolio.rrp_optimization-return-type "Permalink to this headline")
DataFrame
wc\_optimization(_[obj](https://riskfolio-lib.readthedocs.io/en/latest/portfolio.html#Portfolio.Portfolio.wc_optimization.obj "Portfolio.Portfolio.wc_optimization.obj (Python parameter) — Objective function of the optimization model. The default is 'Sharpe'.")
\=`'Sharpe'`_, _[rf](https://riskfolio-lib.readthedocs.io/en/latest/portfolio.html#Portfolio.Portfolio.wc_optimization.rf "Portfolio.Portfolio.wc_optimization.rf (Python parameter) — Risk free rate, must be in the same period of assets returns. The default is 0.")
\=`0`_, _[l](https://riskfolio-lib.readthedocs.io/en/latest/portfolio.html#Portfolio.Portfolio.wc_optimization.l "Portfolio.Portfolio.wc_optimization.l (Python parameter) — Risk aversion factor of the 'Utility' objective function. The default is 2.")
\=`2`_, _[Umu](https://riskfolio-lib.readthedocs.io/en/latest/portfolio.html#Portfolio.Portfolio.wc_optimization.Umu "Portfolio.Portfolio.wc_optimization.Umu (Python parameter) — The type of uncertainty set for the mean vector used in the model. The default is 'box'.")
\=`'box'`_, _[Ucov](https://riskfolio-lib.readthedocs.io/en/latest/portfolio.html#Portfolio.Portfolio.wc_optimization.Ucov "Portfolio.Portfolio.wc_optimization.Ucov (Python parameter) — The type of uncertainty set for the covariance matrix used in the model. The default is 'box'.")
\=`'box'`_)[\[source\]](https://riskfolio-lib.readthedocs.io/en/latest/_modules/Portfolio.html#Portfolio.wc_optimization)
[¶](https://riskfolio-lib.readthedocs.io/en/latest/portfolio.html#Portfolio.Portfolio.wc_optimization "Link to this definition")
This method that calculates the worst case mean variance portfolio according to the objective function and uncertainty sets selected by the user.
Parameters:[¶](https://riskfolio-lib.readthedocs.io/en/latest/portfolio.html#Portfolio.Portfolio.wc_optimization-parameters "Permalink to this headline")
obj : str can be {'MinRisk', 'Utility', 'Sharpe' or 'MaxRet'}.[¶](https://riskfolio-lib.readthedocs.io/en/latest/portfolio.html#Portfolio.Portfolio.wc_optimization.obj "Permalink to this definition")
Objective function of the optimization model. The default is ‘Sharpe’. Possible values are:
* ’MinRisk’: Minimize the worst case formulation of the selected risk measure.
* ’Utility’: Maximize the worst case formulation of the Utility function μw−lϕi(w).
* ’Sharpe’: Maximize the worst case formulation of the risk adjusted return ratio based on the selected risk measure.
* ’MaxRet’: Maximize the worst case formulation of the expected return of the portfolio.
rf : [float](https://docs.python.org/3.11/library/functions.html#float "(in Python v3.11)")
, optional[¶](https://riskfolio-lib.readthedocs.io/en/latest/portfolio.html#Portfolio.Portfolio.wc_optimization.rf "Permalink to this definition")
Risk free rate, must be in the same period of assets returns. The default is 0.
l : scalar, optional[¶](https://riskfolio-lib.readthedocs.io/en/latest/portfolio.html#Portfolio.Portfolio.wc_optimization.l "Permalink to this definition")
Risk aversion factor of the ‘Utility’ objective function. The default is 2.
Umu : [str](https://docs.python.org/3.11/library/stdtypes.html#str "(in Python v3.11)")
, optional[¶](https://riskfolio-lib.readthedocs.io/en/latest/portfolio.html#Portfolio.Portfolio.wc_optimization.Umu "Permalink to this definition")
The type of uncertainty set for the mean vector used in the model. The default is ‘box’. Possible values are:
* ’box’: Use a box uncertainty set for the mean vector.
* ’ellip’: Use a elliptical uncertainty set for the mean vector.
* None: Don’t use an uncertainty set for mean vector.
Ucov : [str](https://docs.python.org/3.11/library/stdtypes.html#str "(in Python v3.11)")
, optional[¶](https://riskfolio-lib.readthedocs.io/en/latest/portfolio.html#Portfolio.Portfolio.wc_optimization.Ucov "Permalink to this definition")
The type of uncertainty set for the covariance matrix used in the model. The default is ‘box’. Possible values are:
* ’box’: Use a box uncertainty set for the covariance matrix.
* ’ellip’: Use a elliptical uncertainty set for the covariance matrix.
* None: Don’t use an uncertainty set for covariance matrix.
Returns:[¶](https://riskfolio-lib.readthedocs.io/en/latest/portfolio.html#Portfolio.Portfolio.wc_optimization-returns "Permalink to this headline")
**w** – The weights of optimal portfolio.
Return type:[¶](https://riskfolio-lib.readthedocs.io/en/latest/portfolio.html#Portfolio.Portfolio.wc_optimization-return-type "Permalink to this headline")
DataFrame
frc\_optimization(_[model](https://riskfolio-lib.readthedocs.io/en/latest/portfolio.html#Portfolio.Portfolio.frc_optimization.model "Portfolio.Portfolio.frc_optimization.model (Python parameter) — The model used for optimize the portfolio. The default is 'Classic'.")
\=`'Classic'`_, _[obj](https://riskfolio-lib.readthedocs.io/en/latest/portfolio.html#Portfolio.Portfolio.frc_optimization.obj "Portfolio.Portfolio.frc_optimization.obj (Python parameter) — Objective function of the optimization model. The default is 'Sharpe'.")
\=`'Sharpe'`_, _[kelly](https://riskfolio-lib.readthedocs.io/en/latest/portfolio.html#Portfolio.Portfolio.frc_optimization.kelly "Portfolio.Portfolio.frc_optimization.kelly (Python parameter) — Method used to calculate mean return.")
\=`None`_, _[rf](https://riskfolio-lib.readthedocs.io/en/latest/portfolio.html#Portfolio.Portfolio.frc_optimization.rf "Portfolio.Portfolio.frc_optimization.rf (Python parameter) — Risk free rate, must be in the same period of assets returns. The default is 0.")
\=`0`_, _[l](https://riskfolio-lib.readthedocs.io/en/latest/portfolio.html#Portfolio.Portfolio.frc_optimization.l "Portfolio.Portfolio.frc_optimization.l (Python parameter) — Risk aversion factor of the 'Utility' objective function. The default is 2.")
\=`2`_, _[hist](https://riskfolio-lib.readthedocs.io/en/latest/portfolio.html#Portfolio.Portfolio.frc_optimization.hist "Portfolio.Portfolio.frc_optimization.hist (Python parameter) — Indicate what kind of returns are used to calculate risk measures that depends on scenarios (All except 'MV' risk measure). If model = 'FM', True means historical covariance and returns and False means Risk Factor model for covariance and returns.")
\=`True`_)[\[source\]](https://riskfolio-lib.readthedocs.io/en/latest/_modules/Portfolio.html#Portfolio.frc_optimization)
[¶](https://riskfolio-lib.readthedocs.io/en/latest/portfolio.html#Portfolio.Portfolio.frc_optimization "Link to this definition")
This method that calculates the risk parity portfolio using the risk budgeting approach \[[A3](https://riskfolio-lib.readthedocs.io/en/latest/portfolio.html#id265 "Dany Cajas. A semidefinite programming approach to risk parity portfolio optimization. SSRN Electronic Journal, 2025. URL: http://dx.doi.org/10.2139/ssrn.5097869, doi:10.2139/ssrn.5097869.")\
\] according to the objective function selected by the user. The general problem that solves is:
optimizewfF(w)s.t.\[WFwFwF′1\]⪰0Aw≤bw\=(B′)+wFAFRCdiag(Σ¯WF)≤bFRCTr(Σ¯WF)WF∈Sm
Where:
wf are the weights of the risk factors.
Wf: is the symmetric matrix variable that approximates wfwf′.
B is the loadings matrix.
Aw≤b: is a set of linear constraints on asset weights.
Σ¯\=((B′)+)′Σ(B′)+.
AFRCdiag(Σ¯WF)≤bFRCTr(Σ¯WF): is a set of linear factor risk contribution constraints.
Parameters:[¶](https://riskfolio-lib.readthedocs.io/en/latest/portfolio.html#Portfolio.Portfolio.frc_optimization-parameters "Permalink to this headline")
model : str can be 'Classic' or 'FM'[¶](https://riskfolio-lib.readthedocs.io/en/latest/portfolio.html#Portfolio.Portfolio.frc_optimization.model "Permalink to this definition")
The model used for optimize the portfolio. The default is ‘Classic’. Possible values are:
* ’Classic’: uses estimates of expected return vector and covariance matrix that depends on historical data.
* ’FM’: uses estimates of expected return vector and covariance matrix based on a Risk Factor model specified by the user.
obj : str can be {'MinRisk', 'Utility', 'Sharpe' or 'MaxRet'}.[¶](https://riskfolio-lib.readthedocs.io/en/latest/portfolio.html#Portfolio.Portfolio.frc_optimization.obj "Permalink to this definition")
Objective function of the optimization model. The default is ‘Sharpe’. Possible values are:
* ’MinRisk’: Minimize the selected risk measure.
* ’Utility’: Maximize the Utility function μw−lϕi(w).
* ’Sharpe’: Maximize the risk adjusted return ratio based on the selected risk measure.
* ’MaxRet’: Maximize the expected return of the portfolio.
kelly : [str](https://docs.python.org/3.11/library/stdtypes.html#str "(in Python v3.11)")
, optional[¶](https://riskfolio-lib.readthedocs.io/en/latest/portfolio.html#Portfolio.Portfolio.frc_optimization.kelly "Permalink to this definition")
Method used to calculate mean return. Possible values are: None for arithmetic mean return, “approx” for approximate mean logarithmic return using first and second moment and “exact” for mean logarithmic return. The default is None.
rf : [float](https://docs.python.org/3.11/library/functions.html#float "(in Python v3.11)")
, optional[¶](https://riskfolio-lib.readthedocs.io/en/latest/portfolio.html#Portfolio.Portfolio.frc_optimization.rf "Permalink to this definition")
Risk free rate, must be in the same period of assets returns. The default is 0.
l : scalar, optional[¶](https://riskfolio-lib.readthedocs.io/en/latest/portfolio.html#Portfolio.Portfolio.frc_optimization.l "Permalink to this definition")
Risk aversion factor of the ‘Utility’ objective function. The default is 2.
hist : [bool](https://docs.python.org/3.11/library/functions.html#bool "(in Python v3.11)")
, optional[¶](https://riskfolio-lib.readthedocs.io/en/latest/portfolio.html#Portfolio.Portfolio.frc_optimization.hist "Permalink to this definition")
Indicate what kind of returns are used to calculate risk measures that depends on scenarios (All except ‘MV’ risk measure). If model = ‘FM’, True means historical covariance and returns and False means Risk Factor model for covariance and returns. The default is True.
Returns:[¶](https://riskfolio-lib.readthedocs.io/en/latest/portfolio.html#Portfolio.Portfolio.frc_optimization-returns "Permalink to this headline")
**w** – The weights of optimal portfolio.
Return type:[¶](https://riskfolio-lib.readthedocs.io/en/latest/portfolio.html#Portfolio.Portfolio.frc_optimization-return-type "Permalink to this headline")
DataFrame
owa\_optimization(_[obj](https://riskfolio-lib.readthedocs.io/en/latest/portfolio.html#Portfolio.Portfolio.owa_optimization.obj "Portfolio.Portfolio.owa_optimization.obj (Python parameter) — Objective function of the optimization model. The default is 'Sharpe'.")
\=`'Sharpe'`_, _[owa\_w](https://riskfolio-lib.readthedocs.io/en/latest/portfolio.html#Portfolio.Portfolio.owa_optimization.owa_w "Portfolio.Portfolio.owa_optimization.owa_w (Python parameter) — The owa weight used to define the owa risk measure. The default is 'MV'.")
\=`None`_, _[kelly](https://riskfolio-lib.readthedocs.io/en/latest/portfolio.html#Portfolio.Portfolio.owa_optimization.kelly "Portfolio.Portfolio.owa_optimization.kelly (Python parameter) — Method used to calculate mean return.")
\=`None`_, _[rf](https://riskfolio-lib.readthedocs.io/en/latest/portfolio.html#Portfolio.Portfolio.owa_optimization.rf "Portfolio.Portfolio.owa_optimization.rf (Python parameter) — Risk free rate, must be in the same period of assets returns. The default is 0.")
\=`0`_, _[l](https://riskfolio-lib.readthedocs.io/en/latest/portfolio.html#Portfolio.Portfolio.owa_optimization.l "Portfolio.Portfolio.owa_optimization.l (Python parameter) — Risk aversion factor of the 'Utility' objective function. The default is 2.")
\=`2`_)[\[source\]](https://riskfolio-lib.readthedocs.io/en/latest/_modules/Portfolio.html#Portfolio.owa_optimization)
[¶](https://riskfolio-lib.readthedocs.io/en/latest/portfolio.html#Portfolio.Portfolio.owa_optimization "Link to this definition")
This method that calculates the owa optimal portfolio according to the weight vector given by the user. The general problem that solves is:
optimizewF(w)s.t.Aw≤b
Where:
F(w) is the objective function based on an owa risk measure.
Aw≤b is a set of linear constraints on asset weights.
Parameters:[¶](https://riskfolio-lib.readthedocs.io/en/latest/portfolio.html#Portfolio.Portfolio.owa_optimization-parameters "Permalink to this headline")
obj : str can be {'MinRisk', 'Utility', 'Sharpe' or 'MaxRet'}.[¶](https://riskfolio-lib.readthedocs.io/en/latest/portfolio.html#Portfolio.Portfolio.owa_optimization.obj "Permalink to this definition")
Objective function of the optimization model. The default is ‘Sharpe’. Possible values are:
* ’MinRisk’: Minimize the selected risk measure.
* ’Utility’: Maximize the Utility function μw−lϕi(w).
* ’Sharpe’: Maximize the risk adjusted return ratio based on the selected risk measure.
owa\_w : 1darray, optional[¶](https://riskfolio-lib.readthedocs.io/en/latest/portfolio.html#Portfolio.Portfolio.owa_optimization.owa_w "Permalink to this definition")
The owa weight used to define the owa risk measure. The default is ‘MV’. Possible values are:
kelly : [str](https://docs.python.org/3.11/library/stdtypes.html#str "(in Python v3.11)")
, optional[¶](https://riskfolio-lib.readthedocs.io/en/latest/portfolio.html#Portfolio.Portfolio.owa_optimization.kelly "Permalink to this definition")
Method used to calculate mean return. Possible values are: None for arithmetic mean return, “approx” for approximate mean logarithmic return using first and second moment and “exact” for mean logarithmic return. The default is None.
rf : [float](https://docs.python.org/3.11/library/functions.html#float "(in Python v3.11)")
, optional[¶](https://riskfolio-lib.readthedocs.io/en/latest/portfolio.html#Portfolio.Portfolio.owa_optimization.rf "Permalink to this definition")
Risk free rate, must be in the same period of assets returns. The default is 0.
l : scalar, optional[¶](https://riskfolio-lib.readthedocs.io/en/latest/portfolio.html#Portfolio.Portfolio.owa_optimization.l "Permalink to this definition")
Risk aversion factor of the ‘Utility’ objective function. The default is 2.
Returns:[¶](https://riskfolio-lib.readthedocs.io/en/latest/portfolio.html#Portfolio.Portfolio.owa_optimization-returns "Permalink to this headline")
**w** – The weights of optimal portfolio.
Return type:[¶](https://riskfolio-lib.readthedocs.io/en/latest/portfolio.html#Portfolio.Portfolio.owa_optimization-return-type "Permalink to this headline")
DataFrame
frontier\_limits(_[model](https://riskfolio-lib.readthedocs.io/en/latest/portfolio.html#Portfolio.Portfolio.frontier_limits.model "Portfolio.Portfolio.frontier_limits.model (Python parameter) — Methodology used to estimate input parameters. The default is 'Classic'.")
\=`'Classic'`_, _[rm](https://riskfolio-lib.readthedocs.io/en/latest/portfolio.html#Portfolio.Portfolio.frontier_limits.rm "Portfolio.Portfolio.frontier_limits.rm (Python parameter) — The risk measure used to optimize the portfolio. The default is 'MV'.")
\=`'MV'`_, _[kelly](https://riskfolio-lib.readthedocs.io/en/latest/portfolio.html#Portfolio.Portfolio.frontier_limits.kelly "Portfolio.Portfolio.frontier_limits.kelly (Python parameter) — Method used to calculate mean return.")
\=`None`_, _[rf](https://riskfolio-lib.readthedocs.io/en/latest/portfolio.html#Portfolio.Portfolio.frontier_limits.rf "Portfolio.Portfolio.frontier_limits.rf (Python parameter) — Risk free rate.")
\=`0`_, _[hist](https://riskfolio-lib.readthedocs.io/en/latest/portfolio.html#Portfolio.Portfolio.frontier_limits.hist "Portfolio.Portfolio.frontier_limits.hist (Python parameter) — Indicate what kind of returns are used to calculate risk measures that depends on scenarios (All except 'MV' risk measure). If model = 'BL', True means historical covariance and returns and False Black Litterman covariance and historical returns. If model = 'FM', True means historical covariance and returns and False Risk Factor model for covariance and returns. If model = 'BL_FM', True means historical covariance and returns, False Black Litterman with Risk Factor model for covariance and Risk Factor model for returns, and '2' Risk Factor model for covariance and returns.")
\=`True`_)[\[source\]](https://riskfolio-lib.readthedocs.io/en/latest/_modules/Portfolio.html#Portfolio.frontier_limits)
[¶](https://riskfolio-lib.readthedocs.io/en/latest/portfolio.html#Portfolio.Portfolio.frontier_limits "Link to this definition")
Method that calculates the minimum risk and maximum return portfolios available with current assets and constraints.
Parameters:[¶](https://riskfolio-lib.readthedocs.io/en/latest/portfolio.html#Portfolio.Portfolio.frontier_limits-parameters "Permalink to this headline")
model : [str](https://docs.python.org/3.11/library/stdtypes.html#str "(in Python v3.11)")
, optional[¶](https://riskfolio-lib.readthedocs.io/en/latest/portfolio.html#Portfolio.Portfolio.frontier_limits.model "Permalink to this definition")
Methodology used to estimate input parameters. The default is ‘Classic’.
rm : [str](https://docs.python.org/3.11/library/stdtypes.html#str "(in Python v3.11)")
, optional[¶](https://riskfolio-lib.readthedocs.io/en/latest/portfolio.html#Portfolio.Portfolio.frontier_limits.rm "Permalink to this definition")
The risk measure used to optimize the portfolio. The default is ‘MV’. Possible values are:
* ’MV’: Standard Deviation.
* ’KT’: Square Root of Kurtosis.
* ’MAD’: Mean Absolute Deviation.
* ’GMD’: Gini Mean Difference.
* ’MSV’: Semi Standard Deviation.
* ’SKT’: Square Root of Semi Kurtosis.
* ’FLPM’: First Lower Partial Moment (Omega Ratio).
* ’SLPM’: Second Lower Partial Moment (Sortino Ratio).
* ’CVaR’: Conditional Value at Risk.
* ’TG’: Tail Gini.
* ’EVaR’: Entropic Value at Risk.
* ’RLVaR’: Relativistic Value at Risk.
* ’WR’: Worst Realization (Minimax).
* ’RG’: Range of returns.
* ’CVRG’: CVaR range of returns.
* ’TGRG’: Tail Gini range of returns.
* ’EVRG’: EVaR range of returns.
* ’RVRG’: RLVaR range of returns. I recommend only use this function with MOSEK solver.
* ’MDD’: Maximum Drawdown of uncompounded cumulative returns (Calmar Ratio).
* ’ADD’: Average Drawdown of uncompounded cumulative returns.
* ’CDaR’: Conditional Drawdown at Risk of uncompounded cumulative returns.
* ’EDaR’: Entropic Drawdown at Risk of uncompounded cumulative returns.
* ’RLDaR’: Relativistic Drawdown at Risk of uncompounded cumulative returns. I recommend only use this function with MOSEK solver.
* ’UCI’: Ulcer Index of uncompounded cumulative returns.
kelly : [str](https://docs.python.org/3.11/library/stdtypes.html#str "(in Python v3.11)")
, optional[¶](https://riskfolio-lib.readthedocs.io/en/latest/portfolio.html#Portfolio.Portfolio.frontier_limits.kelly "Permalink to this definition")
Method used to calculate mean return. Possible values are: None for arithmetic mean return, “approx” for approximate mean logarithmic return using first and second moment and “exact” for mean logarithmic return. The default is None.
rf : scalar, optional[¶](https://riskfolio-lib.readthedocs.io/en/latest/portfolio.html#Portfolio.Portfolio.frontier_limits.rf "Permalink to this definition")
Risk free rate. The default is 0.
hist : [bool](https://docs.python.org/3.11/library/functions.html#bool "(in Python v3.11)")
, optional[¶](https://riskfolio-lib.readthedocs.io/en/latest/portfolio.html#Portfolio.Portfolio.frontier_limits.hist "Permalink to this definition")
Indicate what kind of returns are used to calculate risk measures that depends on scenarios (All except ‘MV’ risk measure). If model = ‘BL’, True means historical covariance and returns and False Black Litterman covariance and historical returns. If model = ‘FM’, True means historical covariance and returns and False Risk Factor model for covariance and returns. If model = ‘BL\_FM’, True means historical covariance and returns, False Black Litterman with Risk Factor model for covariance and Risk Factor model for returns, and ‘2’ Risk Factor model for covariance and returns. The default is True.
Returns:[¶](https://riskfolio-lib.readthedocs.io/en/latest/portfolio.html#Portfolio.Portfolio.frontier_limits-returns "Permalink to this headline")
**limits** – A dataframe that containts the weights of the portfolios.
Return type:[¶](https://riskfolio-lib.readthedocs.io/en/latest/portfolio.html#Portfolio.Portfolio.frontier_limits-return-type "Permalink to this headline")
DataFrame
Notes
This method is preferable (faster) to use instead of efficient\_frontier method to know the range of expected return and expected risk.
efficient\_frontier(_[model](https://riskfolio-lib.readthedocs.io/en/latest/portfolio.html#Portfolio.Portfolio.efficient_frontier.model "Portfolio.Portfolio.efficient_frontier.model (Python parameter) — Methodology used to estimate input parameters. The default is 'Classic'.")
\=`'Classic'`_, _[rm](https://riskfolio-lib.readthedocs.io/en/latest/portfolio.html#Portfolio.Portfolio.efficient_frontier.rm "Portfolio.Portfolio.efficient_frontier.rm (Python parameter) — The risk measure used to optimize the portfolio. The default is 'MV'.")
\=`'MV'`_, _[kelly](https://riskfolio-lib.readthedocs.io/en/latest/portfolio.html#Portfolio.Portfolio.efficient_frontier.kelly "Portfolio.Portfolio.efficient_frontier.kelly (Python parameter) — Method used to calculate mean return.")
\=`None`_, _[points](https://riskfolio-lib.readthedocs.io/en/latest/portfolio.html#Portfolio.Portfolio.efficient_frontier.points "Portfolio.Portfolio.efficient_frontier.points (Python parameter) — Number of point calculated from the efficient frontier. The default is 50.")
\=`20`_, _[rf](https://riskfolio-lib.readthedocs.io/en/latest/portfolio.html#Portfolio.Portfolio.efficient_frontier.rf "Portfolio.Portfolio.efficient_frontier.rf (Python parameter) — Risk free rate.")
\=`0`_, _[solver](https://riskfolio-lib.readthedocs.io/en/latest/portfolio.html#Portfolio.Portfolio.efficient_frontier.solver "Portfolio.Portfolio.efficient_frontier.solver (Python parameter) — Solver available for CVXPY that supports power cone programming.")
\=`'CLARABEL'`_, _[hist](https://riskfolio-lib.readthedocs.io/en/latest/portfolio.html#Portfolio.Portfolio.efficient_frontier.hist "Portfolio.Portfolio.efficient_frontier.hist (Python parameter) — Indicate what kind of returns are used to calculate risk measures that depends on scenarios (All except 'MV' risk measure). If model = 'BL', True means historical covariance and returns and False Black Litterman covariance and historical returns. If model = 'FM', True means historical covariance and returns and False Risk Factor model for covariance and returns. If model = 'BL_FM', True means historical covariance and returns, False Black Litterman with Risk Factor model for covariance and Risk Factor model for returns, and '2' Risk Factor model for covariance and returns.")
\=`True`_)[\[source\]](https://riskfolio-lib.readthedocs.io/en/latest/_modules/Portfolio.html#Portfolio.efficient_frontier)
[¶](https://riskfolio-lib.readthedocs.io/en/latest/portfolio.html#Portfolio.Portfolio.efficient_frontier "Link to this definition")
Method that calculates several portfolios in the efficient frontier of the selected risk measure, available with current assets and constraints.
Parameters:[¶](https://riskfolio-lib.readthedocs.io/en/latest/portfolio.html#Portfolio.Portfolio.efficient_frontier-parameters "Permalink to this headline")
model : [str](https://docs.python.org/3.11/library/stdtypes.html#str "(in Python v3.11)")
, optional[¶](https://riskfolio-lib.readthedocs.io/en/latest/portfolio.html#Portfolio.Portfolio.efficient_frontier.model "Permalink to this definition")
Methodology used to estimate input parameters. The default is ‘Classic’.
rm : [str](https://docs.python.org/3.11/library/stdtypes.html#str "(in Python v3.11)")
, optional[¶](https://riskfolio-lib.readthedocs.io/en/latest/portfolio.html#Portfolio.Portfolio.efficient_frontier.rm "Permalink to this definition")
The risk measure used to optimize the portfolio. The default is ‘MV’. Possible values are:
* ’MV’: Standard Deviation.
* ’KT’: Square Root of Kurtosis.
* ’MAD’: Mean Absolute Deviation.
* ’GMD’: Gini Mean Difference.
* ’MSV’: Semi Standard Deviation.
* ’SKT’: Square Root of Semi Kurtosis.
* ’FLPM’: First Lower Partial Moment (Omega Ratio).
* ’SLPM’: Second Lower Partial Moment (Sortino Ratio).
* ’CVaR’: Conditional Value at Risk.
* ’TG’: Tail Gini.
* ’EVaR’: Entropic Value at Risk.
* ’RLVaR’: Relativistic Value at Risk.
* ’WR’: Worst Realization (Minimax).
* ’RG’: Range of returns.
* ’CVRG’: CVaR range of returns.
* ’TGRG’: Tail Gini range of returns.
* ’EVRG’: EVaR range of returns.
* ’RVRG’: RLVaR range of returns. I recommend only use this function with MOSEK solver.
* ’MDD’: Maximum Drawdown of uncompounded cumulative returns (Calmar Ratio).
* ’ADD’: Average Drawdown of uncompounded cumulative returns.
* ’CDaR’: Conditional Drawdown at Risk of uncompounded cumulative returns.
* ’EDaR’: Entropic Drawdown at Risk of uncompounded cumulative returns.
* ’RLDaR’: Relativistic Drawdown at Risk of uncompounded cumulative returns. I recommend only use this function with MOSEK solver.
* ’UCI’: Ulcer Index of uncompounded cumulative returns.
kelly : [str](https://docs.python.org/3.11/library/stdtypes.html#str "(in Python v3.11)")
, optional[¶](https://riskfolio-lib.readthedocs.io/en/latest/portfolio.html#Portfolio.Portfolio.efficient_frontier.kelly "Permalink to this definition")
Method used to calculate mean return. Possible values are: None for arithmetic mean return, “approx” for approximate mean logarithmic return using first and second moment and “exact” for mean logarithmic return. The default is None.
points : scalar, optional[¶](https://riskfolio-lib.readthedocs.io/en/latest/portfolio.html#Portfolio.Portfolio.efficient_frontier.points "Permalink to this definition")
Number of point calculated from the efficient frontier. The default is 50.
rf : scalar, optional[¶](https://riskfolio-lib.readthedocs.io/en/latest/portfolio.html#Portfolio.Portfolio.efficient_frontier.rf "Permalink to this definition")
Risk free rate. The default is 0.
solver : [str](https://docs.python.org/3.11/library/stdtypes.html#str "(in Python v3.11)")
, optional[¶](https://riskfolio-lib.readthedocs.io/en/latest/portfolio.html#Portfolio.Portfolio.efficient_frontier.solver "Permalink to this definition")
Solver available for CVXPY that supports power cone programming. Used to calculate RLVaR and RLDaR. The default value is ‘CLARABEL’.
hist : [bool](https://docs.python.org/3.11/library/functions.html#bool "(in Python v3.11)")
, optional[¶](https://riskfolio-lib.readthedocs.io/en/latest/portfolio.html#Portfolio.Portfolio.efficient_frontier.hist "Permalink to this definition")
Indicate what kind of returns are used to calculate risk measures that depends on scenarios (All except ‘MV’ risk measure). If model = ‘BL’, True means historical covariance and returns and False Black Litterman covariance and historical returns. If model = ‘FM’, True means historical covariance and returns and False Risk Factor model for covariance and returns. If model = ‘BL\_FM’, True means historical covariance and returns, False Black Litterman with Risk Factor model for covariance and Risk Factor model for returns, and ‘2’ Risk Factor model for covariance and returns. The default is True.
Returns:[¶](https://riskfolio-lib.readthedocs.io/en/latest/portfolio.html#Portfolio.Portfolio.efficient_frontier-returns "Permalink to this headline")
**frontier** – A dataframe that containts the weights of the portfolios.
Return type:[¶](https://riskfolio-lib.readthedocs.io/en/latest/portfolio.html#Portfolio.Portfolio.efficient_frontier-return-type "Permalink to this headline")
DataFrame
Notes
It’s recommendable that don’t use this method when there are too many assets (more than 100) and you are using a scenario based risk measure (all except standard deviation). It’s preferable to use frontier\_limits method (faster) to know the range of expected return and expected risk.
reset\_risk\_constraints()[\[source\]](https://riskfolio-lib.readthedocs.io/en/latest/_modules/Portfolio.html#Portfolio.reset_risk_constraints)
[¶](https://riskfolio-lib.readthedocs.io/en/latest/portfolio.html#Portfolio.Portfolio.reset_risk_constraints "Link to this definition")
Reset all risk constraints.
reset\_linear\_constraints()[\[source\]](https://riskfolio-lib.readthedocs.io/en/latest/_modules/Portfolio.html#Portfolio.reset_linear_constraints)
[¶](https://riskfolio-lib.readthedocs.io/en/latest/portfolio.html#Portfolio.Portfolio.reset_linear_constraints "Link to this definition")
Reset all linear constraints.
reset\_inputs()[\[source\]](https://riskfolio-lib.readthedocs.io/en/latest/_modules/Portfolio.html#Portfolio.reset_inputs)
[¶](https://riskfolio-lib.readthedocs.io/en/latest/portfolio.html#Portfolio.Portfolio.reset_inputs "Link to this definition")
Reset all inputs parameters of optimization models.
reset\_all()[\[source\]](https://riskfolio-lib.readthedocs.io/en/latest/_modules/Portfolio.html#Portfolio.reset_all)
[¶](https://riskfolio-lib.readthedocs.io/en/latest/portfolio.html#Portfolio.Portfolio.reset_all "Link to this definition")
Reset portfolio object to defatult values.
Bibliography[¶](https://riskfolio-lib.readthedocs.io/en/latest/portfolio.html#bibliography "Link to this heading")
-------------------------------------------------------------------------------------------------------------------
\[A1\] ([1](https://riskfolio-lib.readthedocs.io/en/latest/portfolio.html#id1)
,[2](https://riskfolio-lib.readthedocs.io/en/latest/portfolio.html#id74)
)
Edward Thorp. The kelly criterion in blackjack, sports betting, and the stock market. _Handbook of Asset and Liability Management_, 1:, 12 2008. [doi:10.1016/B978-044453248-0.50015-0](https://doi.org/10.1016/B978-044453248-0.50015-0)
.
\[A2\] ([1](https://riskfolio-lib.readthedocs.io/en/latest/portfolio.html#id2)
,[2](https://riskfolio-lib.readthedocs.io/en/latest/portfolio.html#id75)
)
Dany Cajas. Kelly portfolio optimization: a disciplined convex programming framework. _SSRN Electronic Journal_, 2021. URL: [https://doi.org/10.2139/ssrn.3833617](https://doi.org/10.2139/ssrn.3833617)
, [doi:10.2139/ssrn.3833617](https://doi.org/10.2139/ssrn.3833617)
.
\[A3\] ([1](https://riskfolio-lib.readthedocs.io/en/latest/portfolio.html#id3)
,[2](https://riskfolio-lib.readthedocs.io/en/latest/portfolio.html#id76)
,[3](https://riskfolio-lib.readthedocs.io/en/latest/portfolio.html#id171)
)
Dany Cajas. A semidefinite programming approach to risk parity portfolio optimization. _SSRN Electronic Journal_, 2025. URL: [http://dx.doi.org/10.2139/ssrn.5097869](http://dx.doi.org/10.2139/ssrn.5097869)
, [doi:10.2139/ssrn.5097869](https://doi.org/10.2139/ssrn.5097869)
.
\[A4\] ([1](https://riskfolio-lib.readthedocs.io/en/latest/portfolio.html#id4)
,[2](https://riskfolio-lib.readthedocs.io/en/latest/portfolio.html#id39)
)
Harry Markowitz. Portfolio selection. _The Journal of Finance_, 7(1):77–91, 1952. URL: [http://www.jstor.org/stable/2975974](http://www.jstor.org/stable/2975974)
.
\[A5\] ([1](https://riskfolio-lib.readthedocs.io/en/latest/portfolio.html#id5)
,[2](https://riskfolio-lib.readthedocs.io/en/latest/portfolio.html#id18)
,[3](https://riskfolio-lib.readthedocs.io/en/latest/portfolio.html#id40)
,[4](https://riskfolio-lib.readthedocs.io/en/latest/portfolio.html#id53)
,[5](https://riskfolio-lib.readthedocs.io/en/latest/portfolio.html#id105)
,[6](https://riskfolio-lib.readthedocs.io/en/latest/portfolio.html#id106)
)
Dany Cajas. Convex optimization of portfolio kurtosis. _SSRN Electronic Journal_, 2022. URL: [https://doi.org/10.2139/ssrn.4202967](https://doi.org/10.2139/ssrn.4202967)
, [doi:10.2139/ssrn.4202967](https://doi.org/10.2139/ssrn.4202967)
.
\[A6\] ([1](https://riskfolio-lib.readthedocs.io/en/latest/portfolio.html#id6)
,[2](https://riskfolio-lib.readthedocs.io/en/latest/portfolio.html#id19)
,[3](https://riskfolio-lib.readthedocs.io/en/latest/portfolio.html#id41)
,[4](https://riskfolio-lib.readthedocs.io/en/latest/portfolio.html#id54)
)
Dany Cajas. Approximation of portfolio kurtosis through sum of squared quadratic forms. _SSRN Electronic Journal_, 6 2023. [doi:10.2139/ssrn.4472793](https://doi.org/10.2139/ssrn.4472793)
.
\[A7\] ([1](https://riskfolio-lib.readthedocs.io/en/latest/portfolio.html#id7)
,[2](https://riskfolio-lib.readthedocs.io/en/latest/portfolio.html#id42)
)
Hiroshi Konno and Hiroaki Yamazaki. Mean-absolute deviation portfolio optimization model and its applications to tokyo stock market. _Management Science_, 37(5):519–531, 1991. URL: [https://EconPapers.repec.org/RePEc:inm:ormnsc:v:37:y:1991:i:5:p:519-531](https://econpapers.repec.org/RePEc:inm:ormnsc:v:37:y:1991:i:5:p:519-531)
.
\[A8\] ([1](https://riskfolio-lib.readthedocs.io/en/latest/portfolio.html#id8)
,[2](https://riskfolio-lib.readthedocs.io/en/latest/portfolio.html#id43)
)
Shlomo Yitzhaki. Stochastic dominance, mean variance, and gini's mean difference. _American Economic Review_, 72:178–85, 01 1982.
\[A9\] ([1](https://riskfolio-lib.readthedocs.io/en/latest/portfolio.html#id9)
,[2](https://riskfolio-lib.readthedocs.io/en/latest/portfolio.html#id11)
,[3](https://riskfolio-lib.readthedocs.io/en/latest/portfolio.html#id13)
,[4](https://riskfolio-lib.readthedocs.io/en/latest/portfolio.html#id16)
,[5](https://riskfolio-lib.readthedocs.io/en/latest/portfolio.html#id24)
,[6](https://riskfolio-lib.readthedocs.io/en/latest/portfolio.html#id44)
,[7](https://riskfolio-lib.readthedocs.io/en/latest/portfolio.html#id46)
,[8](https://riskfolio-lib.readthedocs.io/en/latest/portfolio.html#id48)
,[9](https://riskfolio-lib.readthedocs.io/en/latest/portfolio.html#id59)
,[10](https://riskfolio-lib.readthedocs.io/en/latest/portfolio.html#id77)
)
Dany Cajas. Owa portfolio optimization: a disciplined convex programming framework. _SSRN Electronic Journal_, 2021. URL: [https://doi.org/10.2139/ssrn.3988927](https://doi.org/10.2139/ssrn.3988927)
, [doi:10.2139/ssrn.3988927](https://doi.org/10.2139/ssrn.3988927)
.
\[A10\] ([1](https://riskfolio-lib.readthedocs.io/en/latest/portfolio.html#id10)
,[2](https://riskfolio-lib.readthedocs.io/en/latest/portfolio.html#id25)
,[3](https://riskfolio-lib.readthedocs.io/en/latest/portfolio.html#id45)
,[4](https://riskfolio-lib.readthedocs.io/en/latest/portfolio.html#id60)
)
Dany Cajas. Efficient gini mean difference and tail gini portfolio optimization based on p-norms. _SSRN Electronic Journal_, 2024. URL: [http://dx.doi.org/10.2139/ssrn.4711326](http://dx.doi.org/10.2139/ssrn.4711326)
, [doi:10.2139/ssrn.4711326](https://doi.org/10.2139/ssrn.4711326)
.
\[A11\] ([1](https://riskfolio-lib.readthedocs.io/en/latest/portfolio.html#id12)
,[2](https://riskfolio-lib.readthedocs.io/en/latest/portfolio.html#id14)
,[3](https://riskfolio-lib.readthedocs.io/en/latest/portfolio.html#id15)
,[4](https://riskfolio-lib.readthedocs.io/en/latest/portfolio.html#id47)
,[5](https://riskfolio-lib.readthedocs.io/en/latest/portfolio.html#id49)
,[6](https://riskfolio-lib.readthedocs.io/en/latest/portfolio.html#id50)
,[7](https://riskfolio-lib.readthedocs.io/en/latest/portfolio.html#id51)
)
Dany Cajas. _Advanced portfolio optimization_. Springer International Publishing, Cham, Switzerland, April 2025.
\[A12\] ([1](https://riskfolio-lib.readthedocs.io/en/latest/portfolio.html#id17)
,[2](https://riskfolio-lib.readthedocs.io/en/latest/portfolio.html#id52)
)
Renata Mansini, W. Ogryczak, and M.Grazia Speranza. Twenty years of linear programming based portfolio optimization. _European Journal of Operational Research_, 234:518–535, 04 2014. [doi:10.1016/j.ejor.2013.08.035](https://doi.org/10.1016/j.ejor.2013.08.035)
.
\[A13\] ([1](https://riskfolio-lib.readthedocs.io/en/latest/portfolio.html#id20)
,[2](https://riskfolio-lib.readthedocs.io/en/latest/portfolio.html#id21)
,[3](https://riskfolio-lib.readthedocs.io/en/latest/portfolio.html#id55)
,[4](https://riskfolio-lib.readthedocs.io/en/latest/portfolio.html#id56)
)
Renata Mansini, W. Ogryczak, and M.Grazia Speranza. _Linear Models for Portfolio Optimization_, pages 19–45. Springer, 01 2015. [doi:10.1007/978-3-319-18482-1\_2](https://doi.org/10.1007/978-3-319-18482-1_2)
.
\[A14\] ([1](https://riskfolio-lib.readthedocs.io/en/latest/portfolio.html#id22)
,[2](https://riskfolio-lib.readthedocs.io/en/latest/portfolio.html#id57)
)
R. Tyrrell Rockafellar and Stanislav Uryasev. Optimization of conditional value-at-risk. _Journal of Risk_, 2:21–41, 2000.
\[A15\] ([1](https://riskfolio-lib.readthedocs.io/en/latest/portfolio.html#id23)
,[2](https://riskfolio-lib.readthedocs.io/en/latest/portfolio.html#id58)
)
W. Ogryczak and Andrzej Ruszczynskia. Dual stochastic dominance and quantile risk measures. _International Transactions in Operational Research_, 9:661–680, 09 2002. [doi:10.1111/1475-3995.00380](https://doi.org/10.1111/1475-3995.00380)
.
\[A16\] ([1](https://riskfolio-lib.readthedocs.io/en/latest/portfolio.html#id26)
,[2](https://riskfolio-lib.readthedocs.io/en/latest/portfolio.html#id61)
)
Amir Ahmadi Javid. Entropic value-at-risk: a new coherent risk measure. _Journal of Optimization Theory and Applications_, 12 2012. [doi:10.1007/s10957-011-9968-2](https://doi.org/10.1007/s10957-011-9968-2)
.
\[A17\] ([1](https://riskfolio-lib.readthedocs.io/en/latest/portfolio.html#id27)
,[2](https://riskfolio-lib.readthedocs.io/en/latest/portfolio.html#id62)
)
Amir Ahmadi Javid and Malihe Fallah. Portfolio optimization with entropic value-at-risk. _European Journal of Operational Research_, 08 2017. [doi:10.1016/j.ejor.2019.02.007](https://doi.org/10.1016/j.ejor.2019.02.007)
.
\[A18\] ([1](https://riskfolio-lib.readthedocs.io/en/latest/portfolio.html#id28)
,[2](https://riskfolio-lib.readthedocs.io/en/latest/portfolio.html#id34)
,[3](https://riskfolio-lib.readthedocs.io/en/latest/portfolio.html#id63)
,[4](https://riskfolio-lib.readthedocs.io/en/latest/portfolio.html#id67)
)
Dany Cajas. Entropic portfolio optimization: a disciplined convex programming framework. _SSRN Electronic Journal_, 2021. URL: [https://doi.org/10.2139/ssrn.3792520](https://doi.org/10.2139/ssrn.3792520)
, [doi:10.2139/ssrn.3792520](https://doi.org/10.2139/ssrn.3792520)
.
\[A19\] ([1](https://riskfolio-lib.readthedocs.io/en/latest/portfolio.html#id29)
,[2](https://riskfolio-lib.readthedocs.io/en/latest/portfolio.html#id35)
,[3](https://riskfolio-lib.readthedocs.io/en/latest/portfolio.html#id64)
,[4](https://riskfolio-lib.readthedocs.io/en/latest/portfolio.html#id68)
)
Dany Cajas. Portfolio optimization of relativistic value at risk. _SSRN Electronic Journal_, 2023. URL: [https://doi.org/10.2139/ssrn.4378498](https://doi.org/10.2139/ssrn.4378498)
, [doi:10.2139/ssrn.4378498](https://doi.org/10.2139/ssrn.4378498)
.
\[[A20](https://riskfolio-lib.readthedocs.io/en/latest/portfolio.html#id30)\
\]
Renata Mansini, W. Ogryczak, and M.Grazia Speranza. On lp solvable models for portfolio selection. _Informatica_, 14:37–62, 01 2003.
\[A21\] ([1](https://riskfolio-lib.readthedocs.io/en/latest/portfolio.html#id31)
,[2](https://riskfolio-lib.readthedocs.io/en/latest/portfolio.html#id33)
,[3](https://riskfolio-lib.readthedocs.io/en/latest/portfolio.html#id36)
,[4](https://riskfolio-lib.readthedocs.io/en/latest/portfolio.html#id66)
)
A. Chekhlov, S. Uryasev, and M. Zabarankin. Portfolio optimization with drawdown constraints. In Panos M Pardalos, Athanasios Migdalas, and George Baourakis, editors, _Supply Chain And Finance_, volume of World Scientific Book Chapters, chapter 13, pages 209–228. World Scientific Publishing Co. Pte. Ltd., edition, November 2004. URL: [https://ideas.repec.org/h/wsi/wschap/9789812562586\_0013.html](https://ideas.repec.org/h/wsi/wschap/9789812562586_0013.html)
.
\[A22\] ([1](https://riskfolio-lib.readthedocs.io/en/latest/portfolio.html#id32)
,[2](https://riskfolio-lib.readthedocs.io/en/latest/portfolio.html#id65)
)
Peter Martin. _The investor's guide to fidelity funds_. Wiley, New York, 1989. ISBN 978-0471622581.
\[A23\] ([1](https://riskfolio-lib.readthedocs.io/en/latest/portfolio.html#id37)
,[2](https://riskfolio-lib.readthedocs.io/en/latest/portfolio.html#id166)
)
Benjamin Bruder and Thierry Roncalli. Managing risk exposures using the risk budgeting approach. _SSRN Electronic Journal_, pages, 01 2012. [doi:10.2139/ssrn.2009778](https://doi.org/10.2139/ssrn.2009778)
.
\[A24\] ([1](https://riskfolio-lib.readthedocs.io/en/latest/portfolio.html#id38)
,[2](https://riskfolio-lib.readthedocs.io/en/latest/portfolio.html#id167)
,[3](https://riskfolio-lib.readthedocs.io/en/latest/portfolio.html#id170)
)
Jean-Charles Richard and Thierry Roncalli. Constrained Risk Budgeting Portfolios: Theory, Algorithms, Applications & Puzzles. Papers 1902.05710, arXiv.org, February 2019. URL: [https://ideas.repec.org/p/arx/papers/1902.05710.html](https://ideas.repec.org/p/arx/papers/1902.05710.html)
.
\[A25\] ([1](https://riskfolio-lib.readthedocs.io/en/latest/portfolio.html#id69)
,[2](https://riskfolio-lib.readthedocs.io/en/latest/portfolio.html#id169)
)
Vaughn Gambeta and Roy Kwon. Risk return trade-off in relaxed risk parity portfolio optimization. _Journal of Risk and Financial Management_, 2020. URL: [https://www.mdpi.com/1911-8074/13/10/237](https://www.mdpi.com/1911-8074/13/10/237)
, [doi:10.3390/jrfm13100237](https://doi.org/10.3390/jrfm13100237)
.
\[A26\] ([1](https://riskfolio-lib.readthedocs.io/en/latest/portfolio.html#id70)
,[2](https://riskfolio-lib.readthedocs.io/en/latest/portfolio.html#id160)
,[3](https://riskfolio-lib.readthedocs.io/en/latest/portfolio.html#id165)
)
Miguel Sousa Lobo and Stephen Boyd. The worst-case risk of a portfolio. 10 2000.
\[A27\] ([1](https://riskfolio-lib.readthedocs.io/en/latest/portfolio.html#id71)
,[2](https://riskfolio-lib.readthedocs.io/en/latest/portfolio.html#id155)
)
Frank Fabozzi. _Robust portfolio optimization and management_. John Wiley, Hoboken, N.J, 2007. ISBN 978-0-471-92122-6.
\[[A28](https://riskfolio-lib.readthedocs.io/en/latest/portfolio.html#id72)\
\]
R.H. Tütüncü and M. Koenig. Robust asset allocation. _Annals of Operations Research_, 132:157–187, 01 2004. [doi:10.1023/B:ANOR.0000045281.41041.ed](https://doi.org/10.1023/B:ANOR.0000045281.41041.ed)
.
\[[A29](https://riskfolio-lib.readthedocs.io/en/latest/portfolio.html#id73)\
\]
Daniel Palomar. Robust optimization with applications. URL: [https://palomar.home.ece.ust.hk/ELEC5470\_lectures/slides\_robust\_optim.pdf](https://palomar.home.ece.ust.hk/ELEC5470_lectures/slides_robust_optim.pdf)
.
\[[A30](https://riskfolio-lib.readthedocs.io/en/latest/portfolio.html#id78)\
\]
Dany Cajas. Higher order moment portfolio optimization with l-moments. _SSRN Electronic Journal_, 2023. URL: [https://papers.ssrn.com/sol3/papers.cfm?abstract\_id=4393155](https://papers.ssrn.com/sol3/papers.cfm?abstract_id=4393155)
, [doi:10.2139/ssrn.4393155](https://doi.org/10.2139/ssrn.4393155)
.
\[[A31](https://riskfolio-lib.readthedocs.io/en/latest/portfolio.html#id79)\
\]
Dajun Yue and Fengqi You. Reformulation-linearization method for global optimization of mixed integer linear fractional programming problems with application on sustainable batch scheduling. In Jiří Jaromír Klemeš, Petar Sabev Varbanov, and Peng Yen Liew, editors, _24th European Symposium on Computer Aided Process Engineering_, volume 33 of Computer Aided Chemical Engineering, pages 949–954. Elsevier, 2014. URL: [https://www.sciencedirect.com/science/article/pii/B9780444634566501599](https://www.sciencedirect.com/science/article/pii/B9780444634566501599)
, [doi:https://doi.org/10.1016/B978-0-444-63456-6.50159-9](https://doi.org/https://doi.org/10.1016/B978-0-444-63456-6.50159-9)
.
\[A32\] ([1](https://riskfolio-lib.readthedocs.io/en/latest/portfolio.html#id80)
,[2](https://riskfolio-lib.readthedocs.io/en/latest/portfolio.html#id82)
,[3](https://riskfolio-lib.readthedocs.io/en/latest/portfolio.html#id84)
,[4](https://riskfolio-lib.readthedocs.io/en/latest/portfolio.html#id86)
,[5](https://riskfolio-lib.readthedocs.io/en/latest/portfolio.html#id88)
,[6](https://riskfolio-lib.readthedocs.io/en/latest/portfolio.html#id90)
,[7](https://riskfolio-lib.readthedocs.io/en/latest/portfolio.html#id91)
)
Dany Cajas. A graph theory approach to portfolio optimization. _SSRN Electronic Journal_, 10 2023. [doi:10.2139/ssrn.4602019](https://doi.org/10.2139/ssrn.4602019)
.
\[A33\] ([1](https://riskfolio-lib.readthedocs.io/en/latest/portfolio.html#id81)
,[2](https://riskfolio-lib.readthedocs.io/en/latest/portfolio.html#id83)
,[3](https://riskfolio-lib.readthedocs.io/en/latest/portfolio.html#id85)
,[4](https://riskfolio-lib.readthedocs.io/en/latest/portfolio.html#id87)
,[5](https://riskfolio-lib.readthedocs.io/en/latest/portfolio.html#id89)
)
Dany Cajas. A graph theory approach to portfolio optimization part ii. _SSRN Electronic Journal_, 12 2023. [doi:10.2139/ssrn.4540021](https://doi.org/10.2139/ssrn.4540021)
.
\[A34\] ([1](https://riskfolio-lib.readthedocs.io/en/latest/portfolio.html#id93)
,[2](https://riskfolio-lib.readthedocs.io/en/latest/portfolio.html#id112)
,[3](https://riskfolio-lib.readthedocs.io/en/latest/portfolio.html#id126)
,[4](https://riskfolio-lib.readthedocs.io/en/latest/portfolio.html#id143)
)
Attilio Meucci. _Risk and Asset Allocation_. Springer Berlin Heidelberg, 2005. URL: [https://doi.org/10.1007/978-3-540-27904-4](https://doi.org/10.1007/978-3-540-27904-4)
, [doi:10.1007/978-3-540-27904-4](https://doi.org/10.1007/978-3-540-27904-4)
.
\[A35\] ([1](https://riskfolio-lib.readthedocs.io/en/latest/portfolio.html#id94)
,[2](https://riskfolio-lib.readthedocs.io/en/latest/portfolio.html#id113)
,[3](https://riskfolio-lib.readthedocs.io/en/latest/portfolio.html#id127)
,[4](https://riskfolio-lib.readthedocs.io/en/latest/portfolio.html#id144)
)
Yiyong Feng and Daniel P. Palomar. A signal processing perspective of financial engineering. _Foundations and Trends® in Signal Processing_, 9(1-2):1–231, 2016. URL: [https://doi.org/10.1561/2000000072](https://doi.org/10.1561/2000000072)
, [doi:10.1561/2000000072](https://doi.org/10.1561/2000000072)
.
\[A36\] ([1](https://riskfolio-lib.readthedocs.io/en/latest/portfolio.html#id95)
,[2](https://riskfolio-lib.readthedocs.io/en/latest/portfolio.html#id114)
,[3](https://riskfolio-lib.readthedocs.io/en/latest/portfolio.html#id128)
,[4](https://riskfolio-lib.readthedocs.io/en/latest/portfolio.html#id145)
)
Philippe Jorion. Bayes-stein estimation for portfolio analysis. _The Journal of Financial and Quantitative Analysis_, 21(3):279, September 1986. URL: [https://doi.org/10.2307/2331042](https://doi.org/10.2307/2331042)
, [doi:10.2307/2331042](https://doi.org/10.2307/2331042)
.
\[A37\] ([1](https://riskfolio-lib.readthedocs.io/en/latest/portfolio.html#id96)
,[2](https://riskfolio-lib.readthedocs.io/en/latest/portfolio.html#id115)
,[3](https://riskfolio-lib.readthedocs.io/en/latest/portfolio.html#id129)
,[4](https://riskfolio-lib.readthedocs.io/en/latest/portfolio.html#id146)
)
Taras Bodnar, Ostap Okhrin, and Nestor Parolya. Optimal shrinkage estimator for high-dimensional mean vector. _Journal of Multivariate Analysis_, 170:63–79, 03 2019. URL: [https://doi.org/10.1016\\%2Fj.jmva.2018.07.004](https://doi.org/10.1016/%2Fj.jmva.2018.07.004)
, [doi:10.1016/j.jmva.2018.07.004](https://doi.org/10.1016/j.jmva.2018.07.004)
.
\[A38\] ([1](https://riskfolio-lib.readthedocs.io/en/latest/portfolio.html#id99)
,[2](https://riskfolio-lib.readthedocs.io/en/latest/portfolio.html#id118)
,[3](https://riskfolio-lib.readthedocs.io/en/latest/portfolio.html#id132)
,[4](https://riskfolio-lib.readthedocs.io/en/latest/portfolio.html#id149)
)
Wolfram Barfuss, Guido Previde Massara, T. Di Matteo, and Tomaso Aste. Parsimonious modeling with information filtering networks. _Physical Review E_, 12 2016. URL: [http://dx.doi.org/10.1103/PhysRevE.94.062306](http://dx.doi.org/10.1103/PhysRevE.94.062306)
, [doi:10.1103/physreve.94.062306](https://doi.org/10.1103/physreve.94.062306)
.
\[A39\] ([1](https://riskfolio-lib.readthedocs.io/en/latest/portfolio.html#id100)
,[2](https://riskfolio-lib.readthedocs.io/en/latest/portfolio.html#id101)
,[3](https://riskfolio-lib.readthedocs.io/en/latest/portfolio.html#id102)
,[4](https://riskfolio-lib.readthedocs.io/en/latest/portfolio.html#id107)
,[5](https://riskfolio-lib.readthedocs.io/en/latest/portfolio.html#id108)
,[6](https://riskfolio-lib.readthedocs.io/en/latest/portfolio.html#id109)
,[7](https://riskfolio-lib.readthedocs.io/en/latest/portfolio.html#id119)
,[8](https://riskfolio-lib.readthedocs.io/en/latest/portfolio.html#id120)
,[9](https://riskfolio-lib.readthedocs.io/en/latest/portfolio.html#id121)
,[10](https://riskfolio-lib.readthedocs.io/en/latest/portfolio.html#id133)
,[11](https://riskfolio-lib.readthedocs.io/en/latest/portfolio.html#id134)
,[12](https://riskfolio-lib.readthedocs.io/en/latest/portfolio.html#id135)
,[13](https://riskfolio-lib.readthedocs.io/en/latest/portfolio.html#id150)
,[14](https://riskfolio-lib.readthedocs.io/en/latest/portfolio.html#id151)
,[15](https://riskfolio-lib.readthedocs.io/en/latest/portfolio.html#id152)
)
Marcos M. López de Prado. _Machine Learning for Asset Managers_. Elements in Quantitative Finance. Cambridge University Press, 2020. [doi:10.1017/9781108883658](https://doi.org/10.1017/9781108883658)
.
\[A40\] ([1](https://riskfolio-lib.readthedocs.io/en/latest/portfolio.html#id103)
,[2](https://riskfolio-lib.readthedocs.io/en/latest/portfolio.html#id104)
,[3](https://riskfolio-lib.readthedocs.io/en/latest/portfolio.html#id122)
,[4](https://riskfolio-lib.readthedocs.io/en/latest/portfolio.html#id123)
,[5](https://riskfolio-lib.readthedocs.io/en/latest/portfolio.html#id136)
,[6](https://riskfolio-lib.readthedocs.io/en/latest/portfolio.html#id137)
,[7](https://riskfolio-lib.readthedocs.io/en/latest/portfolio.html#id153)
,[8](https://riskfolio-lib.readthedocs.io/en/latest/portfolio.html#id154)
)
Sander Gerber, Harry Markowitz, Philip Ernst, Yinsen Miao, Babak Javid, and Paul Sargen. The gerber statistic: a robust co-movement measure for portfolio optimization. _SSRN Electronic Journal_, 2021. URL: [https://doi.org/10.2139/ssrn.3880054](https://doi.org/10.2139/ssrn.3880054)
, [doi:10.2139/ssrn.3880054](https://doi.org/10.2139/ssrn.3880054)
.
\[A41\] ([1](https://riskfolio-lib.readthedocs.io/en/latest/portfolio.html#id156)
,[2](https://riskfolio-lib.readthedocs.io/en/latest/portfolio.html#id161)
)
Mingyu Yang. Uncertainty set sizes, sensitivity analysis, in robust portfolio optimization. Master's thesis, University of Waterloo, 2019. URL: [https://www.math.uwaterloo.ca/~hwolkowi/henry/reports/MingyuYangCM-eresearchpaper-printcopy.pdf](https://www.math.uwaterloo.ca/~hwolkowi/henry/reports/MingyuYangCM-eresearchpaper-printcopy.pdf)
.
\[A42\] ([1](https://riskfolio-lib.readthedocs.io/en/latest/portfolio.html#id157)
,[2](https://riskfolio-lib.readthedocs.io/en/latest/portfolio.html#id162)
)
Reha H. Tütüncü and Matthias Koenig. Robust asset allocation. _Annals of Operations Research_, 132:157–187, 2004. URL: [https://api.semanticscholar.org/CorpusID:2669348](https://api.semanticscholar.org/CorpusID:2669348)
.
\[A43\] ([1](https://riskfolio-lib.readthedocs.io/en/latest/portfolio.html#id158)
,[2](https://riskfolio-lib.readthedocs.io/en/latest/portfolio.html#id163)
)
Frank J Fabozzi, Petter N Kolm, Dessislava A Pachamanova, and Sergio M Focardi. _Robust Portfolio Optimization and Management_. John Wiley & Sons, Nashville, TN, 05 2007.
\[A44\] ([1](https://riskfolio-lib.readthedocs.io/en/latest/portfolio.html#id159)
,[2](https://riskfolio-lib.readthedocs.io/en/latest/portfolio.html#id164)
)
Laurent El Ghaoui, Maksim Oks, and Francois Oustry. Worst-case value-at-risk and robust portfolio optimization: a conic programming approach. _Oper. Res._, 51(4):543–556, 2003.
\[[A45](https://riskfolio-lib.readthedocs.io/en/latest/portfolio.html#id168)\
\]
Thierry Roncalli and Guillaume Weisang. Risk parity portfolios with risk factors. _SSRN Electronic Journal_, 09 2012. [doi:10.2139/ssrn.2155159](https://doi.org/10.2139/ssrn.2155159)
.
[**On-Demand H100 SXM GPUs for $2.99/hr/GPU with Lambda** 640 GB of vRAM in one 8x instance **Launch now**](https://server.ethicalads.io/proxy/click/9837/019d0edd-8fac-7681-b3ae-6e1cc74dab4a/)
[Ads by EthicalAds](https://www.ethicalads.io/advertisers/topics/data-science/?ref=ea-text)
---
# Parameters Estimation - Riskfolio-Lib 7.2
[Skip to content](https://riskfolio-lib.readthedocs.io/en/latest/parameters.html#module-ParamsEstimation)
Parameters Estimation[¶](https://riskfolio-lib.readthedocs.io/en/latest/parameters.html#parameters-estimation "Link to this heading")
======================================================================================================================================
[Buy Advanced Portfolio Optimization Book on Springer](https://www.kqzyfj.com/click-101359873-15150084?url=https%3A%2F%2Flink.springer.com%2Fbook%2F9783031843037)
[Enroll in the Portfolio Optimization with Python Course](https://www.paypal.com/ncp/payment/GN55W4UQ7VAMN)
[](https://github.com/sponsors/dcajasn)
[](https://ko-fi.com/B0B833SXD)
This module has functions that allows us to estimate the vector of means, covariance matrix and cokurtosis square matrix using several methods:
* Historical estimates.
* Estimates using exponencial weighted moving averages (EWMA).
* Robust estimates of the covariance matrix like Ledoit and Wolf, Oracle, Shrinkage and Graphical Lasso, j-LoGo \[[B2](https://riskfolio-lib.readthedocs.io/en/latest/parameters.html#id141 "Wolfram Barfuss, Guido Previde Massara, T. Di Matteo, and Tomaso Aste. Parsimonious modeling with information filtering networks. Physical Review E, 12 2016. URL: http://dx.doi.org/10.1103/PhysRevE.94.062306, doi:10.1103/physreve.94.062306.")\
\], Gerber statistic \[[B3](https://riskfolio-lib.readthedocs.io/en/latest/parameters.html#id146 "Sander Gerber, Harry Markowitz, Philip Ernst, Yinsen Miao, Babak Javid, and Paul Sargen. The gerber statistic: a robust co-movement measure for portfolio optimization. SSRN Electronic Journal, 2021. URL: https://doi.org/10.2139/ssrn.3880054, doi:10.2139/ssrn.3880054.")\
\] and Denoise \[[B1](https://riskfolio-lib.readthedocs.io/en/latest/parameters.html#id142 "Marcos M. López de Prado. Machine Learning for Asset Managers. Elements in Quantitative Finance. Cambridge University Press, 2020. doi:10.1017/9781108883658.")\
\] estimators.
* Factors models to estimate the vector of means, covariance matrix, coskewness tensor and cokurtosis square matrix \[[B4](https://riskfolio-lib.readthedocs.io/en/latest/parameters.html#id170 "Kris Boudt, Wanbo Lu, and Benedict Peeters. Higher order comoments of multifactor models and asset allocation. Finance Research Letters, 13:225–233, May 2015. URL: http://dx.doi.org/10.1016/j.frl.2014.12.008, doi:10.1016/j.frl.2014.12.008.")\
\].
* The Black Litterman model that allows to incorporate analyst’s views on returns in estimates of vector of means and covariance matrix \[[B5](https://riskfolio-lib.readthedocs.io/en/latest/parameters.html#id112 "Fischer Black and Robert Litterman. Global portfolio optimization. Financial Analysts Journal, 48(5):28–43, 1992. URL: http://www.jstor.org/stable/4479577.")\
\] \[[B6](https://riskfolio-lib.readthedocs.io/en/latest/parameters.html#id83 "Jay Walters. The black-litterman model in detail. SSRN Electronic Journal, pages, 07 2011. doi:10.2139/ssrn.1314585.")\
\].
* The Augmented Black Litterman model that allows to incorporate analyst’s views on risk factors in estimates of vector of means and covariance matrix \[[B7](https://riskfolio-lib.readthedocs.io/en/latest/parameters.html#id122 "Wing Cheung. The augmented black-litterman model: a ranking-free approach to factor-based portfolio construction and beyond. Quantitative Finance, 13:, 08 2007. doi:10.2139/ssrn.1347648.")\
\].
* The Black Litterman Bayesian model that allows to incorporate analyst’s views on risk factors in estimates of vector of means and covariance matrix \[[B8](https://riskfolio-lib.readthedocs.io/en/latest/parameters.html#id124 "Petter Kolm and Gordon Ritter. On the bayesian interpretation of black-litterman. European Journal of Operational Research, 258:, 10 2016. doi:10.1016/j.ejor.2016.10.027.")\
\].
* Bootstrapping methods to estimate the input parameters of the uncertainty sets on mean vector and covariance matrix for worst case optimization models.
Module Functions[¶](https://riskfolio-lib.readthedocs.io/en/latest/parameters.html#module-ParamsEstimation "Link to this heading")
-----------------------------------------------------------------------------------------------------------------------------------
ParamsEstimation.mean\_vector(_[X](https://riskfolio-lib.readthedocs.io/en/latest/parameters.html#ParamsEstimation.mean_vector.X "ParamsEstimation.mean_vector.X (Python parameter) — Assets returns DataFrame, where n_samples is the number of observations and n_assets is the number of assets.")
_, _[method](https://riskfolio-lib.readthedocs.io/en/latest/parameters.html#ParamsEstimation.mean_vector.method "ParamsEstimation.mean_vector.method (Python parameter) — The method used to estimate the expected returns. The default value is 'hist'.")
\=`'hist'`_, _[d](https://riskfolio-lib.readthedocs.io/en/latest/parameters.html#ParamsEstimation.mean_vector.d "ParamsEstimation.mean_vector.d (Python parameter) — The smoothing factor of ewma methods. The default is 0.94.")
\=`0.94`_, _[target](https://riskfolio-lib.readthedocs.io/en/latest/parameters.html#ParamsEstimation.mean_vector.target "ParamsEstimation.mean_vector.target (Python parameter) — The target mean vector.")
\=`'b1'`_)[\[source\]](https://riskfolio-lib.readthedocs.io/en/latest/_modules/ParamsEstimation.html#mean_vector)
[¶](https://riskfolio-lib.readthedocs.io/en/latest/parameters.html#ParamsEstimation.mean_vector "Link to this definition")
Calculate the expected returns vector using the selected method.
Parameters:[¶](https://riskfolio-lib.readthedocs.io/en/latest/parameters.html#ParamsEstimation.mean_vector-parameters "Permalink to this headline")
X : DataFrame of shape (n\_samples, n\_assets)[¶](https://riskfolio-lib.readthedocs.io/en/latest/parameters.html#ParamsEstimation.mean_vector.X "Permalink to this definition")
Assets returns DataFrame, where n\_samples is the number of observations and n\_assets is the number of assets.
method : [str](https://docs.python.org/3.11/library/stdtypes.html#str "(in Python v3.11)")
, optional[¶](https://riskfolio-lib.readthedocs.io/en/latest/parameters.html#ParamsEstimation.mean_vector.method "Permalink to this definition")
The method used to estimate the expected returns. The default value is ‘hist’. Possible values are:
* ’hist’: use historical estimator.
* ’ewma1’: use ewma with adjust=True. For more information see [EWM](https://pandas.pydata.org/pandas-docs/stable/user_guide/window.html#exponentially-weighted-window)
.
* ’ewma2’: use ewma with adjust=False. For more information see [EWM](https://pandas.pydata.org/pandas-docs/stable/user_guide/window.html#exponentially-weighted-window)
.
* ’JS’: James-Stein estimator. For more information see \[[B9](https://riskfolio-lib.readthedocs.io/en/latest/parameters.html#id156 "Attilio Meucci. Risk and Asset Allocation. Springer Berlin Heidelberg, 2005. URL: https://doi.org/10.1007/978-3-540-27904-4, doi:10.1007/978-3-540-27904-4.")\
\] and \[[B10](https://riskfolio-lib.readthedocs.io/en/latest/parameters.html#id157 "Yiyong Feng and Daniel P. Palomar. A signal processing perspective of financial engineering. Foundations and Trends® in Signal Processing, 9(1-2):1–231, 2016. URL: https://doi.org/10.1561/2000000072, doi:10.1561/2000000072.")\
\].
* ’BS’: Bayes-Stein estimator. For more information see \[[B11](https://riskfolio-lib.readthedocs.io/en/latest/parameters.html#id158 "Philippe Jorion. Bayes-stein estimation for portfolio analysis. The Journal of Financial and Quantitative Analysis, 21(3):279, September 1986. URL: https://doi.org/10.2307/2331042, doi:10.2307/2331042.")\
\].
* ’BOP’: BOP estimator. For more information see \[[B12](https://riskfolio-lib.readthedocs.io/en/latest/parameters.html#id159 "Taras Bodnar, Ostap Okhrin, and Nestor Parolya. Optimal shrinkage estimator for high-dimensional mean vector. Journal of Multivariate Analysis, 170:63–79, 03 2019. URL: https://doi.org/10.1016\%2Fj.jmva.2018.07.004, doi:10.1016/j.jmva.2018.07.004.")\
\].
d : scalar[¶](https://riskfolio-lib.readthedocs.io/en/latest/parameters.html#ParamsEstimation.mean_vector.d "Permalink to this definition")
The smoothing factor of ewma methods. The default is 0.94.
target : [str](https://docs.python.org/3.11/library/stdtypes.html#str "(in Python v3.11)")
, optional[¶](https://riskfolio-lib.readthedocs.io/en/latest/parameters.html#ParamsEstimation.mean_vector.target "Permalink to this definition")
The target mean vector. The default value is ‘b1’. Possible values are:
* ’b1’: grand mean.
* ’b2’: volatility weighted grand mean.
* ’b3’: mean square error of sample mean.
Returns:[¶](https://riskfolio-lib.readthedocs.io/en/latest/parameters.html#ParamsEstimation.mean_vector-returns "Permalink to this headline")
**mu** – The estimation of expected returns.
Return type:[¶](https://riskfolio-lib.readthedocs.io/en/latest/parameters.html#ParamsEstimation.mean_vector-return-type "Permalink to this headline")
1d-array
Raises:[¶](https://riskfolio-lib.readthedocs.io/en/latest/parameters.html#ParamsEstimation.mean_vector-raises "Permalink to this headline")
[**ValueError**](https://docs.python.org/3.11/library/exceptions.html#ValueError "(in Python v3.11)")
– When the value cannot be calculated.
ParamsEstimation.covar\_matrix(_[X](https://riskfolio-lib.readthedocs.io/en/latest/parameters.html#ParamsEstimation.covar_matrix.X "ParamsEstimation.covar_matrix.X (Python parameter) — Assets returns DataFrame, where n_samples is the number of observations and n_assets is the number of assets.")
_, _[method](https://riskfolio-lib.readthedocs.io/en/latest/parameters.html#ParamsEstimation.covar_matrix.method "ParamsEstimation.covar_matrix.method (Python parameter) — The method used to estimate the covariance matrix: The default is 'hist'.")
\=`'hist'`_, _[d](https://riskfolio-lib.readthedocs.io/en/latest/parameters.html#ParamsEstimation.covar_matrix.d "ParamsEstimation.covar_matrix.d (Python parameter) — The smoothing factor of ewma methods.")
\=`0.94`_, _[alpha](https://riskfolio-lib.readthedocs.io/en/latest/parameters.html#ParamsEstimation.covar_matrix.alpha "ParamsEstimation.covar_matrix.alpha (Python parameter) — The shrfactor of shrunk and shrink method.")
\=`0.1`_, _[bWidth](https://riskfolio-lib.readthedocs.io/en/latest/parameters.html#ParamsEstimation.covar_matrix.bWidth "ParamsEstimation.covar_matrix.bWidth (Python parameter) — The bandwidth of the kernel for 'fixed', 'spectral' and 'shrink' methods.")
\=`0.01`_, _[detone](https://riskfolio-lib.readthedocs.io/en/latest/parameters.html#ParamsEstimation.covar_matrix.detone "ParamsEstimation.covar_matrix.detone (Python parameter) — If remove the first mkt_comp of correlation matrix for 'fixed', 'spectral' and 'shrink' methods.")
\=`False`_, _[mkt\_comp](https://riskfolio-lib.readthedocs.io/en/latest/parameters.html#ParamsEstimation.covar_matrix.mkt_comp "ParamsEstimation.covar_matrix.mkt_comp (Python parameter) — Number of first components that will be removed using the detone method.")
\=`1`_, _[threshold](https://riskfolio-lib.readthedocs.io/en/latest/parameters.html#ParamsEstimation.covar_matrix.threshold "ParamsEstimation.covar_matrix.threshold (Python parameter) — Threshold for 'gerber1' and 'gerber2' methods is between 0 and 1.")
\=`0.5`_)[\[source\]](https://riskfolio-lib.readthedocs.io/en/latest/_modules/ParamsEstimation.html#covar_matrix)
[¶](https://riskfolio-lib.readthedocs.io/en/latest/parameters.html#ParamsEstimation.covar_matrix "Link to this definition")
Calculate the covariance matrix using the selected method.
Parameters:[¶](https://riskfolio-lib.readthedocs.io/en/latest/parameters.html#ParamsEstimation.covar_matrix-parameters "Permalink to this headline")
X : DataFrame of shape (n\_samples, n\_assets)[¶](https://riskfolio-lib.readthedocs.io/en/latest/parameters.html#ParamsEstimation.covar_matrix.X "Permalink to this definition")
Assets returns DataFrame, where n\_samples is the number of observations and n\_assets is the number of assets.
method : [str](https://docs.python.org/3.11/library/stdtypes.html#str "(in Python v3.11)")
, optional[¶](https://riskfolio-lib.readthedocs.io/en/latest/parameters.html#ParamsEstimation.covar_matrix.method "Permalink to this definition")
The method used to estimate the covariance matrix: The default is ‘hist’. Possible values are:
* ’hist’: use historical estimates.
* ’semi’: use semi lower covariance matrix.
* ’ewma1’: use ewma with adjust=True. For more information see [EWM](https://pandas.pydata.org/pandas-docs/stable/user_guide/window.html#exponentially-weighted-window)
.
* ’ewma2’: use ewma with adjust=False. For more information see [EWM](https://pandas.pydata.org/pandas-docs/stable/user_guide/window.html#exponentially-weighted-window)
.
* ’ledoit’: use the Ledoit and Wolf Shrinkage method.
* ’oas’: use the Oracle Approximation Shrinkage method.
* ’shrunk’: use the basic Shrunk Covariance method.
* ’gl’: use the basic Graphical Lasso Covariance method.
* ’jlogo’: use the j-LoGo Covariance method. For more information see: \[[B2](https://riskfolio-lib.readthedocs.io/en/latest/parameters.html#id141 "Wolfram Barfuss, Guido Previde Massara, T. Di Matteo, and Tomaso Aste. Parsimonious modeling with information filtering networks. Physical Review E, 12 2016. URL: http://dx.doi.org/10.1103/PhysRevE.94.062306, doi:10.1103/physreve.94.062306.")\
\].
* ’fixed’: denoise using fixed method. For more information see chapter 2 of \[[B1](https://riskfolio-lib.readthedocs.io/en/latest/parameters.html#id142 "Marcos M. López de Prado. Machine Learning for Asset Managers. Elements in Quantitative Finance. Cambridge University Press, 2020. doi:10.1017/9781108883658.")\
\].
* ’spectral’: denoise using spectral method. For more information see chapter 2 of \[[B1](https://riskfolio-lib.readthedocs.io/en/latest/parameters.html#id142 "Marcos M. López de Prado. Machine Learning for Asset Managers. Elements in Quantitative Finance. Cambridge University Press, 2020. doi:10.1017/9781108883658.")\
\].
* ’shrink’: denoise using shrink method. For more information see chapter 2 of \[[B1](https://riskfolio-lib.readthedocs.io/en/latest/parameters.html#id142 "Marcos M. López de Prado. Machine Learning for Asset Managers. Elements in Quantitative Finance. Cambridge University Press, 2020. doi:10.1017/9781108883658.")\
\].
* ’gerber1’: use the Gerber statistic 1. For more information see: \[[B3](https://riskfolio-lib.readthedocs.io/en/latest/parameters.html#id146 "Sander Gerber, Harry Markowitz, Philip Ernst, Yinsen Miao, Babak Javid, and Paul Sargen. The gerber statistic: a robust co-movement measure for portfolio optimization. SSRN Electronic Journal, 2021. URL: https://doi.org/10.2139/ssrn.3880054, doi:10.2139/ssrn.3880054.")\
\].
* ’gerber2’: use the Gerber statistic 2. For more information see: \[[B3](https://riskfolio-lib.readthedocs.io/en/latest/parameters.html#id146 "Sander Gerber, Harry Markowitz, Philip Ernst, Yinsen Miao, Babak Javid, and Paul Sargen. The gerber statistic: a robust co-movement measure for portfolio optimization. SSRN Electronic Journal, 2021. URL: https://doi.org/10.2139/ssrn.3880054, doi:10.2139/ssrn.3880054.")\
\].
d : scalar[¶](https://riskfolio-lib.readthedocs.io/en/latest/parameters.html#ParamsEstimation.covar_matrix.d "Permalink to this definition")
The smoothing factor of ewma methods. The default is 0.94.
alpha : scalar[¶](https://riskfolio-lib.readthedocs.io/en/latest/parameters.html#ParamsEstimation.covar_matrix.alpha "Permalink to this definition")
The shrfactor of shrunk and shrink method. The default is 0.1.
bWidth : [float](https://docs.python.org/3.11/library/functions.html#float "(in Python v3.11)")
[¶](https://riskfolio-lib.readthedocs.io/en/latest/parameters.html#ParamsEstimation.covar_matrix.bWidth "Permalink to this definition")
The bandwidth of the kernel for ‘fixed’, ‘spectral’ and ‘shrink’ methods.
detone : [bool](https://docs.python.org/3.11/library/functions.html#bool "(in Python v3.11)")
, optional[¶](https://riskfolio-lib.readthedocs.io/en/latest/parameters.html#ParamsEstimation.covar_matrix.detone "Permalink to this definition")
If remove the first mkt\_comp of correlation matrix for ‘fixed’, ‘spectral’ and ‘shrink’ methods. The detone correlation matrix is singular, so it cannot be inverted.
mkt\_comp : [int](https://docs.python.org/3.11/library/functions.html#int "(in Python v3.11)")
, optional[¶](https://riskfolio-lib.readthedocs.io/en/latest/parameters.html#ParamsEstimation.covar_matrix.mkt_comp "Permalink to this definition")
Number of first components that will be removed using the detone method.
threshold : [float](https://docs.python.org/3.11/library/functions.html#float "(in Python v3.11)")
[¶](https://riskfolio-lib.readthedocs.io/en/latest/parameters.html#ParamsEstimation.covar_matrix.threshold "Permalink to this definition")
Threshold for ‘gerber1’ and ‘gerber2’ methods is between 0 and 1.
Returns:[¶](https://riskfolio-lib.readthedocs.io/en/latest/parameters.html#ParamsEstimation.covar_matrix-returns "Permalink to this headline")
**cov** – The estimation of covariance matrix.
Return type:[¶](https://riskfolio-lib.readthedocs.io/en/latest/parameters.html#ParamsEstimation.covar_matrix-return-type "Permalink to this headline")
nd-array
Raises:[¶](https://riskfolio-lib.readthedocs.io/en/latest/parameters.html#ParamsEstimation.covar_matrix-raises "Permalink to this headline")
[**ValueError**](https://docs.python.org/3.11/library/exceptions.html#ValueError "(in Python v3.11)")
– When the value cannot be calculated.
ParamsEstimation.cokurt\_matrix(_[X](https://riskfolio-lib.readthedocs.io/en/latest/parameters.html#ParamsEstimation.cokurt_matrix.X "ParamsEstimation.cokurt_matrix.X (Python parameter) — Assets returns DataFrame, where n_samples is the number of observations and n_assets is the number of assets.")
_, _[method](https://riskfolio-lib.readthedocs.io/en/latest/parameters.html#ParamsEstimation.cokurt_matrix.method "ParamsEstimation.cokurt_matrix.method (Python parameter) — The method used to estimate the cokurtosis square matrix: The default is 'hist'.")
\=`'hist'`_, _[alpha](https://riskfolio-lib.readthedocs.io/en/latest/parameters.html#ParamsEstimation.cokurt_matrix "ParamsEstimation.cokurt_matrix.alpha (Python parameter)")
\=`0.1`_, _[bWidth](https://riskfolio-lib.readthedocs.io/en/latest/parameters.html#ParamsEstimation.cokurt_matrix.bWidth "ParamsEstimation.cokurt_matrix.bWidth (Python parameter) — The bandwidth of the kernel for 'fixed', 'spectral' and 'shrink' methods.")
\=`0.01`_, _[detone](https://riskfolio-lib.readthedocs.io/en/latest/parameters.html#ParamsEstimation.cokurt_matrix.detone "ParamsEstimation.cokurt_matrix.detone (Python parameter) — If remove the first mkt_comp of correlation matrix for 'fixed', 'spectral' and 'shrink' methods.")
\=`False`_, _[mkt\_comp](https://riskfolio-lib.readthedocs.io/en/latest/parameters.html#ParamsEstimation.cokurt_matrix.mkt_comp "ParamsEstimation.cokurt_matrix.mkt_comp (Python parameter) — Number of first components that will be removed using the detone method.")
\=`1`_)[\[source\]](https://riskfolio-lib.readthedocs.io/en/latest/_modules/ParamsEstimation.html#cokurt_matrix)
[¶](https://riskfolio-lib.readthedocs.io/en/latest/parameters.html#ParamsEstimation.cokurt_matrix "Link to this definition")
Calculate the cokurtosis square matrix using the selected method.
Parameters:[¶](https://riskfolio-lib.readthedocs.io/en/latest/parameters.html#ParamsEstimation.cokurt_matrix-parameters "Permalink to this headline")
X : DataFrame of shape (n\_samples, n\_assets)[¶](https://riskfolio-lib.readthedocs.io/en/latest/parameters.html#ParamsEstimation.cokurt_matrix.X "Permalink to this definition")
Assets returns DataFrame, where n\_samples is the number of observations and n\_assets is the number of assets.
method : [str](https://docs.python.org/3.11/library/stdtypes.html#str "(in Python v3.11)")
, optional[¶](https://riskfolio-lib.readthedocs.io/en/latest/parameters.html#ParamsEstimation.cokurt_matrix.method "Permalink to this definition")
The method used to estimate the cokurtosis square matrix: The default is ‘hist’. Possible values are:
* ’hist’: use historical estimates.
* ’semi’: use semi lower cokurtosis square matrix.
* ’fixed’: denoise using fixed method. For more information see chapter 2 of \[[B1](https://riskfolio-lib.readthedocs.io/en/latest/parameters.html#id142 "Marcos M. López de Prado. Machine Learning for Asset Managers. Elements in Quantitative Finance. Cambridge University Press, 2020. doi:10.1017/9781108883658.")\
\].
* ’spectral’: denoise using spectral method. For more information see chapter 2 of \[[B1](https://riskfolio-lib.readthedocs.io/en/latest/parameters.html#id142 "Marcos M. López de Prado. Machine Learning for Asset Managers. Elements in Quantitative Finance. Cambridge University Press, 2020. doi:10.1017/9781108883658.")\
\].
* ’shrink’: denoise using shrink method. For more information see chapter 2 of \[[B1](https://riskfolio-lib.readthedocs.io/en/latest/parameters.html#id142 "Marcos M. López de Prado. Machine Learning for Asset Managers. Elements in Quantitative Finance. Cambridge University Press, 2020. doi:10.1017/9781108883658.")\
\].
bWidth : [float](https://docs.python.org/3.11/library/functions.html#float "(in Python v3.11)")
[¶](https://riskfolio-lib.readthedocs.io/en/latest/parameters.html#ParamsEstimation.cokurt_matrix.bWidth "Permalink to this definition")
The bandwidth of the kernel for ‘fixed’, ‘spectral’ and ‘shrink’ methods.
detone : [bool](https://docs.python.org/3.11/library/functions.html#bool "(in Python v3.11)")
, optional[¶](https://riskfolio-lib.readthedocs.io/en/latest/parameters.html#ParamsEstimation.cokurt_matrix.detone "Permalink to this definition")
If remove the first mkt\_comp of correlation matrix for ‘fixed’, ‘spectral’ and ‘shrink’ methods. The detone correlation matrix is singular, so it cannot be inverted.
mkt\_comp : [int](https://docs.python.org/3.11/library/functions.html#int "(in Python v3.11)")
, optional[¶](https://riskfolio-lib.readthedocs.io/en/latest/parameters.html#ParamsEstimation.cokurt_matrix.mkt_comp "Permalink to this definition")
Number of first components that will be removed using the detone method.
Returns:[¶](https://riskfolio-lib.readthedocs.io/en/latest/parameters.html#ParamsEstimation.cokurt_matrix-returns "Permalink to this headline")
**kurt** – The estimation of cokurtosis square matrix.
Return type:[¶](https://riskfolio-lib.readthedocs.io/en/latest/parameters.html#ParamsEstimation.cokurt_matrix-return-type "Permalink to this headline")
nd-array
Raises:[¶](https://riskfolio-lib.readthedocs.io/en/latest/parameters.html#ParamsEstimation.cokurt_matrix-raises "Permalink to this headline")
[**ValueError**](https://docs.python.org/3.11/library/exceptions.html#ValueError "(in Python v3.11)")
– When the value cannot be calculated.
ParamsEstimation.forward\_regression(_[X](https://riskfolio-lib.readthedocs.io/en/latest/parameters.html#ParamsEstimation.forward_regression.X "ParamsEstimation.forward_regression.X (Python parameter) — Risk factors returns matrix, where n_samples is the number of samples and n_factors is the number of risk factors.")
_, _[y](https://riskfolio-lib.readthedocs.io/en/latest/parameters.html#ParamsEstimation.forward_regression.y "ParamsEstimation.forward_regression.y (Python parameter) — Asset returns column DataFrame or Series, where n_samples is the number of samples.")
_, _[criterion](https://riskfolio-lib.readthedocs.io/en/latest/parameters.html#ParamsEstimation.forward_regression.criterion "ParamsEstimation.forward_regression.criterion (Python parameter) — The default is 'pvalue'.")
\=`'pvalue'`_, _[threshold](https://riskfolio-lib.readthedocs.io/en/latest/parameters.html#ParamsEstimation.forward_regression.threshold "ParamsEstimation.forward_regression.threshold (Python parameter) — Is the maximum p-value for each variable that will be accepted in the model.")
\=`0.05`_, _[verbose](https://riskfolio-lib.readthedocs.io/en/latest/parameters.html#ParamsEstimation.forward_regression.verbose "ParamsEstimation.forward_regression.verbose (Python parameter) — Enable verbose output.")
\=`False`_)[\[source\]](https://riskfolio-lib.readthedocs.io/en/latest/_modules/ParamsEstimation.html#forward_regression)
[¶](https://riskfolio-lib.readthedocs.io/en/latest/parameters.html#ParamsEstimation.forward_regression "Link to this definition")
Select the variables that estimate the best model using stepwise forward regression. In case none of the variables has a p-value lower than threshold, the algorithm will select the variable with lowest p-value.
Parameters:[¶](https://riskfolio-lib.readthedocs.io/en/latest/parameters.html#ParamsEstimation.forward_regression-parameters "Permalink to this headline")
X : DataFrame of shape (n\_samples, n\_factors)[¶](https://riskfolio-lib.readthedocs.io/en/latest/parameters.html#ParamsEstimation.forward_regression.X "Permalink to this definition")
Risk factors returns matrix, where n\_samples is the number of samples and n\_factors is the number of risk factors.
y : Series of shape (n\_samples, 1)[¶](https://riskfolio-lib.readthedocs.io/en/latest/parameters.html#ParamsEstimation.forward_regression.y "Permalink to this definition")
Asset returns column DataFrame or Series, where n\_samples is the number of samples.
criterion : [str](https://docs.python.org/3.11/library/stdtypes.html#str "(in Python v3.11)")
, optional[¶](https://riskfolio-lib.readthedocs.io/en/latest/parameters.html#ParamsEstimation.forward_regression.criterion "Permalink to this definition")
The default is ‘pvalue’. Possible values of the criterion used to select the best features are:
* ’pvalue’: select the features based on p-values.
* ’AIC’: select the features based on lowest Akaike Information Criterion.
* ’SIC’: select the features based on lowest Schwarz Information Criterion.
* ’R2’: select the features based on highest R Squared.
* ’R2\_A’: select the features based on highest Adjusted R Squared.
threshold : scalar, optional[¶](https://riskfolio-lib.readthedocs.io/en/latest/parameters.html#ParamsEstimation.forward_regression.threshold "Permalink to this definition")
Is the maximum p-value for each variable that will be accepted in the model. The default is 0.05.
verbose : [bool](https://docs.python.org/3.11/library/functions.html#bool "(in Python v3.11)")
, optional[¶](https://riskfolio-lib.readthedocs.io/en/latest/parameters.html#ParamsEstimation.forward_regression.verbose "Permalink to this definition")
Enable verbose output. The default is False.
Returns:[¶](https://riskfolio-lib.readthedocs.io/en/latest/parameters.html#ParamsEstimation.forward_regression-returns "Permalink to this headline")
**value** – A list of the variables that produce the best model.
Return type:[¶](https://riskfolio-lib.readthedocs.io/en/latest/parameters.html#ParamsEstimation.forward_regression-return-type "Permalink to this headline")
[list](https://docs.python.org/3.11/library/stdtypes.html#list "(in Python v3.11)")
Raises:[¶](https://riskfolio-lib.readthedocs.io/en/latest/parameters.html#ParamsEstimation.forward_regression-raises "Permalink to this headline")
[**ValueError**](https://docs.python.org/3.11/library/exceptions.html#ValueError "(in Python v3.11)")
– When the value cannot be calculated.
ParamsEstimation.backward\_regression(_[X](https://riskfolio-lib.readthedocs.io/en/latest/parameters.html#ParamsEstimation.backward_regression.X "ParamsEstimation.backward_regression.X (Python parameter) — Risk factors returns matrix, where n_samples is the number of samples and n_factors is the number of risk factors.")
_, _[y](https://riskfolio-lib.readthedocs.io/en/latest/parameters.html#ParamsEstimation.backward_regression.y "ParamsEstimation.backward_regression.y (Python parameter) — Asset returns column DataFrame or Series, where n_samples is the number of samples.")
_, _[criterion](https://riskfolio-lib.readthedocs.io/en/latest/parameters.html#ParamsEstimation.backward_regression.criterion "ParamsEstimation.backward_regression.criterion (Python parameter) — The default is 'pvalue'.")
\=`'pvalue'`_, _[threshold](https://riskfolio-lib.readthedocs.io/en/latest/parameters.html#ParamsEstimation.backward_regression.threshold "ParamsEstimation.backward_regression.threshold (Python parameter) — Is the maximum p-value for each variable that will be accepted in the model.")
\=`0.05`_, _[verbose](https://riskfolio-lib.readthedocs.io/en/latest/parameters.html#ParamsEstimation.backward_regression.verbose "ParamsEstimation.backward_regression.verbose (Python parameter) — Enable verbose output.")
\=`False`_)[\[source\]](https://riskfolio-lib.readthedocs.io/en/latest/_modules/ParamsEstimation.html#backward_regression)
[¶](https://riskfolio-lib.readthedocs.io/en/latest/parameters.html#ParamsEstimation.backward_regression "Link to this definition")
Select the variables that estimate the best model using stepwise backward regression. In case none of the variables has a p-value lower than threshold, the algorithm will select the variable with lowest p-value.
Parameters:[¶](https://riskfolio-lib.readthedocs.io/en/latest/parameters.html#ParamsEstimation.backward_regression-parameters "Permalink to this headline")
X : DataFrame of shape (n\_samples, n\_factors)[¶](https://riskfolio-lib.readthedocs.io/en/latest/parameters.html#ParamsEstimation.backward_regression.X "Permalink to this definition")
Risk factors returns matrix, where n\_samples is the number of samples and n\_factors is the number of risk factors.
y : Series of shape (n\_samples, 1)[¶](https://riskfolio-lib.readthedocs.io/en/latest/parameters.html#ParamsEstimation.backward_regression.y "Permalink to this definition")
Asset returns column DataFrame or Series, where n\_samples is the number of samples.
criterion : [str](https://docs.python.org/3.11/library/stdtypes.html#str "(in Python v3.11)")
, optional[¶](https://riskfolio-lib.readthedocs.io/en/latest/parameters.html#ParamsEstimation.backward_regression.criterion "Permalink to this definition")
The default is ‘pvalue’. Possible values of the criterion used to select the best features are:
* ’pvalue’: select the features based on p-values.
* ’AIC’: select the features based on lowest Akaike Information Criterion.
* ’SIC’: select the features based on lowest Schwarz Information Criterion.
* ’R2’: select the features based on highest R Squared.
* ’R2\_A’: select the features based on highest Adjusted R Squared.
threshold : scalar, optional[¶](https://riskfolio-lib.readthedocs.io/en/latest/parameters.html#ParamsEstimation.backward_regression.threshold "Permalink to this definition")
Is the maximum p-value for each variable that will be accepted in the model. The default is 0.05.
verbose : [bool](https://docs.python.org/3.11/library/functions.html#bool "(in Python v3.11)")
, optional[¶](https://riskfolio-lib.readthedocs.io/en/latest/parameters.html#ParamsEstimation.backward_regression.verbose "Permalink to this definition")
Enable verbose output. The default is False.
Returns:[¶](https://riskfolio-lib.readthedocs.io/en/latest/parameters.html#ParamsEstimation.backward_regression-returns "Permalink to this headline")
**value** – A list of the variables that produce the best model.
Return type:[¶](https://riskfolio-lib.readthedocs.io/en/latest/parameters.html#ParamsEstimation.backward_regression-return-type "Permalink to this headline")
[list](https://docs.python.org/3.11/library/stdtypes.html#list "(in Python v3.11)")
Raises:[¶](https://riskfolio-lib.readthedocs.io/en/latest/parameters.html#ParamsEstimation.backward_regression-raises "Permalink to this headline")
[**ValueError**](https://docs.python.org/3.11/library/exceptions.html#ValueError "(in Python v3.11)")
– When the value cannot be calculated.
ParamsEstimation.PCR(_[X](https://riskfolio-lib.readthedocs.io/en/latest/parameters.html#ParamsEstimation.PCR.X "ParamsEstimation.PCR.X (Python parameter) — Risk factors returns matrix, where n_samples is the number of samples and n_factors is the number of risk factors.")
_, _[y](https://riskfolio-lib.readthedocs.io/en/latest/parameters.html#ParamsEstimation.PCR.y "ParamsEstimation.PCR.y (Python parameter) — Asset returns column DataFrame or Series, where n_samples is the number of samples.")
_, _[n\_components](https://riskfolio-lib.readthedocs.io/en/latest/parameters.html#ParamsEstimation.PCR.n_components "ParamsEstimation.PCR.n_components (Python parameter) — if 1 < n_components (int), it represents the number of components that will be keep.")
\=`0.95`_)[\[source\]](https://riskfolio-lib.readthedocs.io/en/latest/_modules/ParamsEstimation.html#PCR)
[¶](https://riskfolio-lib.readthedocs.io/en/latest/parameters.html#ParamsEstimation.PCR "Link to this definition")
Estimate the coefficients using Principal Components Regression (PCR).
Parameters:[¶](https://riskfolio-lib.readthedocs.io/en/latest/parameters.html#ParamsEstimation.PCR-parameters "Permalink to this headline")
X : DataFrame of shape (n\_samples, n\_factors)[¶](https://riskfolio-lib.readthedocs.io/en/latest/parameters.html#ParamsEstimation.PCR.X "Permalink to this definition")
Risk factors returns matrix, where n\_samples is the number of samples and n\_factors is the number of risk factors.
y : DataFrame or Series of shape (n\_samples, 1)[¶](https://riskfolio-lib.readthedocs.io/en/latest/parameters.html#ParamsEstimation.PCR.y "Permalink to this definition")
Asset returns column DataFrame or Series, where n\_samples is the number of samples.
n\_components : [int](https://docs.python.org/3.11/library/functions.html#int "(in Python v3.11)")
, [float](https://docs.python.org/3.11/library/functions.html#float "(in Python v3.11)")
, None or [str](https://docs.python.org/3.11/library/stdtypes.html#str "(in Python v3.11)")
, optional[¶](https://riskfolio-lib.readthedocs.io/en/latest/parameters.html#ParamsEstimation.PCR.n_components "Permalink to this definition")
if 1 < n\_components (int), it represents the number of components that will be keep. if 0 < n\_components < 1 (float), it represents the percentage of variance that the is explained by the components kept. See [PCA](https://scikit-learn.org/stable/modules/generated/sklearn.decomposition.PCA.html)
for more details. The default is 0.95.
Returns:[¶](https://riskfolio-lib.readthedocs.io/en/latest/parameters.html#ParamsEstimation.PCR-returns "Permalink to this headline")
**value** – An array with the coefficients of the model calculated using PCR.
Return type:[¶](https://riskfolio-lib.readthedocs.io/en/latest/parameters.html#ParamsEstimation.PCR-return-type "Permalink to this headline")
nd-array
Raises:[¶](https://riskfolio-lib.readthedocs.io/en/latest/parameters.html#ParamsEstimation.PCR-raises "Permalink to this headline")
[**ValueError**](https://docs.python.org/3.11/library/exceptions.html#ValueError "(in Python v3.11)")
– When the value cannot be calculated.
ParamsEstimation.loadings\_matrix(_[X](https://riskfolio-lib.readthedocs.io/en/latest/parameters.html#ParamsEstimation.loadings_matrix.X "ParamsEstimation.loadings_matrix.X (Python parameter) — Risk factors returns matrix, where n_samples is the number of samples and n_factors is the number of risk factors.")
_, _[Y](https://riskfolio-lib.readthedocs.io/en/latest/parameters.html#ParamsEstimation.loadings_matrix.Y "ParamsEstimation.loadings_matrix.Y (Python parameter) — Assets returns DataFrame, where n_samples is the number of observations and n_assets is the number of assets.")
_, _[feature\_selection](https://riskfolio-lib.readthedocs.io/en/latest/parameters.html#ParamsEstimation.loadings_matrix.feature_selection "ParamsEstimation.loadings_matrix.feature_selection (Python parameter) — Indicate the method used to estimate the loadings matrix. The default is 'stepwise'.")
\=`'stepwise'`_, _[stepwise](https://riskfolio-lib.readthedocs.io/en/latest/parameters.html#ParamsEstimation.loadings_matrix.stepwise "ParamsEstimation.loadings_matrix.stepwise (Python parameter) — Indicate the method used for stepwise regression. The default is 'Forward'.")
\=`'Forward'`_, _[criterion](https://riskfolio-lib.readthedocs.io/en/latest/parameters.html#ParamsEstimation.loadings_matrix.criterion "ParamsEstimation.loadings_matrix.criterion (Python parameter) — The default is 'pvalue'.")
\=`'pvalue'`_, _[threshold](https://riskfolio-lib.readthedocs.io/en/latest/parameters.html#ParamsEstimation.loadings_matrix.threshold "ParamsEstimation.loadings_matrix.threshold (Python parameter) — Is the maximum p-value for each variable that will be accepted in the model.")
\=`0.05`_, _[n\_components](https://riskfolio-lib.readthedocs.io/en/latest/parameters.html#ParamsEstimation.loadings_matrix.n_components "ParamsEstimation.loadings_matrix.n_components (Python parameter) — Duplicate explicit target name: "pca".")
\=`0.95`_, _[verbose](https://riskfolio-lib.readthedocs.io/en/latest/parameters.html#ParamsEstimation.loadings_matrix.verbose "ParamsEstimation.loadings_matrix.verbose (Python parameter) — Enable verbose output.")
\=`False`_)[\[source\]](https://riskfolio-lib.readthedocs.io/en/latest/_modules/ParamsEstimation.html#loadings_matrix)
[¶](https://riskfolio-lib.readthedocs.io/en/latest/parameters.html#ParamsEstimation.loadings_matrix "Link to this definition")
Estimate the loadings matrix using stepwise regression.
Parameters:[¶](https://riskfolio-lib.readthedocs.io/en/latest/parameters.html#ParamsEstimation.loadings_matrix-parameters "Permalink to this headline")
X : DataFrame of shape (n\_samples, n\_factors)[¶](https://riskfolio-lib.readthedocs.io/en/latest/parameters.html#ParamsEstimation.loadings_matrix.X "Permalink to this definition")
Risk factors returns matrix, where n\_samples is the number of samples and n\_factors is the number of risk factors.
Y : DataFrame of shape (n\_samples, n\_assets)[¶](https://riskfolio-lib.readthedocs.io/en/latest/parameters.html#ParamsEstimation.loadings_matrix.Y "Permalink to this definition")
Assets returns DataFrame, where n\_samples is the number of observations and n\_assets is the number of assets.
feature\_selection : [str](https://docs.python.org/3.11/library/stdtypes.html#str "(in Python v3.11)")
, 'stepwise' or 'PCR', optional[¶](https://riskfolio-lib.readthedocs.io/en/latest/parameters.html#ParamsEstimation.loadings_matrix.feature_selection "Permalink to this definition")
Indicate the method used to estimate the loadings matrix. The default is ‘stepwise’. Possible values are:
* ’stepwise’: use stepwise regression to select the best factors and estimate coefficients.
* ’PCR’: use principal components regression to estimate coefficients.
stepwise : str 'Forward' or 'Backward', optional[¶](https://riskfolio-lib.readthedocs.io/en/latest/parameters.html#ParamsEstimation.loadings_matrix.stepwise "Permalink to this definition")
Indicate the method used for stepwise regression. The default is ‘Forward’.
criterion : [str](https://docs.python.org/3.11/library/stdtypes.html#str "(in Python v3.11)")
, optional[¶](https://riskfolio-lib.readthedocs.io/en/latest/parameters.html#ParamsEstimation.loadings_matrix.criterion "Permalink to this definition")
The default is ‘pvalue’. Possible values of the criterion used to select the best features are:
* ’pvalue’: select the features based on p-values.
* ’AIC’: select the features based on lowest Akaike Information Criterion.
* ’SIC’: select the features based on lowest Schwarz Information Criterion.
* ’R2’: select the features based on highest R Squared.
* ’R2\_A’: select the features based on highest Adjusted R Squared.
threshold : scalar, optional[¶](https://riskfolio-lib.readthedocs.io/en/latest/parameters.html#ParamsEstimation.loadings_matrix.threshold "Permalink to this definition")
Is the maximum p-value for each variable that will be accepted in the model. The default is 0.05.
n\_components : [int](https://docs.python.org/3.11/library/functions.html#int "(in Python v3.11)")
, [float](https://docs.python.org/3.11/library/functions.html#float "(in Python v3.11)")
, None or [str](https://docs.python.org/3.11/library/stdtypes.html#str "(in Python v3.11)")
, optional[¶](https://riskfolio-lib.readthedocs.io/en/latest/parameters.html#ParamsEstimation.loadings_matrix.n_components "Permalink to this definition")
if 1 < n\_components (int), it represents the number of components that will be keep. if 0 < n\_components < 1 (float), it represents the percentage of variance that the is explained by the components kept. See [PCA](https://scikit-learn.org/stable/modules/generated/sklearn.decomposition.PCA.html)
for more details. The default is 0.95.
verbose : [bool](https://docs.python.org/3.11/library/functions.html#bool "(in Python v3.11)")
, optional[¶](https://riskfolio-lib.readthedocs.io/en/latest/parameters.html#ParamsEstimation.loadings_matrix.verbose "Permalink to this definition")
Enable verbose output. The default is False.
Returns:[¶](https://riskfolio-lib.readthedocs.io/en/latest/parameters.html#ParamsEstimation.loadings_matrix-returns "Permalink to this headline")
**loadings** – Loadings matrix.
Return type:[¶](https://riskfolio-lib.readthedocs.io/en/latest/parameters.html#ParamsEstimation.loadings_matrix-return-type "Permalink to this headline")
DataFrame
Raises:[¶](https://riskfolio-lib.readthedocs.io/en/latest/parameters.html#ParamsEstimation.loadings_matrix-raises "Permalink to this headline")
[**ValueError**](https://docs.python.org/3.11/library/exceptions.html#ValueError "(in Python v3.11)")
– When the value cannot be calculated.
ParamsEstimation.risk\_factors(_[X](https://riskfolio-lib.readthedocs.io/en/latest/parameters.html#ParamsEstimation.risk_factors.X "ParamsEstimation.risk_factors.X (Python parameter) — Risk factors returns matrix, where n_samples is the number of samples and n_factors is the number of risk factors.")
_, _[Y](https://riskfolio-lib.readthedocs.io/en/latest/parameters.html#ParamsEstimation.risk_factors.Y "ParamsEstimation.risk_factors.Y (Python parameter) — Assets returns DataFrame, where n_samples is the number of observations and n_assets is the number of assets.")
_, _[B](https://riskfolio-lib.readthedocs.io/en/latest/parameters.html#ParamsEstimation.risk_factors.B "ParamsEstimation.risk_factors.B (Python parameter) — Loadings matrix, where n_assets is the number assets and n_factors is the number of risk factors.")
\=`None`_, _[const](https://riskfolio-lib.readthedocs.io/en/latest/parameters.html#ParamsEstimation.risk_factors.const "ParamsEstimation.risk_factors.const (Python parameter) — Indicate if the loadings matrix has a constant. The default is False.")
\=`True`_, _[method\_mu](https://riskfolio-lib.readthedocs.io/en/latest/parameters.html#ParamsEstimation.risk_factors.method_mu "ParamsEstimation.risk_factors.method_mu (Python parameter) — The method used to estimate the expected returns of factors. The default value is 'hist'.")
\=`'hist'`_, _[method\_cov](https://riskfolio-lib.readthedocs.io/en/latest/parameters.html#ParamsEstimation.risk_factors.method_cov "ParamsEstimation.risk_factors.method_cov (Python parameter) — The method used to estimate the covariance matrix of factors. The default is 'hist'.")
\=`'hist'`_, _[method\_kurt](https://riskfolio-lib.readthedocs.io/en/latest/parameters.html#ParamsEstimation.risk_factors.method_kurt "ParamsEstimation.risk_factors.method_kurt (Python parameter) — The method used to estimate the cokurtosis square matrix: The default is 'hist'.")
\=`'hist'`_, _[feature\_selection](https://riskfolio-lib.readthedocs.io/en/latest/parameters.html#ParamsEstimation.risk_factors.feature_selection "ParamsEstimation.risk_factors.feature_selection (Python parameter) — Indicate the method used to estimate the loadings matrix. The default is 'stepwise'.")
\=`'stepwise'`_, _[stepwise](https://riskfolio-lib.readthedocs.io/en/latest/parameters.html#ParamsEstimation.risk_factors.stepwise "ParamsEstimation.risk_factors.stepwise (Python parameter) — Indicate the method used for stepwise regression. The default is 'Forward'.")
\=`'Forward'`_, _[criterion](https://riskfolio-lib.readthedocs.io/en/latest/parameters.html#ParamsEstimation.risk_factors.criterion "ParamsEstimation.risk_factors.criterion (Python parameter) — The default is 'pvalue'.")
\=`'pvalue'`_, _[threshold](https://riskfolio-lib.readthedocs.io/en/latest/parameters.html#ParamsEstimation.risk_factors.threshold "ParamsEstimation.risk_factors.threshold (Python parameter) — Is the maximum p-value for each variable that will be accepted in the model.")
\=`0.05`_, _[n\_components](https://riskfolio-lib.readthedocs.io/en/latest/parameters.html#ParamsEstimation.risk_factors.n_components "ParamsEstimation.risk_factors.n_components (Python parameter) — Duplicate explicit target name: "pca".")
\=`0.95`_, _[higher\_comoments](https://riskfolio-lib.readthedocs.io/en/latest/parameters.html#ParamsEstimation.risk_factors "ParamsEstimation.risk_factors.higher_comoments (Python parameter)")
\=`False`_, _[dict\_mu](https://riskfolio-lib.readthedocs.io/en/latest/parameters.html#ParamsEstimation.risk_factors.dict_mu "ParamsEstimation.risk_factors.dict_mu (Python parameter) — Other variables related to the expected returns.")
\=`{}`_, _[dict\_cov](https://riskfolio-lib.readthedocs.io/en/latest/parameters.html#ParamsEstimation.risk_factors.dict_cov "ParamsEstimation.risk_factors.dict_cov (Python parameter) — Other variables related to the covariance estimation.")
\=`{}`_, _[dict\_kurt](https://riskfolio-lib.readthedocs.io/en/latest/parameters.html#ParamsEstimation.risk_factors.dict_kurt "ParamsEstimation.risk_factors.dict_kurt (Python parameter) — Other variables related to the cokurtosis estimation.")
\=`{}`_)[\[source\]](https://riskfolio-lib.readthedocs.io/en/latest/_modules/ParamsEstimation.html#risk_factors)
[¶](https://riskfolio-lib.readthedocs.io/en/latest/parameters.html#ParamsEstimation.risk_factors "Link to this definition")
Estimate the expected returns vector, covariance matrix, coskewness tensor and cokurtosis square matrix based on risk factors models \[[B13](https://riskfolio-lib.readthedocs.io/en/latest/parameters.html#id84 "Stephen A. Ross. The arbitrage theory of capital asset pricing. Journal of Economic Theory, 13(3):341-360, December 1976. URL: https://ideas.repec.org/a/eee/jetheo/v13y1976i3p341-360.html, doi:.")\
\] \[[B14](https://riskfolio-lib.readthedocs.io/en/latest/parameters.html#id85 "Jianqing Fan, Yingying Fan, and Jinchi Lv. High dimensional covariance matrix estimation using a factor model. Journal of Econometrics, 147(1):186-197, November 2008. URL: https://ideas.repec.org/a/eee/econom/v147y2008i1p186-197.html, doi:.")\
\] \[[B4](https://riskfolio-lib.readthedocs.io/en/latest/parameters.html#id170 "Kris Boudt, Wanbo Lu, and Benedict Peeters. Higher order comoments of multifactor models and asset allocation. Finance Research Letters, 13:225–233, May 2015. URL: http://dx.doi.org/10.1016/j.frl.2014.12.008, doi:10.1016/j.frl.2014.12.008.")\
\].
R\=α+BF+ϵμf\=α+BμFΣf\=BΣFB′+ΣϵΦf\=BΦF(B′⊗B′)+ΦϵΨf\=(B⊗B)ΨF(B′⊗B′)+Ψϵ
where:
R is the series returns.
α is the intercept.
B is the loadings matrix.
μF is the expected returns vector of the risk factors.
ΣF is the covariance matrix of the risk factors.
ΦF is the coskewness tensor of the risk factors.
ΨF is the cokurtosis square matrix of the risk factors.
Σϵ is the covariance matrix of error terms.
Φϵ is the coskewness tensor of error terms.
Ψϵ is the cokurtosis square matrix of error terms.
μf is the expected returns vector obtained with the risk factor model.
Σf is the covariance matrix obtained with the risk factor model.
Φf is the coskewness tensor obtained with the risk factor model.
Ψf is the cokurtosis square matrix obtained with the risk factor model.
Parameters:[¶](https://riskfolio-lib.readthedocs.io/en/latest/parameters.html#ParamsEstimation.risk_factors-parameters "Permalink to this headline")
X : DataFrame of shape (n\_samples, n\_factors)[¶](https://riskfolio-lib.readthedocs.io/en/latest/parameters.html#ParamsEstimation.risk_factors.X "Permalink to this definition")
Risk factors returns matrix, where n\_samples is the number of samples and n\_factors is the number of risk factors.
Y : DataFrame of shape (n\_samples, n\_assets)[¶](https://riskfolio-lib.readthedocs.io/en/latest/parameters.html#ParamsEstimation.risk_factors.Y "Permalink to this definition")
Assets returns DataFrame, where n\_samples is the number of observations and n\_assets is the number of assets.
B : DataFrame of shape (n\_assets, n\_factors), optional[¶](https://riskfolio-lib.readthedocs.io/en/latest/parameters.html#ParamsEstimation.risk_factors.B "Permalink to this definition")
Loadings matrix, where n\_assets is the number assets and n\_factors is the number of risk factors. If is not specified, is estimated using stepwise regression. The default is None.
const : [bool](https://docs.python.org/3.11/library/functions.html#bool "(in Python v3.11)")
, optional[¶](https://riskfolio-lib.readthedocs.io/en/latest/parameters.html#ParamsEstimation.risk_factors.const "Permalink to this definition")
Indicate if the loadings matrix has a constant. The default is False.
method\_mu : [str](https://docs.python.org/3.11/library/stdtypes.html#str "(in Python v3.11)")
, optional[¶](https://riskfolio-lib.readthedocs.io/en/latest/parameters.html#ParamsEstimation.risk_factors.method_mu "Permalink to this definition")
The method used to estimate the expected returns of factors. The default value is ‘hist’. Possible values are:
* ’hist’: use historical estimates.
* ’ewma1’’: use ewma with adjust=True, see [EWM](https://pandas.pydata.org/pandas-docs/stable/user_guide/computation.html#exponentially-weighted-windows)
for more details.
* ’ewma2’: use ewma with adjust=False, see [EWM](https://pandas.pydata.org/pandas-docs/stable/user_guide/computation.html#exponentially-weighted-windows)
for more details.
* ’JS’: James-Stein estimator. For more information see \[[B9](https://riskfolio-lib.readthedocs.io/en/latest/parameters.html#id156 "Attilio Meucci. Risk and Asset Allocation. Springer Berlin Heidelberg, 2005. URL: https://doi.org/10.1007/978-3-540-27904-4, doi:10.1007/978-3-540-27904-4.")\
\] and \[[B10](https://riskfolio-lib.readthedocs.io/en/latest/parameters.html#id157 "Yiyong Feng and Daniel P. Palomar. A signal processing perspective of financial engineering. Foundations and Trends® in Signal Processing, 9(1-2):1–231, 2016. URL: https://doi.org/10.1561/2000000072, doi:10.1561/2000000072.")\
\].
* ’BS’: Bayes-Stein estimator. For more information see \[[B11](https://riskfolio-lib.readthedocs.io/en/latest/parameters.html#id158 "Philippe Jorion. Bayes-stein estimation for portfolio analysis. The Journal of Financial and Quantitative Analysis, 21(3):279, September 1986. URL: https://doi.org/10.2307/2331042, doi:10.2307/2331042.")\
\].
* ’BOP’: BOP estimator. For more information see \[[B12](https://riskfolio-lib.readthedocs.io/en/latest/parameters.html#id159 "Taras Bodnar, Ostap Okhrin, and Nestor Parolya. Optimal shrinkage estimator for high-dimensional mean vector. Journal of Multivariate Analysis, 170:63–79, 03 2019. URL: https://doi.org/10.1016\%2Fj.jmva.2018.07.004, doi:10.1016/j.jmva.2018.07.004.")\
\].
method\_cov : [str](https://docs.python.org/3.11/library/stdtypes.html#str "(in Python v3.11)")
, optional[¶](https://riskfolio-lib.readthedocs.io/en/latest/parameters.html#ParamsEstimation.risk_factors.method_cov "Permalink to this definition")
The method used to estimate the covariance matrix of factors. The default is ‘hist’. Possible values are:
* ’hist’: use historical estimates.
* ’ewma1’’: use ewma with adjust=True, see [EWM](https://pandas.pydata.org/pandas-docs/stable/user_guide/computation.html#exponentially-weighted-windows)
for more details.
* ’ewma2’: use ewma with adjust=False, see [EWM](https://pandas.pydata.org/pandas-docs/stable/user_guide/computation.html#exponentially-weighted-windows)
for more details.
* ’ledoit’: use the Ledoit and Wolf Shrinkage method.
* ’oas’: use the Oracle Approximation Shrinkage method.
* ’shrunk’: use the basic Shrunk Covariance method.
* ’gl’: use the basic Graphical Lasso Covariance method.
* ’jlogo’: use the j-LoGo Covariance method. For more information see: \[[B2](https://riskfolio-lib.readthedocs.io/en/latest/parameters.html#id141 "Wolfram Barfuss, Guido Previde Massara, T. Di Matteo, and Tomaso Aste. Parsimonious modeling with information filtering networks. Physical Review E, 12 2016. URL: http://dx.doi.org/10.1103/PhysRevE.94.062306, doi:10.1103/physreve.94.062306.")\
\].
* ’fixed’: denoise using fixed method. For more information see chapter 2 of \[[B1](https://riskfolio-lib.readthedocs.io/en/latest/parameters.html#id142 "Marcos M. López de Prado. Machine Learning for Asset Managers. Elements in Quantitative Finance. Cambridge University Press, 2020. doi:10.1017/9781108883658.")\
\].
* ’spectral’: denoise using spectral method. For more information see chapter 2 of \[[B1](https://riskfolio-lib.readthedocs.io/en/latest/parameters.html#id142 "Marcos M. López de Prado. Machine Learning for Asset Managers. Elements in Quantitative Finance. Cambridge University Press, 2020. doi:10.1017/9781108883658.")\
\].
* ’shrink’: denoise using shrink method. For more information see chapter 2 of \[[B1](https://riskfolio-lib.readthedocs.io/en/latest/parameters.html#id142 "Marcos M. López de Prado. Machine Learning for Asset Managers. Elements in Quantitative Finance. Cambridge University Press, 2020. doi:10.1017/9781108883658.")\
\].
* ’gerber1’: use the Gerber statistic 1. For more information see: \[[B3](https://riskfolio-lib.readthedocs.io/en/latest/parameters.html#id146 "Sander Gerber, Harry Markowitz, Philip Ernst, Yinsen Miao, Babak Javid, and Paul Sargen. The gerber statistic: a robust co-movement measure for portfolio optimization. SSRN Electronic Journal, 2021. URL: https://doi.org/10.2139/ssrn.3880054, doi:10.2139/ssrn.3880054.")\
\].
* ’gerber2’: use the Gerber statistic 2. For more information see: \[[B3](https://riskfolio-lib.readthedocs.io/en/latest/parameters.html#id146 "Sander Gerber, Harry Markowitz, Philip Ernst, Yinsen Miao, Babak Javid, and Paul Sargen. The gerber statistic: a robust co-movement measure for portfolio optimization. SSRN Electronic Journal, 2021. URL: https://doi.org/10.2139/ssrn.3880054, doi:10.2139/ssrn.3880054.")\
\].
method\_kurt : [str](https://docs.python.org/3.11/library/stdtypes.html#str "(in Python v3.11)")
, optional[¶](https://riskfolio-lib.readthedocs.io/en/latest/parameters.html#ParamsEstimation.risk_factors.method_kurt "Permalink to this definition")
The method used to estimate the cokurtosis square matrix: The default is ‘hist’. Possible values are:
* ’hist’: use historical estimates.
* ’semi’: use semi lower cokurtosis square matrix.
* ’fixed’: denoise using fixed method. For more information see chapter 2 of \[[B1](https://riskfolio-lib.readthedocs.io/en/latest/parameters.html#id142 "Marcos M. López de Prado. Machine Learning for Asset Managers. Elements in Quantitative Finance. Cambridge University Press, 2020. doi:10.1017/9781108883658.")\
\].
* ’spectral’: denoise using spectral method. For more information see chapter 2 of \[[B1](https://riskfolio-lib.readthedocs.io/en/latest/parameters.html#id142 "Marcos M. López de Prado. Machine Learning for Asset Managers. Elements in Quantitative Finance. Cambridge University Press, 2020. doi:10.1017/9781108883658.")\
\].
* ’shrink’: denoise using shrink method. For more information see chapter 2 of \[[B1](https://riskfolio-lib.readthedocs.io/en/latest/parameters.html#id142 "Marcos M. López de Prado. Machine Learning for Asset Managers. Elements in Quantitative Finance. Cambridge University Press, 2020. doi:10.1017/9781108883658.")\
\].
feature\_selection : [str](https://docs.python.org/3.11/library/stdtypes.html#str "(in Python v3.11)")
, 'stepwise' or 'PCR', optional[¶](https://riskfolio-lib.readthedocs.io/en/latest/parameters.html#ParamsEstimation.risk_factors.feature_selection "Permalink to this definition")
Indicate the method used to estimate the loadings matrix. The default is ‘stepwise’. Possible values are:
* ’stepwise’: use stepwise regression to select the best factors and estimate coefficients.
* ’PCR’: use principal components regression to estimate coefficients.
stepwise : [str](https://docs.python.org/3.11/library/stdtypes.html#str "(in Python v3.11)")
, 'Forward' or 'Backward'[¶](https://riskfolio-lib.readthedocs.io/en/latest/parameters.html#ParamsEstimation.risk_factors.stepwise "Permalink to this definition")
Indicate the method used for stepwise regression. The default is ‘Forward’.
criterion : [str](https://docs.python.org/3.11/library/stdtypes.html#str "(in Python v3.11)")
, optional[¶](https://riskfolio-lib.readthedocs.io/en/latest/parameters.html#ParamsEstimation.risk_factors.criterion "Permalink to this definition")
The default is ‘pvalue’. Possible values of the criterion used to select the best features are:
* ’pvalue’: select the features based on p-values.
* ’AIC’: select the features based on lowest Akaike Information Criterion.
* ’SIC’: select the features based on lowest Schwarz Information Criterion.
* ’R2’: select the features based on highest R Squared.
* ’R2\_A’: select the features based on highest Adjusted R Squared.
threshold : scalar, optional[¶](https://riskfolio-lib.readthedocs.io/en/latest/parameters.html#ParamsEstimation.risk_factors.threshold "Permalink to this definition")
Is the maximum p-value for each variable that will be accepted in the model. The default is 0.05.
n\_components : [int](https://docs.python.org/3.11/library/functions.html#int "(in Python v3.11)")
, [float](https://docs.python.org/3.11/library/functions.html#float "(in Python v3.11)")
, None or [str](https://docs.python.org/3.11/library/stdtypes.html#str "(in Python v3.11)")
, optional[¶](https://riskfolio-lib.readthedocs.io/en/latest/parameters.html#ParamsEstimation.risk_factors.n_components "Permalink to this definition")
if 1 < n\_components (int), it represents the number of components that will be keep. if 0 < n\_components < 1 (float), it represents the percentage of variance that the is explained by the components kept. See [PCA](https://scikit-learn.org/stable/modules/generated/sklearn.decomposition.PCA.html)
for more details. The default is 0.95.
dict\_mu : [dict](https://docs.python.org/3.11/library/stdtypes.html#dict "(in Python v3.11)")
[¶](https://riskfolio-lib.readthedocs.io/en/latest/parameters.html#ParamsEstimation.risk_factors.dict_mu "Permalink to this definition")
Other variables related to the expected returns.
dict\_cov : [dict](https://docs.python.org/3.11/library/stdtypes.html#dict "(in Python v3.11)")
[¶](https://riskfolio-lib.readthedocs.io/en/latest/parameters.html#ParamsEstimation.risk_factors.dict_cov "Permalink to this definition")
Other variables related to the covariance estimation.
dict\_kurt : [dict](https://docs.python.org/3.11/library/stdtypes.html#dict "(in Python v3.11)")
[¶](https://riskfolio-lib.readthedocs.io/en/latest/parameters.html#ParamsEstimation.risk_factors.dict_kurt "Permalink to this definition")
Other variables related to the cokurtosis estimation.
Returns:[¶](https://riskfolio-lib.readthedocs.io/en/latest/parameters.html#ParamsEstimation.risk_factors-returns "Permalink to this headline")
* **mu** (_DataFrame_) – The mean vector of risk factors model.
* **cov** (_DataFrame_) – The covariance matrix of risk factors model.
* **skew** (_DataFrame_) – The coskewness tensor of risk factors model.
* **kurt** (_DataFrame_) – The cokurtosis square matrix of risk factors model.
* **returns** (_DataFrame_) – The returns based on a risk factor model.
* **B** (_DataFrame_) – Loadings matrix.
Raises:[¶](https://riskfolio-lib.readthedocs.io/en/latest/parameters.html#ParamsEstimation.risk_factors-raises "Permalink to this headline")
[**ValueError**](https://docs.python.org/3.11/library/exceptions.html#ValueError "(in Python v3.11)")
– When the value cannot be calculated.
ParamsEstimation.black\_litterman(_[X](https://riskfolio-lib.readthedocs.io/en/latest/parameters.html#ParamsEstimation.black_litterman.X "ParamsEstimation.black_litterman.X (Python parameter) — Assets returns DataFrame, where n_samples is the number of observations and n_assets is the number of assets.")
_, _[w](https://riskfolio-lib.readthedocs.io/en/latest/parameters.html#ParamsEstimation.black_litterman.w "ParamsEstimation.black_litterman.w (Python parameter) — Portfolio weights, where n_assets is the number of assets.")
_, _[P](https://riskfolio-lib.readthedocs.io/en/latest/parameters.html#ParamsEstimation.black_litterman.P "ParamsEstimation.black_litterman.P (Python parameter) — Analyst's views matrix, can be relative or absolute.")
_, _[Q](https://riskfolio-lib.readthedocs.io/en/latest/parameters.html#ParamsEstimation.black_litterman.Q "ParamsEstimation.black_litterman.Q (Python parameter) — Expected returns of analyst's views.")
_, _[delta](https://riskfolio-lib.readthedocs.io/en/latest/parameters.html#ParamsEstimation.black_litterman.delta "ParamsEstimation.black_litterman.delta (Python parameter) — Risk aversion factor.")
\=`1`_, _[rf](https://riskfolio-lib.readthedocs.io/en/latest/parameters.html#ParamsEstimation.black_litterman.rf "ParamsEstimation.black_litterman.rf (Python parameter) — Risk free rate.")
\=`0`_, _[eq](https://riskfolio-lib.readthedocs.io/en/latest/parameters.html#ParamsEstimation.black_litterman.eq "ParamsEstimation.black_litterman.eq (Python parameter) — Indicate if use equilibrium or historical excess returns. The default is True.")
\=`True`_, _[method\_mu](https://riskfolio-lib.readthedocs.io/en/latest/parameters.html#ParamsEstimation.black_litterman.method_mu "ParamsEstimation.black_litterman.method_mu (Python parameter) — The method used to estimate the expected returns. The default value is 'hist'.")
\=`'hist'`_, _[method\_cov](https://riskfolio-lib.readthedocs.io/en/latest/parameters.html#ParamsEstimation.black_litterman.method_cov "ParamsEstimation.black_litterman.method_cov (Python parameter) — The method used to estimate the covariance matrix. The default is 'hist'.")
\=`'hist'`_, _[dict\_mu](https://riskfolio-lib.readthedocs.io/en/latest/parameters.html#ParamsEstimation.black_litterman.dict_mu "ParamsEstimation.black_litterman.dict_mu (Python parameter) — Other variables related to the mean vector estimation method.")
\=`{}`_, _[dict\_cov](https://riskfolio-lib.readthedocs.io/en/latest/parameters.html#ParamsEstimation.black_litterman.dict_cov "ParamsEstimation.black_litterman.dict_cov (Python parameter) — Other variables related to the covariance estimation method.")
\=`{}`_)[\[source\]](https://riskfolio-lib.readthedocs.io/en/latest/_modules/ParamsEstimation.html#black_litterman)
[¶](https://riskfolio-lib.readthedocs.io/en/latest/parameters.html#ParamsEstimation.black_litterman "Link to this definition")
Estimate the expected returns vector and covariance matrix based on the Black Litterman model \[[B5](https://riskfolio-lib.readthedocs.io/en/latest/parameters.html#id112 "Fischer Black and Robert Litterman. Global portfolio optimization. Financial Analysts Journal, 48(5):28–43, 1992. URL: http://www.jstor.org/stable/4479577.")\
\] \[[B6](https://riskfolio-lib.readthedocs.io/en/latest/parameters.html#id83 "Jay Walters. The black-litterman model in detail. SSRN Electronic Journal, pages, 07 2011. doi:10.2139/ssrn.1314585.")\
\].
Π\=δΣwΠBL\=\[(τΣ)−1+P′Ω−1P\]−1\[(τΣ)−1Π+P′Ω−1Q\]M\=((τΣ)−1+P′Ω−1P)−1μBL\=ΠBL+rfΣBL\=Σ+M
where:
rf is the risk free rate.
δ is the risk aversion factor.
Π is the equilibrium excess returns.
Σ is the covariance matrix.
P is the views matrix.
Q is the views returns matrix.
Ω is the covariance matrix of the error views.
μBL is the mean vector obtained with the black litterman model.
ΣBL is the covariance matrix obtained with the black litterman model.
Parameters:[¶](https://riskfolio-lib.readthedocs.io/en/latest/parameters.html#ParamsEstimation.black_litterman-parameters "Permalink to this headline")
X : DataFrame of shape (n\_samples, n\_assets)[¶](https://riskfolio-lib.readthedocs.io/en/latest/parameters.html#ParamsEstimation.black_litterman.X "Permalink to this definition")
Assets returns DataFrame, where n\_samples is the number of observations and n\_assets is the number of assets.
w : DataFrame or Series of shape (n\_assets, 1)[¶](https://riskfolio-lib.readthedocs.io/en/latest/parameters.html#ParamsEstimation.black_litterman.w "Permalink to this definition")
Portfolio weights, where n\_assets is the number of assets.
P : DataFrame of shape (n\_views, n\_assets)[¶](https://riskfolio-lib.readthedocs.io/en/latest/parameters.html#ParamsEstimation.black_litterman.P "Permalink to this definition")
Analyst’s views matrix, can be relative or absolute.
Q : DataFrame of shape (n\_views, 1)[¶](https://riskfolio-lib.readthedocs.io/en/latest/parameters.html#ParamsEstimation.black_litterman.Q "Permalink to this definition")
Expected returns of analyst’s views.
delta : [float](https://docs.python.org/3.11/library/functions.html#float "(in Python v3.11)")
, optional[¶](https://riskfolio-lib.readthedocs.io/en/latest/parameters.html#ParamsEstimation.black_litterman.delta "Permalink to this definition")
Risk aversion factor. The default value is 1.
rf : scalar, optional[¶](https://riskfolio-lib.readthedocs.io/en/latest/parameters.html#ParamsEstimation.black_litterman.rf "Permalink to this definition")
Risk free rate. The default is 0.
eq : [bool](https://docs.python.org/3.11/library/functions.html#bool "(in Python v3.11)")
, optional[¶](https://riskfolio-lib.readthedocs.io/en/latest/parameters.html#ParamsEstimation.black_litterman.eq "Permalink to this definition")
Indicate if use equilibrium or historical excess returns. The default is True.
method\_mu : [str](https://docs.python.org/3.11/library/stdtypes.html#str "(in Python v3.11)")
, optional[¶](https://riskfolio-lib.readthedocs.io/en/latest/parameters.html#ParamsEstimation.black_litterman.method_mu "Permalink to this definition")
The method used to estimate the expected returns. The default value is ‘hist’.
* ’hist’: use historical estimates.
* ’ewma1’: use ewma with adjust=True. For more information see [EWM](https://pandas.pydata.org/pandas-docs/stable/user_guide/window.html#exponentially-weighted-window)
.
* ’ewma2’: use ewma with adjust=False. For more information see [EWM](https://pandas.pydata.org/pandas-docs/stable/user_guide/window.html#exponentially-weighted-window)
.
* ’JS’: James-Stein estimator. For more information see \[[B9](https://riskfolio-lib.readthedocs.io/en/latest/parameters.html#id156 "Attilio Meucci. Risk and Asset Allocation. Springer Berlin Heidelberg, 2005. URL: https://doi.org/10.1007/978-3-540-27904-4, doi:10.1007/978-3-540-27904-4.")\
\] and \[[B10](https://riskfolio-lib.readthedocs.io/en/latest/parameters.html#id157 "Yiyong Feng and Daniel P. Palomar. A signal processing perspective of financial engineering. Foundations and Trends® in Signal Processing, 9(1-2):1–231, 2016. URL: https://doi.org/10.1561/2000000072, doi:10.1561/2000000072.")\
\].
* ’BS’: Bayes-Stein estimator. For more information see \[[B11](https://riskfolio-lib.readthedocs.io/en/latest/parameters.html#id158 "Philippe Jorion. Bayes-stein estimation for portfolio analysis. The Journal of Financial and Quantitative Analysis, 21(3):279, September 1986. URL: https://doi.org/10.2307/2331042, doi:10.2307/2331042.")\
\].
* ’BOP’: BOP estimator. For more information see \[[B12](https://riskfolio-lib.readthedocs.io/en/latest/parameters.html#id159 "Taras Bodnar, Ostap Okhrin, and Nestor Parolya. Optimal shrinkage estimator for high-dimensional mean vector. Journal of Multivariate Analysis, 170:63–79, 03 2019. URL: https://doi.org/10.1016\%2Fj.jmva.2018.07.004, doi:10.1016/j.jmva.2018.07.004.")\
\].
method\_cov : [str](https://docs.python.org/3.11/library/stdtypes.html#str "(in Python v3.11)")
, optional[¶](https://riskfolio-lib.readthedocs.io/en/latest/parameters.html#ParamsEstimation.black_litterman.method_cov "Permalink to this definition")
The method used to estimate the covariance matrix. The default is ‘hist’. Possible values are:
* ’hist’: use historical estimates.
* ’ewma1’: use ewma with adjust=True. For more information see [EWM](https://pandas.pydata.org/pandas-docs/stable/user_guide/window.html#exponentially-weighted-window)
.
* ’ewma2’: use ewma with adjust=False. For more information see [EWM](https://pandas.pydata.org/pandas-docs/stable/user_guide/window.html#exponentially-weighted-window)
.
* ’ledoit’: use the Ledoit and Wolf Shrinkage method.
* ’oas’: use the Oracle Approximation Shrinkage method.
* ’shrunk’: use the basic Shrunk Covariance method.
* ’gl’: use the basic Graphical Lasso Covariance method.
* ’jlogo’: use the j-LoGo Covariance method. For more information see: \[[B2](https://riskfolio-lib.readthedocs.io/en/latest/parameters.html#id141 "Wolfram Barfuss, Guido Previde Massara, T. Di Matteo, and Tomaso Aste. Parsimonious modeling with information filtering networks. Physical Review E, 12 2016. URL: http://dx.doi.org/10.1103/PhysRevE.94.062306, doi:10.1103/physreve.94.062306.")\
\].
* ’fixed’: denoise using fixed method. For more information see chapter 2 of \[[B1](https://riskfolio-lib.readthedocs.io/en/latest/parameters.html#id142 "Marcos M. López de Prado. Machine Learning for Asset Managers. Elements in Quantitative Finance. Cambridge University Press, 2020. doi:10.1017/9781108883658.")\
\].
* ’spectral’: denoise using spectral method. For more information see chapter 2 of \[[B1](https://riskfolio-lib.readthedocs.io/en/latest/parameters.html#id142 "Marcos M. López de Prado. Machine Learning for Asset Managers. Elements in Quantitative Finance. Cambridge University Press, 2020. doi:10.1017/9781108883658.")\
\].
* ’shrink’: denoise using shrink method. For more information see chapter 2 of \[[B1](https://riskfolio-lib.readthedocs.io/en/latest/parameters.html#id142 "Marcos M. López de Prado. Machine Learning for Asset Managers. Elements in Quantitative Finance. Cambridge University Press, 2020. doi:10.1017/9781108883658.")\
\].
* ’gerber1’: use the Gerber statistic 1. For more information see: \[[B3](https://riskfolio-lib.readthedocs.io/en/latest/parameters.html#id146 "Sander Gerber, Harry Markowitz, Philip Ernst, Yinsen Miao, Babak Javid, and Paul Sargen. The gerber statistic: a robust co-movement measure for portfolio optimization. SSRN Electronic Journal, 2021. URL: https://doi.org/10.2139/ssrn.3880054, doi:10.2139/ssrn.3880054.")\
\].
* ’gerber2’: use the Gerber statistic 2. For more information see: \[[B3](https://riskfolio-lib.readthedocs.io/en/latest/parameters.html#id146 "Sander Gerber, Harry Markowitz, Philip Ernst, Yinsen Miao, Babak Javid, and Paul Sargen. The gerber statistic: a robust co-movement measure for portfolio optimization. SSRN Electronic Journal, 2021. URL: https://doi.org/10.2139/ssrn.3880054, doi:10.2139/ssrn.3880054.")\
\].
dict\_mu : [dict](https://docs.python.org/3.11/library/stdtypes.html#dict "(in Python v3.11)")
[¶](https://riskfolio-lib.readthedocs.io/en/latest/parameters.html#ParamsEstimation.black_litterman.dict_mu "Permalink to this definition")
Other variables related to the mean vector estimation method.
dict\_cov : [dict](https://docs.python.org/3.11/library/stdtypes.html#dict "(in Python v3.11)")
[¶](https://riskfolio-lib.readthedocs.io/en/latest/parameters.html#ParamsEstimation.black_litterman.dict_cov "Permalink to this definition")
Other variables related to the covariance estimation method.
Returns:[¶](https://riskfolio-lib.readthedocs.io/en/latest/parameters.html#ParamsEstimation.black_litterman-returns "Permalink to this headline")
* **mu** (_DataFrame_) – The mean vector of Black Litterman model.
* **cov** (_DataFrame_) – The covariance matrix of Black Litterman model.
* **w** (_DataFrame_) – The equilibrium weights of Black Litterman model, without constraints.
Raises:[¶](https://riskfolio-lib.readthedocs.io/en/latest/parameters.html#ParamsEstimation.black_litterman-raises "Permalink to this headline")
[**ValueError**](https://docs.python.org/3.11/library/exceptions.html#ValueError "(in Python v3.11)")
– When the value cannot be calculated.
ParamsEstimation.augmented\_black\_litterman(_[X](https://riskfolio-lib.readthedocs.io/en/latest/parameters.html#ParamsEstimation.augmented_black_litterman.X "ParamsEstimation.augmented_black_litterman.X (Python parameter) — Assets returns DataFrame, where n_samples is the number of observations and n_assets is the number of assets.")
_, _[w](https://riskfolio-lib.readthedocs.io/en/latest/parameters.html#ParamsEstimation.augmented_black_litterman.w "ParamsEstimation.augmented_black_litterman.w (Python parameter) — Portfolio weights, where n_assets is the number of assets.")
_, _[F](https://riskfolio-lib.readthedocs.io/en/latest/parameters.html#ParamsEstimation.augmented_black_litterman.F "ParamsEstimation.augmented_black_litterman.F (Python parameter) — Risk factors returns DataFrame, where n_samples is the number of samples and n_factors is the number of risk factors.")
_, _[B](https://riskfolio-lib.readthedocs.io/en/latest/parameters.html#ParamsEstimation.augmented_black_litterman.B "ParamsEstimation.augmented_black_litterman.B (Python parameter) — Loadings matrix, where n_assets is the number assets and n_factors is the number of risk factors.")
_, _[P](https://riskfolio-lib.readthedocs.io/en/latest/parameters.html#ParamsEstimation.augmented_black_litterman.P "ParamsEstimation.augmented_black_litterman.P (Python parameter) — Analyst's views matrix, can be relative or absolute.")
\=`None`_, _[Q](https://riskfolio-lib.readthedocs.io/en/latest/parameters.html#ParamsEstimation.augmented_black_litterman.Q "ParamsEstimation.augmented_black_litterman.Q (Python parameter) — Expected returns of analyst's views.")
\=`None`_, _[P\_f](https://riskfolio-lib.readthedocs.io/en/latest/parameters.html#ParamsEstimation.augmented_black_litterman.P_f "ParamsEstimation.augmented_black_litterman.P_f (Python parameter) — Analyst's factors views matrix, can be relative or absolute.")
\=`None`_, _[Q\_f](https://riskfolio-lib.readthedocs.io/en/latest/parameters.html#ParamsEstimation.augmented_black_litterman.Q_f "ParamsEstimation.augmented_black_litterman.Q_f (Python parameter) — Expected returns of analyst's factors views.")
\=`None`_, _[delta](https://riskfolio-lib.readthedocs.io/en/latest/parameters.html#ParamsEstimation.augmented_black_litterman.delta "ParamsEstimation.augmented_black_litterman.delta (Python parameter) — Risk aversion factor.")
\=`1`_, _[rf](https://riskfolio-lib.readthedocs.io/en/latest/parameters.html#ParamsEstimation.augmented_black_litterman.rf "ParamsEstimation.augmented_black_litterman.rf (Python parameter) — Risk free rate.")
\=`0`_, _[eq](https://riskfolio-lib.readthedocs.io/en/latest/parameters.html#ParamsEstimation.augmented_black_litterman.eq "ParamsEstimation.augmented_black_litterman.eq (Python parameter) — Indicate if use equilibrium or historical excess returns. The default is True.")
\=`True`_, _[const](https://riskfolio-lib.readthedocs.io/en/latest/parameters.html#ParamsEstimation.augmented_black_litterman.const "ParamsEstimation.augmented_black_litterman.const (Python parameter) — Indicate if the loadings matrix has a constant. The default is True.")
\=`True`_, _[method\_mu](https://riskfolio-lib.readthedocs.io/en/latest/parameters.html#ParamsEstimation.augmented_black_litterman.method_mu "ParamsEstimation.augmented_black_litterman.method_mu (Python parameter) — The method used to estimate the expected returns. The default value is 'hist'.")
\=`'hist'`_, _[method\_cov](https://riskfolio-lib.readthedocs.io/en/latest/parameters.html#ParamsEstimation.augmented_black_litterman.method_cov "ParamsEstimation.augmented_black_litterman.method_cov (Python parameter) — The method used to estimate the covariance matrix. The default is 'hist'.")
\=`'hist'`_, _[dict\_mu](https://riskfolio-lib.readthedocs.io/en/latest/parameters.html#ParamsEstimation.augmented_black_litterman.dict_mu "ParamsEstimation.augmented_black_litterman.dict_mu (Python parameter) — Other variables related to the mean vector estimation method.")
\=`{}`_, _[dict\_cov](https://riskfolio-lib.readthedocs.io/en/latest/parameters.html#ParamsEstimation.augmented_black_litterman.dict_cov "ParamsEstimation.augmented_black_litterman.dict_cov (Python parameter) — Other variables related to the covariance estimation method.")
\=`{}`_)[\[source\]](https://riskfolio-lib.readthedocs.io/en/latest/_modules/ParamsEstimation.html#augmented_black_litterman)
[¶](https://riskfolio-lib.readthedocs.io/en/latest/parameters.html#ParamsEstimation.augmented_black_litterman "Link to this definition")
Estimate the expected returns vector and covariance matrix based on the Augmented Black Litterman model \[[B7](https://riskfolio-lib.readthedocs.io/en/latest/parameters.html#id122 "Wing Cheung. The augmented black-litterman model: a ranking-free approach to factor-based portfolio construction and beyond. Quantitative Finance, 13:, 08 2007. doi:10.2139/ssrn.1347648.")\
\].
Πa\=δ\[ΣΣFB′\]wPa\=\[P00PF\]Qa\=\[QQF\]Σa\=\[ΣBΣFΣFB′ΣF\]Ωa\=\[Ω00ΩF\]ΠBLa\=\[(τΣa)−1+(Pa)′(Ωa)−1Pa\]−1\[(τΣa)−1Πa+(Pa)′(Ωa)−1Qa\]Ma\=((τΣa)−1+(Pa)′(Ωa)−1Pa)−1μBLa\=ΠBLa+rfΣBLa\=Σa+Ma
where:
rf is the risk free rate.
δ is the risk aversion factor.
B is the loadings matrix.
Σ is the covariance matrix of assets.
ΣF is the covariance matrix of factors.
Σa is the augmented covariance matrix.
P is the assets views matrix.
Q is the assets views returns matrix.
PF is the factors views matrix.
QF is the factors views returns matrix.
Pa is the augmented views matrix.
Qa is the augmented views returns matrix.
Πa is the augmented equilibrium excess returns.
Ω is the covariance matrix of errors of assets views.
ΩF is the covariance matrix of errors of factors views.
Ωa is the covariance matrix of errors of augmented views.
μBLa is the mean vector obtained with the Augmented Black Litterman model.
ΣBLa is the covariance matrix obtained with the Augmented Black Litterman model.
Parameters:[¶](https://riskfolio-lib.readthedocs.io/en/latest/parameters.html#ParamsEstimation.augmented_black_litterman-parameters "Permalink to this headline")
X : DataFrame of shape (n\_samples, n\_assets)[¶](https://riskfolio-lib.readthedocs.io/en/latest/parameters.html#ParamsEstimation.augmented_black_litterman.X "Permalink to this definition")
Assets returns DataFrame, where n\_samples is the number of observations and n\_assets is the number of assets.
w : DataFrame or Series of shape (n\_assets, 1)[¶](https://riskfolio-lib.readthedocs.io/en/latest/parameters.html#ParamsEstimation.augmented_black_litterman.w "Permalink to this definition")
Portfolio weights, where n\_assets is the number of assets.
F : DataFrame of shape (n\_samples, n\_factors)[¶](https://riskfolio-lib.readthedocs.io/en/latest/parameters.html#ParamsEstimation.augmented_black_litterman.F "Permalink to this definition")
Risk factors returns DataFrame, where n\_samples is the number of samples and n\_factors is the number of risk factors.
B : DataFrame of shape (n\_assets, n\_factors), optional[¶](https://riskfolio-lib.readthedocs.io/en/latest/parameters.html#ParamsEstimation.augmented_black_litterman.B "Permalink to this definition")
Loadings matrix, where n\_assets is the number assets and n\_factors is the number of risk factors.
P : DataFrame of shape (n\_views, n\_assets)[¶](https://riskfolio-lib.readthedocs.io/en/latest/parameters.html#ParamsEstimation.augmented_black_litterman.P "Permalink to this definition")
Analyst’s views matrix, can be relative or absolute.
Q : DataFrame of shape (n\_views, 1)[¶](https://riskfolio-lib.readthedocs.io/en/latest/parameters.html#ParamsEstimation.augmented_black_litterman.Q "Permalink to this definition")
Expected returns of analyst’s views.
P\_f : DataFrame of shape (n\_views, n\_factors)[¶](https://riskfolio-lib.readthedocs.io/en/latest/parameters.html#ParamsEstimation.augmented_black_litterman.P_f "Permalink to this definition")
Analyst’s factors views matrix, can be relative or absolute.
Q\_f : DataFrame of shape (n\_views, 1)[¶](https://riskfolio-lib.readthedocs.io/en/latest/parameters.html#ParamsEstimation.augmented_black_litterman.Q_f "Permalink to this definition")
Expected returns of analyst’s factors views.
delta : [float](https://docs.python.org/3.11/library/functions.html#float "(in Python v3.11)")
, optional[¶](https://riskfolio-lib.readthedocs.io/en/latest/parameters.html#ParamsEstimation.augmented_black_litterman.delta "Permalink to this definition")
Risk aversion factor. The default value is 1.
rf : scalar, optional[¶](https://riskfolio-lib.readthedocs.io/en/latest/parameters.html#ParamsEstimation.augmented_black_litterman.rf "Permalink to this definition")
Risk free rate. The default is 0.
eq : [bool](https://docs.python.org/3.11/library/functions.html#bool "(in Python v3.11)")
, optional[¶](https://riskfolio-lib.readthedocs.io/en/latest/parameters.html#ParamsEstimation.augmented_black_litterman.eq "Permalink to this definition")
Indicate if use equilibrium or historical excess returns. The default is True.
const : [bool](https://docs.python.org/3.11/library/functions.html#bool "(in Python v3.11)")
, optional[¶](https://riskfolio-lib.readthedocs.io/en/latest/parameters.html#ParamsEstimation.augmented_black_litterman.const "Permalink to this definition")
Indicate if the loadings matrix has a constant. The default is True.
method\_mu : [str](https://docs.python.org/3.11/library/stdtypes.html#str "(in Python v3.11)")
, optional[¶](https://riskfolio-lib.readthedocs.io/en/latest/parameters.html#ParamsEstimation.augmented_black_litterman.method_mu "Permalink to this definition")
The method used to estimate the expected returns. The default value is ‘hist’.
* ’hist’: use historical estimates.
* ’ewma1’: use ewma with adjust=True. For more information see [EWM](https://pandas.pydata.org/pandas-docs/stable/user_guide/window.html#exponentially-weighted-window)
.
* ’ewma2’: use ewma with adjust=False. For more information see [EWM](https://pandas.pydata.org/pandas-docs/stable/user_guide/window.html#exponentially-weighted-window)
.
* ’JS’: James-Stein estimator. For more information see \[[B9](https://riskfolio-lib.readthedocs.io/en/latest/parameters.html#id156 "Attilio Meucci. Risk and Asset Allocation. Springer Berlin Heidelberg, 2005. URL: https://doi.org/10.1007/978-3-540-27904-4, doi:10.1007/978-3-540-27904-4.")\
\] and \[[B10](https://riskfolio-lib.readthedocs.io/en/latest/parameters.html#id157 "Yiyong Feng and Daniel P. Palomar. A signal processing perspective of financial engineering. Foundations and Trends® in Signal Processing, 9(1-2):1–231, 2016. URL: https://doi.org/10.1561/2000000072, doi:10.1561/2000000072.")\
\].
* ’BS’: Bayes-Stein estimator. For more information see \[[B11](https://riskfolio-lib.readthedocs.io/en/latest/parameters.html#id158 "Philippe Jorion. Bayes-stein estimation for portfolio analysis. The Journal of Financial and Quantitative Analysis, 21(3):279, September 1986. URL: https://doi.org/10.2307/2331042, doi:10.2307/2331042.")\
\].
* ’BOP’: BOP estimator. For more information see \[[B12](https://riskfolio-lib.readthedocs.io/en/latest/parameters.html#id159 "Taras Bodnar, Ostap Okhrin, and Nestor Parolya. Optimal shrinkage estimator for high-dimensional mean vector. Journal of Multivariate Analysis, 170:63–79, 03 2019. URL: https://doi.org/10.1016\%2Fj.jmva.2018.07.004, doi:10.1016/j.jmva.2018.07.004.")\
\].
method\_cov : [str](https://docs.python.org/3.11/library/stdtypes.html#str "(in Python v3.11)")
, optional[¶](https://riskfolio-lib.readthedocs.io/en/latest/parameters.html#ParamsEstimation.augmented_black_litterman.method_cov "Permalink to this definition")
The method used to estimate the covariance matrix. The default is ‘hist’. Possible values are:
* ’hist’: use historical estimates.
* ’ewma1’: use ewma with adjust=True. For more information see [EWM](https://pandas.pydata.org/pandas-docs/stable/user_guide/window.html#exponentially-weighted-window)
.
* ’ewma2’: use ewma with adjust=False. For more information see [EWM](https://pandas.pydata.org/pandas-docs/stable/user_guide/window.html#exponentially-weighted-window)
.
* ’ledoit’: use the Ledoit and Wolf Shrinkage method.
* ’oas’: use the Oracle Approximation Shrinkage method.
* ’shrunk’: use the basic Shrunk Covariance method.
* ’gl’: use the basic Graphical Lasso Covariance method.
* ’jlogo’: use the j-LoGo Covariance method. For more information see: \[[B2](https://riskfolio-lib.readthedocs.io/en/latest/parameters.html#id141 "Wolfram Barfuss, Guido Previde Massara, T. Di Matteo, and Tomaso Aste. Parsimonious modeling with information filtering networks. Physical Review E, 12 2016. URL: http://dx.doi.org/10.1103/PhysRevE.94.062306, doi:10.1103/physreve.94.062306.")\
\].
* ’fixed’: denoise using fixed method. For more information see chapter 2 of \[[B1](https://riskfolio-lib.readthedocs.io/en/latest/parameters.html#id142 "Marcos M. López de Prado. Machine Learning for Asset Managers. Elements in Quantitative Finance. Cambridge University Press, 2020. doi:10.1017/9781108883658.")\
\].
* ’spectral’: denoise using spectral method. For more information see chapter 2 of \[[B1](https://riskfolio-lib.readthedocs.io/en/latest/parameters.html#id142 "Marcos M. López de Prado. Machine Learning for Asset Managers. Elements in Quantitative Finance. Cambridge University Press, 2020. doi:10.1017/9781108883658.")\
\].
* ’shrink’: denoise using shrink method. For more information see chapter 2 of \[[B1](https://riskfolio-lib.readthedocs.io/en/latest/parameters.html#id142 "Marcos M. López de Prado. Machine Learning for Asset Managers. Elements in Quantitative Finance. Cambridge University Press, 2020. doi:10.1017/9781108883658.")\
\].
* ’gerber1’: use the Gerber statistic 1. For more information see: \[[B3](https://riskfolio-lib.readthedocs.io/en/latest/parameters.html#id146 "Sander Gerber, Harry Markowitz, Philip Ernst, Yinsen Miao, Babak Javid, and Paul Sargen. The gerber statistic: a robust co-movement measure for portfolio optimization. SSRN Electronic Journal, 2021. URL: https://doi.org/10.2139/ssrn.3880054, doi:10.2139/ssrn.3880054.")\
\].
* ’gerber2’: use the Gerber statistic 2. For more information see: \[[B3](https://riskfolio-lib.readthedocs.io/en/latest/parameters.html#id146 "Sander Gerber, Harry Markowitz, Philip Ernst, Yinsen Miao, Babak Javid, and Paul Sargen. The gerber statistic: a robust co-movement measure for portfolio optimization. SSRN Electronic Journal, 2021. URL: https://doi.org/10.2139/ssrn.3880054, doi:10.2139/ssrn.3880054.")\
\].
dict\_mu : [dict](https://docs.python.org/3.11/library/stdtypes.html#dict "(in Python v3.11)")
[¶](https://riskfolio-lib.readthedocs.io/en/latest/parameters.html#ParamsEstimation.augmented_black_litterman.dict_mu "Permalink to this definition")
Other variables related to the mean vector estimation method.
dict\_cov : [dict](https://docs.python.org/3.11/library/stdtypes.html#dict "(in Python v3.11)")
[¶](https://riskfolio-lib.readthedocs.io/en/latest/parameters.html#ParamsEstimation.augmented_black_litterman.dict_cov "Permalink to this definition")
Other variables related to the covariance estimation method.
Returns:[¶](https://riskfolio-lib.readthedocs.io/en/latest/parameters.html#ParamsEstimation.augmented_black_litterman-returns "Permalink to this headline")
* **mu** (_DataFrame_) – The mean vector of Augmented Black Litterman model.
* **cov** (_DataFrame_) – The covariance matrix of Augmented Black Litterman model.
* **w** (_DataFrame_) – The equilibrium weights of Augmented Black Litterman model, without constraints.
Raises:[¶](https://riskfolio-lib.readthedocs.io/en/latest/parameters.html#ParamsEstimation.augmented_black_litterman-raises "Permalink to this headline")
[**ValueError**](https://docs.python.org/3.11/library/exceptions.html#ValueError "(in Python v3.11)")
– When the value cannot be calculated.
ParamsEstimation.black\_litterman\_bayesian(_[X](https://riskfolio-lib.readthedocs.io/en/latest/parameters.html#ParamsEstimation.black_litterman_bayesian.X "ParamsEstimation.black_litterman_bayesian.X (Python parameter) — Assets returns DataFrame, where n_samples is the number of observations and n_assets is the number of assets.")
_, _[F](https://riskfolio-lib.readthedocs.io/en/latest/parameters.html#ParamsEstimation.black_litterman_bayesian.F "ParamsEstimation.black_litterman_bayesian.F (Python parameter) — Risk factors returns DataFrame, where n_samples is the number of samples and n_factors is the number of risk factors.")
_, _[B](https://riskfolio-lib.readthedocs.io/en/latest/parameters.html#ParamsEstimation.black_litterman_bayesian.B "ParamsEstimation.black_litterman_bayesian.B (Python parameter) — Loadings matrix, where n_assets is the number assets and n_factors is the number of risk factors.")
_, _[P\_f](https://riskfolio-lib.readthedocs.io/en/latest/parameters.html#ParamsEstimation.black_litterman_bayesian.P_f "ParamsEstimation.black_litterman_bayesian.P_f (Python parameter) — Analyst's factors views matrix, can be relative or absolute.")
_, _[Q\_f](https://riskfolio-lib.readthedocs.io/en/latest/parameters.html#ParamsEstimation.black_litterman_bayesian.Q_f "ParamsEstimation.black_litterman_bayesian.Q_f (Python parameter) — Expected returns of analyst's factors views.")
_, _[delta](https://riskfolio-lib.readthedocs.io/en/latest/parameters.html#ParamsEstimation.black_litterman_bayesian.delta "ParamsEstimation.black_litterman_bayesian.delta (Python parameter) — Risk aversion factor.")
\=`1`_, _[rf](https://riskfolio-lib.readthedocs.io/en/latest/parameters.html#ParamsEstimation.black_litterman_bayesian.rf "ParamsEstimation.black_litterman_bayesian.rf (Python parameter) — Risk free rate.")
\=`0`_, _[const](https://riskfolio-lib.readthedocs.io/en/latest/parameters.html#ParamsEstimation.black_litterman_bayesian.const "ParamsEstimation.black_litterman_bayesian.const (Python parameter) — Indicate if the loadings matrix has a constant. The default is True.")
\=`True`_, _[method\_mu](https://riskfolio-lib.readthedocs.io/en/latest/parameters.html#ParamsEstimation.black_litterman_bayesian.method_mu "ParamsEstimation.black_litterman_bayesian.method_mu (Python parameter) — The method used to estimate the expected returns. The default value is 'hist'.")
\=`'hist'`_, _[method\_cov](https://riskfolio-lib.readthedocs.io/en/latest/parameters.html#ParamsEstimation.black_litterman_bayesian.method_cov "ParamsEstimation.black_litterman_bayesian.method_cov (Python parameter) — The method used to estimate the covariance matrix: The default is 'hist'.")
\=`'hist'`_, _[dict\_mu](https://riskfolio-lib.readthedocs.io/en/latest/parameters.html#ParamsEstimation.black_litterman_bayesian.dict_mu "ParamsEstimation.black_litterman_bayesian.dict_mu (Python parameter) — Other variables related to the mean vector estimation method.")
\=`{}`_, _[dict\_cov](https://riskfolio-lib.readthedocs.io/en/latest/parameters.html#ParamsEstimation.black_litterman_bayesian.dict_cov "ParamsEstimation.black_litterman_bayesian.dict_cov (Python parameter) — Other variables related to the covariance estimation method.")
\=`{}`_)[\[source\]](https://riskfolio-lib.readthedocs.io/en/latest/_modules/ParamsEstimation.html#black_litterman_bayesian)
[¶](https://riskfolio-lib.readthedocs.io/en/latest/parameters.html#ParamsEstimation.black_litterman_bayesian "Link to this definition")
Estimate the expected returns vector and covariance matrix based on the black litterman model \[[B8](https://riskfolio-lib.readthedocs.io/en/latest/parameters.html#id124 "Petter Kolm and Gordon Ritter. On the bayesian interpretation of black-litterman. European Journal of Operational Research, 258:, 10 2016. doi:10.1016/j.ejor.2016.10.027.")\
\].
ΣF\=BΣFB′+DΠ―F\=(ΣF−1+PF′ΩF−1PF)−1(ΣF−1ΠF+PF′ΩF−1QF)Σ―F\=(ΣF−1+PF′ΩF−1PF)−1ΣBLB\=(Σ−1−Σ−1B(Σ―F−1+B′Σ−1B)−1B′Σ−1)−1μBLB\=ΣBLB(Σ−1B(Σ―F−1+B′Σ−1B)−1Σ―F−1Π―F)+rf
where:
rf is the risk free rate.
B is the loadings matrix.
D is a diagonal matrix of variance of errors of a factor model.
Σ is the covariance matrix obtained with a factor model.
ΠF is the equilibrium excess returns of factors.
Π―F is the posterior excess returns of factors.
ΣF is the covariance matrix of factors.
Σ―F is the posterior covariance matrix of factors.
PF is the factors views matrix.
QF is the factors views returns matrix.
ΩF is the covariance matrix of errors of factors views.
μBLB is the mean vector obtained with the Black Litterman Bayesian model or posterior predictive mean.
ΣBLB is the covariance matrix obtained with the Black Litterman Bayesian model or posterior predictive covariance.
Parameters:[¶](https://riskfolio-lib.readthedocs.io/en/latest/parameters.html#ParamsEstimation.black_litterman_bayesian-parameters "Permalink to this headline")
X : DataFrame of shape (n\_samples, n\_assets)[¶](https://riskfolio-lib.readthedocs.io/en/latest/parameters.html#ParamsEstimation.black_litterman_bayesian.X "Permalink to this definition")
Assets returns DataFrame, where n\_samples is the number of observations and n\_assets is the number of assets.
F : DataFrame of shape (n\_samples, n\_factors)[¶](https://riskfolio-lib.readthedocs.io/en/latest/parameters.html#ParamsEstimation.black_litterman_bayesian.F "Permalink to this definition")
Risk factors returns DataFrame, where n\_samples is the number of samples and n\_factors is the number of risk factors.
B : DataFrame of shape (n\_assets, n\_factors), optional[¶](https://riskfolio-lib.readthedocs.io/en/latest/parameters.html#ParamsEstimation.black_litterman_bayesian.B "Permalink to this definition")
Loadings matrix, where n\_assets is the number assets and n\_factors is the number of risk factors. The default is None.
P\_f : DataFrame of shape (n\_views, n\_factors)[¶](https://riskfolio-lib.readthedocs.io/en/latest/parameters.html#ParamsEstimation.black_litterman_bayesian.P_f "Permalink to this definition")
Analyst’s factors views matrix, can be relative or absolute.
Q\_f : DataFrame of shape (n\_views, 1)[¶](https://riskfolio-lib.readthedocs.io/en/latest/parameters.html#ParamsEstimation.black_litterman_bayesian.Q_f "Permalink to this definition")
Expected returns of analyst’s factors views.
delta : [float](https://docs.python.org/3.11/library/functions.html#float "(in Python v3.11)")
, optional[¶](https://riskfolio-lib.readthedocs.io/en/latest/parameters.html#ParamsEstimation.black_litterman_bayesian.delta "Permalink to this definition")
Risk aversion factor. The default value is 1.
rf : scalar, optional[¶](https://riskfolio-lib.readthedocs.io/en/latest/parameters.html#ParamsEstimation.black_litterman_bayesian.rf "Permalink to this definition")
Risk free rate. The default is 0.
const : [bool](https://docs.python.org/3.11/library/functions.html#bool "(in Python v3.11)")
, optional[¶](https://riskfolio-lib.readthedocs.io/en/latest/parameters.html#ParamsEstimation.black_litterman_bayesian.const "Permalink to this definition")
Indicate if the loadings matrix has a constant. The default is True.
method\_mu : [str](https://docs.python.org/3.11/library/stdtypes.html#str "(in Python v3.11)")
, optional[¶](https://riskfolio-lib.readthedocs.io/en/latest/parameters.html#ParamsEstimation.black_litterman_bayesian.method_mu "Permalink to this definition")
The method used to estimate the expected returns. The default value is ‘hist’.
* ’hist’: use historical estimates.
* ’ewma1’: use ewma with adjust=True. For more information see [EWM](https://pandas.pydata.org/pandas-docs/stable/user_guide/window.html#exponentially-weighted-window)
.
* ’ewma2’: use ewma with adjust=False, For more information see [EWM](https://pandas.pydata.org/pandas-docs/stable/user_guide/window.html#exponentially-weighted-window)
.
* ’JS’: James-Stein estimator. For more information see \[[B9](https://riskfolio-lib.readthedocs.io/en/latest/parameters.html#id156 "Attilio Meucci. Risk and Asset Allocation. Springer Berlin Heidelberg, 2005. URL: https://doi.org/10.1007/978-3-540-27904-4, doi:10.1007/978-3-540-27904-4.")\
\] and \[[B10](https://riskfolio-lib.readthedocs.io/en/latest/parameters.html#id157 "Yiyong Feng and Daniel P. Palomar. A signal processing perspective of financial engineering. Foundations and Trends® in Signal Processing, 9(1-2):1–231, 2016. URL: https://doi.org/10.1561/2000000072, doi:10.1561/2000000072.")\
\].
* ’BS’: Bayes-Stein estimator. For more information see \[[B11](https://riskfolio-lib.readthedocs.io/en/latest/parameters.html#id158 "Philippe Jorion. Bayes-stein estimation for portfolio analysis. The Journal of Financial and Quantitative Analysis, 21(3):279, September 1986. URL: https://doi.org/10.2307/2331042, doi:10.2307/2331042.")\
\].
* ’BOP’: BOP estimator. For more information see \[[B12](https://riskfolio-lib.readthedocs.io/en/latest/parameters.html#id159 "Taras Bodnar, Ostap Okhrin, and Nestor Parolya. Optimal shrinkage estimator for high-dimensional mean vector. Journal of Multivariate Analysis, 170:63–79, 03 2019. URL: https://doi.org/10.1016\%2Fj.jmva.2018.07.004, doi:10.1016/j.jmva.2018.07.004.")\
\].
method\_cov : [str](https://docs.python.org/3.11/library/stdtypes.html#str "(in Python v3.11)")
, optional[¶](https://riskfolio-lib.readthedocs.io/en/latest/parameters.html#ParamsEstimation.black_litterman_bayesian.method_cov "Permalink to this definition")
The method used to estimate the covariance matrix: The default is ‘hist’. Possible values are:
* ’hist’: use historical estimates.
* ’ewma1’: use ewma with adjust=True. For more information see [EWM](https://pandas.pydata.org/pandas-docs/stable/user_guide/window.html#exponentially-weighted-window)
.
* ’ewma2’: use ewma with adjust=False. For more information see [EWM](https://pandas.pydata.org/pandas-docs/stable/user_guide/window.html#exponentially-weighted-window)
.
* ’ledoit’: use the Ledoit and Wolf Shrinkage method.
* ’oas’: use the Oracle Approximation Shrinkage method.
* ’shrunk’: use the basic Shrunk Covariance method.
* ’gl’: use the basic Graphical Lasso Covariance method.
* ’jlogo’: use the j-LoGo Covariance method. For more information see: \[[B2](https://riskfolio-lib.readthedocs.io/en/latest/parameters.html#id141 "Wolfram Barfuss, Guido Previde Massara, T. Di Matteo, and Tomaso Aste. Parsimonious modeling with information filtering networks. Physical Review E, 12 2016. URL: http://dx.doi.org/10.1103/PhysRevE.94.062306, doi:10.1103/physreve.94.062306.")\
\].
* ’fixed’: denoise using fixed method. For more information see chapter 2 of \[[B1](https://riskfolio-lib.readthedocs.io/en/latest/parameters.html#id142 "Marcos M. López de Prado. Machine Learning for Asset Managers. Elements in Quantitative Finance. Cambridge University Press, 2020. doi:10.1017/9781108883658.")\
\].
* ’spectral’: denoise using spectral method. For more information see chapter 2 of \[[B1](https://riskfolio-lib.readthedocs.io/en/latest/parameters.html#id142 "Marcos M. López de Prado. Machine Learning for Asset Managers. Elements in Quantitative Finance. Cambridge University Press, 2020. doi:10.1017/9781108883658.")\
\].
* ’shrink’: denoise using shrink method. For more information see chapter 2 of \[[B1](https://riskfolio-lib.readthedocs.io/en/latest/parameters.html#id142 "Marcos M. López de Prado. Machine Learning for Asset Managers. Elements in Quantitative Finance. Cambridge University Press, 2020. doi:10.1017/9781108883658.")\
\].
* ’gerber1’: use the Gerber statistic 1. For more information see: \[[B3](https://riskfolio-lib.readthedocs.io/en/latest/parameters.html#id146 "Sander Gerber, Harry Markowitz, Philip Ernst, Yinsen Miao, Babak Javid, and Paul Sargen. The gerber statistic: a robust co-movement measure for portfolio optimization. SSRN Electronic Journal, 2021. URL: https://doi.org/10.2139/ssrn.3880054, doi:10.2139/ssrn.3880054.")\
\].
* ’gerber2’: use the Gerber statistic 2. For more information see: \[[B3](https://riskfolio-lib.readthedocs.io/en/latest/parameters.html#id146 "Sander Gerber, Harry Markowitz, Philip Ernst, Yinsen Miao, Babak Javid, and Paul Sargen. The gerber statistic: a robust co-movement measure for portfolio optimization. SSRN Electronic Journal, 2021. URL: https://doi.org/10.2139/ssrn.3880054, doi:10.2139/ssrn.3880054.")\
\].
dict\_mu : [dict](https://docs.python.org/3.11/library/stdtypes.html#dict "(in Python v3.11)")
[¶](https://riskfolio-lib.readthedocs.io/en/latest/parameters.html#ParamsEstimation.black_litterman_bayesian.dict_mu "Permalink to this definition")
Other variables related to the mean vector estimation method.
dict\_cov : [dict](https://docs.python.org/3.11/library/stdtypes.html#dict "(in Python v3.11)")
[¶](https://riskfolio-lib.readthedocs.io/en/latest/parameters.html#ParamsEstimation.black_litterman_bayesian.dict_cov "Permalink to this definition")
Other variables related to the covariance estimation method.
Returns:[¶](https://riskfolio-lib.readthedocs.io/en/latest/parameters.html#ParamsEstimation.black_litterman_bayesian-returns "Permalink to this headline")
* **mu** (_DataFrame_) – The mean vector of Black Litterman model.
* **cov** (_DataFrame_) – The covariance matrix of Black Litterman model.
* **w** (_DataFrame_) – The equilibrium weights of Black Litterman model, without constraints.
Raises:[¶](https://riskfolio-lib.readthedocs.io/en/latest/parameters.html#ParamsEstimation.black_litterman_bayesian-raises "Permalink to this headline")
[**ValueError**](https://docs.python.org/3.11/library/exceptions.html#ValueError "(in Python v3.11)")
– When the value cannot be calculated.
ParamsEstimation.bootstrapping(_[X](https://riskfolio-lib.readthedocs.io/en/latest/parameters.html#ParamsEstimation.bootstrapping.X "ParamsEstimation.bootstrapping.X (Python parameter) — Assets returns DataFrame, where n_samples is the number of observations and n_assets is the number of assets.")
_, _[kind](https://riskfolio-lib.readthedocs.io/en/latest/parameters.html#ParamsEstimation.bootstrapping.kind "ParamsEstimation.bootstrapping.kind (Python parameter) — The bootstrapping method.")
\=`'stationary'`_, _[q](https://riskfolio-lib.readthedocs.io/en/latest/parameters.html#ParamsEstimation.bootstrapping.q "ParamsEstimation.bootstrapping.q (Python parameter) — Significance level for box and elliptical constraints. The default is 0.05.")
\=`0.05`_, _[n\_sim](https://riskfolio-lib.readthedocs.io/en/latest/parameters.html#ParamsEstimation.bootstrapping.n_sim "ParamsEstimation.bootstrapping.n_sim (Python parameter) — Number of simulations of the bootstrapping method. The default is 6000.")
\=`6000`_, _[window](https://riskfolio-lib.readthedocs.io/en/latest/parameters.html#ParamsEstimation.bootstrapping.window "ParamsEstimation.bootstrapping.window (Python parameter) — Block size of the bootstrapping method.")
\=`3`_, _[diag](https://riskfolio-lib.readthedocs.io/en/latest/parameters.html#ParamsEstimation.bootstrapping.diag "ParamsEstimation.bootstrapping.diag (Python parameter) — If consider only the main diagonal of covariance matrices of estimation errors following b-fabozzi2007robust.")
\=`False`_, _[threshold](https://riskfolio-lib.readthedocs.io/en/latest/parameters.html#ParamsEstimation.bootstrapping.threshold "ParamsEstimation.bootstrapping.threshold (Python parameter) — Parameter used to fix covariance matrices in case they are not positive semidefinite. The default is 1e-15.")
\=`1e-15`_, _[seed](https://riskfolio-lib.readthedocs.io/en/latest/parameters.html#ParamsEstimation.bootstrapping.seed "ParamsEstimation.bootstrapping.seed (Python parameter) — Seed used to generate random numbers for bootstrapping method. The default is 0.")
\=`0`_)[\[source\]](https://riskfolio-lib.readthedocs.io/en/latest/_modules/ParamsEstimation.html#bootstrapping)
[¶](https://riskfolio-lib.readthedocs.io/en/latest/parameters.html#ParamsEstimation.bootstrapping "Link to this definition")
Estimates the uncertainty sets of mean and covariance matrix through the selected bootstrapping method.
Parameters:[¶](https://riskfolio-lib.readthedocs.io/en/latest/parameters.html#ParamsEstimation.bootstrapping-parameters "Permalink to this headline")
X : DataFrame of shape (n\_samples, n\_assets)[¶](https://riskfolio-lib.readthedocs.io/en/latest/parameters.html#ParamsEstimation.bootstrapping.X "Permalink to this definition")
Assets returns DataFrame, where n\_samples is the number of observations and n\_assets is the number of assets.
kind : [str](https://docs.python.org/3.11/library/stdtypes.html#str "(in Python v3.11)")
[¶](https://riskfolio-lib.readthedocs.io/en/latest/parameters.html#ParamsEstimation.bootstrapping.kind "Permalink to this definition")
The bootstrapping method. The default value is ‘stationary’. Possible values are:
* ’stationary’: stationary bootstrapping method, see [StationaryBootstrap](https://bashtage.github.io/arch/bootstrap/generated/arch.bootstrap.StationaryBootstrap.html#arch.bootstrap.StationaryBootstrap)
for more details.
* ’circular’: circular bootstrapping method, see [CircularBlockBootstrap](https://bashtage.github.io/arch/bootstrap/generated/arch.bootstrap.CircularBlockBootstrap.html#arch.bootstrap.CircularBlockBootstrap)
for more details.
* ’moving’: moving bootstrapping method, see [MovingBlockBootstrap](https://bashtage.github.io/arch/bootstrap/generated/arch.bootstrap.MovingBlockBootstrap.html#arch.bootstrap.MovingBlockBootstrap)
for more details.
q : scalar[¶](https://riskfolio-lib.readthedocs.io/en/latest/parameters.html#ParamsEstimation.bootstrapping.q "Permalink to this definition")
Significance level for box and elliptical constraints. The default is 0.05.
n\_sim : scalar[¶](https://riskfolio-lib.readthedocs.io/en/latest/parameters.html#ParamsEstimation.bootstrapping.n_sim "Permalink to this definition")
Number of simulations of the bootstrapping method. The default is 6000.
window : [int](https://docs.python.org/3.11/library/functions.html#int "(in Python v3.11)")
[¶](https://riskfolio-lib.readthedocs.io/en/latest/parameters.html#ParamsEstimation.bootstrapping.window "Permalink to this definition")
Block size of the bootstrapping method. Must be greather than 1 and lower than the n\_samples - n\_factors + 1 The default is 3.
diag : [bool](https://docs.python.org/3.11/library/functions.html#bool "(in Python v3.11)")
[¶](https://riskfolio-lib.readthedocs.io/en/latest/parameters.html#ParamsEstimation.bootstrapping.diag "Permalink to this definition")
If consider only the main diagonal of covariance matrices of estimation errors following \[[B15](https://riskfolio-lib.readthedocs.io/en/latest/parameters.html#id115 "Frank Fabozzi. Robust portfolio optimization and management. John Wiley, Hoboken, N.J, 2007. ISBN 978-0-471-92122-6.")\
\]. The default is False.
threshold : [float](https://docs.python.org/3.11/library/functions.html#float "(in Python v3.11)")
[¶](https://riskfolio-lib.readthedocs.io/en/latest/parameters.html#ParamsEstimation.bootstrapping.threshold "Permalink to this definition")
Parameter used to fix covariance matrices in case they are not positive semidefinite. The default is 1e-15.
seed : [int](https://docs.python.org/3.11/library/functions.html#int "(in Python v3.11)")
[¶](https://riskfolio-lib.readthedocs.io/en/latest/parameters.html#ParamsEstimation.bootstrapping.seed "Permalink to this definition")
Seed used to generate random numbers for bootstrapping method. The default is 0.
Returns:[¶](https://riskfolio-lib.readthedocs.io/en/latest/parameters.html#ParamsEstimation.bootstrapping-returns "Permalink to this headline")
* **mu\_l** (_DataFrame_) – The q/2 percentile of mean vector obtained through the selected bootstrapping method.
* **mu\_u** (_DataFrame_) – The 1-q/2 percentile of mean vector obtained through the selected bootstrapping method.
* **cov\_l** (_DataFrame_) – The q/2 percentile of covariance matrix obtained through the selected bootstrapping method.
* **cov\_u** (_DataFrame_) – The 1-q/2 percentile of covariance matrix obtained through the selected bootstrapping method.
* **cov\_mu** (_DataFrame_) – The covariance matrix of estimation errors of mean vector obtained through the selected bootstrapping method.
* **cov\_sigma** (_DataFrame_) – The covariance matrix of estimation errors of covariance matrix obtained through the selected bootstrapping method.
* **k\_mu** (_DataFrame_) – The square root of size of elliptical constraint of mean vector estimation error based on 1-q percentile.
* **k\_sigma** (_DataFrame_) – The square root of size of elliptical constraint of covariance matrix estimation error based on 1-q percentile.
Raises:[¶](https://riskfolio-lib.readthedocs.io/en/latest/parameters.html#ParamsEstimation.bootstrapping-raises "Permalink to this headline")
[**ValueError**](https://docs.python.org/3.11/library/exceptions.html#ValueError "(in Python v3.11)")
– When the value cannot be calculated.
ParamsEstimation.normal\_simulation(_[X](https://riskfolio-lib.readthedocs.io/en/latest/parameters.html#ParamsEstimation.normal_simulation.X "ParamsEstimation.normal_simulation.X (Python parameter) — Assets returns DataFrame, where n_samples is the number of observations and n_assets is the number of assets.")
_, _[q](https://riskfolio-lib.readthedocs.io/en/latest/parameters.html#ParamsEstimation.normal_simulation.q "ParamsEstimation.normal_simulation.q (Python parameter) — Significance level for box and elliptical constraints. The default is 0.05.")
\=`0.05`_, _[n\_sim](https://riskfolio-lib.readthedocs.io/en/latest/parameters.html#ParamsEstimation.normal_simulation.n_sim "ParamsEstimation.normal_simulation.n_sim (Python parameter) — Number of simulations of the bootstrapping method. The default is 6000.")
\=`6000`_, _[diag](https://riskfolio-lib.readthedocs.io/en/latest/parameters.html#ParamsEstimation.normal_simulation.diag "ParamsEstimation.normal_simulation.diag (Python parameter) — If consider only the main diagonal of covariance matrices of estimation errors following b-fabozzi2007robust.")
\=`False`_, _[threshold](https://riskfolio-lib.readthedocs.io/en/latest/parameters.html#ParamsEstimation.normal_simulation.threshold "ParamsEstimation.normal_simulation.threshold (Python parameter) — Parameter used to fix covariance matrices in case they are not positive semidefinite.")
\=`1e-15`_, _[seed](https://riskfolio-lib.readthedocs.io/en/latest/parameters.html#ParamsEstimation.normal_simulation.seed "ParamsEstimation.normal_simulation.seed (Python parameter) — Seed used to generate random numbers for simulation. The default is 0.")
\=`0`_)[\[source\]](https://riskfolio-lib.readthedocs.io/en/latest/_modules/ParamsEstimation.html#normal_simulation)
[¶](https://riskfolio-lib.readthedocs.io/en/latest/parameters.html#ParamsEstimation.normal_simulation "Link to this definition")
Estimates the uncertainty sets of mean and covariance matrix assuming that assets returns follows a multivariate normal distribution.
Parameters:[¶](https://riskfolio-lib.readthedocs.io/en/latest/parameters.html#ParamsEstimation.normal_simulation-parameters "Permalink to this headline")
X : DataFrame of shape (n\_samples, n\_assets)[¶](https://riskfolio-lib.readthedocs.io/en/latest/parameters.html#ParamsEstimation.normal_simulation.X "Permalink to this definition")
Assets returns DataFrame, where n\_samples is the number of observations and n\_assets is the number of assets.
q : scalar[¶](https://riskfolio-lib.readthedocs.io/en/latest/parameters.html#ParamsEstimation.normal_simulation.q "Permalink to this definition")
Significance level for box and elliptical constraints. The default is 0.05.
n\_sim : scalar[¶](https://riskfolio-lib.readthedocs.io/en/latest/parameters.html#ParamsEstimation.normal_simulation.n_sim "Permalink to this definition")
Number of simulations of the bootstrapping method. The default is 6000.
diag : [bool](https://docs.python.org/3.11/library/functions.html#bool "(in Python v3.11)")
[¶](https://riskfolio-lib.readthedocs.io/en/latest/parameters.html#ParamsEstimation.normal_simulation.diag "Permalink to this definition")
If consider only the main diagonal of covariance matrices of estimation errors following \[[B15](https://riskfolio-lib.readthedocs.io/en/latest/parameters.html#id115 "Frank Fabozzi. Robust portfolio optimization and management. John Wiley, Hoboken, N.J, 2007. ISBN 978-0-471-92122-6.")\
\]. The default is False.
threshold : [float](https://docs.python.org/3.11/library/functions.html#float "(in Python v3.11)")
[¶](https://riskfolio-lib.readthedocs.io/en/latest/parameters.html#ParamsEstimation.normal_simulation.threshold "Permalink to this definition")
Parameter used to fix covariance matrices in case they are not positive semidefinite. The default is 1e-10.
seed : [int](https://docs.python.org/3.11/library/functions.html#int "(in Python v3.11)")
[¶](https://riskfolio-lib.readthedocs.io/en/latest/parameters.html#ParamsEstimation.normal_simulation.seed "Permalink to this definition")
Seed used to generate random numbers for simulation. The default is 0.
Returns:[¶](https://riskfolio-lib.readthedocs.io/en/latest/parameters.html#ParamsEstimation.normal_simulation-returns "Permalink to this headline")
* **mu\_l** (_DataFrame_) – The q/2 percentile of mean vector obtained through the normal simulation.
* **mu\_u** (_DataFrame_) – The 1-q/2 percentile of mean vector obtained through the normal simulation.
* **cov\_l** (_DataFrame_) – The q/2 percentile of covariance matrix obtained through the normal simulation.
* **cov\_u** (_DataFrame_) – The 1-q/2 percentile of covariance matrix obtained through the normal simulation.
* **cov\_mu** (_DataFrame_) – The covariance matrix of estimation errors of mean vector obtained through the normal simulation.
* **cov\_sigma** (_DataFrame_) – The covariance matrix of estimation errors of covariance matrix obtained through the normal simulation.
* **k\_mu** (_DataFrame_) – The square root of size of elliptical constraint of mean vector estimation error based on 1-q percentile.
* **k\_sigma** (_DataFrame_) – The square root of size of elliptical constraint of covariance matrix estimation error based on 1-q percentile.
Raises:[¶](https://riskfolio-lib.readthedocs.io/en/latest/parameters.html#ParamsEstimation.normal_simulation-raises "Permalink to this headline")
[**ValueError**](https://docs.python.org/3.11/library/exceptions.html#ValueError "(in Python v3.11)")
– When the value cannot be calculated.
Bibliography[¶](https://riskfolio-lib.readthedocs.io/en/latest/parameters.html#bibliography "Link to this heading")
--------------------------------------------------------------------------------------------------------------------
\[B1\] ([1](https://riskfolio-lib.readthedocs.io/en/latest/parameters.html#id3)
,[2](https://riskfolio-lib.readthedocs.io/en/latest/parameters.html#id14)
,[3](https://riskfolio-lib.readthedocs.io/en/latest/parameters.html#id15)
,[4](https://riskfolio-lib.readthedocs.io/en/latest/parameters.html#id16)
,[5](https://riskfolio-lib.readthedocs.io/en/latest/parameters.html#id19)
,[6](https://riskfolio-lib.readthedocs.io/en/latest/parameters.html#id20)
,[7](https://riskfolio-lib.readthedocs.io/en/latest/parameters.html#id21)
,[8](https://riskfolio-lib.readthedocs.io/en/latest/parameters.html#id31)
,[9](https://riskfolio-lib.readthedocs.io/en/latest/parameters.html#id32)
,[10](https://riskfolio-lib.readthedocs.io/en/latest/parameters.html#id33)
,[11](https://riskfolio-lib.readthedocs.io/en/latest/parameters.html#id36)
,[12](https://riskfolio-lib.readthedocs.io/en/latest/parameters.html#id37)
,[13](https://riskfolio-lib.readthedocs.io/en/latest/parameters.html#id38)
,[14](https://riskfolio-lib.readthedocs.io/en/latest/parameters.html#id47)
,[15](https://riskfolio-lib.readthedocs.io/en/latest/parameters.html#id48)
,[16](https://riskfolio-lib.readthedocs.io/en/latest/parameters.html#id49)
,[17](https://riskfolio-lib.readthedocs.io/en/latest/parameters.html#id58)
,[18](https://riskfolio-lib.readthedocs.io/en/latest/parameters.html#id59)
,[19](https://riskfolio-lib.readthedocs.io/en/latest/parameters.html#id60)
,[20](https://riskfolio-lib.readthedocs.io/en/latest/parameters.html#id69)
,[21](https://riskfolio-lib.readthedocs.io/en/latest/parameters.html#id70)
,[22](https://riskfolio-lib.readthedocs.io/en/latest/parameters.html#id71)
)
Marcos M. López de Prado. _Machine Learning for Asset Managers_. Elements in Quantitative Finance. Cambridge University Press, 2020. [doi:10.1017/9781108883658](https://doi.org/10.1017/9781108883658)
.
\[B2\] ([1](https://riskfolio-lib.readthedocs.io/en/latest/parameters.html#id1)
,[2](https://riskfolio-lib.readthedocs.io/en/latest/parameters.html#id13)
,[3](https://riskfolio-lib.readthedocs.io/en/latest/parameters.html#id30)
,[4](https://riskfolio-lib.readthedocs.io/en/latest/parameters.html#id46)
,[5](https://riskfolio-lib.readthedocs.io/en/latest/parameters.html#id57)
,[6](https://riskfolio-lib.readthedocs.io/en/latest/parameters.html#id68)
)
Wolfram Barfuss, Guido Previde Massara, T. Di Matteo, and Tomaso Aste. Parsimonious modeling with information filtering networks. _Physical Review E_, 12 2016. URL: [http://dx.doi.org/10.1103/PhysRevE.94.062306](http://dx.doi.org/10.1103/PhysRevE.94.062306)
, [doi:10.1103/physreve.94.062306](https://doi.org/10.1103/physreve.94.062306)
.
\[B3\] ([1](https://riskfolio-lib.readthedocs.io/en/latest/parameters.html#id2)
,[2](https://riskfolio-lib.readthedocs.io/en/latest/parameters.html#id17)
,[3](https://riskfolio-lib.readthedocs.io/en/latest/parameters.html#id18)
,[4](https://riskfolio-lib.readthedocs.io/en/latest/parameters.html#id34)
,[5](https://riskfolio-lib.readthedocs.io/en/latest/parameters.html#id35)
,[6](https://riskfolio-lib.readthedocs.io/en/latest/parameters.html#id50)
,[7](https://riskfolio-lib.readthedocs.io/en/latest/parameters.html#id51)
,[8](https://riskfolio-lib.readthedocs.io/en/latest/parameters.html#id61)
,[9](https://riskfolio-lib.readthedocs.io/en/latest/parameters.html#id62)
,[10](https://riskfolio-lib.readthedocs.io/en/latest/parameters.html#id72)
,[11](https://riskfolio-lib.readthedocs.io/en/latest/parameters.html#id73)
)
Sander Gerber, Harry Markowitz, Philip Ernst, Yinsen Miao, Babak Javid, and Paul Sargen. The gerber statistic: a robust co-movement measure for portfolio optimization. _SSRN Electronic Journal_, 2021. URL: [https://doi.org/10.2139/ssrn.3880054](https://doi.org/10.2139/ssrn.3880054)
, [doi:10.2139/ssrn.3880054](https://doi.org/10.2139/ssrn.3880054)
.
\[B4\] ([1](https://riskfolio-lib.readthedocs.io/en/latest/parameters.html#id4)
,[2](https://riskfolio-lib.readthedocs.io/en/latest/parameters.html#id25)
)
Kris Boudt, Wanbo Lu, and Benedict Peeters. Higher order comoments of multifactor models and asset allocation. _Finance Research Letters_, 13:225–233, May 2015. URL: [http://dx.doi.org/10.1016/j.frl.2014.12.008](http://dx.doi.org/10.1016/j.frl.2014.12.008)
, [doi:10.1016/j.frl.2014.12.008](https://doi.org/10.1016/j.frl.2014.12.008)
.
\[B5\] ([1](https://riskfolio-lib.readthedocs.io/en/latest/parameters.html#id5)
,[2](https://riskfolio-lib.readthedocs.io/en/latest/parameters.html#id40)
)
Fischer Black and Robert Litterman. Global portfolio optimization. _Financial Analysts Journal_, 48(5):28–43, 1992. URL: [http://www.jstor.org/stable/4479577](http://www.jstor.org/stable/4479577)
.
\[B6\] ([1](https://riskfolio-lib.readthedocs.io/en/latest/parameters.html#id6)
,[2](https://riskfolio-lib.readthedocs.io/en/latest/parameters.html#id41)
)
Jay Walters. The black-litterman model in detail. _SSRN Electronic Journal_, pages, 07 2011. [doi:10.2139/ssrn.1314585](https://doi.org/10.2139/ssrn.1314585)
.
\[B7\] ([1](https://riskfolio-lib.readthedocs.io/en/latest/parameters.html#id7)
,[2](https://riskfolio-lib.readthedocs.io/en/latest/parameters.html#id52)
)
Wing Cheung. The augmented black-litterman model: a ranking-free approach to factor-based portfolio construction and beyond. _Quantitative Finance_, 13:, 08 2007. [doi:10.2139/ssrn.1347648](https://doi.org/10.2139/ssrn.1347648)
.
\[B8\] ([1](https://riskfolio-lib.readthedocs.io/en/latest/parameters.html#id8)
,[2](https://riskfolio-lib.readthedocs.io/en/latest/parameters.html#id63)
)
Petter Kolm and Gordon Ritter. On the bayesian interpretation of black-litterman. _European Journal of Operational Research_, 258:, 10 2016. [doi:10.1016/j.ejor.2016.10.027](https://doi.org/10.1016/j.ejor.2016.10.027)
.
\[B9\] ([1](https://riskfolio-lib.readthedocs.io/en/latest/parameters.html#id9)
,[2](https://riskfolio-lib.readthedocs.io/en/latest/parameters.html#id26)
,[3](https://riskfolio-lib.readthedocs.io/en/latest/parameters.html#id42)
,[4](https://riskfolio-lib.readthedocs.io/en/latest/parameters.html#id53)
,[5](https://riskfolio-lib.readthedocs.io/en/latest/parameters.html#id64)
)
Attilio Meucci. _Risk and Asset Allocation_. Springer Berlin Heidelberg, 2005. URL: [https://doi.org/10.1007/978-3-540-27904-4](https://doi.org/10.1007/978-3-540-27904-4)
, [doi:10.1007/978-3-540-27904-4](https://doi.org/10.1007/978-3-540-27904-4)
.
\[B10\] ([1](https://riskfolio-lib.readthedocs.io/en/latest/parameters.html#id10)
,[2](https://riskfolio-lib.readthedocs.io/en/latest/parameters.html#id27)
,[3](https://riskfolio-lib.readthedocs.io/en/latest/parameters.html#id43)
,[4](https://riskfolio-lib.readthedocs.io/en/latest/parameters.html#id54)
,[5](https://riskfolio-lib.readthedocs.io/en/latest/parameters.html#id65)
)
Yiyong Feng and Daniel P. Palomar. A signal processing perspective of financial engineering. _Foundations and Trends® in Signal Processing_, 9(1-2):1–231, 2016. URL: [https://doi.org/10.1561/2000000072](https://doi.org/10.1561/2000000072)
, [doi:10.1561/2000000072](https://doi.org/10.1561/2000000072)
.
\[B11\] ([1](https://riskfolio-lib.readthedocs.io/en/latest/parameters.html#id11)
,[2](https://riskfolio-lib.readthedocs.io/en/latest/parameters.html#id28)
,[3](https://riskfolio-lib.readthedocs.io/en/latest/parameters.html#id44)
,[4](https://riskfolio-lib.readthedocs.io/en/latest/parameters.html#id55)
,[5](https://riskfolio-lib.readthedocs.io/en/latest/parameters.html#id66)
)
Philippe Jorion. Bayes-stein estimation for portfolio analysis. _The Journal of Financial and Quantitative Analysis_, 21(3):279, September 1986. URL: [https://doi.org/10.2307/2331042](https://doi.org/10.2307/2331042)
, [doi:10.2307/2331042](https://doi.org/10.2307/2331042)
.
\[B12\] ([1](https://riskfolio-lib.readthedocs.io/en/latest/parameters.html#id12)
,[2](https://riskfolio-lib.readthedocs.io/en/latest/parameters.html#id29)
,[3](https://riskfolio-lib.readthedocs.io/en/latest/parameters.html#id45)
,[4](https://riskfolio-lib.readthedocs.io/en/latest/parameters.html#id56)
,[5](https://riskfolio-lib.readthedocs.io/en/latest/parameters.html#id67)
)
Taras Bodnar, Ostap Okhrin, and Nestor Parolya. Optimal shrinkage estimator for high-dimensional mean vector. _Journal of Multivariate Analysis_, 170:63–79, 03 2019. URL: [https://doi.org/10.1016\\%2Fj.jmva.2018.07.004](https://doi.org/10.1016/%2Fj.jmva.2018.07.004)
, [doi:10.1016/j.jmva.2018.07.004](https://doi.org/10.1016/j.jmva.2018.07.004)
.
\[[B13](https://riskfolio-lib.readthedocs.io/en/latest/parameters.html#id23)\
\]
Stephen A. Ross. The arbitrage theory of capital asset pricing. _Journal of Economic Theory_, 13(3):341–360, December 1976. URL: [https://ideas.repec.org/a/eee/jetheo/v13y1976i3p341-360.html](https://ideas.repec.org/a/eee/jetheo/v13y1976i3p341-360.html)
, [doi:](https://doi.org/)
.
\[[B14](https://riskfolio-lib.readthedocs.io/en/latest/parameters.html#id24)\
\]
Jianqing Fan, Yingying Fan, and Jinchi Lv. High dimensional covariance matrix estimation using a factor model. _Journal of Econometrics_, 147(1):186–197, November 2008. URL: [https://ideas.repec.org/a/eee/econom/v147y2008i1p186-197.html](https://ideas.repec.org/a/eee/econom/v147y2008i1p186-197.html)
, [doi:](https://doi.org/)
.
\[B15\] ([1](https://riskfolio-lib.readthedocs.io/en/latest/parameters.html#id74)
,[2](https://riskfolio-lib.readthedocs.io/en/latest/parameters.html#id75)
)
Frank Fabozzi. _Robust portfolio optimization and management_. John Wiley, Hoboken, N.J, 2007. ISBN 978-0-471-92122-6.
[**On-Demand H100 SXM GPUs for $2.99/hr/GPU with Lambda** 640 GB of vRAM in one 8x instance **Launch now**](https://server.ethicalads.io/proxy/click/9837/019d0edd-c206-7461-96f3-a10da9851c4e/)
[Ads by EthicalAds](https://www.ethicalads.io/advertisers/topics/data-science/?ref=ea-text)
---
# Constraints Functions - Riskfolio-Lib 7.2
[Skip to content](https://riskfolio-lib.readthedocs.io/en/latest/constraints.html#module-ConstraintsFunctions)
Constraints Functions[¶](https://riskfolio-lib.readthedocs.io/en/latest/constraints.html#constraints-functions "Link to this heading")
=======================================================================================================================================
[Buy Advanced Portfolio Optimization Book on Springer](https://www.kqzyfj.com/click-101359873-15150084?url=https%3A%2F%2Flink.springer.com%2Fbook%2F9783031843037)
[Enroll in the Portfolio Optimization with Python Course](https://www.paypal.com/ncp/payment/GN55W4UQ7VAMN)
[](https://github.com/sponsors/dcajasn)
[](https://ko-fi.com/B0B833SXD)
This module has functions that help us to create any kind of linear constraint related to the assets or assets class weights or related to the value of the sensitivity of the portfolio to a specific risk factor. These functions transform all constraint to the form Aw≥B.
This module have a function that help us to create relative and absolute views for the Black Litterman model \[[E1](https://riskfolio-lib.readthedocs.io/en/latest/constraints.html#id73 "Fischer Black and Robert Litterman. Global portfolio optimization. Financial Analysts Journal, 48(5):28–43, 1992. URL: http://www.jstor.org/stable/4479577.")\
\]. This views can consider relationships among assets and asset classes. This function transform all views to the form Pw\=Q.
This module also have functions to create constraints based on graph information \[[E2](https://riskfolio-lib.readthedocs.io/en/latest/constraints.html#id115 "Dany Cajas. A graph theory approach to portfolio optimization. SSRN Electronic Journal, 10 2023. doi:10.2139/ssrn.4602019.")\
\] \[[E3](https://riskfolio-lib.readthedocs.io/en/latest/constraints.html#id116 "Dany Cajas. A graph theory approach to portfolio optimization part ii. SSRN Electronic Journal, 12 2023. doi:10.2139/ssrn.4540021.")\
\] like the information obtained from networks and dendrograms.
Module Functions[¶](https://riskfolio-lib.readthedocs.io/en/latest/constraints.html#module-ConstraintsFunctions "Link to this heading")
----------------------------------------------------------------------------------------------------------------------------------------
ConstraintsFunctions.assets\_constraints(_[constraints](https://riskfolio-lib.readthedocs.io/en/latest/constraints.html#ConstraintsFunctions.assets_constraints.constraints "ConstraintsFunctions.assets_constraints.constraints (Python parameter) — Constraints DataFrame, where n_constraints is the number of constraints and n_fields is the number of fields of constraints DataFrame, the fields are:")
_, _[asset\_classes](https://riskfolio-lib.readthedocs.io/en/latest/constraints.html#ConstraintsFunctions.assets_constraints.asset_classes "ConstraintsFunctions.assets_constraints.asset_classes (Python parameter) — Asset's classes matrix, where n_assets is the number of assets and n_cols is the number of columns of the matrix where the first column is the asset list and the next columns are the different asset's classes sets.")
_)[\[source\]](https://riskfolio-lib.readthedocs.io/en/latest/_modules/ConstraintsFunctions.html#assets_constraints)
[¶](https://riskfolio-lib.readthedocs.io/en/latest/constraints.html#ConstraintsFunctions.assets_constraints "Link to this definition")
Create the linear constraints matrixes A and B of the constraint Aw≤B.
Parameters:[¶](https://riskfolio-lib.readthedocs.io/en/latest/constraints.html#ConstraintsFunctions.assets_constraints-parameters "Permalink to this headline")
constraints : DataFrame of shape (n\_constraints, n\_fields)[¶](https://riskfolio-lib.readthedocs.io/en/latest/constraints.html#ConstraintsFunctions.assets_constraints.constraints "Permalink to this definition")
Constraints DataFrame, where n\_constraints is the number of constraints and n\_fields is the number of fields of constraints DataFrame, the fields are:
* Disabled: (bool) indicates if the constraint is enable.
* Type: (str) can be ‘Assets’, ‘Classes’, ‘All Assets’, ‘Each asset in a class’ and ‘All Classes’.
* Set: (str) if Type is ‘Classes’, ‘Each asset in a class’ or ‘All Classes’ specified the name of the asset’s classes set.
* Position: (str) the name of the asset or asset class of the constraint.
* Sign: (str) can be ‘>=’ or ‘<=’.
* Weight: (scalar) is the maximum or minimum weight of the absolute constraint.
* Type Relative: (str) can be ‘Assets’ or ‘Classes’.
* Relative Set: (str) if Type Relative is ‘Classes’ specified the name of the set of asset classes.
* Relative: (str) the name of the asset or asset class of the relative constraint.
* Factor: (scalar) is the factor of the relative constraint.
asset\_classes : DataFrame of shape (n\_assets, n\_cols)[¶](https://riskfolio-lib.readthedocs.io/en/latest/constraints.html#ConstraintsFunctions.assets_constraints.asset_classes "Permalink to this definition")
Asset’s classes matrix, where n\_assets is the number of assets and n\_cols is the number of columns of the matrix where the first column is the asset list and the next columns are the different asset’s classes sets.
Returns:[¶](https://riskfolio-lib.readthedocs.io/en/latest/constraints.html#ConstraintsFunctions.assets_constraints-returns "Permalink to this headline")
* **A** (_nd-array_) – The matrix A of Aw≤B.
* **B** (_nd-array_) – The matrix B of Aw≤B.
Raises:[¶](https://riskfolio-lib.readthedocs.io/en/latest/constraints.html#ConstraintsFunctions.assets_constraints-raises "Permalink to this headline")
**ValueError when the value cannot be calculated.** –
Examples
`import riskfolio as rp asset_classes = {'Assets': ['FB', 'GOOGL', 'NTFX', 'BAC', 'WFC', 'TLT', 'SHV'], 'Class 1': ['Equity', 'Equity', 'Equity', 'Equity', 'Equity', 'Fixed Income', 'Fixed Income'], 'Class 2': ['Technology', 'Technology', 'Technology', 'Financial', 'Financial', 'Treasury', 'Treasury'],} asset_classes = pd.DataFrame(asset_classes) asset_classes = asset_classes.sort_values(by=['Assets']) constraints = {'Disabled': [False, False, False, False, False, False, False], 'Type': ['Classes', 'Classes', 'Assets', 'Assets', 'Classes', 'All Assets', 'Each asset in a class'], 'Set': ['Class 1', 'Class 1', '', '', 'Class 2', '', 'Class 1'], 'Position': ['Equity', 'Fixed Income', 'BAC', 'WFC', 'Financial', '', 'Equity'], 'Sign': ['<=', '<=', '<=', '<=', '>=', '>=', '>='], 'Weight': [0.6, 0.5, 0.1, '', '', 0.02, ''], 'Type Relative': ['', '', '', 'Assets', 'Classes', '', 'Assets'], 'Relative Set': ['', '', '', '', 'Class 1', '', ''], 'Relative': ['', '', '', 'FB', 'Fixed Income', '', 'TLT'], 'Factor': ['', '', '', 1.2, 0.5, '', 0.4]} constraints = pd.DataFrame(constraints)`
The constraints look like the following image:
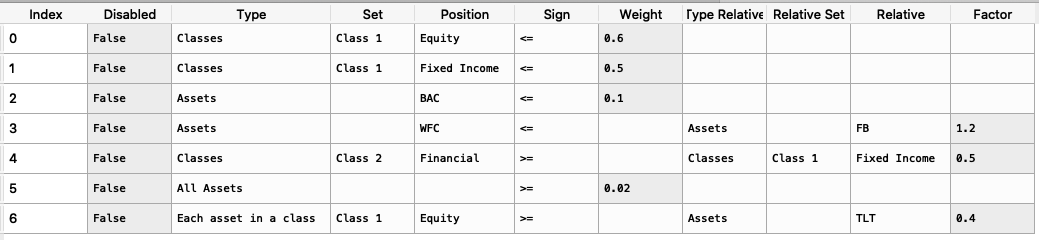
It is easier to construct the constraints in excel and then upload to a dataframe.
To create the matrixes A and B we use the following command:
`A, B = rp.assets_constraints(constraints, asset_classes)`
The matrixes A and B looks like this (all constraints were converted to a linear constraint):
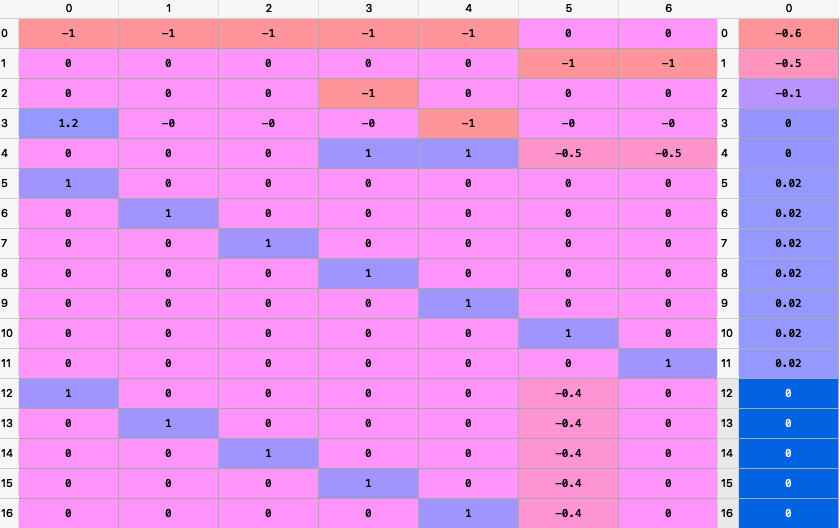
ConstraintsFunctions.factors\_constraints(_[constraints](https://riskfolio-lib.readthedocs.io/en/latest/constraints.html#ConstraintsFunctions.factors_constraints.constraints "ConstraintsFunctions.factors_constraints.constraints (Python parameter) — Constraints DataFrame, where n_constraints is the number of constraints and n_fields is the number of fields of constraints DataFrame, the fields are:")
_, _[loadings](https://riskfolio-lib.readthedocs.io/en/latest/constraints.html#ConstraintsFunctions.factors_constraints.loadings "ConstraintsFunctions.factors_constraints.loadings (Python parameter) — The loadings matrix.")
_)[\[source\]](https://riskfolio-lib.readthedocs.io/en/latest/_modules/ConstraintsFunctions.html#factors_constraints)
[¶](https://riskfolio-lib.readthedocs.io/en/latest/constraints.html#ConstraintsFunctions.factors_constraints "Link to this definition")
Create the factors constraints matrixes C and D of the constraint Cw≤D.
Parameters:[¶](https://riskfolio-lib.readthedocs.io/en/latest/constraints.html#ConstraintsFunctions.factors_constraints-parameters "Permalink to this headline")
constraints : DataFrame of shape (n\_constraints, n\_fields)[¶](https://riskfolio-lib.readthedocs.io/en/latest/constraints.html#ConstraintsFunctions.factors_constraints.constraints "Permalink to this definition")
Constraints DataFrame, where n\_constraints is the number of constraints and n\_fields is the number of fields of constraints DataFrame, the fields are:
* Disabled: (bool) indicates if the constraint is enable.
* Factor: (str) the name of the factor of the constraint.
* Sign: (str) can be ‘>=’ or ‘<=’.
* Value: (scalar) is the maximum or minimum value of the factor.
loadings : DataFrame of shape (n\_assets, n\_features)[¶](https://riskfolio-lib.readthedocs.io/en/latest/constraints.html#ConstraintsFunctions.factors_constraints.loadings "Permalink to this definition")
The loadings matrix.
Returns:[¶](https://riskfolio-lib.readthedocs.io/en/latest/constraints.html#ConstraintsFunctions.factors_constraints-returns "Permalink to this headline")
* **C** (_nd-array_) – The matrix C of Cw≤D.
* **D** (_nd-array_) – The matrix D of Cw≤D.
Raises:[¶](https://riskfolio-lib.readthedocs.io/en/latest/constraints.html#ConstraintsFunctions.factors_constraints-raises "Permalink to this headline")
**ValueError when the value cannot be calculated.** –
Examples
`loadings = {'const': [0.0004, 0.0002, 0.0000, 0.0006, 0.0001, 0.0003, -0.0003], 'MTUM': [0.1916, 1.0061, 0.8695, 1.9996, 0.0000, 0.0000, 0.0000], 'QUAL': [0.0000, 2.0129, 1.4301, 0.0000, 0.0000, 0.0000, 0.0000], 'SIZE': [0.0000, 0.0000, 0.0000, 0.4717, 0.0000, -0.1857, 0.0000], 'USMV': [-0.7838, -1.6439, -1.0176, -1.4407, 0.0055, 0.5781, 0.0000], 'VLUE': [1.4772, -0.7590, -0.4090, 0.0000, -0.0054, -0.4844, 0.9435]} loadings = pd.DataFrame(loadings) constraints = {'Disabled': [False, False, False], 'Factor': ['MTUM', 'USMV', 'VLUE'], 'Sign': ['<=', '<=', '>='], 'Value': [0.9, -1.2, 0.3], 'Relative Factor': ['USMV', '', '']} constraints = pd.DataFrame(constraints)`
The constraints look like the following image:
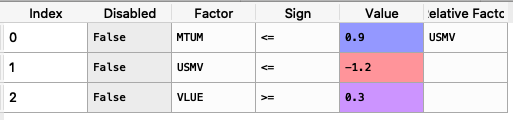
It is easier to construct the constraints in excel and then upload to a dataframe.
To create the matrixes C and D we use the following command:
`C, D = rp.factors_constraints(constraints, loadings)`
The matrixes C and D looks like this (all constraints were converted to a linear constraint):

ConstraintsFunctions.integer\_constraints(_[constraints](https://riskfolio-lib.readthedocs.io/en/latest/constraints.html#ConstraintsFunctions.integer_constraints.constraints "ConstraintsFunctions.integer_constraints.constraints (Python parameter) — Constraints DataFrame, where n_constraints is the number of constraints and n_fields is the number of fields of constraints DataFrame, the fields are:")
_, _[asset\_classes](https://riskfolio-lib.readthedocs.io/en/latest/constraints.html#ConstraintsFunctions.integer_constraints.asset_classes "ConstraintsFunctions.integer_constraints.asset_classes (Python parameter) — Asset's classes matrix, where n_assets is the number of assets and n_cols is the number of columns of the matrix where the first column is the asset list and the next columns are the different asset's classes sets.")
_)[\[source\]](https://riskfolio-lib.readthedocs.io/en/latest/_modules/ConstraintsFunctions.html#integer_constraints)
[¶](https://riskfolio-lib.readthedocs.io/en/latest/constraints.html#ConstraintsFunctions.integer_constraints "Link to this definition")
Create the integer constraints matrixes A, B, C, D, E, F associated to the constrainta Ak≤B, Ck≤D⊙ks and Eks≤F.
Parameters:[¶](https://riskfolio-lib.readthedocs.io/en/latest/constraints.html#ConstraintsFunctions.integer_constraints-parameters "Permalink to this headline")
constraints : DataFrame of shape (n\_constraints, n\_fields)[¶](https://riskfolio-lib.readthedocs.io/en/latest/constraints.html#ConstraintsFunctions.integer_constraints.constraints "Permalink to this definition")
Constraints DataFrame, where n\_constraints is the number of constraints and n\_fields is the number of fields of constraints DataFrame, the fields are:
* Disabled: (bool) indicates if the constraint is enable.
* Type: (str) can be ‘Assets’ and ‘Classes’.
* Set: (str) if Type is ‘Classes’ specified the name of the asset’s classes set.
* Position: (str) the name of the asset or asset class of the constraint, or ‘All’ for all categories.
* Kind: (str) can be ‘CardUp’ (Upper Cardinality), ‘CardLow’ (Lower Cardinality), ‘MuEx’ (Mutually Exclusive) and ‘Join’ (Join Investments).
* Value: (int or None) is the maximum or minimum value of cardinality constraints.
* Type Relative: (str) can be: ‘Assets’ or ‘Classes’.
* Relative Set: (str) if Type Relative is ‘Classes’ specified the name of the set of asset classes.
* Relative: (str) the name of the asset or asset class of the relative constraint.
asset\_classes : DataFrame of shape (n\_assets, n\_cols)[¶](https://riskfolio-lib.readthedocs.io/en/latest/constraints.html#ConstraintsFunctions.integer_constraints.asset_classes "Permalink to this definition")
Asset’s classes matrix, where n\_assets is the number of assets and n\_cols is the number of columns of the matrix where the first column is the asset list and the next columns are the different asset’s classes sets.
Returns:[¶](https://riskfolio-lib.readthedocs.io/en/latest/constraints.html#ConstraintsFunctions.integer_constraints-returns "Permalink to this headline")
* **A** (_dict_) – The dictionary that containts the matrices A of Ak≤B.
* **B** (_dict_) – The dictionary that containts the matrices B of Ak≤B.
* **C** (_dict_) – The dictionary that containts the matrices C of Ck≤D⊙ks.
* **D** (_dict_) – The dictionary that containts the matrices D of Ck≤D⊙ks.
* **E** (_dict_) – The dictionary that containts the matrices E of Eks≤F.
* **F** (_dict_) – The dictionary that containts the matrices F of Eks≤F.
Raises:[¶](https://riskfolio-lib.readthedocs.io/en/latest/constraints.html#ConstraintsFunctions.integer_constraints-raises "Permalink to this headline")
**ValueError when the value cannot be calculated.** –
Examples
`import riskfolio as rp asset_classes = {'Assets': ['FB', 'GOOGL', 'NTFX', 'BAC', 'WFC', 'TLT', 'SHV'], 'Class 1': ['Equity', 'Equity', 'Equity', 'Equity', 'Equity', 'Fixed Income', 'Fixed Income'], 'Class 2': ['Technology', 'Technology', 'Technology', 'Financial', 'Financial', 'Treasury', 'Treasury'],} asset_classes = pd.DataFrame(asset_classes) asset_classes = asset_classes.sort_values(by=['Assets']) constraints = {'Disabled': [True, True, True, True, True, True, True, True, True, True, True, False], 'Type': ['Assets', 'Assets', 'Assets', 'Assets', 'Classes', 'Classes', 'Classes', 'Classes', 'Classes', 'Classes', 'Classes', 'Classes'], 'Set': ['', '', '', '', 'Industry', 'Industry', 'Industry', 'Industry', 'Industry', 'Industry', 'Industry', 'Industry'], 'Position': ['', '', 'PCAR', 'PSA', '', '', 'Financials', 'Energy', 'Financials', 'Financials', 'Industrials', 'Financials'], 'Kind': ['CardUp', 'CardLow', 'MuEx', 'Join', 'CardUp', 'CardLow', 'CardUp', 'CardLow', 'MuEx', 'MuEx', 'Join', 'Join'], 'Value': [7.0, 16.0, '', '', 4.0, 9.0, 1.0, 1.0, '', '', '', ''], 'Type Relative': ['', '', 'Assets', 'Assets', '', '', '', '', 'Assets', 'Classes', 'Assets', 'Classes'], 'Relative Set': ['', '', '', '', '', '', '', '', '', 'Industry', '', 'Industry'], 'Relative': ['', '', 'CPB', 'MMC', '', '', '', '', 'BAX', 'Consumer Staples', 'PSA', 'Information Technology']} constraints = pd.DataFrame(constraints)`
The constraints look like the following image:
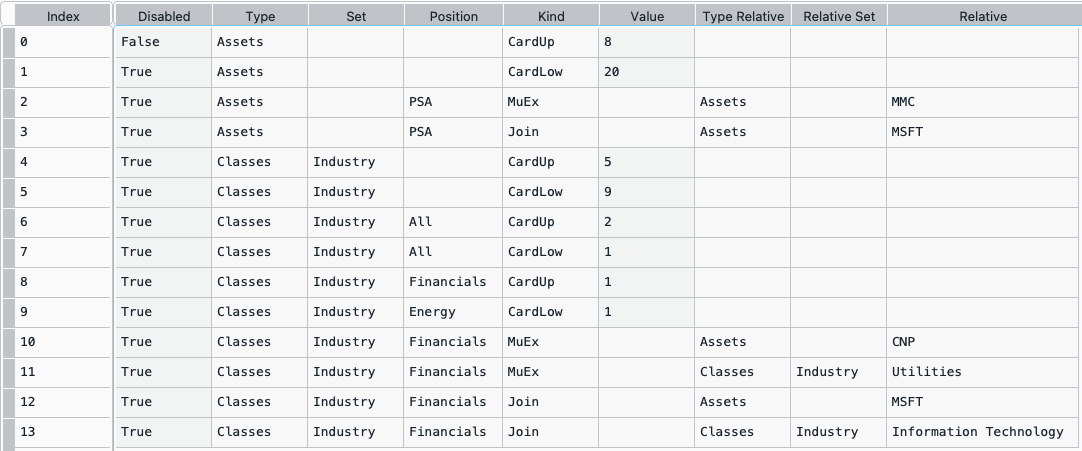
It is easier to construct the constraints in excel and then upload to a dataframe.
To create the dictionaries A, B, C, D, E, and F we use the following command:
`A, B, C, D, E, F = rp.integer_constraints(constraints, asset_classes)`
The dictionaries A and B look like the following image:
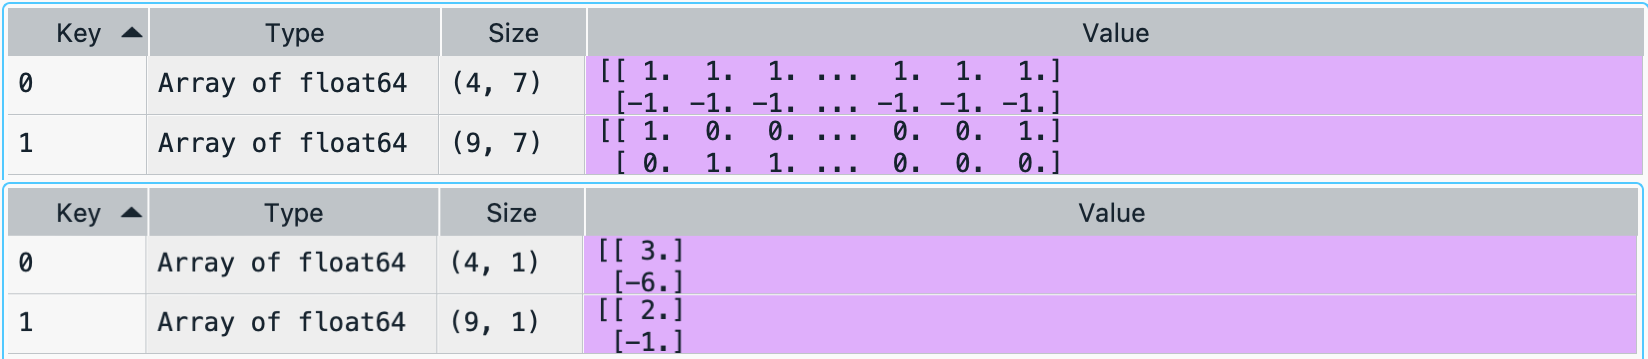
The dictionaries C and D look like the following image:
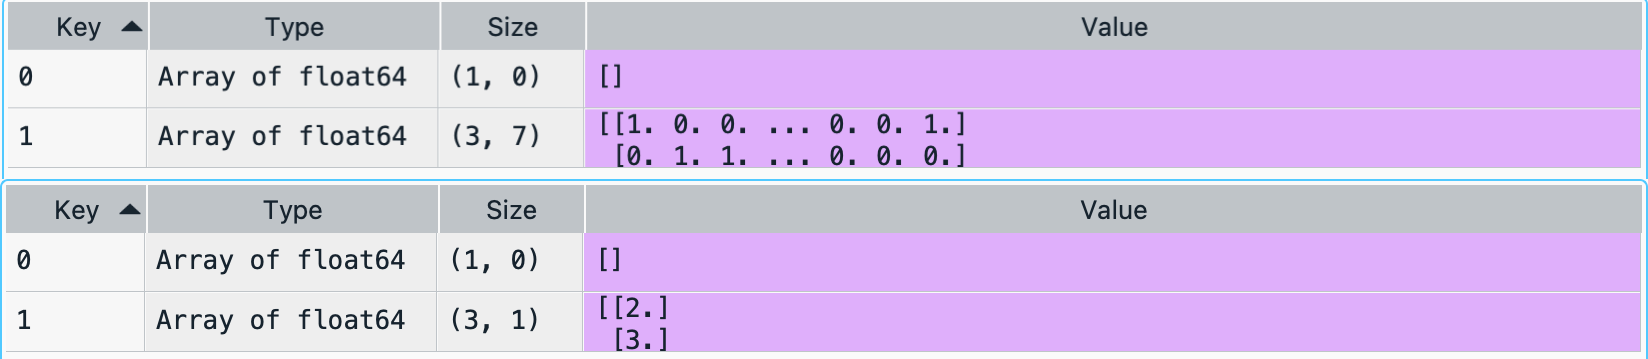
The dictionaries E and F look like the following image:
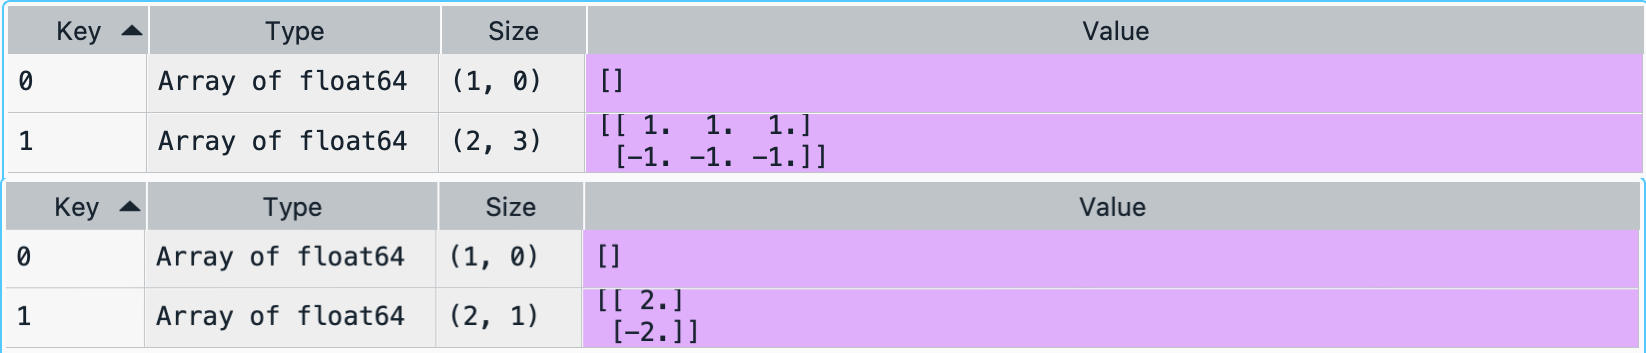
ConstraintsFunctions.assets\_views(_[views](https://riskfolio-lib.readthedocs.io/en/latest/constraints.html#ConstraintsFunctions.assets_views.views "ConstraintsFunctions.assets_views.views (Python parameter) — views DataFrame, where n_views is the number of views and n_fields is the number of fields of views DataFrame, the fields are:")
_, _[asset\_classes](https://riskfolio-lib.readthedocs.io/en/latest/constraints.html#ConstraintsFunctions.assets_views.asset_classes "ConstraintsFunctions.assets_views.asset_classes (Python parameter) — Asset's classes matrix, where n_assets is the number of assets and n_cols is the number of columns of the matrix where the first column is the asset list and the next columns are the different asset's classes sets.")
_)[\[source\]](https://riskfolio-lib.readthedocs.io/en/latest/_modules/ConstraintsFunctions.html#assets_views)
[¶](https://riskfolio-lib.readthedocs.io/en/latest/constraints.html#ConstraintsFunctions.assets_views "Link to this definition")
Create the assets views matrixes P and Q of the views Pw\=Q.
Parameters:[¶](https://riskfolio-lib.readthedocs.io/en/latest/constraints.html#ConstraintsFunctions.assets_views-parameters "Permalink to this headline")
views : DataFrame of shape (n\_views, n\_fields)[¶](https://riskfolio-lib.readthedocs.io/en/latest/constraints.html#ConstraintsFunctions.assets_views.views "Permalink to this definition")
views DataFrame, where n\_views is the number of views and n\_fields is the number of fields of views DataFrame, the fields are:
* Disabled: (bool) indicates if the constraint is enable.
* Type: (str) can be: ‘Assets’ or ‘Classes’.
* Set: (str) if Type is ‘Classes’ specified the name of the set of asset classes.
* Position: (str) the name of the asset or asset class of the view.
* Sign: (str) can be ‘>=’ or ‘<=’.
* Return: (scalar) is the return of the view.
* Type Relative: (str) can be: ‘Assets’ or ‘Classes’.
* Relative Set: (str) if Type Relative is ‘Classes’ specified the name of the set of asset classes.
* Relative: (str) the name of the asset or asset class of the relative view.
asset\_classes : DataFrame of shape (n\_assets, n\_cols)[¶](https://riskfolio-lib.readthedocs.io/en/latest/constraints.html#ConstraintsFunctions.assets_views.asset_classes "Permalink to this definition")
Asset’s classes matrix, where n\_assets is the number of assets and n\_cols is the number of columns of the matrix where the first column is the asset list and the next columns are the different asset’s classes sets.
Returns:[¶](https://riskfolio-lib.readthedocs.io/en/latest/constraints.html#ConstraintsFunctions.assets_views-returns "Permalink to this headline")
* **P** (_nd-array_) – The matrix P that shows the relation among assets in each view.
* **Q** (_nd-array_) – The matrix Q that shows the expected return of each view.
Raises:[¶](https://riskfolio-lib.readthedocs.io/en/latest/constraints.html#ConstraintsFunctions.assets_views-raises "Permalink to this headline")
**ValueError when the value cannot be calculated.** –
Examples
`asset_classes = {'Assets': ['FB', 'GOOGL', 'NTFX', 'BAC', 'WFC', 'TLT', 'SHV'], 'Class 1': ['Equity', 'Equity', 'Equity', 'Equity', 'Equity', 'Fixed Income', 'Fixed Income'], 'Class 2': ['Technology', 'Technology', 'Technology', 'Financial', 'Financial', 'Treasury', 'Treasury'],} asset_classes = pd.DataFrame(asset_classes) asset_classes = asset_classes.sort_values(by=['Assets']) views = {'Disabled': [False, False, False, False], 'Type': ['Assets', 'Classes', 'Classes', 'Assets'], 'Set': ['', 'Class 2','Class 1', ''], 'Position': ['WFC', 'Financial', 'Equity', 'FB'], 'Sign': ['<=', '>=', '>=', '>='], 'Return': [ 0.3, 0.1, 0.05, 0.03 ], 'Type Relative': [ 'Assets', 'Classes', 'Assets', ''], 'Relative Set': [ '', 'Class 1', '', ''], 'Relative': ['FB', 'Fixed Income', 'TLT', '']} views = pd.DataFrame(views)`
The constraints look like the following image:
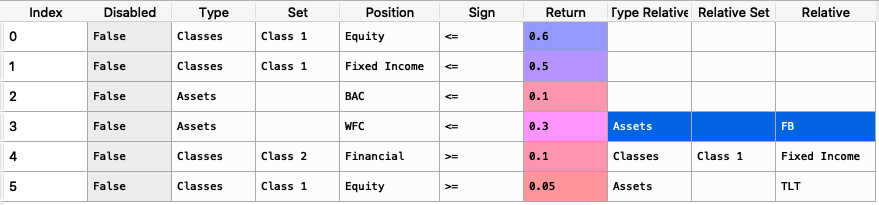
It is easier to construct the constraints in excel and then upload to a dataframe.
To create the matrixes P and Q we use the following command:
`P, Q = rp.assets_views(views, asset_classes)`
The matrixes P and Q look like the following image:

ConstraintsFunctions.factors\_views(_[views](https://riskfolio-lib.readthedocs.io/en/latest/constraints.html#ConstraintsFunctions.factors_views.views "ConstraintsFunctions.factors_views.views (Python parameter) — views DataFrame, where n_views is the number of views and n_fields is the number of fields of views DataFrame, the fields are:")
_, _[loadings](https://riskfolio-lib.readthedocs.io/en/latest/constraints.html#ConstraintsFunctions.factors_views.loadings "ConstraintsFunctions.factors_views.loadings (Python parameter) — The loadings matrix.")
_, _[const](https://riskfolio-lib.readthedocs.io/en/latest/constraints.html#ConstraintsFunctions.factors_views "ConstraintsFunctions.factors_views.const (Python parameter)")
\=`True`_)[\[source\]](https://riskfolio-lib.readthedocs.io/en/latest/_modules/ConstraintsFunctions.html#factors_views)
[¶](https://riskfolio-lib.readthedocs.io/en/latest/constraints.html#ConstraintsFunctions.factors_views "Link to this definition")
Create the factors constraints matrixes C and D of the constraint Cw≥D.
Parameters:[¶](https://riskfolio-lib.readthedocs.io/en/latest/constraints.html#ConstraintsFunctions.factors_views-parameters "Permalink to this headline")
views : DataFrame of shape (n\_views, n\_fields)[¶](https://riskfolio-lib.readthedocs.io/en/latest/constraints.html#ConstraintsFunctions.factors_views.views "Permalink to this definition")
views DataFrame, where n\_views is the number of views and n\_fields is the number of fields of views DataFrame, the fields are:
* Disabled: (bool) indicates if the constraint is enable.
* Factor: (str) the name of the factor of the constraint.
* Sign: (str) can be ‘>=’ or ‘<=’.
* Value: (scalar) is the maximum or minimum value of the factor.
loadings : DataFrame of shape (n\_assets, n\_features)[¶](https://riskfolio-lib.readthedocs.io/en/latest/constraints.html#ConstraintsFunctions.factors_views.loadings "Permalink to this definition")
The loadings matrix.
Returns:[¶](https://riskfolio-lib.readthedocs.io/en/latest/constraints.html#ConstraintsFunctions.factors_views-returns "Permalink to this headline")
* **P** (_nd-array_) – The matrix P that shows the relation among factors in each factor view.
* **Q** (_nd-array_) – The matrix Q that shows the expected return of each factor view.
Raises:[¶](https://riskfolio-lib.readthedocs.io/en/latest/constraints.html#ConstraintsFunctions.factors_views-raises "Permalink to this headline")
**ValueError when the value cannot be calculated.** –
Examples
`loadings = {'const': [0.0004, 0.0002, 0.0000, 0.0006, 0.0001, 0.0003, -0.0003], 'MTUM': [0.1916, 1.0061, 0.8695, 1.9996, 0.0000, 0.0000, 0.0000], 'QUAL': [0.0000, 2.0129, 1.4301, 0.0000, 0.0000, 0.0000, 0.0000], 'SIZE': [0.0000, 0.0000, 0.0000, 0.4717, 0.0000, -0.1857, 0.0000], 'USMV': [-0.7838, -1.6439, -1.0176, -1.4407, 0.0055, 0.5781, 0.0000], 'VLUE': [1.4772, -0.7590, -0.4090, 0.0000, -0.0054, -0.4844, 0.9435]} loadings = pd.DataFrame(loadings) factorsviews = {'Disabled': [False, False, False], 'Factor': ['MTUM', 'USMV', 'VLUE'], 'Sign': ['<=', '<=', '>='], 'Value': [0.9, -1.2, 0.3], 'Relative Factor': ['USMV', '', '']} factorsviews = pd.DataFrame(factorsviews)`
The constraints look like the following image:
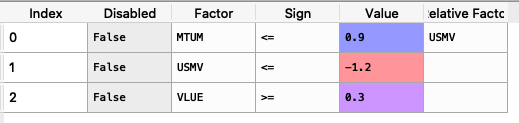
It is easier to construct the constraints in excel and then upload to a dataframe.
To create the matrixes P and Q we use the following command:
`P, Q = rp.factors_views(factorsviews, loadings, const=True)`
The matrixes P and Q look like the following image:

ConstraintsFunctions.assets\_clusters(_[returns](https://riskfolio-lib.readthedocs.io/en/latest/constraints.html#ConstraintsFunctions.assets_clusters.returns "ConstraintsFunctions.assets_clusters.returns (Python parameter) — Assets returns DataFrame, where n_samples is the number of observations and n_assets is the number of assets.")
_, _[custom\_cov](https://riskfolio-lib.readthedocs.io/en/latest/constraints.html#ConstraintsFunctions.assets_clusters.custom_cov "ConstraintsFunctions.assets_clusters.custom_cov (Python parameter) — Custom covariance matrix, used when codependence parameter has value 'custom_cov'.")
\=`None`_, _[codependence](https://riskfolio-lib.readthedocs.io/en/latest/constraints.html#ConstraintsFunctions.assets_clusters.codependence "ConstraintsFunctions.assets_clusters.codependence (Python parameter) — The codependence or similarity matrix used to build the distance metric and clusters.")
\=`'pearson'`_, _[linkage](https://riskfolio-lib.readthedocs.io/en/latest/constraints.html#ConstraintsFunctions.assets_clusters.linkage "ConstraintsFunctions.assets_clusters.linkage (Python parameter) — Linkage method of hierarchical clustering, see linkage for more details. The default is 'ward'.")
\=`'ward'`_, _[opt\_k\_method](https://riskfolio-lib.readthedocs.io/en/latest/constraints.html#ConstraintsFunctions.assets_clusters.opt_k_method "ConstraintsFunctions.assets_clusters.opt_k_method (Python parameter) — Method used to calculate the optimum number of clusters. The default is 'twodiff'.")
\=`'twodiff'`_, _[k](https://riskfolio-lib.readthedocs.io/en/latest/constraints.html#ConstraintsFunctions.assets_clusters.k "ConstraintsFunctions.assets_clusters.k (Python parameter) — Number of clusters.")
\=`None`_, _[max\_k](https://riskfolio-lib.readthedocs.io/en/latest/constraints.html#ConstraintsFunctions.assets_clusters.max_k "ConstraintsFunctions.assets_clusters.max_k (Python parameter) — Max number of clusters used by the two difference gap statistic to find the optimal number of clusters.")
\=`10`_, _[bins\_info](https://riskfolio-lib.readthedocs.io/en/latest/constraints.html#ConstraintsFunctions.assets_clusters.bins_info "ConstraintsFunctions.assets_clusters.bins_info (Python parameter) — Number of bins used to calculate variation of information.")
\=`'KN'`_, _[alpha\_tail](https://riskfolio-lib.readthedocs.io/en/latest/constraints.html#ConstraintsFunctions.assets_clusters.alpha_tail "ConstraintsFunctions.assets_clusters.alpha_tail (Python parameter) — Significance level for lower tail dependence index.")
\=`0.05`_, _[gs\_threshold](https://riskfolio-lib.readthedocs.io/en/latest/constraints.html#ConstraintsFunctions.assets_clusters.gs_threshold "ConstraintsFunctions.assets_clusters.gs_threshold (Python parameter) — Gerber statistic threshold.")
\=`0.5`_, _[leaf\_order](https://riskfolio-lib.readthedocs.io/en/latest/constraints.html#ConstraintsFunctions.assets_clusters.leaf_order "ConstraintsFunctions.assets_clusters.leaf_order (Python parameter) — Indicates if the cluster are ordered so that the distance between successive leaves is minimal.")
\=`True`_)[\[source\]](https://riskfolio-lib.readthedocs.io/en/latest/_modules/ConstraintsFunctions.html#assets_clusters)
[¶](https://riskfolio-lib.readthedocs.io/en/latest/constraints.html#ConstraintsFunctions.assets_clusters "Link to this definition")
Create asset classes based on hierarchical clustering.
Parameters:[¶](https://riskfolio-lib.readthedocs.io/en/latest/constraints.html#ConstraintsFunctions.assets_clusters-parameters "Permalink to this headline")
returns : DataFrame of shape (n\_samples, n\_assets)[¶](https://riskfolio-lib.readthedocs.io/en/latest/constraints.html#ConstraintsFunctions.assets_clusters.returns "Permalink to this definition")
Assets returns DataFrame, where n\_samples is the number of observations and n\_assets is the number of assets.
custom\_cov : DataFrame or None, optional[¶](https://riskfolio-lib.readthedocs.io/en/latest/constraints.html#ConstraintsFunctions.assets_clusters.custom_cov "Permalink to this definition")
Custom covariance matrix, used when codependence parameter has value ‘custom\_cov’. The default is None.
codependence : [str](https://docs.python.org/3.11/library/stdtypes.html#str "(in Python v3.11)")
, can be {'pearson', 'spearman', 'abs\_pearson', 'abs\_spearman', 'distance', 'mutual\_info', 'tail' or 'custom\_cov'}[¶](https://riskfolio-lib.readthedocs.io/en/latest/constraints.html#ConstraintsFunctions.assets_clusters.codependence "Permalink to this definition")
The codependence or similarity matrix used to build the distance metric and clusters. The default is ‘pearson’. Possible values are:
* ’pearson’: pearson correlation matrix. Distance formula: Di,j\=0.5(1−ρi,jpearson).
* ’spearman’: spearman correlation matrix. Distance formula: Di,j\=0.5(1−ρi,jspearman).
* ’kendall’: kendall correlation matrix. Distance formula: Di,j\=0.5(1−ρi,jkendall).
* ’gerber1’: Gerber statistic 1 correlation matrix. Distance formula: Di,j\=0.5(1−ρi,jgerber1).
* ’gerber2’: Gerber statistic 2 correlation matrix. Distance formula: Di,j\=0.5(1−ρi,jgerber2).
* ’abs\_pearson’: absolute value pearson correlation matrix. Distance formula: Di,j\=(1−|ρi,j|).
* ’abs\_spearman’: absolute value spearman correlation matrix. Distance formula: Di,j\=(1−|ρi,j|).
* ’abs\_kendall’: absolute value kendall correlation matrix. Distance formula: Di,j\=(1−|ρi,jkendall|).
* ’distance’: distance correlation matrix. Distance formula Di,j\=(1−ρi,jdistance).
* ’mutual\_info’: mutual information matrix. Distance used is variation information matrix.
* ’tail’: lower tail dependence index matrix. Dissimilarity formula Di,j\=−logλi,j.
* ’custom\_cov’: use custom correlation matrix based on the custom\_cov parameter. Distance formula: Di,j\=0.5(1−ρi,jpearson).
linkage : string, optional[¶](https://riskfolio-lib.readthedocs.io/en/latest/constraints.html#ConstraintsFunctions.assets_clusters.linkage "Permalink to this definition")
Linkage method of hierarchical clustering, see [linkage](https://docs.scipy.org/doc/scipy/reference/generated/scipy.cluster.hierarchy.linkage.html?highlight=linkage#scipy.cluster.hierarchy.linkage)
for more details. The default is ‘ward’. Possible values are:
* ’single’.
* ’complete’.
* ’average’.
* ’weighted’.
* ’centroid’.
* ’median’.
* ’ward’.
* ’DBHT’. Direct Bubble Hierarchical Tree.
opt\_k\_method : [str](https://docs.python.org/3.11/library/stdtypes.html#str "(in Python v3.11)")
[¶](https://riskfolio-lib.readthedocs.io/en/latest/constraints.html#ConstraintsFunctions.assets_clusters.opt_k_method "Permalink to this definition")
Method used to calculate the optimum number of clusters. The default is ‘twodiff’. Possible values are:
* ’twodiff’: two difference gap statistic.
* ’stdsil’: standarized silhouette score.
k : [int](https://docs.python.org/3.11/library/functions.html#int "(in Python v3.11)")
, optional[¶](https://riskfolio-lib.readthedocs.io/en/latest/constraints.html#ConstraintsFunctions.assets_clusters.k "Permalink to this definition")
Number of clusters. This value is took instead of the optimal number of clusters calculated with the two difference gap statistic. The default is None.
max\_k : [int](https://docs.python.org/3.11/library/functions.html#int "(in Python v3.11)")
, optional[¶](https://riskfolio-lib.readthedocs.io/en/latest/constraints.html#ConstraintsFunctions.assets_clusters.max_k "Permalink to this definition")
Max number of clusters used by the two difference gap statistic to find the optimal number of clusters. The default is 10.
bins\_info : [int](https://docs.python.org/3.11/library/functions.html#int "(in Python v3.11)")
or [str](https://docs.python.org/3.11/library/stdtypes.html#str "(in Python v3.11)")
[¶](https://riskfolio-lib.readthedocs.io/en/latest/constraints.html#ConstraintsFunctions.assets_clusters.bins_info "Permalink to this definition")
Number of bins used to calculate variation of information. The default value is ‘KN’. Possible values are:
* ’KN’: Knuth’s choice method. See more in [knuth\_bin\_width](https://docs.astropy.org/en/stable/api/astropy.stats.knuth_bin_width.html)
.
* ’FD’: Freedman–Diaconis’ choice method. See more in [freedman\_bin\_width](https://docs.astropy.org/en/stable/api/astropy.stats.freedman_bin_width.html)
.
* ’SC’: Scotts’ choice method. See more in [scott\_bin\_width](https://docs.astropy.org/en/stable/api/astropy.stats.scott_bin_width.html)
.
* ’HGR’: Hacine-Gharbi and Ravier’ choice method.
* int: integer value choice by user.
alpha\_tail : [float](https://docs.python.org/3.11/library/functions.html#float "(in Python v3.11)")
, optional[¶](https://riskfolio-lib.readthedocs.io/en/latest/constraints.html#ConstraintsFunctions.assets_clusters.alpha_tail "Permalink to this definition")
Significance level for lower tail dependence index. The default is 0.05.
gs\_threshold : [float](https://docs.python.org/3.11/library/functions.html#float "(in Python v3.11)")
, optional[¶](https://riskfolio-lib.readthedocs.io/en/latest/constraints.html#ConstraintsFunctions.assets_clusters.gs_threshold "Permalink to this definition")
Gerber statistic threshold. The default is 0.5.
leaf\_order : [bool](https://docs.python.org/3.11/library/functions.html#bool "(in Python v3.11)")
, optional[¶](https://riskfolio-lib.readthedocs.io/en/latest/constraints.html#ConstraintsFunctions.assets_clusters.leaf_order "Permalink to this definition")
Indicates if the cluster are ordered so that the distance between successive leaves is minimal. The default is True.
Returns:[¶](https://riskfolio-lib.readthedocs.io/en/latest/constraints.html#ConstraintsFunctions.assets_clusters-returns "Permalink to this headline")
**clusters** – A dataframe with asset classes based on hierarchical clustering.
Return type:[¶](https://riskfolio-lib.readthedocs.io/en/latest/constraints.html#ConstraintsFunctions.assets_clusters-return-type "Permalink to this headline")
DataFrame
Raises:[¶](https://riskfolio-lib.readthedocs.io/en/latest/constraints.html#ConstraintsFunctions.assets_clusters-raises "Permalink to this headline")
**ValueError when the value cannot be calculated.** –
Examples
`clusters = rp.assets_clusters(returns, codependence='pearson', linkage='ward', k=None, max_k=10, alpha_tail=0.05, leaf_order=True)`
The clusters dataframe looks like the following image:
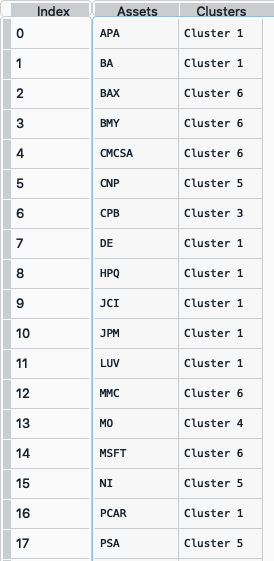
ConstraintsFunctions.hrp\_constraints(_[constraints](https://riskfolio-lib.readthedocs.io/en/latest/constraints.html#ConstraintsFunctions.hrp_constraints.constraints "ConstraintsFunctions.hrp_constraints.constraints (Python parameter) — Constraints DataFrame, where n_constraints is the number of constraints and n_fields is the number of fields of constraints DataFrame, the fields are:")
_, _[asset\_classes](https://riskfolio-lib.readthedocs.io/en/latest/constraints.html#ConstraintsFunctions.hrp_constraints.asset_classes "ConstraintsFunctions.hrp_constraints.asset_classes (Python parameter) — Asset's classes DataFrame, where n_assets is the number of assets and n_cols is the number of columns of the DataFrame where the first column is the asset list and the next columns are the different asset's classes sets.")
_)[\[source\]](https://riskfolio-lib.readthedocs.io/en/latest/_modules/ConstraintsFunctions.html#hrp_constraints)
[¶](https://riskfolio-lib.readthedocs.io/en/latest/constraints.html#ConstraintsFunctions.hrp_constraints "Link to this definition")
Create the upper and lower bounds constraints for hierarchical risk parity model.
Parameters:[¶](https://riskfolio-lib.readthedocs.io/en/latest/constraints.html#ConstraintsFunctions.hrp_constraints-parameters "Permalink to this headline")
constraints : DataFrame of shape (n\_constraints, n\_fields)[¶](https://riskfolio-lib.readthedocs.io/en/latest/constraints.html#ConstraintsFunctions.hrp_constraints.constraints "Permalink to this definition")
Constraints DataFrame, where n\_constraints is the number of constraints and n\_fields is the number of fields of constraints DataFrame, the fields are:
* Disabled: (bool) indicates if the constraint is enable.
* Type: (str) can be: ‘Assets’, All Assets’ and ‘Each asset in a class’.
* Position: (str) the name of the asset or asset class of the constraint.
* Sign: (str) can be ‘>=’ or ‘<=’.
* Weight: (scalar) is the maximum or minimum weight of the absolute constraint.
asset\_classes : DataFrame of shape (n\_assets, n\_cols)[¶](https://riskfolio-lib.readthedocs.io/en/latest/constraints.html#ConstraintsFunctions.hrp_constraints.asset_classes "Permalink to this definition")
Asset’s classes DataFrame, where n\_assets is the number of assets and n\_cols is the number of columns of the DataFrame where the first column is the asset list and the next columns are the different asset’s classes sets.
Returns:[¶](https://riskfolio-lib.readthedocs.io/en/latest/constraints.html#ConstraintsFunctions.hrp_constraints-returns "Permalink to this headline")
* **w\_max** (_pd.Series_) – The upper bound of hierarchical risk parity weights constraints.
* **w\_min** (_pd.Series_) – The lower bound of hierarchical risk parity weights constraints.
Raises:[¶](https://riskfolio-lib.readthedocs.io/en/latest/constraints.html#ConstraintsFunctions.hrp_constraints-raises "Permalink to this headline")
**ValueError when the value cannot be calculated.** –
Examples
`asset_classes = {'Assets': ['FB', 'GOOGL', 'NTFX', 'BAC', 'WFC', 'TLT', 'SHV'], 'Class 1': ['Equity', 'Equity', 'Equity', 'Equity', 'Equity', 'Fixed Income', 'Fixed Income'], 'Class 2': ['Technology', 'Technology', 'Technology', 'Financial', 'Financial', 'Treasury', 'Treasury'],} asset_classes = pd.DataFrame(asset_classes) asset_classes = asset_classes.sort_values(by=['Assets']) constraints = {'Disabled': [False, False, False, False, False, False], 'Type': ['Assets', 'Assets', 'All Assets', 'All Assets', 'Each asset in a class', 'Each asset in a class'], 'Set': ['', '', '', '','Class 1', 'Class 2'], 'Position': ['BAC', 'FB', '', '', 'Equity', 'Treasury'], 'Sign': ['>=', '<=', '<=', '>=', '<=', '<='], 'Weight': [0.02, 0.085, 0.09, 0.01, 0.07, 0.06]} constraints = pd.DataFrame(constraints)`
The constraints look like the following image:
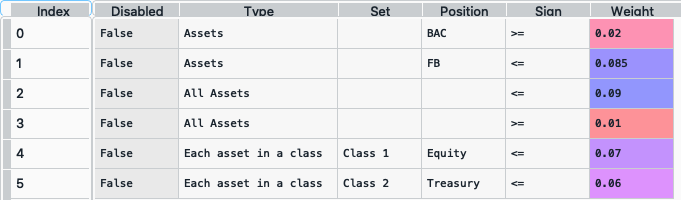
It is easier to construct the constraints in excel and then upload to a dataframe.
To create the pd.Series w\_max and w\_min we use the following command:
`w_max, w_min = rp.hrp_constraints(constraints, asset_classes)`
The pd.Series w\_max and w\_min looks like this (all constraints were merged to a single upper bound for each asset):
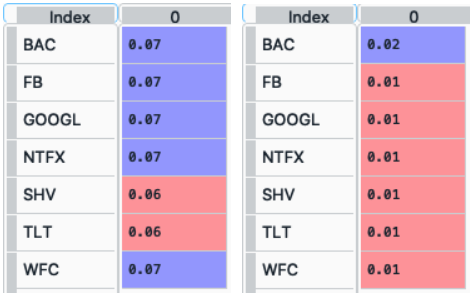
ConstraintsFunctions.risk\_constraint(_[asset\_classes](https://riskfolio-lib.readthedocs.io/en/latest/constraints.html#ConstraintsFunctions.risk_constraint.asset_classes "ConstraintsFunctions.risk_constraint.asset_classes (Python parameter) — Asset's classes DataFrame, where n_assets is the number of assets and n_cols is the number of columns of the DataFrame where the first column is the asset list and the next columns are the different asset's classes sets.")
_, _[kind](https://riskfolio-lib.readthedocs.io/en/latest/constraints.html#ConstraintsFunctions.risk_constraint.kind "ConstraintsFunctions.risk_constraint.kind (Python parameter) — Kind of risk contribution constraint vector.")
\=`'vanilla'`_, _[classes\_col](https://riskfolio-lib.readthedocs.io/en/latest/constraints.html#ConstraintsFunctions.risk_constraint.classes_col "ConstraintsFunctions.risk_constraint.classes_col (Python parameter) — If value is str, it is the column name of the set of classes from asset_classes dataframe.")
\=`None`_)[\[source\]](https://riskfolio-lib.readthedocs.io/en/latest/_modules/ConstraintsFunctions.html#risk_constraint)
[¶](https://riskfolio-lib.readthedocs.io/en/latest/constraints.html#ConstraintsFunctions.risk_constraint "Link to this definition")
Create the risk contribution constraint vector for the risk parity model.
Parameters:[¶](https://riskfolio-lib.readthedocs.io/en/latest/constraints.html#ConstraintsFunctions.risk_constraint-parameters "Permalink to this headline")
asset\_classes : DataFrame of shape (n\_assets, n\_cols)[¶](https://riskfolio-lib.readthedocs.io/en/latest/constraints.html#ConstraintsFunctions.risk_constraint.asset_classes "Permalink to this definition")
Asset’s classes DataFrame, where n\_assets is the number of assets and n\_cols is the number of columns of the DataFrame where the first column is the asset list and the next columns are the different asset’s classes sets. It is only used when kind value is ‘classes’. The default value is None.
kind : [str](https://docs.python.org/3.11/library/stdtypes.html#str "(in Python v3.11)")
[¶](https://riskfolio-lib.readthedocs.io/en/latest/constraints.html#ConstraintsFunctions.risk_constraint.kind "Permalink to this definition")
Kind of risk contribution constraint vector. The default value is ‘vanilla’. Possible values are:
* ’vanilla’: vector of equal risk contribution per asset.
* ’classes’: vector of equal risk contribution per class.
classes\_col : [str](https://docs.python.org/3.11/library/stdtypes.html#str "(in Python v3.11)")
or [int](https://docs.python.org/3.11/library/functions.html#int "(in Python v3.11)")
[¶](https://riskfolio-lib.readthedocs.io/en/latest/constraints.html#ConstraintsFunctions.risk_constraint.classes_col "Permalink to this definition")
If value is str, it is the column name of the set of classes from asset\_classes dataframe. If value is int, it is the column number of the set of classes from asset\_classes dataframe. The default value is None.
Returns:[¶](https://riskfolio-lib.readthedocs.io/en/latest/constraints.html#ConstraintsFunctions.risk_constraint-returns "Permalink to this headline")
**rb** – The risk contribution constraint vector.
Return type:[¶](https://riskfolio-lib.readthedocs.io/en/latest/constraints.html#ConstraintsFunctions.risk_constraint-return-type "Permalink to this headline")
nd-array
Raises:[¶](https://riskfolio-lib.readthedocs.io/en/latest/constraints.html#ConstraintsFunctions.risk_constraint-raises "Permalink to this headline")
**ValueError when the value cannot be calculated.** –
Examples
`asset_classes = {'Assets': ['FB', 'GOOGL', 'NTFX', 'BAC', 'WFC', 'TLT', 'SHV'], 'Class 1': ['Equity', 'Equity', 'Equity', 'Equity', 'Equity', 'Fixed Income', 'Fixed Income'], 'Class 2': ['Technology', 'Technology', 'Technology', 'Financial', 'Financial', 'Treasury', 'Treasury'],} asset_classes = pd.DataFrame(asset_classes) asset_classes = asset_classes.sort_values(by=['Assets']) asset_classes.reset_index(inplace=True, drop=True) rb = rp.risk_constraint(asset_classes kind='classes', classes_col='Class 1')`
ConstraintsFunctions.connection\_matrix(_[returns](https://riskfolio-lib.readthedocs.io/en/latest/constraints.html#ConstraintsFunctions.connection_matrix.returns "ConstraintsFunctions.connection_matrix.returns (Python parameter) — Assets returns DataFrame, where n_samples is the number of observations and n_assets is the number of assets.")
_, _[custom\_cov](https://riskfolio-lib.readthedocs.io/en/latest/constraints.html#ConstraintsFunctions.connection_matrix.custom_cov "ConstraintsFunctions.connection_matrix.custom_cov (Python parameter) — Custom covariance matrix, used when codependence parameter has value 'custom_cov'.")
\=`None`_, _[codependence](https://riskfolio-lib.readthedocs.io/en/latest/constraints.html#ConstraintsFunctions.connection_matrix.codependence "ConstraintsFunctions.connection_matrix.codependence (Python parameter) — The codependence or similarity matrix used to build the distance metric and clusters.")
\=`'pearson'`_, _[graph](https://riskfolio-lib.readthedocs.io/en/latest/constraints.html#ConstraintsFunctions.connection_matrix.graph "ConstraintsFunctions.connection_matrix.graph (Python parameter) — Graph used to build the adjacency matrix.")
\=`'MST'`_, _[walk\_size](https://riskfolio-lib.readthedocs.io/en/latest/constraints.html#ConstraintsFunctions.connection_matrix.walk_size "ConstraintsFunctions.connection_matrix.walk_size (Python parameter) — Size of the walk represented by the adjacency matrix.")
\=`1`_, _[bins\_info](https://riskfolio-lib.readthedocs.io/en/latest/constraints.html#ConstraintsFunctions.connection_matrix.bins_info "ConstraintsFunctions.connection_matrix.bins_info (Python parameter) — Number of bins used to calculate variation of information.")
\=`'KN'`_, _[alpha\_tail](https://riskfolio-lib.readthedocs.io/en/latest/constraints.html#ConstraintsFunctions.connection_matrix.alpha_tail "ConstraintsFunctions.connection_matrix.alpha_tail (Python parameter) — Significance level for lower tail dependence index.")
\=`0.05`_, _[gs\_threshold](https://riskfolio-lib.readthedocs.io/en/latest/constraints.html#ConstraintsFunctions.connection_matrix.gs_threshold "ConstraintsFunctions.connection_matrix.gs_threshold (Python parameter) — Gerber statistic threshold.")
\=`0.5`_)[\[source\]](https://riskfolio-lib.readthedocs.io/en/latest/_modules/ConstraintsFunctions.html#connection_matrix)
[¶](https://riskfolio-lib.readthedocs.io/en/latest/constraints.html#ConstraintsFunctions.connection_matrix "Link to this definition")
Create a connection matrix of walks of a specific size based on \[[E2](https://riskfolio-lib.readthedocs.io/en/latest/constraints.html#id115 "Dany Cajas. A graph theory approach to portfolio optimization. SSRN Electronic Journal, 10 2023. doi:10.2139/ssrn.4602019.")\
\] formula.
Parameters:[¶](https://riskfolio-lib.readthedocs.io/en/latest/constraints.html#ConstraintsFunctions.connection_matrix-parameters "Permalink to this headline")
returns : DataFrame of shape (n\_samples, n\_assets)[¶](https://riskfolio-lib.readthedocs.io/en/latest/constraints.html#ConstraintsFunctions.connection_matrix.returns "Permalink to this definition")
Assets returns DataFrame, where n\_samples is the number of observations and n\_assets is the number of assets.
custom\_cov : DataFrame or None, optional[¶](https://riskfolio-lib.readthedocs.io/en/latest/constraints.html#ConstraintsFunctions.connection_matrix.custom_cov "Permalink to this definition")
Custom covariance matrix, used when codependence parameter has value ‘custom\_cov’. The default is None.
codependence : [str](https://docs.python.org/3.11/library/stdtypes.html#str "(in Python v3.11)")
, can be {'pearson', 'spearman', 'abs\_pearson', 'abs\_spearman', 'distance', 'mutual\_info', 'tail' or 'custom\_cov'}[¶](https://riskfolio-lib.readthedocs.io/en/latest/constraints.html#ConstraintsFunctions.connection_matrix.codependence "Permalink to this definition")
The codependence or similarity matrix used to build the distance metric and clusters. The default is ‘pearson’. Possible values are:
* ’pearson’: pearson correlation matrix. Distance formula: Di,j\=0.5(1−ρi,jpearson).
* ’spearman’: spearman correlation matrix. Distance formula: Di,j\=0.5(1−ρi,jspearman).
* ’kendall’: kendall correlation matrix. Distance formula: Di,j\=0.5(1−ρi,jkendall).
* ’gerber1’: Gerber statistic 1 correlation matrix. Distance formula: Di,j\=0.5(1−ρi,jgerber1).
* ’gerber2’: Gerber statistic 2 correlation matrix. Distance formula: Di,j\=0.5(1−ρi,jgerber2).
* ’abs\_pearson’: absolute value pearson correlation matrix. Distance formula: Di,j\=(1−|ρi,j|).
* ’abs\_spearman’: absolute value spearman correlation matrix. Distance formula: Di,j\=(1−|ρi,j|).
* ’abs\_kendall’: absolute value kendall correlation matrix. Distance formula: Di,j\=(1−|ρi,jkendall|).
* ’distance’: distance correlation matrix. Distance formula Di,j\=(1−ρi,jdistance).
* ’mutual\_info’: mutual information matrix. Distance used is variation information matrix.
* ’tail’: lower tail dependence index matrix. Dissimilarity formula Di,j\=−logλi,j.
* ’custom\_cov’: use custom correlation matrix based on the custom\_cov parameter. Distance formula: Di,j\=0.5(1−ρi,jpearson).
graph : string, optional[¶](https://riskfolio-lib.readthedocs.io/en/latest/constraints.html#ConstraintsFunctions.connection_matrix.graph "Permalink to this definition")
Graph used to build the adjacency matrix. The default is ‘MST’. Possible values are:
* ’MST’: Minimum Spanning Tree.
* ’TMFG’: Plannar Maximally Filtered Graph.
walk\_size : [int](https://docs.python.org/3.11/library/functions.html#int "(in Python v3.11)")
, optional[¶](https://riskfolio-lib.readthedocs.io/en/latest/constraints.html#ConstraintsFunctions.connection_matrix.walk_size "Permalink to this definition")
Size of the walk represented by the adjacency matrix. The default is 1.
bins\_info : [int](https://docs.python.org/3.11/library/functions.html#int "(in Python v3.11)")
or [str](https://docs.python.org/3.11/library/stdtypes.html#str "(in Python v3.11)")
[¶](https://riskfolio-lib.readthedocs.io/en/latest/constraints.html#ConstraintsFunctions.connection_matrix.bins_info "Permalink to this definition")
Number of bins used to calculate variation of information. The default value is ‘KN’. Possible values are:
* ’KN’: Knuth’s choice method. See more in [knuth\_bin\_width](https://docs.astropy.org/en/stable/api/astropy.stats.knuth_bin_width.html)
.
* ’FD’: Freedman–Diaconis’ choice method. See more in [freedman\_bin\_width](https://docs.astropy.org/en/stable/api/astropy.stats.freedman_bin_width.html)
.
* ’SC’: Scotts’ choice method. See more in [scott\_bin\_width](https://docs.astropy.org/en/stable/api/astropy.stats.scott_bin_width.html)
.
* ’HGR’: Hacine-Gharbi and Ravier’ choice method.
* int: integer value choice by user.
alpha\_tail : [float](https://docs.python.org/3.11/library/functions.html#float "(in Python v3.11)")
, optional[¶](https://riskfolio-lib.readthedocs.io/en/latest/constraints.html#ConstraintsFunctions.connection_matrix.alpha_tail "Permalink to this definition")
Significance level for lower tail dependence index. The default is 0.05.
gs\_threshold : [float](https://docs.python.org/3.11/library/functions.html#float "(in Python v3.11)")
, optional[¶](https://riskfolio-lib.readthedocs.io/en/latest/constraints.html#ConstraintsFunctions.connection_matrix.gs_threshold "Permalink to this definition")
Gerber statistic threshold. The default is 0.5.
Returns:[¶](https://riskfolio-lib.readthedocs.io/en/latest/constraints.html#ConstraintsFunctions.connection_matrix-returns "Permalink to this headline")
**A\_p** – Adjacency matrix of walks of size lower and equal than ‘walk\_size’.
Return type:[¶](https://riskfolio-lib.readthedocs.io/en/latest/constraints.html#ConstraintsFunctions.connection_matrix-return-type "Permalink to this headline")
DataFrame
Raises:[¶](https://riskfolio-lib.readthedocs.io/en/latest/constraints.html#ConstraintsFunctions.connection_matrix-raises "Permalink to this headline")
**ValueError when the value cannot be calculated.** –
Examples
`A_p = rp.connection_matrix(returns, codependence="pearson", graph="MST", walk_size=1)`
The connection matrix dataframe looks like the following image:
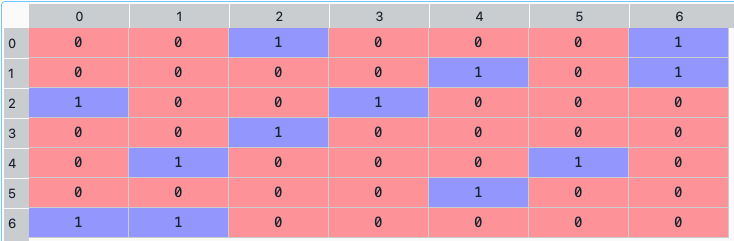
ConstraintsFunctions.centrality\_vector(_[returns](https://riskfolio-lib.readthedocs.io/en/latest/constraints.html#ConstraintsFunctions.centrality_vector.returns "ConstraintsFunctions.centrality_vector.returns (Python parameter) — Assets returns DataFrame, where n_samples is the number of observations and n_assets is the number of assets.")
_, _[measure](https://riskfolio-lib.readthedocs.io/en/latest/constraints.html#ConstraintsFunctions.centrality_vector.measure "ConstraintsFunctions.centrality_vector.measure (Python parameter) — Centrality measure.")
\=`'Degree'`_, _[custom\_cov](https://riskfolio-lib.readthedocs.io/en/latest/constraints.html#ConstraintsFunctions.centrality_vector.custom_cov "ConstraintsFunctions.centrality_vector.custom_cov (Python parameter) — Custom covariance matrix, used when codependence parameter has value 'custom_cov'.")
\=`None`_, _[codependence](https://riskfolio-lib.readthedocs.io/en/latest/constraints.html#ConstraintsFunctions.centrality_vector.codependence "ConstraintsFunctions.centrality_vector.codependence (Python parameter) — The codependence or similarity matrix used to build the distance metric and clusters.")
\=`'pearson'`_, _[graph](https://riskfolio-lib.readthedocs.io/en/latest/constraints.html#ConstraintsFunctions.centrality_vector.graph "ConstraintsFunctions.centrality_vector.graph (Python parameter) — Graph used to build the adjacency matrix.")
\=`'MST'`_, _[bins\_info](https://riskfolio-lib.readthedocs.io/en/latest/constraints.html#ConstraintsFunctions.centrality_vector.bins_info "ConstraintsFunctions.centrality_vector.bins_info (Python parameter) — Number of bins used to calculate variation of information.")
\=`'KN'`_, _[alpha\_tail](https://riskfolio-lib.readthedocs.io/en/latest/constraints.html#ConstraintsFunctions.centrality_vector.alpha_tail "ConstraintsFunctions.centrality_vector.alpha_tail (Python parameter) — Significance level for lower tail dependence index.")
\=`0.05`_, _[gs\_threshold](https://riskfolio-lib.readthedocs.io/en/latest/constraints.html#ConstraintsFunctions.centrality_vector.gs_threshold "ConstraintsFunctions.centrality_vector.gs_threshold (Python parameter) — Gerber statistic threshold.")
\=`0.5`_)[\[source\]](https://riskfolio-lib.readthedocs.io/en/latest/_modules/ConstraintsFunctions.html#centrality_vector)
[¶](https://riskfolio-lib.readthedocs.io/en/latest/constraints.html#ConstraintsFunctions.centrality_vector "Link to this definition")
Create a centrality vector from the adjacency matrix of an asset network based on \[[E2](https://riskfolio-lib.readthedocs.io/en/latest/constraints.html#id115 "Dany Cajas. A graph theory approach to portfolio optimization. SSRN Electronic Journal, 10 2023. doi:10.2139/ssrn.4602019.")\
\] formula.
Parameters:[¶](https://riskfolio-lib.readthedocs.io/en/latest/constraints.html#ConstraintsFunctions.centrality_vector-parameters "Permalink to this headline")
returns : DataFrame of shape (n\_samples, n\_assets)[¶](https://riskfolio-lib.readthedocs.io/en/latest/constraints.html#ConstraintsFunctions.centrality_vector.returns "Permalink to this definition")
Assets returns DataFrame, where n\_samples is the number of observations and n\_assets is the number of assets.
measure : [str](https://docs.python.org/3.11/library/stdtypes.html#str "(in Python v3.11)")
, optional[¶](https://riskfolio-lib.readthedocs.io/en/latest/constraints.html#ConstraintsFunctions.centrality_vector.measure "Permalink to this definition")
Centrality measure. The default is ‘Degree’. Possible values are:
* ’Degre’: Node’s degree centrality. Number of edges connected to a node.
* ’Eigenvector’: Eigenvector centrality. See more in [eigenvector\_centrality\_numpy](https://networkx.org/documentation/stable/reference/algorithms/generated/networkx.algorithms.centrality.eigenvector_centrality_numpy.html#eigenvector-centrality-numpy)
.
* ’Katz’: Katz centrality. See more in [katz\_centrality\_numpy](https://networkx.org/documentation/stable/reference/algorithms/generated/networkx.algorithms.centrality.katz_centrality_numpy.html#katz-centrality-numpy)
.
* ’Closeness’: Closeness centrality. See more in [closeness\_centrality](https://networkx.org/documentation/stable/reference/algorithms/generated/networkx.algorithms.centrality.closeness_centrality.html#closeness-centrality)
.
* ’Betweeness’: Betweeness centrality. See more in [betweenness\_centrality](https://networkx.org/documentation/stable/reference/algorithms/generated/networkx.algorithms.centrality.betweenness_centrality.html#betweenness-centrality)
.
* ’Communicability’: Communicability betweeness centrality. See more in [communicability\_betweenness\_centrality](https://networkx.org/documentation/stable/reference/algorithms/generated/networkx.algorithms.centrality.communicability_betweenness_centrality.html#communicability-betweenness-centrality)
.
* ’Subgraph’: Subgraph centrality. See more in [subgraph\_centrality](https://networkx.org/documentation/stable/reference/algorithms/generated/networkx.algorithms.centrality.subgraph_centrality.html#subgraph-centrality)
.
* ’Laplacian’: Laplacian centrality. See more in [laplacian\_centrality](https://networkx.org/documentation/stable/reference/algorithms/generated/networkx.algorithms.centrality.laplacian_centrality.html#laplacian-centrality)
.
custom\_cov : DataFrame or None, optional[¶](https://riskfolio-lib.readthedocs.io/en/latest/constraints.html#ConstraintsFunctions.centrality_vector.custom_cov "Permalink to this definition")
Custom covariance matrix, used when codependence parameter has value ‘custom\_cov’. The default is None.
codependence : [str](https://docs.python.org/3.11/library/stdtypes.html#str "(in Python v3.11)")
, can be {'pearson', 'spearman', 'abs\_pearson', 'abs\_spearman', 'distance', 'mutual\_info', 'tail' or 'custom\_cov'}[¶](https://riskfolio-lib.readthedocs.io/en/latest/constraints.html#ConstraintsFunctions.centrality_vector.codependence "Permalink to this definition")
The codependence or similarity matrix used to build the distance metric and clusters. The default is ‘pearson’. Possible values are:
* ’pearson’: pearson correlation matrix. Distance formula: Di,j\=0.5(1−ρi,jpearson).
* ’spearman’: spearman correlation matrix. Distance formula: Di,j\=0.5(1−ρi,jspearman).
* ’kendall’: kendall correlation matrix. Distance formula: Di,j\=0.5(1−ρi,jkendall).
* ’gerber1’: Gerber statistic 1 correlation matrix. Distance formula: Di,j\=0.5(1−ρi,jgerber1).
* ’gerber2’: Gerber statistic 2 correlation matrix. Distance formula: Di,j\=0.5(1−ρi,jgerber2).
* ’abs\_pearson’: absolute value pearson correlation matrix. Distance formula: Di,j\=(1−|ρi,j|).
* ’abs\_spearman’: absolute value spearman correlation matrix. Distance formula: Di,j\=(1−|ρi,j|).
* ’abs\_kendall’: absolute value kendall correlation matrix. Distance formula: Di,j\=(1−|ρi,jkendall|).
* ’distance’: distance correlation matrix. Distance formula Di,j\=(1−ρi,jdistance).
* ’mutual\_info’: mutual information matrix. Distance used is variation information matrix.
* ’tail’: lower tail dependence index matrix. Dissimilarity formula Di,j\=−logλi,j.
* ’custom\_cov’: use custom correlation matrix based on the custom\_cov parameter. Distance formula: Di,j\=0.5(1−ρi,jpearson).
graph : string, optional[¶](https://riskfolio-lib.readthedocs.io/en/latest/constraints.html#ConstraintsFunctions.centrality_vector.graph "Permalink to this definition")
Graph used to build the adjacency matrix. The default is ‘MST’. Possible values are:
* ’MST’: Minimum Spanning Tree.
* ’TMFG’: Plannar Maximally Filtered Graph.
bins\_info : [int](https://docs.python.org/3.11/library/functions.html#int "(in Python v3.11)")
or [str](https://docs.python.org/3.11/library/stdtypes.html#str "(in Python v3.11)")
[¶](https://riskfolio-lib.readthedocs.io/en/latest/constraints.html#ConstraintsFunctions.centrality_vector.bins_info "Permalink to this definition")
Number of bins used to calculate variation of information. The default value is ‘KN’. Possible values are:
* ’KN’: Knuth’s choice method. See more in [knuth\_bin\_width](https://docs.astropy.org/en/stable/api/astropy.stats.knuth_bin_width.html)
.
* ’FD’: Freedman–Diaconis’ choice method. See more in [freedman\_bin\_width](https://docs.astropy.org/en/stable/api/astropy.stats.freedman_bin_width.html)
.
* ’SC’: Scotts’ choice method. See more in [scott\_bin\_width](https://docs.astropy.org/en/stable/api/astropy.stats.scott_bin_width.html)
.
* ’HGR’: Hacine-Gharbi and Ravier’ choice method.
* int: integer value choice by user.
alpha\_tail : [float](https://docs.python.org/3.11/library/functions.html#float "(in Python v3.11)")
, optional[¶](https://riskfolio-lib.readthedocs.io/en/latest/constraints.html#ConstraintsFunctions.centrality_vector.alpha_tail "Permalink to this definition")
Significance level for lower tail dependence index. The default is 0.05.
gs\_threshold : [float](https://docs.python.org/3.11/library/functions.html#float "(in Python v3.11)")
, optional[¶](https://riskfolio-lib.readthedocs.io/en/latest/constraints.html#ConstraintsFunctions.centrality_vector.gs_threshold "Permalink to this definition")
Gerber statistic threshold. The default is 0.5.
Returns:[¶](https://riskfolio-lib.readthedocs.io/en/latest/constraints.html#ConstraintsFunctions.centrality_vector-returns "Permalink to this headline")
**A\_p** – Adjacency matrix of walks of size ‘walk\_size’.
Return type:[¶](https://riskfolio-lib.readthedocs.io/en/latest/constraints.html#ConstraintsFunctions.centrality_vector-return-type "Permalink to this headline")
DataFrame
Raises:[¶](https://riskfolio-lib.readthedocs.io/en/latest/constraints.html#ConstraintsFunctions.centrality_vector-raises "Permalink to this headline")
**ValueError when the value cannot be calculated.** –
Examples
`C_v = rp.centrality_vector(returns, measure='Degree', codependence="pearson", graph="MST")`
The neighborhood matrix looks like the following image:

ConstraintsFunctions.clusters\_matrix(_[returns](https://riskfolio-lib.readthedocs.io/en/latest/constraints.html#ConstraintsFunctions.clusters_matrix.returns "ConstraintsFunctions.clusters_matrix.returns (Python parameter) — Assets returns DataFrame, where n_samples is the number of observations and n_assets is the number of assets.")
_, _[custom\_cov](https://riskfolio-lib.readthedocs.io/en/latest/constraints.html#ConstraintsFunctions.clusters_matrix.custom_cov "ConstraintsFunctions.clusters_matrix.custom_cov (Python parameter) — Custom covariance matrix, used when codependence parameter has value 'custom_cov'.")
\=`None`_, _[codependence](https://riskfolio-lib.readthedocs.io/en/latest/constraints.html#ConstraintsFunctions.clusters_matrix.codependence "ConstraintsFunctions.clusters_matrix.codependence (Python parameter) — The codependence or similarity matrix used to build the distance metric and clusters.")
\=`'pearson'`_, _[linkage](https://riskfolio-lib.readthedocs.io/en/latest/constraints.html#ConstraintsFunctions.clusters_matrix.linkage "ConstraintsFunctions.clusters_matrix.linkage (Python parameter) — Duplicate explicit target name: "linkage".")
\=`'ward'`_, _[opt\_k\_method](https://riskfolio-lib.readthedocs.io/en/latest/constraints.html#ConstraintsFunctions.clusters_matrix.opt_k_method "ConstraintsFunctions.clusters_matrix.opt_k_method (Python parameter) — Method used to calculate the optimum number of clusters. The default is 'twodiff'.")
\=`'twodiff'`_, _[k](https://riskfolio-lib.readthedocs.io/en/latest/constraints.html#ConstraintsFunctions.clusters_matrix.k "ConstraintsFunctions.clusters_matrix.k (Python parameter) — Number of clusters.")
\=`None`_, _[max\_k](https://riskfolio-lib.readthedocs.io/en/latest/constraints.html#ConstraintsFunctions.clusters_matrix.max_k "ConstraintsFunctions.clusters_matrix.max_k (Python parameter) — Max number of clusters used by the two difference gap statistic to find the optimal number of clusters.")
\=`10`_, _[bins\_info](https://riskfolio-lib.readthedocs.io/en/latest/constraints.html#ConstraintsFunctions.clusters_matrix.bins_info "ConstraintsFunctions.clusters_matrix.bins_info (Python parameter) — Number of bins used to calculate variation of information.")
\=`'KN'`_, _[alpha\_tail](https://riskfolio-lib.readthedocs.io/en/latest/constraints.html#ConstraintsFunctions.clusters_matrix.alpha_tail "ConstraintsFunctions.clusters_matrix.alpha_tail (Python parameter) — Significance level for lower tail dependence index.")
\=`0.05`_, _[gs\_threshold](https://riskfolio-lib.readthedocs.io/en/latest/constraints.html#ConstraintsFunctions.clusters_matrix.gs_threshold "ConstraintsFunctions.clusters_matrix.gs_threshold (Python parameter) — Gerber statistic threshold.")
\=`0.5`_, _[leaf\_order](https://riskfolio-lib.readthedocs.io/en/latest/constraints.html#ConstraintsFunctions.clusters_matrix.leaf_order "ConstraintsFunctions.clusters_matrix.leaf_order (Python parameter) — Indicates if the cluster are ordered so that the distance between successive leaves is minimal.")
\=`True`_)[\[source\]](https://riskfolio-lib.readthedocs.io/en/latest/_modules/ConstraintsFunctions.html#clusters_matrix)
[¶](https://riskfolio-lib.readthedocs.io/en/latest/constraints.html#ConstraintsFunctions.clusters_matrix "Link to this definition")
Creates an adjacency matrix that represents the clusters from the hierarchical clustering process based on \[[E3](https://riskfolio-lib.readthedocs.io/en/latest/constraints.html#id116 "Dany Cajas. A graph theory approach to portfolio optimization part ii. SSRN Electronic Journal, 12 2023. doi:10.2139/ssrn.4540021.")\
\] formula.
Parameters:[¶](https://riskfolio-lib.readthedocs.io/en/latest/constraints.html#ConstraintsFunctions.clusters_matrix-parameters "Permalink to this headline")
returns : DataFrame of shape (n\_samples, n\_assets)[¶](https://riskfolio-lib.readthedocs.io/en/latest/constraints.html#ConstraintsFunctions.clusters_matrix.returns "Permalink to this definition")
Assets returns DataFrame, where n\_samples is the number of observations and n\_assets is the number of assets.
custom\_cov : DataFrame or None, optional[¶](https://riskfolio-lib.readthedocs.io/en/latest/constraints.html#ConstraintsFunctions.clusters_matrix.custom_cov "Permalink to this definition")
Custom covariance matrix, used when codependence parameter has value ‘custom\_cov’. The default is None.
codependence : [str](https://docs.python.org/3.11/library/stdtypes.html#str "(in Python v3.11)")
, can be {'pearson', 'spearman', 'abs\_pearson', 'abs\_spearman', 'distance', 'mutual\_info', 'tail' or 'custom\_cov'}[¶](https://riskfolio-lib.readthedocs.io/en/latest/constraints.html#ConstraintsFunctions.clusters_matrix.codependence "Permalink to this definition")
The codependence or similarity matrix used to build the distance metric and clusters. The default is ‘pearson’. Possible values are:
* ’pearson’: pearson correlation matrix. Distance formula: Di,j\=0.5(1−ρi,jpearson).
* ’spearman’: spearman correlation matrix. Distance formula: Di,j\=0.5(1−ρi,jspearman).
* ’kendall’: kendall correlation matrix. Distance formula: Di,j\=0.5(1−ρi,jkendall).
* ’gerber1’: Gerber statistic 1 correlation matrix. Distance formula: Di,j\=0.5(1−ρi,jgerber1).
* ’gerber2’: Gerber statistic 2 correlation matrix. Distance formula: Di,j\=0.5(1−ρi,jgerber2).
* ’abs\_pearson’: absolute value pearson correlation matrix. Distance formula: Di,j\=(1−|ρi,j|).
* ’abs\_spearman’: absolute value spearman correlation matrix. Distance formula: Di,j\=(1−|ρi,j|).
* ’abs\_kendall’: absolute value kendall correlation matrix. Distance formula: Di,j\=(1−|ρi,jkendall|).
* ’distance’: distance correlation matrix. Distance formula Di,j\=(1−ρi,jdistance).
* ’mutual\_info’: mutual information matrix. Distance used is variation information matrix.
* ’tail’: lower tail dependence index matrix. Dissimilarity formula Di,j\=−logλi,j.
* ’custom\_cov’: use custom correlation matrix based on the custom\_cov parameter. Distance formula: Di,j\=0.5(1−ρi,jpearson).
linkage : string, optional[¶](https://riskfolio-lib.readthedocs.io/en/latest/constraints.html#ConstraintsFunctions.clusters_matrix.linkage "Permalink to this definition")
Linkage method of hierarchical clustering, see [linkage](https://docs.scipy.org/doc/scipy/reference/generated/scipy.cluster.hierarchy.linkage.html?highlight=linkage#scipy.cluster.hierarchy.linkage)
for more details. The default is ‘ward’. Possible values are:
* ’single’.
* ’complete’.
* ’average’.
* ’weighted’.
* ’centroid’.
* ’median’.
* ’ward’.
* ’DBHT’. Direct Bubble Hierarchical Tree.
opt\_k\_method : [str](https://docs.python.org/3.11/library/stdtypes.html#str "(in Python v3.11)")
[¶](https://riskfolio-lib.readthedocs.io/en/latest/constraints.html#ConstraintsFunctions.clusters_matrix.opt_k_method "Permalink to this definition")
Method used to calculate the optimum number of clusters. The default is ‘twodiff’. Possible values are:
* ’twodiff’: two difference gap statistic.
* ’stdsil’: standarized silhouette score.
k : [int](https://docs.python.org/3.11/library/functions.html#int "(in Python v3.11)")
, optional[¶](https://riskfolio-lib.readthedocs.io/en/latest/constraints.html#ConstraintsFunctions.clusters_matrix.k "Permalink to this definition")
Number of clusters. This value is took instead of the optimal number of clusters calculated with the two difference gap statistic. The default is None.
max\_k : [int](https://docs.python.org/3.11/library/functions.html#int "(in Python v3.11)")
, optional[¶](https://riskfolio-lib.readthedocs.io/en/latest/constraints.html#ConstraintsFunctions.clusters_matrix.max_k "Permalink to this definition")
Max number of clusters used by the two difference gap statistic to find the optimal number of clusters. The default is 10.
bins\_info : [int](https://docs.python.org/3.11/library/functions.html#int "(in Python v3.11)")
or [str](https://docs.python.org/3.11/library/stdtypes.html#str "(in Python v3.11)")
[¶](https://riskfolio-lib.readthedocs.io/en/latest/constraints.html#ConstraintsFunctions.clusters_matrix.bins_info "Permalink to this definition")
Number of bins used to calculate variation of information. The default value is ‘KN’. Possible values are:
* ’KN’: Knuth’s choice method. See more in [knuth\_bin\_width](https://docs.astropy.org/en/stable/api/astropy.stats.knuth_bin_width.html)
.
* ’FD’: Freedman–Diaconis’ choice method. See more in [freedman\_bin\_width](https://docs.astropy.org/en/stable/api/astropy.stats.freedman_bin_width.html)
.
* ’SC’: Scotts’ choice method. See more in [scott\_bin\_width](https://docs.astropy.org/en/stable/api/astropy.stats.scott_bin_width.html)
.
* ’HGR’: Hacine-Gharbi and Ravier’ choice method.
* int: integer value choice by user.
alpha\_tail : [float](https://docs.python.org/3.11/library/functions.html#float "(in Python v3.11)")
, optional[¶](https://riskfolio-lib.readthedocs.io/en/latest/constraints.html#ConstraintsFunctions.clusters_matrix.alpha_tail "Permalink to this definition")
Significance level for lower tail dependence index. The default is 0.05.
gs\_threshold : [float](https://docs.python.org/3.11/library/functions.html#float "(in Python v3.11)")
, optional[¶](https://riskfolio-lib.readthedocs.io/en/latest/constraints.html#ConstraintsFunctions.clusters_matrix.gs_threshold "Permalink to this definition")
Gerber statistic threshold. The default is 0.5.
leaf\_order : [bool](https://docs.python.org/3.11/library/functions.html#bool "(in Python v3.11)")
, optional[¶](https://riskfolio-lib.readthedocs.io/en/latest/constraints.html#ConstraintsFunctions.clusters_matrix.leaf_order "Permalink to this definition")
Indicates if the cluster are ordered so that the distance between successive leaves is minimal. The default is True.
Returns:[¶](https://riskfolio-lib.readthedocs.io/en/latest/constraints.html#ConstraintsFunctions.clusters_matrix-returns "Permalink to this headline")
**A\_c** – Adjacency matrix of clusters.
Return type:[¶](https://riskfolio-lib.readthedocs.io/en/latest/constraints.html#ConstraintsFunctions.clusters_matrix-return-type "Permalink to this headline")
ndarray
Raises:[¶](https://riskfolio-lib.readthedocs.io/en/latest/constraints.html#ConstraintsFunctions.clusters_matrix-raises "Permalink to this headline")
**ValueError when the value cannot be calculated.** –
Examples
`C_M = rp.clusters_matrix(returns, codependence='pearson', linkage='ward', k=None, max_k=10)`
The clusters matrix looks like the following image:
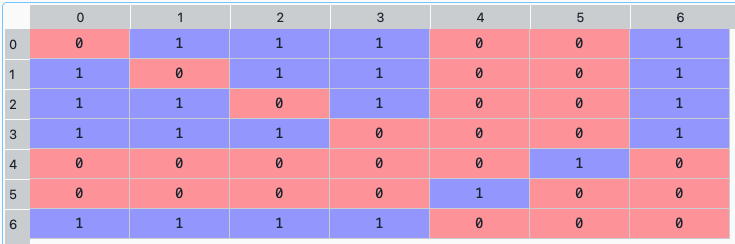
ConstraintsFunctions.average\_centrality(_[returns](https://riskfolio-lib.readthedocs.io/en/latest/constraints.html#ConstraintsFunctions.average_centrality.returns "ConstraintsFunctions.average_centrality.returns (Python parameter) — Assets returns DataFrame, where n_samples is the number of observations and n_assets is the number of assets.")
_, _[w](https://riskfolio-lib.readthedocs.io/en/latest/constraints.html#ConstraintsFunctions.average_centrality.w "ConstraintsFunctions.average_centrality.w (Python parameter) — Portfolio weights, where n_assets is the number of assets.")
_, _[measure](https://riskfolio-lib.readthedocs.io/en/latest/constraints.html#ConstraintsFunctions.average_centrality.measure "ConstraintsFunctions.average_centrality.measure (Python parameter) — Centrality measure.")
\=`'Degree'`_, _[custom\_cov](https://riskfolio-lib.readthedocs.io/en/latest/constraints.html#ConstraintsFunctions.average_centrality.custom_cov "ConstraintsFunctions.average_centrality.custom_cov (Python parameter) — Custom covariance matrix, used when codependence parameter has value 'custom_cov'.")
\=`None`_, _[codependence](https://riskfolio-lib.readthedocs.io/en/latest/constraints.html#ConstraintsFunctions.average_centrality.codependence "ConstraintsFunctions.average_centrality.codependence (Python parameter) — The codependence or similarity matrix used to build the distance metric and clusters.")
\=`'pearson'`_, _[graph](https://riskfolio-lib.readthedocs.io/en/latest/constraints.html#ConstraintsFunctions.average_centrality.graph "ConstraintsFunctions.average_centrality.graph (Python parameter) — Graph used to build the adjacency matrix.")
\=`'MST'`_, _[bins\_info](https://riskfolio-lib.readthedocs.io/en/latest/constraints.html#ConstraintsFunctions.average_centrality.bins_info "ConstraintsFunctions.average_centrality.bins_info (Python parameter) — Number of bins used to calculate variation of information.")
\=`'KN'`_, _[alpha\_tail](https://riskfolio-lib.readthedocs.io/en/latest/constraints.html#ConstraintsFunctions.average_centrality.alpha_tail "ConstraintsFunctions.average_centrality.alpha_tail (Python parameter) — Significance level for lower tail dependence index.")
\=`0.05`_, _[gs\_threshold](https://riskfolio-lib.readthedocs.io/en/latest/constraints.html#ConstraintsFunctions.average_centrality.gs_threshold "ConstraintsFunctions.average_centrality.gs_threshold (Python parameter) — Gerber statistic threshold.")
\=`0.5`_)[\[source\]](https://riskfolio-lib.readthedocs.io/en/latest/_modules/ConstraintsFunctions.html#average_centrality)
[¶](https://riskfolio-lib.readthedocs.io/en/latest/constraints.html#ConstraintsFunctions.average_centrality "Link to this definition")
Calculates the average centrality of assets of the portfolio based on \[[E2](https://riskfolio-lib.readthedocs.io/en/latest/constraints.html#id115 "Dany Cajas. A graph theory approach to portfolio optimization. SSRN Electronic Journal, 10 2023. doi:10.2139/ssrn.4602019.")\
\] formula.
Parameters:[¶](https://riskfolio-lib.readthedocs.io/en/latest/constraints.html#ConstraintsFunctions.average_centrality-parameters "Permalink to this headline")
returns : DataFrame of shape (n\_samples, n\_assets)[¶](https://riskfolio-lib.readthedocs.io/en/latest/constraints.html#ConstraintsFunctions.average_centrality.returns "Permalink to this definition")
Assets returns DataFrame, where n\_samples is the number of observations and n\_assets is the number of assets.
w : DataFrame or Series of shape (n\_assets, 1)[¶](https://riskfolio-lib.readthedocs.io/en/latest/constraints.html#ConstraintsFunctions.average_centrality.w "Permalink to this definition")
Portfolio weights, where n\_assets is the number of assets.
measure : [str](https://docs.python.org/3.11/library/stdtypes.html#str "(in Python v3.11)")
, optional[¶](https://riskfolio-lib.readthedocs.io/en/latest/constraints.html#ConstraintsFunctions.average_centrality.measure "Permalink to this definition")
Centrality measure. The default is ‘Degree’. Possible values are:
* ’Degre’: Node’s degree centrality. Number of edges connected to a node.
* ’Eigenvector’: Eigenvector centrality. See more in [eigenvector\_centrality\_numpy](https://networkx.org/documentation/stable/reference/algorithms/generated/networkx.algorithms.centrality.eigenvector_centrality_numpy.html#eigenvector-centrality-numpy)
.
* ’Katz’: Katz centrality. See more in [katz\_centrality\_numpy](https://networkx.org/documentation/stable/reference/algorithms/generated/networkx.algorithms.centrality.katz_centrality_numpy.html#katz-centrality-numpy)
.
* ’Closeness’: Closeness centrality. See more in [closeness\_centrality](https://networkx.org/documentation/stable/reference/algorithms/generated/networkx.algorithms.centrality.closeness_centrality.html#closeness-centrality)
.
* ’Betweeness’: Betweeness centrality. See more in [betweenness\_centrality](https://networkx.org/documentation/stable/reference/algorithms/generated/networkx.algorithms.centrality.betweenness_centrality.html#betweenness-centrality)
.
* ’Communicability’: Communicability betweeness centrality. See more in [communicability\_betweenness\_centrality](https://networkx.org/documentation/stable/reference/algorithms/generated/networkx.algorithms.centrality.communicability_betweenness_centrality.html#communicability-betweenness-centrality)
.
* ’Subgraph’: Subgraph centrality. See more in [subgraph\_centrality](https://networkx.org/documentation/stable/reference/algorithms/generated/networkx.algorithms.centrality.subgraph_centrality.html#subgraph-centrality)
.
* ’Laplacian’: Laplacian centrality. See more in [laplacian\_centrality](https://networkx.org/documentation/stable/reference/algorithms/generated/networkx.algorithms.centrality.laplacian_centrality.html#laplacian-centrality)
.
custom\_cov : DataFrame or None, optional[¶](https://riskfolio-lib.readthedocs.io/en/latest/constraints.html#ConstraintsFunctions.average_centrality.custom_cov "Permalink to this definition")
Custom covariance matrix, used when codependence parameter has value ‘custom\_cov’. The default is None.
codependence : [str](https://docs.python.org/3.11/library/stdtypes.html#str "(in Python v3.11)")
, optional[¶](https://riskfolio-lib.readthedocs.io/en/latest/constraints.html#ConstraintsFunctions.average_centrality.codependence "Permalink to this definition")
The codependence or similarity matrix used to build the distance metric and clusters. The default is ‘pearson’. Possible values are:
* ’pearson’: pearson correlation matrix. Distance formula: Di,j\=0.5(1−ρi,jpearson).
* ’spearman’: spearman correlation matrix. Distance formula: Di,j\=0.5(1−ρi,jspearman).
* ’kendall’: kendall correlation matrix. Distance formula: Di,j\=0.5(1−ρi,jkendall).
* ’gerber1’: Gerber statistic 1 correlation matrix. Distance formula: Di,j\=0.5(1−ρi,jgerber1).
* ’gerber2’: Gerber statistic 2 correlation matrix. Distance formula: Di,j\=0.5(1−ρi,jgerber2).
* ’abs\_pearson’: absolute value pearson correlation matrix. Distance formula: Di,j\=(1−|ρi,j|).
* ’abs\_spearman’: absolute value spearman correlation matrix. Distance formula: Di,j\=(1−|ρi,j|).
* ’abs\_kendall’: absolute value kendall correlation matrix. Distance formula: Di,j\=(1−|ρi,jkendall|).
* ’distance’: distance correlation matrix. Distance formula Di,j\=(1−ρi,jdistance).
* ’mutual\_info’: mutual information matrix. Distance used is variation information matrix.
* ’tail’: lower tail dependence index matrix. Dissimilarity formula Di,j\=−logλi,j.
* ’custom\_cov’: use custom correlation matrix based on the custom\_cov parameter. Distance formula: Di,j\=0.5(1−ρi,jpearson).
graph : string, optional[¶](https://riskfolio-lib.readthedocs.io/en/latest/constraints.html#ConstraintsFunctions.average_centrality.graph "Permalink to this definition")
Graph used to build the adjacency matrix. The default is ‘MST’. Possible values are:
* ’MST’: Minimum Spanning Tree.
* ’TMFG’: Plannar Maximally Filtered Graph.
bins\_info : [int](https://docs.python.org/3.11/library/functions.html#int "(in Python v3.11)")
or [str](https://docs.python.org/3.11/library/stdtypes.html#str "(in Python v3.11)")
[¶](https://riskfolio-lib.readthedocs.io/en/latest/constraints.html#ConstraintsFunctions.average_centrality.bins_info "Permalink to this definition")
Number of bins used to calculate variation of information. The default value is ‘KN’. Possible values are:
* ’KN’: Knuth’s choice method. See more in [knuth\_bin\_width](https://docs.astropy.org/en/stable/api/astropy.stats.knuth_bin_width.html)
.
* ’FD’: Freedman–Diaconis’ choice method. See more in [freedman\_bin\_width](https://docs.astropy.org/en/stable/api/astropy.stats.freedman_bin_width.html)
.
* ’SC’: Scotts’ choice method. See more in [scott\_bin\_width](https://docs.astropy.org/en/stable/api/astropy.stats.scott_bin_width.html)
.
* ’HGR’: Hacine-Gharbi and Ravier’ choice method.
* int: integer value choice by user.
alpha\_tail : [float](https://docs.python.org/3.11/library/functions.html#float "(in Python v3.11)")
, optional[¶](https://riskfolio-lib.readthedocs.io/en/latest/constraints.html#ConstraintsFunctions.average_centrality.alpha_tail "Permalink to this definition")
Significance level for lower tail dependence index. The default is 0.05.
gs\_threshold : [float](https://docs.python.org/3.11/library/functions.html#float "(in Python v3.11)")
, optional[¶](https://riskfolio-lib.readthedocs.io/en/latest/constraints.html#ConstraintsFunctions.average_centrality.gs_threshold "Permalink to this definition")
Gerber statistic threshold. The default is 0.5.
Returns:[¶](https://riskfolio-lib.readthedocs.io/en/latest/constraints.html#ConstraintsFunctions.average_centrality-returns "Permalink to this headline")
**AC** – Average centrality of assets.
Return type:[¶](https://riskfolio-lib.readthedocs.io/en/latest/constraints.html#ConstraintsFunctions.average_centrality-return-type "Permalink to this headline")
[float](https://docs.python.org/3.11/library/functions.html#float "(in Python v3.11)")
Raises:[¶](https://riskfolio-lib.readthedocs.io/en/latest/constraints.html#ConstraintsFunctions.average_centrality-raises "Permalink to this headline")
**ValueError when the value cannot be calculated.** –
Examples
`ac = rp.average_centrality(returns, w, measure="Degree" codependence="pearson", graph="MST")`
ConstraintsFunctions.connected\_assets(_[returns](https://riskfolio-lib.readthedocs.io/en/latest/constraints.html#ConstraintsFunctions.connected_assets.returns "ConstraintsFunctions.connected_assets.returns (Python parameter) — Assets returns DataFrame, where n_samples is the number of observations and n_assets is the number of assets.")
_, _[w](https://riskfolio-lib.readthedocs.io/en/latest/constraints.html#ConstraintsFunctions.connected_assets.w "ConstraintsFunctions.connected_assets.w (Python parameter) — Portfolio weights, where n_assets is the number of assets.")
_, _[custom\_cov](https://riskfolio-lib.readthedocs.io/en/latest/constraints.html#ConstraintsFunctions.connected_assets.custom_cov "ConstraintsFunctions.connected_assets.custom_cov (Python parameter) — Custom covariance matrix, used when codependence parameter has value 'custom_cov'.")
\=`None`_, _[codependence](https://riskfolio-lib.readthedocs.io/en/latest/constraints.html#ConstraintsFunctions.connected_assets.codependence "ConstraintsFunctions.connected_assets.codependence (Python parameter) — The codependence or similarity matrix used to build the distance metric and clusters.")
\=`'pearson'`_, _[graph](https://riskfolio-lib.readthedocs.io/en/latest/constraints.html#ConstraintsFunctions.connected_assets.graph "ConstraintsFunctions.connected_assets.graph (Python parameter) — Graph used to build the adjacency matrix.")
\=`'MST'`_, _[walk\_size](https://riskfolio-lib.readthedocs.io/en/latest/constraints.html#ConstraintsFunctions.connected_assets.walk_size "ConstraintsFunctions.connected_assets.walk_size (Python parameter) — Size of the walk represented by the adjacency matrix.")
\=`1`_, _[bins\_info](https://riskfolio-lib.readthedocs.io/en/latest/constraints.html#ConstraintsFunctions.connected_assets.bins_info "ConstraintsFunctions.connected_assets.bins_info (Python parameter) — Number of bins used to calculate variation of information.")
\=`'KN'`_, _[alpha\_tail](https://riskfolio-lib.readthedocs.io/en/latest/constraints.html#ConstraintsFunctions.connected_assets.alpha_tail "ConstraintsFunctions.connected_assets.alpha_tail (Python parameter) — Significance level for lower tail dependence index.")
\=`0.05`_, _[gs\_threshold](https://riskfolio-lib.readthedocs.io/en/latest/constraints.html#ConstraintsFunctions.connected_assets.gs_threshold "ConstraintsFunctions.connected_assets.gs_threshold (Python parameter) — Gerber statistic threshold.")
\=`0.5`_)[\[source\]](https://riskfolio-lib.readthedocs.io/en/latest/_modules/ConstraintsFunctions.html#connected_assets)
[¶](https://riskfolio-lib.readthedocs.io/en/latest/constraints.html#ConstraintsFunctions.connected_assets "Link to this definition")
Calculates the percentage invested in connected assets of the portfolio based on \[[E2](https://riskfolio-lib.readthedocs.io/en/latest/constraints.html#id115 "Dany Cajas. A graph theory approach to portfolio optimization. SSRN Electronic Journal, 10 2023. doi:10.2139/ssrn.4602019.")\
\] formula.
Parameters:[¶](https://riskfolio-lib.readthedocs.io/en/latest/constraints.html#ConstraintsFunctions.connected_assets-parameters "Permalink to this headline")
returns : DataFrame of shape (n\_samples, n\_assets)[¶](https://riskfolio-lib.readthedocs.io/en/latest/constraints.html#ConstraintsFunctions.connected_assets.returns "Permalink to this definition")
Assets returns DataFrame, where n\_samples is the number of observations and n\_assets is the number of assets.
w : DataFrame or Series of shape (n\_assets, 1)[¶](https://riskfolio-lib.readthedocs.io/en/latest/constraints.html#ConstraintsFunctions.connected_assets.w "Permalink to this definition")
Portfolio weights, where n\_assets is the number of assets.
custom\_cov : DataFrame or None, optional[¶](https://riskfolio-lib.readthedocs.io/en/latest/constraints.html#ConstraintsFunctions.connected_assets.custom_cov "Permalink to this definition")
Custom covariance matrix, used when codependence parameter has value ‘custom\_cov’. The default is None.
codependence : [str](https://docs.python.org/3.11/library/stdtypes.html#str "(in Python v3.11)")
, optional[¶](https://riskfolio-lib.readthedocs.io/en/latest/constraints.html#ConstraintsFunctions.connected_assets.codependence "Permalink to this definition")
The codependence or similarity matrix used to build the distance metric and clusters. The default is ‘pearson’. Possible values are:
* ’pearson’: pearson correlation matrix. Distance formula: Di,j\=0.5(1−ρi,jpearson).
* ’spearman’: spearman correlation matrix. Distance formula: Di,j\=0.5(1−ρi,jspearman).
* ’kendall’: kendall correlation matrix. Distance formula: Di,j\=0.5(1−ρi,jkendall).
* ’gerber1’: Gerber statistic 1 correlation matrix. Distance formula: Di,j\=0.5(1−ρi,jgerber1).
* ’gerber2’: Gerber statistic 2 correlation matrix. Distance formula: Di,j\=0.5(1−ρi,jgerber2).
* ’abs\_pearson’: absolute value pearson correlation matrix. Distance formula: Di,j\=(1−|ρi,j|).
* ’abs\_spearman’: absolute value spearman correlation matrix. Distance formula: Di,j\=(1−|ρi,j|).
* ’abs\_kendall’: absolute value kendall correlation matrix. Distance formula: Di,j\=(1−|ρi,jkendall|).
* ’distance’: distance correlation matrix. Distance formula Di,j\=(1−ρi,jdistance).
* ’mutual\_info’: mutual information matrix. Distance used is variation information matrix.
* ’tail’: lower tail dependence index matrix. Dissimilarity formula Di,j\=−logλi,j.
* ’custom\_cov’: use custom correlation matrix based on the custom\_cov parameter. Distance formula: Di,j\=0.5(1−ρi,jpearson).
graph : string, optional[¶](https://riskfolio-lib.readthedocs.io/en/latest/constraints.html#ConstraintsFunctions.connected_assets.graph "Permalink to this definition")
Graph used to build the adjacency matrix. The default is ‘MST’. Possible values are:
* ’MST’: Minimum Spanning Tree.
* ’TMFG’: Plannar Maximally Filtered Graph.
walk\_size : [int](https://docs.python.org/3.11/library/functions.html#int "(in Python v3.11)")
, optional[¶](https://riskfolio-lib.readthedocs.io/en/latest/constraints.html#ConstraintsFunctions.connected_assets.walk_size "Permalink to this definition")
Size of the walk represented by the adjacency matrix. The default is 1.
bins\_info : [int](https://docs.python.org/3.11/library/functions.html#int "(in Python v3.11)")
or [str](https://docs.python.org/3.11/library/stdtypes.html#str "(in Python v3.11)")
[¶](https://riskfolio-lib.readthedocs.io/en/latest/constraints.html#ConstraintsFunctions.connected_assets.bins_info "Permalink to this definition")
Number of bins used to calculate variation of information. The default value is ‘KN’. Possible values are:
* ’KN’: Knuth’s choice method. See more in [knuth\_bin\_width](https://docs.astropy.org/en/stable/api/astropy.stats.knuth_bin_width.html)
.
* ’FD’: Freedman–Diaconis’ choice method. See more in [freedman\_bin\_width](https://docs.astropy.org/en/stable/api/astropy.stats.freedman_bin_width.html)
.
* ’SC’: Scotts’ choice method. See more in [scott\_bin\_width](https://docs.astropy.org/en/stable/api/astropy.stats.scott_bin_width.html)
.
* ’HGR’: Hacine-Gharbi and Ravier’ choice method.
* int: integer value choice by user.
alpha\_tail : [float](https://docs.python.org/3.11/library/functions.html#float "(in Python v3.11)")
, optional[¶](https://riskfolio-lib.readthedocs.io/en/latest/constraints.html#ConstraintsFunctions.connected_assets.alpha_tail "Permalink to this definition")
Significance level for lower tail dependence index. The default is 0.05.
gs\_threshold : [float](https://docs.python.org/3.11/library/functions.html#float "(in Python v3.11)")
, optional[¶](https://riskfolio-lib.readthedocs.io/en/latest/constraints.html#ConstraintsFunctions.connected_assets.gs_threshold "Permalink to this definition")
Gerber statistic threshold. The default is 0.5.
Returns:[¶](https://riskfolio-lib.readthedocs.io/en/latest/constraints.html#ConstraintsFunctions.connected_assets-returns "Permalink to this headline")
**CA** – Percentage invested in connected assets.
Return type:[¶](https://riskfolio-lib.readthedocs.io/en/latest/constraints.html#ConstraintsFunctions.connected_assets-return-type "Permalink to this headline")
[float](https://docs.python.org/3.11/library/functions.html#float "(in Python v3.11)")
Raises:[¶](https://riskfolio-lib.readthedocs.io/en/latest/constraints.html#ConstraintsFunctions.connected_assets-raises "Permalink to this headline")
**ValueError when the value cannot be calculated.** –
Examples
`ca = rp.connected_assets(returns, w, codependence="pearson", graph="MST", walk_size=1)`
ConstraintsFunctions.related\_assets(_[returns](https://riskfolio-lib.readthedocs.io/en/latest/constraints.html#ConstraintsFunctions.related_assets.returns "ConstraintsFunctions.related_assets.returns (Python parameter) — Assets returns DataFrame, where n_samples is the number of observations and n_assets is the number of assets.")
_, _[w](https://riskfolio-lib.readthedocs.io/en/latest/constraints.html#ConstraintsFunctions.related_assets.w "ConstraintsFunctions.related_assets.w (Python parameter) — Portfolio weights, where n_assets is the number of assets.")
_, _[custom\_cov](https://riskfolio-lib.readthedocs.io/en/latest/constraints.html#ConstraintsFunctions.related_assets.custom_cov "ConstraintsFunctions.related_assets.custom_cov (Python parameter) — Custom covariance matrix, used when codependence parameter has value 'custom_cov'.")
\=`None`_, _[codependence](https://riskfolio-lib.readthedocs.io/en/latest/constraints.html#ConstraintsFunctions.related_assets.codependence "ConstraintsFunctions.related_assets.codependence (Python parameter) — The codependence or similarity matrix used to build the distance metric and clusters.")
\=`'pearson'`_, _[linkage](https://riskfolio-lib.readthedocs.io/en/latest/constraints.html#ConstraintsFunctions.related_assets.linkage "ConstraintsFunctions.related_assets.linkage (Python parameter) — Duplicate explicit target name: "linkage".")
\=`'ward'`_, _[opt\_k\_method](https://riskfolio-lib.readthedocs.io/en/latest/constraints.html#ConstraintsFunctions.related_assets.opt_k_method "ConstraintsFunctions.related_assets.opt_k_method (Python parameter) — Method used to calculate the optimum number of clusters. The default is 'twodiff'.")
\=`'twodiff'`_, _[k](https://riskfolio-lib.readthedocs.io/en/latest/constraints.html#ConstraintsFunctions.related_assets.k "ConstraintsFunctions.related_assets.k (Python parameter) — Number of clusters.")
\=`None`_, _[max\_k](https://riskfolio-lib.readthedocs.io/en/latest/constraints.html#ConstraintsFunctions.related_assets.max_k "ConstraintsFunctions.related_assets.max_k (Python parameter) — Max number of clusters used by the two difference gap statistic to find the optimal number of clusters.")
\=`10`_, _[bins\_info](https://riskfolio-lib.readthedocs.io/en/latest/constraints.html#ConstraintsFunctions.related_assets.bins_info "ConstraintsFunctions.related_assets.bins_info (Python parameter) — Number of bins used to calculate variation of information.")
\=`'KN'`_, _[alpha\_tail](https://riskfolio-lib.readthedocs.io/en/latest/constraints.html#ConstraintsFunctions.related_assets.alpha_tail "ConstraintsFunctions.related_assets.alpha_tail (Python parameter) — Significance level for lower tail dependence index.")
\=`0.05`_, _[gs\_threshold](https://riskfolio-lib.readthedocs.io/en/latest/constraints.html#ConstraintsFunctions.related_assets.gs_threshold "ConstraintsFunctions.related_assets.gs_threshold (Python parameter) — Gerber statistic threshold.")
\=`0.5`_, _[leaf\_order](https://riskfolio-lib.readthedocs.io/en/latest/constraints.html#ConstraintsFunctions.related_assets.leaf_order "ConstraintsFunctions.related_assets.leaf_order (Python parameter) — Indicates if the cluster are ordered so that the distance between successive leaves is minimal.")
\=`True`_)[\[source\]](https://riskfolio-lib.readthedocs.io/en/latest/_modules/ConstraintsFunctions.html#related_assets)
[¶](https://riskfolio-lib.readthedocs.io/en/latest/constraints.html#ConstraintsFunctions.related_assets "Link to this definition")
Calculates the percentage invested in related assets based of the portfolio on \[[E3](https://riskfolio-lib.readthedocs.io/en/latest/constraints.html#id116 "Dany Cajas. A graph theory approach to portfolio optimization part ii. SSRN Electronic Journal, 12 2023. doi:10.2139/ssrn.4540021.")\
\] formula.
Parameters:[¶](https://riskfolio-lib.readthedocs.io/en/latest/constraints.html#ConstraintsFunctions.related_assets-parameters "Permalink to this headline")
returns : DataFrame of shape (n\_samples, n\_assets)[¶](https://riskfolio-lib.readthedocs.io/en/latest/constraints.html#ConstraintsFunctions.related_assets.returns "Permalink to this definition")
Assets returns DataFrame, where n\_samples is the number of observations and n\_assets is the number of assets.
w : DataFrame or Series of shape (n\_assets, 1)[¶](https://riskfolio-lib.readthedocs.io/en/latest/constraints.html#ConstraintsFunctions.related_assets.w "Permalink to this definition")
Portfolio weights, where n\_assets is the number of assets.
custom\_cov : DataFrame or None, optional[¶](https://riskfolio-lib.readthedocs.io/en/latest/constraints.html#ConstraintsFunctions.related_assets.custom_cov "Permalink to this definition")
Custom covariance matrix, used when codependence parameter has value ‘custom\_cov’. The default is None.
codependence : [str](https://docs.python.org/3.11/library/stdtypes.html#str "(in Python v3.11)")
, can be {'pearson', 'spearman', 'abs\_pearson', 'abs\_spearman', 'distance', 'mutual\_info', 'tail' or 'custom\_cov'}[¶](https://riskfolio-lib.readthedocs.io/en/latest/constraints.html#ConstraintsFunctions.related_assets.codependence "Permalink to this definition")
The codependence or similarity matrix used to build the distance metric and clusters. The default is ‘pearson’. Possible values are:
* ’pearson’: pearson correlation matrix. Distance formula: Di,j\=0.5(1−ρi,jpearson).
* ’spearman’: spearman correlation matrix. Distance formula: Di,j\=0.5(1−ρi,jspearman).
* ’kendall’: kendall correlation matrix. Distance formula: Di,j\=0.5(1−ρi,jkendall).
* ’gerber1’: Gerber statistic 1 correlation matrix. Distance formula: Di,j\=0.5(1−ρi,jgerber1).
* ’gerber2’: Gerber statistic 2 correlation matrix. Distance formula: Di,j\=0.5(1−ρi,jgerber2).
* ’abs\_pearson’: absolute value pearson correlation matrix. Distance formula: Di,j\=(1−|ρi,j|).
* ’abs\_spearman’: absolute value spearman correlation matrix. Distance formula: Di,j\=(1−|ρi,j|).
* ’abs\_kendall’: absolute value kendall correlation matrix. Distance formula: Di,j\=(1−|ρi,jkendall|).
* ’distance’: distance correlation matrix. Distance formula Di,j\=(1−ρi,jdistance).
* ’mutual\_info’: mutual information matrix. Distance used is variation information matrix.
* ’tail’: lower tail dependence index matrix. Dissimilarity formula Di,j\=−logλi,j.
* ’custom\_cov’: use custom correlation matrix based on the custom\_cov parameter. Distance formula: Di,j\=0.5(1−ρi,jpearson).
linkage : string, optional[¶](https://riskfolio-lib.readthedocs.io/en/latest/constraints.html#ConstraintsFunctions.related_assets.linkage "Permalink to this definition")
Linkage method of hierarchical clustering, see [linkage](https://docs.scipy.org/doc/scipy/reference/generated/scipy.cluster.hierarchy.linkage.html?highlight=linkage#scipy.cluster.hierarchy.linkage)
for more details. The default is ‘ward’. Possible values are:
* ’single’.
* ’complete’.
* ’average’.
* ’weighted’.
* ’centroid’.
* ’median’.
* ’ward’.
* ’DBHT’. Direct Bubble Hierarchical Tree.
opt\_k\_method : [str](https://docs.python.org/3.11/library/stdtypes.html#str "(in Python v3.11)")
[¶](https://riskfolio-lib.readthedocs.io/en/latest/constraints.html#ConstraintsFunctions.related_assets.opt_k_method "Permalink to this definition")
Method used to calculate the optimum number of clusters. The default is ‘twodiff’. Possible values are:
* ’twodiff’: two difference gap statistic.
* ’stdsil’: standarized silhouette score.
k : [int](https://docs.python.org/3.11/library/functions.html#int "(in Python v3.11)")
, optional[¶](https://riskfolio-lib.readthedocs.io/en/latest/constraints.html#ConstraintsFunctions.related_assets.k "Permalink to this definition")
Number of clusters. This value is took instead of the optimal number of clusters calculated with the two difference gap statistic. The default is None.
max\_k : [int](https://docs.python.org/3.11/library/functions.html#int "(in Python v3.11)")
, optional[¶](https://riskfolio-lib.readthedocs.io/en/latest/constraints.html#ConstraintsFunctions.related_assets.max_k "Permalink to this definition")
Max number of clusters used by the two difference gap statistic to find the optimal number of clusters. The default is 10.
bins\_info : [int](https://docs.python.org/3.11/library/functions.html#int "(in Python v3.11)")
or [str](https://docs.python.org/3.11/library/stdtypes.html#str "(in Python v3.11)")
[¶](https://riskfolio-lib.readthedocs.io/en/latest/constraints.html#ConstraintsFunctions.related_assets.bins_info "Permalink to this definition")
Number of bins used to calculate variation of information. The default value is ‘KN’. Possible values are:
* ’KN’: Knuth’s choice method. See more in [knuth\_bin\_width](https://docs.astropy.org/en/stable/api/astropy.stats.knuth_bin_width.html)
.
* ’FD’: Freedman–Diaconis’ choice method. See more in [freedman\_bin\_width](https://docs.astropy.org/en/stable/api/astropy.stats.freedman_bin_width.html)
.
* ’SC’: Scotts’ choice method. See more in [scott\_bin\_width](https://docs.astropy.org/en/stable/api/astropy.stats.scott_bin_width.html)
.
* ’HGR’: Hacine-Gharbi and Ravier’ choice method.
* int: integer value choice by user.
alpha\_tail : [float](https://docs.python.org/3.11/library/functions.html#float "(in Python v3.11)")
, optional[¶](https://riskfolio-lib.readthedocs.io/en/latest/constraints.html#ConstraintsFunctions.related_assets.alpha_tail "Permalink to this definition")
Significance level for lower tail dependence index. The default is 0.05.
gs\_threshold : [float](https://docs.python.org/3.11/library/functions.html#float "(in Python v3.11)")
, optional[¶](https://riskfolio-lib.readthedocs.io/en/latest/constraints.html#ConstraintsFunctions.related_assets.gs_threshold "Permalink to this definition")
Gerber statistic threshold. The default is 0.5.
leaf\_order : [bool](https://docs.python.org/3.11/library/functions.html#bool "(in Python v3.11)")
, optional[¶](https://riskfolio-lib.readthedocs.io/en/latest/constraints.html#ConstraintsFunctions.related_assets.leaf_order "Permalink to this definition")
Indicates if the cluster are ordered so that the distance between successive leaves is minimal. The default is True.
Returns:[¶](https://riskfolio-lib.readthedocs.io/en/latest/constraints.html#ConstraintsFunctions.related_assets-returns "Permalink to this headline")
**RA** – Percentage invested in related assets.
Return type:[¶](https://riskfolio-lib.readthedocs.io/en/latest/constraints.html#ConstraintsFunctions.related_assets-return-type "Permalink to this headline")
[float](https://docs.python.org/3.11/library/functions.html#float "(in Python v3.11)")
Raises:[¶](https://riskfolio-lib.readthedocs.io/en/latest/constraints.html#ConstraintsFunctions.related_assets-raises "Permalink to this headline")
**ValueError when the value cannot be calculated.** –
Examples
`ra = rp.related_assets(returns, w, codependence="pearson", linkage="ward", k=None, max_k=10)`
Bibliography[¶](https://riskfolio-lib.readthedocs.io/en/latest/constraints.html#bibliography "Link to this heading")
---------------------------------------------------------------------------------------------------------------------
\[[E1](https://riskfolio-lib.readthedocs.io/en/latest/constraints.html#id1)\
\]
Fischer Black and Robert Litterman. Global portfolio optimization. _Financial Analysts Journal_, 48(5):28–43, 1992. URL: [http://www.jstor.org/stable/4479577](http://www.jstor.org/stable/4479577)
.
\[E2\] ([1](https://riskfolio-lib.readthedocs.io/en/latest/constraints.html#id2)
,[2](https://riskfolio-lib.readthedocs.io/en/latest/constraints.html#id4)
,[3](https://riskfolio-lib.readthedocs.io/en/latest/constraints.html#id8)
,[4](https://riskfolio-lib.readthedocs.io/en/latest/constraints.html#id17)
,[5](https://riskfolio-lib.readthedocs.io/en/latest/constraints.html#id28)
)
Dany Cajas. A graph theory approach to portfolio optimization. _SSRN Electronic Journal_, 10 2023. [doi:10.2139/ssrn.4602019](https://doi.org/10.2139/ssrn.4602019)
.
\[E3\] ([1](https://riskfolio-lib.readthedocs.io/en/latest/constraints.html#id3)
,[2](https://riskfolio-lib.readthedocs.io/en/latest/constraints.html#id12)
,[3](https://riskfolio-lib.readthedocs.io/en/latest/constraints.html#id32)
)
Dany Cajas. A graph theory approach to portfolio optimization part ii. _SSRN Electronic Journal_, 12 2023. [doi:10.2139/ssrn.4540021](https://doi.org/10.2139/ssrn.4540021)
.
[**On-Demand H100 SXM GPUs for $2.99/hr/GPU with Lambda** 640 GB of vRAM in one 8x instance **Launch now**](https://server.ethicalads.io/proxy/click/9837/019d0edd-c206-7461-96f3-a10da9851c4e/)
[Ads by EthicalAds](https://www.ethicalads.io/advertisers/topics/data-science/?ref=ea-text)
---
# Plot Functions - Riskfolio-Lib 7.2
[Skip to content](https://riskfolio-lib.readthedocs.io/en/latest/plot.html#example)
Plot Functions[¶](https://riskfolio-lib.readthedocs.io/en/latest/plot.html#plot-functions "Link to this heading")
==================================================================================================================
[Buy Advanced Portfolio Optimization Book on Springer](https://www.kqzyfj.com/click-101359873-15150084?url=https%3A%2F%2Flink.springer.com%2Fbook%2F9783031843037)
[Enroll in the Portfolio Optimization with Python Course](https://www.paypal.com/ncp/payment/GN55W4UQ7VAMN)
[](https://github.com/sponsors/dcajasn)
[](https://ko-fi.com/B0B833SXD)
This module has functions that allows us to create charts that helps us to analyze quickly the properties of our optimal portfolios.
The following example construct the portfolios and the efficient frontier that will be plot using the functions of this module.
Example[¶](https://riskfolio-lib.readthedocs.io/en/latest/plot.html#example "Link to this heading")
----------------------------------------------------------------------------------------------------
`import numpy as np import pandas as pd import yfinance as yf import riskfolio as rp # Date range start = '2016-01-01' end = '2019-12-30' # Tickers of assets assets = ['JCI', 'TGT', 'CMCSA', 'CPB', 'MO', 'APA', 'MMC', 'JPM', 'ZION', 'PSA', 'BAX', 'BMY', 'LUV', 'PCAR', 'TXT', 'TMO', 'DE', 'MSFT', 'HPQ', 'SEE', 'VZ', 'CNP', 'NI', 'T', 'BA'] assets.sort() # Tickers of factors factors = ['MTUM', 'QUAL', 'VLUE', 'SIZE', 'USMV'] factors.sort() tickers = assets + factors tickers.sort() # Downloading the data data = yf.download(tickers, start = start, end = end) data = data.loc[:,('Adj Close', slice(None))] data.columns = tickers returns = data.pct_change().dropna() Y = returns[assets] X = returns[factors] # Creating the Portfolio Object port = rp.Portfolio(returns=Y) # To display dataframes values in percentage format pd.options.display.float_format = '{:.4%}'.format # Choose the risk measure rm = 'MSV' # Semi Standard Deviation # Estimate inputs of the model (historical estimates) method_mu='hist' # Method to estimate expected returns based on historical data. method_cov='hist' # Method to estimate covariance matrix based on historical data. port.assets_stats(method_mu=method_mu, method_cov=method_cov) mu = port.mu cov = port.cov # Estimate the portfolio that maximizes the risk adjusted return ratio w1 = port.optimization(model='Classic', rm=rm, obj='Sharpe', rf=0.0, l=0, hist=True) # Estimate points in the efficient frontier mean - semi standard deviation ws = port.efficient_frontier(model='Classic', rm=rm, points=20, rf=0, hist=True) # Estimate the risk parity portfolio for semi standard deviation w2 = port.rp_optimization(model='Classic', rm=rm, rf=0, b=None, hist=True) # Estimate the risk parity portfolio for semi standard deviation w2 = port.rp_optimization(model='Classic', rm=rm, rf=0, b=None, hist=True) # Estimate the risk parity portfolio for risk factors port.factors = X port.factors_stats(method_mu=method_mu, method_cov=method_cov, feature_selection='stepwise', stepwise='Forward') w3 = port.rp_optimization(model='FC', rm='MV', rf=0, b_f=None) # Estimate the risk parity portfolio for principal components port.factors = X port.factors_stats(method_mu=method_mu, method_cov=method_cov, feature_selection='PCR', n_components=0.95) w4 = port.rp_optimization(model='FC', rm='MV', rf=0, b_f=None) wb = pd.DataFrame(np.ones((len(assets), 1))/len(assets), index=assets)`
Module Functions[¶](https://riskfolio-lib.readthedocs.io/en/latest/plot.html#module-PlotFunctions "Link to this heading")
--------------------------------------------------------------------------------------------------------------------------
PlotFunctions.plot\_series(_[returns](https://riskfolio-lib.readthedocs.io/en/latest/plot.html#PlotFunctions.plot_series.returns "PlotFunctions.plot_series.returns (Python parameter) — Assets returns DataFrame, where n_samples is the number of observations and n_assets is the number of assets.")
_, _[w](https://riskfolio-lib.readthedocs.io/en/latest/plot.html#PlotFunctions.plot_series.w "PlotFunctions.plot_series.w (Python parameter) — Portfolio weights, where n_assets is the number of assets.")
_, _[cmap](https://riskfolio-lib.readthedocs.io/en/latest/plot.html#PlotFunctions.plot_series.cmap "PlotFunctions.plot_series.cmap (Python parameter) — Colorscale used to plot each portfolio compounded cumulative return. The default is 'tab20'.")
\=`'tab20'`_, _[n\_colors](https://riskfolio-lib.readthedocs.io/en/latest/plot.html#PlotFunctions.plot_series.n_colors "PlotFunctions.plot_series.n_colors (Python parameter) — Number of distinct colors per color cycle.")
\=`20`_, _[height](https://riskfolio-lib.readthedocs.io/en/latest/plot.html#PlotFunctions.plot_series.height "PlotFunctions.plot_series.height (Python parameter) — Height of the image in inches.")
\=`6`_, _[width](https://riskfolio-lib.readthedocs.io/en/latest/plot.html#PlotFunctions.plot_series.width "PlotFunctions.plot_series.width (Python parameter) — Width of the image in inches.")
\=`10`_, _[ax](https://riskfolio-lib.readthedocs.io/en/latest/plot.html#PlotFunctions.plot_series.ax "PlotFunctions.plot_series.ax (Python parameter) — If provided, plot on this axis.")
\=`None`_)[\[source\]](https://riskfolio-lib.readthedocs.io/en/latest/_modules/PlotFunctions.html#plot_series)
[¶](https://riskfolio-lib.readthedocs.io/en/latest/plot.html#PlotFunctions.plot_series "Link to this definition")
Create a chart with the compounded cumulative of the portfolios.
Parameters:[¶](https://riskfolio-lib.readthedocs.io/en/latest/plot.html#PlotFunctions.plot_series-parameters "Permalink to this headline")
returns : DataFrame of shape (n\_samples, n\_assets)[¶](https://riskfolio-lib.readthedocs.io/en/latest/plot.html#PlotFunctions.plot_series.returns "Permalink to this definition")
Assets returns DataFrame, where n\_samples is the number of observations and n\_assets is the number of assets.
w : DataFrame or Series of shape (n\_assets, 1)[¶](https://riskfolio-lib.readthedocs.io/en/latest/plot.html#PlotFunctions.plot_series.w "Permalink to this definition")
Portfolio weights, where n\_assets is the number of assets.
cmap : cmap, optional[¶](https://riskfolio-lib.readthedocs.io/en/latest/plot.html#PlotFunctions.plot_series.cmap "Permalink to this definition")
Colorscale used to plot each portfolio compounded cumulative return. The default is ‘tab20’.
n\_colors : [int](https://docs.python.org/3.11/library/functions.html#int "(in Python v3.11)")
, optional[¶](https://riskfolio-lib.readthedocs.io/en/latest/plot.html#PlotFunctions.plot_series.n_colors "Permalink to this definition")
Number of distinct colors per color cycle. If there are more assets than n\_colors, the chart is going to start to repeat the color cycle. The default is 20.
height : [float](https://docs.python.org/3.11/library/functions.html#float "(in Python v3.11)")
, optional[¶](https://riskfolio-lib.readthedocs.io/en/latest/plot.html#PlotFunctions.plot_series.height "Permalink to this definition")
Height of the image in inches. The default is 6.
width : [float](https://docs.python.org/3.11/library/functions.html#float "(in Python v3.11)")
, optional[¶](https://riskfolio-lib.readthedocs.io/en/latest/plot.html#PlotFunctions.plot_series.width "Permalink to this definition")
Width of the image in inches. The default is 10.
ax : matplotlib axis, optional[¶](https://riskfolio-lib.readthedocs.io/en/latest/plot.html#PlotFunctions.plot_series.ax "Permalink to this definition")
If provided, plot on this axis. The default is None.
Raises:[¶](https://riskfolio-lib.readthedocs.io/en/latest/plot.html#PlotFunctions.plot_series-raises "Permalink to this headline")
[**ValueError**](https://docs.python.org/3.11/library/exceptions.html#ValueError "(in Python v3.11)")
– When the value cannot be calculated.
Returns:[¶](https://riskfolio-lib.readthedocs.io/en/latest/plot.html#PlotFunctions.plot_series-returns "Permalink to this headline")
**ax** – Returns the Axes object with the plot for further tweaking.
Return type:[¶](https://riskfolio-lib.readthedocs.io/en/latest/plot.html#PlotFunctions.plot_series-return-type "Permalink to this headline")
matplotlib axis
Example
`ax = rp.plot_series(returns=Y, w=ws, cmap='tab20', height=6, width=10, ax=None)`
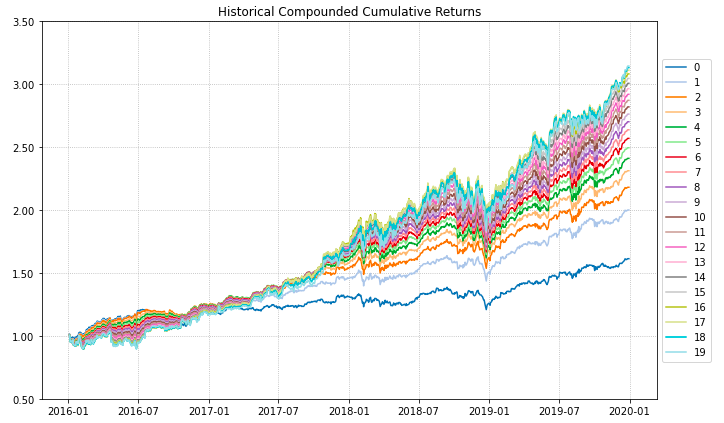
PlotFunctions.plot\_frontier(_[w\_frontier](https://riskfolio-lib.readthedocs.io/en/latest/plot.html#PlotFunctions.plot_frontier.w_frontier "PlotFunctions.plot_frontier.w_frontier (Python parameter) — Portfolio weights of some points in the efficient frontier.")
_, _[returns](https://riskfolio-lib.readthedocs.io/en/latest/plot.html#PlotFunctions.plot_frontier.returns "PlotFunctions.plot_frontier.returns (Python parameter) — Assets returns DataFrame, where n_samples is the number of observations and n_assets is the number of assets.")
_, _[mu](https://riskfolio-lib.readthedocs.io/en/latest/plot.html#PlotFunctions.plot_frontier.mu "PlotFunctions.plot_frontier.mu (Python parameter) — Vector of expected returns, where n_assets is the number of assets.")
\=`None`_, _[cov](https://riskfolio-lib.readthedocs.io/en/latest/plot.html#PlotFunctions.plot_frontier.cov "PlotFunctions.plot_frontier.cov (Python parameter) — Covariance matrix, where n_assets is the number of assets.")
\=`None`_, _[rm](https://riskfolio-lib.readthedocs.io/en/latest/plot.html#PlotFunctions.plot_frontier.rm "PlotFunctions.plot_frontier.rm (Python parameter) — The risk measure used to estimate the frontier. The default is 'MV'.")
\=`'MV'`_, _[kelly](https://riskfolio-lib.readthedocs.io/en/latest/plot.html#PlotFunctions.plot_frontier.kelly "PlotFunctions.plot_frontier.kelly (Python parameter) — Method used to calculate mean return.")
\=`False`_, _[rf](https://riskfolio-lib.readthedocs.io/en/latest/plot.html#PlotFunctions.plot_frontier.rf "PlotFunctions.plot_frontier.rf (Python parameter) — Risk free rate or minimum acceptable return.")
\=`0`_, _[alpha](https://riskfolio-lib.readthedocs.io/en/latest/plot.html#PlotFunctions.plot_frontier.alpha "PlotFunctions.plot_frontier.alpha (Python parameter) — Significance level of VaR, CVaR, EVaR, RLVaR, DaR, CDaR, EDaR, RLDaR and Tail Gini of losses. The default is 0.05.")
\=`0.05`_, _[a\_sim](https://riskfolio-lib.readthedocs.io/en/latest/plot.html#PlotFunctions.plot_frontier.a_sim "PlotFunctions.plot_frontier.a_sim (Python parameter) — Number of CVaRs used to approximate Tail Gini of losses.")
\=`100`_, _[beta](https://riskfolio-lib.readthedocs.io/en/latest/plot.html#PlotFunctions.plot_frontier.beta "PlotFunctions.plot_frontier.beta (Python parameter) — Significance level of CVaR and Tail Gini of gains.")
\=`None`_, _[b\_sim](https://riskfolio-lib.readthedocs.io/en/latest/plot.html#PlotFunctions.plot_frontier.b_sim "PlotFunctions.plot_frontier.b_sim (Python parameter) — Number of CVaRs used to approximate Tail Gini of gains.")
\=`None`_, _[kappa](https://riskfolio-lib.readthedocs.io/en/latest/plot.html#PlotFunctions.plot_frontier.kappa "PlotFunctions.plot_frontier.kappa (Python parameter) — Deformation parameter of RLVaR and RLDaR for losses, must be between 0 and 1.")
\=`0.3`_, _[kappa\_g](https://riskfolio-lib.readthedocs.io/en/latest/plot.html#PlotFunctions.plot_frontier.kappa_g "PlotFunctions.plot_frontier.kappa_g (Python parameter) — Deformation parameter of RLVaR for gains, must be between 0 and 1. The default is None.")
\=`None`_, _[solver](https://riskfolio-lib.readthedocs.io/en/latest/plot.html#PlotFunctions.plot_frontier.solver "PlotFunctions.plot_frontier.solver (Python parameter) — Solver available for CVXPY that supports power cone programming.")
\=`'CLARABEL'`_, _[cmap](https://riskfolio-lib.readthedocs.io/en/latest/plot.html#PlotFunctions.plot_frontier.cmap "PlotFunctions.plot_frontier.cmap (Python parameter) — Colorscale that represents the risk adjusted return ratio. The default is 'viridis'.")
\=`'viridis'`_, _[w](https://riskfolio-lib.readthedocs.io/en/latest/plot.html#PlotFunctions.plot_frontier.w "PlotFunctions.plot_frontier.w (Python parameter) — A portfolio specified by the user.")
\=`None`_, _[label](https://riskfolio-lib.readthedocs.io/en/latest/plot.html#PlotFunctions.plot_frontier.label "PlotFunctions.plot_frontier.label (Python parameter) — Name or list of names of portfolios that appear on plot legend. The default is 'Portfolio'.")
\=`'Portfolio'`_, _[marker](https://riskfolio-lib.readthedocs.io/en/latest/plot.html#PlotFunctions.plot_frontier.marker "PlotFunctions.plot_frontier.marker (Python parameter) — Marker of w.")
\=`'*'`_, _[s](https://riskfolio-lib.readthedocs.io/en/latest/plot.html#PlotFunctions.plot_frontier.s "PlotFunctions.plot_frontier.s (Python parameter) — Size of marker.")
\=`16`_, _[c](https://riskfolio-lib.readthedocs.io/en/latest/plot.html#PlotFunctions.plot_frontier.c "PlotFunctions.plot_frontier.c (Python parameter) — Color of marker.")
\=`'r'`_, _[height](https://riskfolio-lib.readthedocs.io/en/latest/plot.html#PlotFunctions.plot_frontier.height "PlotFunctions.plot_frontier.height (Python parameter) — Height of the image in inches.")
\=`6`_, _[width](https://riskfolio-lib.readthedocs.io/en/latest/plot.html#PlotFunctions.plot_frontier.width "PlotFunctions.plot_frontier.width (Python parameter) — Width of the image in inches.")
\=`10`_, _[t\_factor](https://riskfolio-lib.readthedocs.io/en/latest/plot.html#PlotFunctions.plot_frontier.t_factor "PlotFunctions.plot_frontier.t_factor (Python parameter) — Factor used to annualize expected return and expected risks for risk measures based on returns (not drawdowns).")
\=`252`_, _[ax](https://riskfolio-lib.readthedocs.io/en/latest/plot.html#PlotFunctions.plot_frontier.ax "PlotFunctions.plot_frontier.ax (Python parameter) — If provided, plot on this axis.")
\=`None`_)[\[source\]](https://riskfolio-lib.readthedocs.io/en/latest/_modules/PlotFunctions.html#plot_frontier)
[¶](https://riskfolio-lib.readthedocs.io/en/latest/plot.html#PlotFunctions.plot_frontier "Link to this definition")
Creates a plot of the efficient frontier for a risk measure specified by the user.
Parameters:[¶](https://riskfolio-lib.readthedocs.io/en/latest/plot.html#PlotFunctions.plot_frontier-parameters "Permalink to this headline")
w\_frontier : DataFrame[¶](https://riskfolio-lib.readthedocs.io/en/latest/plot.html#PlotFunctions.plot_frontier.w_frontier "Permalink to this definition")
Portfolio weights of some points in the efficient frontier.
mu : DataFrame of shape (1, n\_assets)[¶](https://riskfolio-lib.readthedocs.io/en/latest/plot.html#PlotFunctions.plot_frontier.mu "Permalink to this definition")
Vector of expected returns, where n\_assets is the number of assets.
cov : DataFrame of shape (n\_assets, n\_assets)[¶](https://riskfolio-lib.readthedocs.io/en/latest/plot.html#PlotFunctions.plot_frontier.cov "Permalink to this definition")
Covariance matrix, where n\_assets is the number of assets.
returns : DataFrame of shape (n\_samples, n\_assets)[¶](https://riskfolio-lib.readthedocs.io/en/latest/plot.html#PlotFunctions.plot_frontier.returns "Permalink to this definition")
Assets returns DataFrame, where n\_samples is the number of observations and n\_assets is the number of assets.
rm : [str](https://docs.python.org/3.11/library/stdtypes.html#str "(in Python v3.11)")
, optional[¶](https://riskfolio-lib.readthedocs.io/en/latest/plot.html#PlotFunctions.plot_frontier.rm "Permalink to this definition")
The risk measure used to estimate the frontier. The default is ‘MV’. Possible values are:
* ’MV’: Standard Deviation.
* ’KT’: Square Root Kurtosis.
* ’MAD’: Mean Absolute Deviation.
* ’MSV’: Semi Standard Deviation.
* ’SKT’: Square Root Semi Kurtosis.
* ’FLPM’: First Lower Partial Moment (Omega Ratio).
* ’SLPM’: Second Lower Partial Moment (Sortino Ratio).
* ’CVaR’: Conditional Value at Risk.
* ’TG’: Tail Gini.
* ’EVaR’: Entropic Value at Risk.
* ’RLVaR’: Relativistic Value at Risk.
* ’WR’: Worst Realization (Minimax).
* ’CVRG’: CVaR range of returns.
* ’TGRG’: Tail Gini range of returns.
* ’EVRG’: EVaR range of returns.
* ’RVRG’: RLVaR range of returns.
* ’RG’: Range of returns.
* ’MDD’: Maximum Drawdown of uncompounded returns (Calmar Ratio).
* ’ADD’: Average Drawdown of uncompounded cumulative returns.
* ’DaR’: Drawdown at Risk of uncompounded cumulative returns.
* ’CDaR’: Conditional Drawdown at Risk of uncompounded cumulative returns.
* ’EDaR’: Entropic Drawdown at Risk of uncompounded cumulative returns.
* ’RLDaR’: Relativistic Drawdown at Risk of uncompounded cumulative returns.
* ’UCI’: Ulcer Index of uncompounded cumulative returns.
kelly : [bool](https://docs.python.org/3.11/library/functions.html#bool "(in Python v3.11)")
, optional[¶](https://riskfolio-lib.readthedocs.io/en/latest/plot.html#PlotFunctions.plot_frontier.kelly "Permalink to this definition")
Method used to calculate mean return. Possible values are False for arithmetic mean return and True for mean logarithmic return. The default is False.
rf : [float](https://docs.python.org/3.11/library/functions.html#float "(in Python v3.11)")
, optional[¶](https://riskfolio-lib.readthedocs.io/en/latest/plot.html#PlotFunctions.plot_frontier.rf "Permalink to this definition")
Risk free rate or minimum acceptable return. The default is 0.
alpha : [float](https://docs.python.org/3.11/library/functions.html#float "(in Python v3.11)")
, optional[¶](https://riskfolio-lib.readthedocs.io/en/latest/plot.html#PlotFunctions.plot_frontier.alpha "Permalink to this definition")
Significance level of VaR, CVaR, EVaR, RLVaR, DaR, CDaR, EDaR, RLDaR and Tail Gini of losses. The default is 0.05.
a\_sim : [float](https://docs.python.org/3.11/library/functions.html#float "(in Python v3.11)")
, optional[¶](https://riskfolio-lib.readthedocs.io/en/latest/plot.html#PlotFunctions.plot_frontier.a_sim "Permalink to this definition")
Number of CVaRs used to approximate Tail Gini of losses. The default is 100.
beta : [float](https://docs.python.org/3.11/library/functions.html#float "(in Python v3.11)")
, optional[¶](https://riskfolio-lib.readthedocs.io/en/latest/plot.html#PlotFunctions.plot_frontier.beta "Permalink to this definition")
Significance level of CVaR and Tail Gini of gains. If None it duplicates alpha value. The default is None.
b\_sim : [float](https://docs.python.org/3.11/library/functions.html#float "(in Python v3.11)")
, optional[¶](https://riskfolio-lib.readthedocs.io/en/latest/plot.html#PlotFunctions.plot_frontier.b_sim "Permalink to this definition")
Number of CVaRs used to approximate Tail Gini of gains. If None it duplicates a\_sim value. The default is None.
kappa : [float](https://docs.python.org/3.11/library/functions.html#float "(in Python v3.11)")
, optional[¶](https://riskfolio-lib.readthedocs.io/en/latest/plot.html#PlotFunctions.plot_frontier.kappa "Permalink to this definition")
Deformation parameter of RLVaR and RLDaR for losses, must be between 0 and 1. The default is 0.30.
kappa\_g : [float](https://docs.python.org/3.11/library/functions.html#float "(in Python v3.11)")
, optional[¶](https://riskfolio-lib.readthedocs.io/en/latest/plot.html#PlotFunctions.plot_frontier.kappa_g "Permalink to this definition")
Deformation parameter of RLVaR for gains, must be between 0 and 1. The default is None.
solver : [str](https://docs.python.org/3.11/library/stdtypes.html#str "(in Python v3.11)")
, optional[¶](https://riskfolio-lib.readthedocs.io/en/latest/plot.html#PlotFunctions.plot_frontier.solver "Permalink to this definition")
Solver available for CVXPY that supports power cone programming. Used to calculate RLVaR and RLDaR. The default value is ‘CLARABEL’.
cmap : cmap, optional[¶](https://riskfolio-lib.readthedocs.io/en/latest/plot.html#PlotFunctions.plot_frontier.cmap "Permalink to this definition")
Colorscale that represents the risk adjusted return ratio. The default is ‘viridis’.
w : DataFrame or Series of shape (n\_assets, 1), optional[¶](https://riskfolio-lib.readthedocs.io/en/latest/plot.html#PlotFunctions.plot_frontier.w "Permalink to this definition")
A portfolio specified by the user. The default is None.
label : [str](https://docs.python.org/3.11/library/stdtypes.html#str "(in Python v3.11)")
or [list](https://docs.python.org/3.11/library/stdtypes.html#list "(in Python v3.11)")
, optional[¶](https://riskfolio-lib.readthedocs.io/en/latest/plot.html#PlotFunctions.plot_frontier.label "Permalink to this definition")
Name or list of names of portfolios that appear on plot legend. The default is ‘Portfolio’.
marker : [str](https://docs.python.org/3.11/library/stdtypes.html#str "(in Python v3.11)")
, optional[¶](https://riskfolio-lib.readthedocs.io/en/latest/plot.html#PlotFunctions.plot_frontier.marker "Permalink to this definition")
Marker of w. The default is “\*”.
s : [float](https://docs.python.org/3.11/library/functions.html#float "(in Python v3.11)")
, optional[¶](https://riskfolio-lib.readthedocs.io/en/latest/plot.html#PlotFunctions.plot_frontier.s "Permalink to this definition")
Size of marker. The default is 16.
c : [str](https://docs.python.org/3.11/library/stdtypes.html#str "(in Python v3.11)")
, optional[¶](https://riskfolio-lib.readthedocs.io/en/latest/plot.html#PlotFunctions.plot_frontier.c "Permalink to this definition")
Color of marker. The default is ‘r’.
height : [float](https://docs.python.org/3.11/library/functions.html#float "(in Python v3.11)")
, optional[¶](https://riskfolio-lib.readthedocs.io/en/latest/plot.html#PlotFunctions.plot_frontier.height "Permalink to this definition")
Height of the image in inches. The default is 6.
width : [float](https://docs.python.org/3.11/library/functions.html#float "(in Python v3.11)")
, optional[¶](https://riskfolio-lib.readthedocs.io/en/latest/plot.html#PlotFunctions.plot_frontier.width "Permalink to this definition")
Width of the image in inches. The default is 10.
t\_factor : [float](https://docs.python.org/3.11/library/functions.html#float "(in Python v3.11)")
, optional[¶](https://riskfolio-lib.readthedocs.io/en/latest/plot.html#PlotFunctions.plot_frontier.t_factor "Permalink to this definition")
Factor used to annualize expected return and expected risks for risk measures based on returns (not drawdowns). The default is 252.
Annualized Return\=Return×t\_factorAnnualized Risk\=Risk×t\_factor
ax : matplotlib axis, optional[¶](https://riskfolio-lib.readthedocs.io/en/latest/plot.html#PlotFunctions.plot_frontier.ax "Permalink to this definition")
If provided, plot on this axis. The default is None.
Raises:[¶](https://riskfolio-lib.readthedocs.io/en/latest/plot.html#PlotFunctions.plot_frontier-raises "Permalink to this headline")
[**ValueError**](https://docs.python.org/3.11/library/exceptions.html#ValueError "(in Python v3.11)")
– When the value cannot be calculated.
Returns:[¶](https://riskfolio-lib.readthedocs.io/en/latest/plot.html#PlotFunctions.plot_frontier-returns "Permalink to this headline")
**ax** – Returns the Axes object with the plot for further tweaking.
Return type:[¶](https://riskfolio-lib.readthedocs.io/en/latest/plot.html#PlotFunctions.plot_frontier-return-type "Permalink to this headline")
matplotlib Axes
Example
`label = 'Max Risk Adjusted Return Portfolio' mu = port.mu cov = port.cov returns = port.returns ax = rp.plot_frontier(w_frontier=ws, mu=mu, cov=cov, returns=Y, rm=rm, rf=0, alpha=0.05, cmap='viridis', w=w1, label=label, marker='*', s=16, c='r', height=6, width=10, t_factor=252, ax=None)`

PlotFunctions.plot\_pie(_[w](https://riskfolio-lib.readthedocs.io/en/latest/plot.html#PlotFunctions.plot_pie.w "PlotFunctions.plot_pie.w (Python parameter) — Portfolio weights, where n_assets is the number of assets.")
_, _[title](https://riskfolio-lib.readthedocs.io/en/latest/plot.html#PlotFunctions.plot_pie.title "PlotFunctions.plot_pie.title (Python parameter) — Title of the chart.")
\=`''`_, _[others](https://riskfolio-lib.readthedocs.io/en/latest/plot.html#PlotFunctions.plot_pie.others "PlotFunctions.plot_pie.others (Python parameter) — Percentage of others section.")
\=`0.05`_, _[nrow](https://riskfolio-lib.readthedocs.io/en/latest/plot.html#PlotFunctions.plot_pie.nrow "PlotFunctions.plot_pie.nrow (Python parameter) — Number of rows of the legend.")
\=`25`_, _[cmap](https://riskfolio-lib.readthedocs.io/en/latest/plot.html#PlotFunctions.plot_pie.cmap "PlotFunctions.plot_pie.cmap (Python parameter) — Color scale used to plot each asset weight. The default is 'tab20'.")
\=`'tab20'`_, _[n\_colors](https://riskfolio-lib.readthedocs.io/en/latest/plot.html#PlotFunctions.plot_pie.n_colors "PlotFunctions.plot_pie.n_colors (Python parameter) — Number of distinct colors per color cycle.")
\=`20`_, _[height](https://riskfolio-lib.readthedocs.io/en/latest/plot.html#PlotFunctions.plot_pie.height "PlotFunctions.plot_pie.height (Python parameter) — Height of the image in inches.")
\=`6`_, _[width](https://riskfolio-lib.readthedocs.io/en/latest/plot.html#PlotFunctions.plot_pie.width "PlotFunctions.plot_pie.width (Python parameter) — Width of the image in inches.")
\=`8`_, _[ax](https://riskfolio-lib.readthedocs.io/en/latest/plot.html#PlotFunctions.plot_pie.ax "PlotFunctions.plot_pie.ax (Python parameter) — If provided, plot on this axis.")
\=`None`_)[\[source\]](https://riskfolio-lib.readthedocs.io/en/latest/_modules/PlotFunctions.html#plot_pie)
[¶](https://riskfolio-lib.readthedocs.io/en/latest/plot.html#PlotFunctions.plot_pie "Link to this definition")
Create a pie chart with portfolio weights.
Parameters:[¶](https://riskfolio-lib.readthedocs.io/en/latest/plot.html#PlotFunctions.plot_pie-parameters "Permalink to this headline")
w : DataFrame or Series of shape (n\_assets, 1)[¶](https://riskfolio-lib.readthedocs.io/en/latest/plot.html#PlotFunctions.plot_pie.w "Permalink to this definition")
Portfolio weights, where n\_assets is the number of assets.
title : [str](https://docs.python.org/3.11/library/stdtypes.html#str "(in Python v3.11)")
, optional[¶](https://riskfolio-lib.readthedocs.io/en/latest/plot.html#PlotFunctions.plot_pie.title "Permalink to this definition")
Title of the chart. The default is “”.
others : [float](https://docs.python.org/3.11/library/functions.html#float "(in Python v3.11)")
, optional[¶](https://riskfolio-lib.readthedocs.io/en/latest/plot.html#PlotFunctions.plot_pie.others "Permalink to this definition")
Percentage of others section. The default is 0.05.
nrow : [int](https://docs.python.org/3.11/library/functions.html#int "(in Python v3.11)")
, optional[¶](https://riskfolio-lib.readthedocs.io/en/latest/plot.html#PlotFunctions.plot_pie.nrow "Permalink to this definition")
Number of rows of the legend. The default is 25.
cmap : cmap, optional[¶](https://riskfolio-lib.readthedocs.io/en/latest/plot.html#PlotFunctions.plot_pie.cmap "Permalink to this definition")
Color scale used to plot each asset weight. The default is ‘tab20’.
n\_colors : [int](https://docs.python.org/3.11/library/functions.html#int "(in Python v3.11)")
, optional[¶](https://riskfolio-lib.readthedocs.io/en/latest/plot.html#PlotFunctions.plot_pie.n_colors "Permalink to this definition")
Number of distinct colors per color cycle. If there are more assets than n\_colors, the chart is going to start to repeat the color cycle. The default is 20.
height : [float](https://docs.python.org/3.11/library/functions.html#float "(in Python v3.11)")
, optional[¶](https://riskfolio-lib.readthedocs.io/en/latest/plot.html#PlotFunctions.plot_pie.height "Permalink to this definition")
Height of the image in inches. The default is 10.
width : [float](https://docs.python.org/3.11/library/functions.html#float "(in Python v3.11)")
, optional[¶](https://riskfolio-lib.readthedocs.io/en/latest/plot.html#PlotFunctions.plot_pie.width "Permalink to this definition")
Width of the image in inches. The default is 10.
ax : matplotlib axis, optional[¶](https://riskfolio-lib.readthedocs.io/en/latest/plot.html#PlotFunctions.plot_pie.ax "Permalink to this definition")
If provided, plot on this axis. The default is None.
Raises:[¶](https://riskfolio-lib.readthedocs.io/en/latest/plot.html#PlotFunctions.plot_pie-raises "Permalink to this headline")
[**ValueError**](https://docs.python.org/3.11/library/exceptions.html#ValueError "(in Python v3.11)")
– When the value cannot be calculated.
Returns:[¶](https://riskfolio-lib.readthedocs.io/en/latest/plot.html#PlotFunctions.plot_pie-returns "Permalink to this headline")
**ax** – Returns the Axes object with the plot for further tweaking.
Return type:[¶](https://riskfolio-lib.readthedocs.io/en/latest/plot.html#PlotFunctions.plot_pie-return-type "Permalink to this headline")
matplotlib axis.
Example
`ax = rp.plot_pie(w=w1, title='Portfolio', height=6, width=10, cmap="tab20", ax=None)`

PlotFunctions.plot\_bar(_[w](https://riskfolio-lib.readthedocs.io/en/latest/plot.html#PlotFunctions.plot_bar.w "PlotFunctions.plot_bar.w (Python parameter) — Portfolio weights, where n_assets is the number of assets.")
_, _[title](https://riskfolio-lib.readthedocs.io/en/latest/plot.html#PlotFunctions.plot_bar.title "PlotFunctions.plot_bar.title (Python parameter) — Title of the chart.")
\=`''`_, _[kind](https://riskfolio-lib.readthedocs.io/en/latest/plot.html#PlotFunctions.plot_bar.kind "PlotFunctions.plot_bar.kind (Python parameter) — Kind of bar plot, "v" for vertical bars and "h" for horizontal bars. The default is "v".")
\=`'v'`_, _[others](https://riskfolio-lib.readthedocs.io/en/latest/plot.html#PlotFunctions.plot_bar.others "PlotFunctions.plot_bar.others (Python parameter) — Percentage of others section.")
\=`0.05`_, _[nrow](https://riskfolio-lib.readthedocs.io/en/latest/plot.html#PlotFunctions.plot_bar.nrow "PlotFunctions.plot_bar.nrow (Python parameter) — Max number of bars that be plotted.")
\=`25`_, _[cpos](https://riskfolio-lib.readthedocs.io/en/latest/plot.html#PlotFunctions.plot_bar.cpos "PlotFunctions.plot_bar.cpos (Python parameter) — Color for positives weights.")
\=`'tab:green'`_, _[cneg](https://riskfolio-lib.readthedocs.io/en/latest/plot.html#PlotFunctions.plot_bar.cneg "PlotFunctions.plot_bar.cneg (Python parameter) — Color for negatives weights.")
\=`'darkorange'`_, _[cothers](https://riskfolio-lib.readthedocs.io/en/latest/plot.html#PlotFunctions.plot_bar.cothers "PlotFunctions.plot_bar.cothers (Python parameter) — Color for others bar.")
\=`'dodgerblue'`_, _[height](https://riskfolio-lib.readthedocs.io/en/latest/plot.html#PlotFunctions.plot_bar.height "PlotFunctions.plot_bar.height (Python parameter) — Height of the image in inches.")
\=`6`_, _[width](https://riskfolio-lib.readthedocs.io/en/latest/plot.html#PlotFunctions.plot_bar.width "PlotFunctions.plot_bar.width (Python parameter) — Width of the image in inches.")
\=`10`_, _[ax](https://riskfolio-lib.readthedocs.io/en/latest/plot.html#PlotFunctions.plot_bar.ax "PlotFunctions.plot_bar.ax (Python parameter) — If provided, plot on this axis.")
\=`None`_)[\[source\]](https://riskfolio-lib.readthedocs.io/en/latest/_modules/PlotFunctions.html#plot_bar)
[¶](https://riskfolio-lib.readthedocs.io/en/latest/plot.html#PlotFunctions.plot_bar "Link to this definition")
Create a bar chart with portfolio weights.
Parameters:[¶](https://riskfolio-lib.readthedocs.io/en/latest/plot.html#PlotFunctions.plot_bar-parameters "Permalink to this headline")
w : DataFrame or Series of shape (n\_assets, 1)[¶](https://riskfolio-lib.readthedocs.io/en/latest/plot.html#PlotFunctions.plot_bar.w "Permalink to this definition")
Portfolio weights, where n\_assets is the number of assets.
title : [str](https://docs.python.org/3.11/library/stdtypes.html#str "(in Python v3.11)")
, optional[¶](https://riskfolio-lib.readthedocs.io/en/latest/plot.html#PlotFunctions.plot_bar.title "Permalink to this definition")
Title of the chart. The default is “”.
kind : [str](https://docs.python.org/3.11/library/stdtypes.html#str "(in Python v3.11)")
, optional[¶](https://riskfolio-lib.readthedocs.io/en/latest/plot.html#PlotFunctions.plot_bar.kind "Permalink to this definition")
Kind of bar plot, “v” for vertical bars and “h” for horizontal bars. The default is “v”.
others : [float](https://docs.python.org/3.11/library/functions.html#float "(in Python v3.11)")
, optional[¶](https://riskfolio-lib.readthedocs.io/en/latest/plot.html#PlotFunctions.plot_bar.others "Permalink to this definition")
Percentage of others section. The default is 0.05.
nrow : [int](https://docs.python.org/3.11/library/functions.html#int "(in Python v3.11)")
, optional[¶](https://riskfolio-lib.readthedocs.io/en/latest/plot.html#PlotFunctions.plot_bar.nrow "Permalink to this definition")
Max number of bars that be plotted. The default is 25.
cpos : [str](https://docs.python.org/3.11/library/stdtypes.html#str "(in Python v3.11)")
, optional[¶](https://riskfolio-lib.readthedocs.io/en/latest/plot.html#PlotFunctions.plot_bar.cpos "Permalink to this definition")
Color for positives weights. The default is ‘tab:green’.
cneg : [str](https://docs.python.org/3.11/library/stdtypes.html#str "(in Python v3.11)")
, optional[¶](https://riskfolio-lib.readthedocs.io/en/latest/plot.html#PlotFunctions.plot_bar.cneg "Permalink to this definition")
Color for negatives weights. The default is ‘darkorange’.
cothers : [str](https://docs.python.org/3.11/library/stdtypes.html#str "(in Python v3.11)")
, optional[¶](https://riskfolio-lib.readthedocs.io/en/latest/plot.html#PlotFunctions.plot_bar.cothers "Permalink to this definition")
Color for others bar. The default is ‘dodgerblue’.
height : [float](https://docs.python.org/3.11/library/functions.html#float "(in Python v3.11)")
, optional[¶](https://riskfolio-lib.readthedocs.io/en/latest/plot.html#PlotFunctions.plot_bar.height "Permalink to this definition")
Height of the image in inches. The default is 10.
width : [float](https://docs.python.org/3.11/library/functions.html#float "(in Python v3.11)")
, optional[¶](https://riskfolio-lib.readthedocs.io/en/latest/plot.html#PlotFunctions.plot_bar.width "Permalink to this definition")
Width of the image in inches. The default is 10.
ax : matplotlib axis, optional[¶](https://riskfolio-lib.readthedocs.io/en/latest/plot.html#PlotFunctions.plot_bar.ax "Permalink to this definition")
If provided, plot on this axis. The default is None.
Raises:[¶](https://riskfolio-lib.readthedocs.io/en/latest/plot.html#PlotFunctions.plot_bar-raises "Permalink to this headline")
[**ValueError**](https://docs.python.org/3.11/library/exceptions.html#ValueError "(in Python v3.11)")
– When the value cannot be calculated.
Returns:[¶](https://riskfolio-lib.readthedocs.io/en/latest/plot.html#PlotFunctions.plot_bar-returns "Permalink to this headline")
**ax** – Returns the Axes object with the plot for further tweaking.
Return type:[¶](https://riskfolio-lib.readthedocs.io/en/latest/plot.html#PlotFunctions.plot_bar-return-type "Permalink to this headline")
matplotlib axis.
Example
`ax = rp.plot_bar(w1, title='Portfolio', kind="v", others=0.05, nrow=25, height=6, width=10, ax=None)`
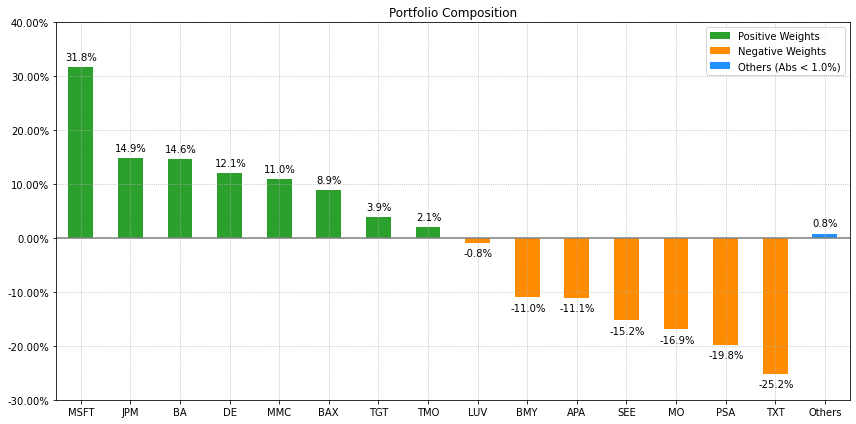
PlotFunctions.plot\_frontier\_area(_[w\_frontier](https://riskfolio-lib.readthedocs.io/en/latest/plot.html#PlotFunctions.plot_frontier_area.w_frontier "PlotFunctions.plot_frontier_area.w_frontier (Python parameter) — Weights of portfolios in the efficient frontier.")
_, _[nrow](https://riskfolio-lib.readthedocs.io/en/latest/plot.html#PlotFunctions.plot_frontier_area.nrow "PlotFunctions.plot_frontier_area.nrow (Python parameter) — Number of rows of the legend.")
\=`25`_, _[cmap](https://riskfolio-lib.readthedocs.io/en/latest/plot.html#PlotFunctions.plot_frontier_area.cmap "PlotFunctions.plot_frontier_area.cmap (Python parameter) — Color scale used to plot each asset weight. The default is 'tab20'.")
\=`'tab20'`_, _[n\_colors](https://riskfolio-lib.readthedocs.io/en/latest/plot.html#PlotFunctions.plot_frontier_area.n_colors "PlotFunctions.plot_frontier_area.n_colors (Python parameter) — Number of distinct colors per color cycle.")
\=`20`_, _[height](https://riskfolio-lib.readthedocs.io/en/latest/plot.html#PlotFunctions.plot_frontier_area.height "PlotFunctions.plot_frontier_area.height (Python parameter) — Height of the image in inches.")
\=`6`_, _[width](https://riskfolio-lib.readthedocs.io/en/latest/plot.html#PlotFunctions.plot_frontier_area.width "PlotFunctions.plot_frontier_area.width (Python parameter) — Width of the image in inches.")
\=`10`_, _[ax](https://riskfolio-lib.readthedocs.io/en/latest/plot.html#PlotFunctions.plot_frontier_area.ax "PlotFunctions.plot_frontier_area.ax (Python parameter) — If provided, plot on this axis.")
\=`None`_)[\[source\]](https://riskfolio-lib.readthedocs.io/en/latest/_modules/PlotFunctions.html#plot_frontier_area)
[¶](https://riskfolio-lib.readthedocs.io/en/latest/plot.html#PlotFunctions.plot_frontier_area "Link to this definition")
Create a chart with the asset composition of the efficient frontier.
Parameters:[¶](https://riskfolio-lib.readthedocs.io/en/latest/plot.html#PlotFunctions.plot_frontier_area-parameters "Permalink to this headline")
w\_frontier : DataFrame[¶](https://riskfolio-lib.readthedocs.io/en/latest/plot.html#PlotFunctions.plot_frontier_area.w_frontier "Permalink to this definition")
Weights of portfolios in the efficient frontier.
nrow : [int](https://docs.python.org/3.11/library/functions.html#int "(in Python v3.11)")
, optional[¶](https://riskfolio-lib.readthedocs.io/en/latest/plot.html#PlotFunctions.plot_frontier_area.nrow "Permalink to this definition")
Number of rows of the legend. The default is 25.
cmap : cmap, optional[¶](https://riskfolio-lib.readthedocs.io/en/latest/plot.html#PlotFunctions.plot_frontier_area.cmap "Permalink to this definition")
Color scale used to plot each asset weight. The default is ‘tab20’.
n\_colors : [int](https://docs.python.org/3.11/library/functions.html#int "(in Python v3.11)")
, optional[¶](https://riskfolio-lib.readthedocs.io/en/latest/plot.html#PlotFunctions.plot_frontier_area.n_colors "Permalink to this definition")
Number of distinct colors per color cycle. If there are more assets than n\_colors, the chart is going to start to repeat the color cycle. The default is 20.
height : [float](https://docs.python.org/3.11/library/functions.html#float "(in Python v3.11)")
, optional[¶](https://riskfolio-lib.readthedocs.io/en/latest/plot.html#PlotFunctions.plot_frontier_area.height "Permalink to this definition")
Height of the image in inches. The default is 6.
width : [float](https://docs.python.org/3.11/library/functions.html#float "(in Python v3.11)")
, optional[¶](https://riskfolio-lib.readthedocs.io/en/latest/plot.html#PlotFunctions.plot_frontier_area.width "Permalink to this definition")
Width of the image in inches. The default is 10.
ax : matplotlib axis, optional[¶](https://riskfolio-lib.readthedocs.io/en/latest/plot.html#PlotFunctions.plot_frontier_area.ax "Permalink to this definition")
If provided, plot on this axis. The default is None.
Raises:[¶](https://riskfolio-lib.readthedocs.io/en/latest/plot.html#PlotFunctions.plot_frontier_area-raises "Permalink to this headline")
[**ValueError**](https://docs.python.org/3.11/library/exceptions.html#ValueError "(in Python v3.11)")
– When the value cannot be calculated.
Returns:[¶](https://riskfolio-lib.readthedocs.io/en/latest/plot.html#PlotFunctions.plot_frontier_area-returns "Permalink to this headline")
**ax** – Returns the Axes object with the plot for further tweaking.
Return type:[¶](https://riskfolio-lib.readthedocs.io/en/latest/plot.html#PlotFunctions.plot_frontier_area-return-type "Permalink to this headline")
matplotlib axis.
Example
`ax = rp.plot_frontier_area(w_frontier=ws, cmap="tab20", height=6, width=10, ax=None)`
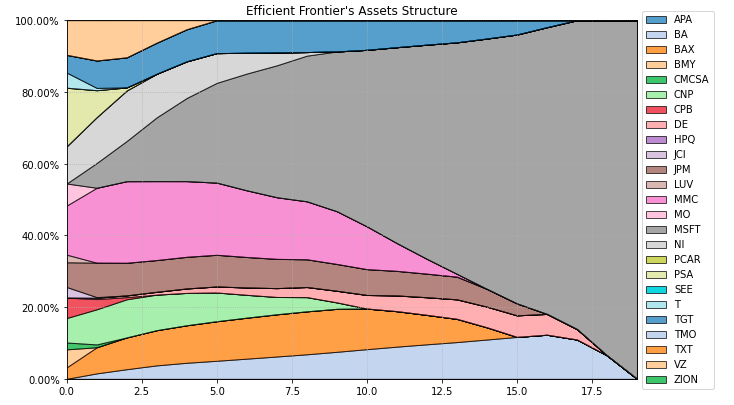
PlotFunctions.plot\_risk\_con(_[w](https://riskfolio-lib.readthedocs.io/en/latest/plot.html#PlotFunctions.plot_risk_con.w "PlotFunctions.plot_risk_con.w (Python parameter) — Portfolio weights, where n_assets is the number of assets.")
_, _[returns](https://riskfolio-lib.readthedocs.io/en/latest/plot.html#PlotFunctions.plot_risk_con.returns "PlotFunctions.plot_risk_con.returns (Python parameter) — Assets returns DataFrame, where n_samples is the number of observations and n_assets is the number of assets.")
_, _[cov](https://riskfolio-lib.readthedocs.io/en/latest/plot.html#PlotFunctions.plot_risk_con.cov "PlotFunctions.plot_risk_con.cov (Python parameter) — Covariance matrix, where n_assets is the number of assets.")
\=`None`_, _[asset\_classes](https://riskfolio-lib.readthedocs.io/en/latest/plot.html#PlotFunctions.plot_risk_con.asset_classes "PlotFunctions.plot_risk_con.asset_classes (Python parameter) — Asset's classes DataFrame, where n_assets is the number of assets and n_cols is the number of columns of the DataFrame where the first column is the asset list and the next columns are the different asset's classes sets.")
\=`None`_, _[classes\_col](https://riskfolio-lib.readthedocs.io/en/latest/plot.html#PlotFunctions.plot_risk_con.classes_col "PlotFunctions.plot_risk_con.classes_col (Python parameter) — If value is str, it is the column name of the set of classes from asset_classes dataframe.")
\=`None`_, _[rm](https://riskfolio-lib.readthedocs.io/en/latest/plot.html#PlotFunctions.plot_risk_con.rm "PlotFunctions.plot_risk_con.rm (Python parameter) — Risk measure used to estimate risk contribution. The default is 'MV'.")
\=`'MV'`_, _[rf](https://riskfolio-lib.readthedocs.io/en/latest/plot.html#PlotFunctions.plot_risk_con.rf "PlotFunctions.plot_risk_con.rf (Python parameter) — Risk free rate or minimum acceptable return.")
\=`0`_, _[alpha](https://riskfolio-lib.readthedocs.io/en/latest/plot.html#PlotFunctions.plot_risk_con.alpha "PlotFunctions.plot_risk_con.alpha (Python parameter) — Significance level of VaR, CVaR, Tail Gini, EVaR, RLVaR, CDaR, EDaR and RLDaR.")
\=`0.05`_, _[a\_sim](https://riskfolio-lib.readthedocs.io/en/latest/plot.html#PlotFunctions.plot_risk_con.a_sim "PlotFunctions.plot_risk_con.a_sim (Python parameter) — Number of CVaRs used to approximate Tail Gini of losses.")
\=`100`_, _[beta](https://riskfolio-lib.readthedocs.io/en/latest/plot.html#PlotFunctions.plot_risk_con.beta "PlotFunctions.plot_risk_con.beta (Python parameter) — Significance level of CVaR and Tail Gini of gains.")
\=`None`_, _[b\_sim](https://riskfolio-lib.readthedocs.io/en/latest/plot.html#PlotFunctions.plot_risk_con.b_sim "PlotFunctions.plot_risk_con.b_sim (Python parameter) — Number of CVaRs used to approximate Tail Gini of gains.")
\=`None`_, _[kappa](https://riskfolio-lib.readthedocs.io/en/latest/plot.html#PlotFunctions.plot_risk_con.kappa "PlotFunctions.plot_risk_con.kappa (Python parameter) — Deformation parameter of RLVaR and RLDaR for losses, must be between 0 and 1.")
\=`0.3`_, _[kappa\_g](https://riskfolio-lib.readthedocs.io/en/latest/plot.html#PlotFunctions.plot_risk_con.kappa_g "PlotFunctions.plot_risk_con.kappa_g (Python parameter) — Deformation parameter of RLVaR for gains, must be between 0 and 1. The default is None.")
\=`None`_, _[solver](https://riskfolio-lib.readthedocs.io/en/latest/plot.html#PlotFunctions.plot_risk_con.solver "PlotFunctions.plot_risk_con.solver (Python parameter) — Solver available for CVXPY that supports power cone programming.")
\=`'CLARABEL'`_, _[percentage](https://riskfolio-lib.readthedocs.io/en/latest/plot.html#PlotFunctions.plot_risk_con.percentage "PlotFunctions.plot_risk_con.percentage (Python parameter) — If risk contribution per asset is expressed as percentage or as a value.")
\=`False`_, _[erc\_line](https://riskfolio-lib.readthedocs.io/en/latest/plot.html#PlotFunctions.plot_risk_con.erc_line "PlotFunctions.plot_risk_con.erc_line (Python parameter) — If equal risk contribution line is plotted. The default is False.")
\=`True`_, _[color](https://riskfolio-lib.readthedocs.io/en/latest/plot.html#PlotFunctions.plot_risk_con.color "PlotFunctions.plot_risk_con.color (Python parameter) — Color used to plot each asset risk contribution. The default is 'tab:blue'.")
\=`'tab:blue'`_, _[erc\_linecolor](https://riskfolio-lib.readthedocs.io/en/latest/plot.html#PlotFunctions.plot_risk_con.erc_linecolor "PlotFunctions.plot_risk_con.erc_linecolor (Python parameter) — Color used to plot equal risk contribution line. The default is 'r'.")
\=`'r'`_, _[height](https://riskfolio-lib.readthedocs.io/en/latest/plot.html#PlotFunctions.plot_risk_con.height "PlotFunctions.plot_risk_con.height (Python parameter) — Height of the image in inches.")
\=`6`_, _[width](https://riskfolio-lib.readthedocs.io/en/latest/plot.html#PlotFunctions.plot_risk_con.width "PlotFunctions.plot_risk_con.width (Python parameter) — Width of the image in inches.")
\=`10`_, _[t\_factor](https://riskfolio-lib.readthedocs.io/en/latest/plot.html#PlotFunctions.plot_risk_con.t_factor "PlotFunctions.plot_risk_con.t_factor (Python parameter) — Factor used to annualize expected return and expected risks for risk measures based on returns (not drawdowns).")
\=`252`_, _[ax](https://riskfolio-lib.readthedocs.io/en/latest/plot.html#PlotFunctions.plot_risk_con.ax "PlotFunctions.plot_risk_con.ax (Python parameter) — If provided, plot on this axis.")
\=`None`_)[\[source\]](https://riskfolio-lib.readthedocs.io/en/latest/_modules/PlotFunctions.html#plot_risk_con)
[¶](https://riskfolio-lib.readthedocs.io/en/latest/plot.html#PlotFunctions.plot_risk_con "Link to this definition")
Create a chart with the risk contribution per asset of the portfolio.
Parameters:[¶](https://riskfolio-lib.readthedocs.io/en/latest/plot.html#PlotFunctions.plot_risk_con-parameters "Permalink to this headline")
w : DataFrame or Series of shape (n\_assets, 1)[¶](https://riskfolio-lib.readthedocs.io/en/latest/plot.html#PlotFunctions.plot_risk_con.w "Permalink to this definition")
Portfolio weights, where n\_assets is the number of assets.
returns : DataFrame of shape (n\_samples, n\_assets)[¶](https://riskfolio-lib.readthedocs.io/en/latest/plot.html#PlotFunctions.plot_risk_con.returns "Permalink to this definition")
Assets returns DataFrame, where n\_samples is the number of observations and n\_assets is the number of assets.
cov : DataFrame of shape (n\_assets, n\_assets)[¶](https://riskfolio-lib.readthedocs.io/en/latest/plot.html#PlotFunctions.plot_risk_con.cov "Permalink to this definition")
Covariance matrix, where n\_assets is the number of assets.
asset\_classes : DataFrame of shape (n\_assets, n\_cols)[¶](https://riskfolio-lib.readthedocs.io/en/latest/plot.html#PlotFunctions.plot_risk_con.asset_classes "Permalink to this definition")
Asset’s classes DataFrame, where n\_assets is the number of assets and n\_cols is the number of columns of the DataFrame where the first column is the asset list and the next columns are the different asset’s classes sets. It is only used when kind value is ‘classes’. The default value is None.
classes\_col : [str](https://docs.python.org/3.11/library/stdtypes.html#str "(in Python v3.11)")
or [int](https://docs.python.org/3.11/library/functions.html#int "(in Python v3.11)")
[¶](https://riskfolio-lib.readthedocs.io/en/latest/plot.html#PlotFunctions.plot_risk_con.classes_col "Permalink to this definition")
If value is str, it is the column name of the set of classes from asset\_classes dataframe. If value is int, it is the column number of the set of classes from asset\_classes dataframe. The default value is None.
rm : [str](https://docs.python.org/3.11/library/stdtypes.html#str "(in Python v3.11)")
, optional[¶](https://riskfolio-lib.readthedocs.io/en/latest/plot.html#PlotFunctions.plot_risk_con.rm "Permalink to this definition")
Risk measure used to estimate risk contribution. The default is ‘MV’. Possible values are:
* ’MV’: Standard Deviation.
* ’KT’: Square Root Kurtosis.
* ’MAD’: Mean Absolute Deviation.
* ’GMD’: Gini Mean Difference.
* ’MSV’: Semi Standard Deviation.
* ’SKT’: Square Root Semi Kurtosis.
* ’FLPM’: First Lower Partial Moment (Omega Ratio).
* ’SLPM’: Second Lower Partial Moment (Sortino Ratio).
* ’CVaR’: Conditional Value at Risk.
* ’TG’: Tail Gini.
* ’EVaR’: Entropic Value at Risk.
* ’RLVaR’: Relativistic Value at Risk.
* ’WR’: Worst Realization (Minimax).
* ’CVRG’: CVaR range of returns.
* ’TGRG’: Tail Gini range of returns.
* ’EVRG’: EVaR range of returns.
* ’RVRG’: RLVaR range of returns.
* ’RG’: Range of returns.
* ’MDD’: Maximum Drawdown of uncompounded cumulative returns (Calmar Ratio).
* ’ADD’: Average Drawdown of uncompounded cumulative returns.
* ’CDaR’: Conditional Drawdown at Risk of uncompounded cumulative returns.
* ’EDaR’: Entropic Drawdown at Risk of uncompounded cumulative returns.
* ’RLDaR’: Relativistic Drawdown at Risk of uncompounded cumulative returns.
* ’UCI’: Ulcer Index of uncompounded cumulative returns.
rf : [float](https://docs.python.org/3.11/library/functions.html#float "(in Python v3.11)")
, optional[¶](https://riskfolio-lib.readthedocs.io/en/latest/plot.html#PlotFunctions.plot_risk_con.rf "Permalink to this definition")
Risk free rate or minimum acceptable return. The default is 0.
alpha : [float](https://docs.python.org/3.11/library/functions.html#float "(in Python v3.11)")
, optional[¶](https://riskfolio-lib.readthedocs.io/en/latest/plot.html#PlotFunctions.plot_risk_con.alpha "Permalink to this definition")
Significance level of VaR, CVaR, Tail Gini, EVaR, RLVaR, CDaR, EDaR and RLDaR. The default is 0.05.
a\_sim : [float](https://docs.python.org/3.11/library/functions.html#float "(in Python v3.11)")
, optional[¶](https://riskfolio-lib.readthedocs.io/en/latest/plot.html#PlotFunctions.plot_risk_con.a_sim "Permalink to this definition")
Number of CVaRs used to approximate Tail Gini of losses. The default is 100.
beta : [float](https://docs.python.org/3.11/library/functions.html#float "(in Python v3.11)")
, optional[¶](https://riskfolio-lib.readthedocs.io/en/latest/plot.html#PlotFunctions.plot_risk_con.beta "Permalink to this definition")
Significance level of CVaR and Tail Gini of gains. If None it duplicates alpha value. The default is None.
b\_sim : [float](https://docs.python.org/3.11/library/functions.html#float "(in Python v3.11)")
, optional[¶](https://riskfolio-lib.readthedocs.io/en/latest/plot.html#PlotFunctions.plot_risk_con.b_sim "Permalink to this definition")
Number of CVaRs used to approximate Tail Gini of gains. If None it duplicates a\_sim value. The default is None.
kappa : [float](https://docs.python.org/3.11/library/functions.html#float "(in Python v3.11)")
, optional[¶](https://riskfolio-lib.readthedocs.io/en/latest/plot.html#PlotFunctions.plot_risk_con.kappa "Permalink to this definition")
Deformation parameter of RLVaR and RLDaR for losses, must be between 0 and 1. The default is 0.30.
kappa\_g : [float](https://docs.python.org/3.11/library/functions.html#float "(in Python v3.11)")
, optional[¶](https://riskfolio-lib.readthedocs.io/en/latest/plot.html#PlotFunctions.plot_risk_con.kappa_g "Permalink to this definition")
Deformation parameter of RLVaR for gains, must be between 0 and 1. The default is None.
solver : [str](https://docs.python.org/3.11/library/stdtypes.html#str "(in Python v3.11)")
, optional[¶](https://riskfolio-lib.readthedocs.io/en/latest/plot.html#PlotFunctions.plot_risk_con.solver "Permalink to this definition")
Solver available for CVXPY that supports power cone programming. Used to calculate RLVaR and RLDaR. The default value is ‘CLARABEL’.
percentage : [bool](https://docs.python.org/3.11/library/functions.html#bool "(in Python v3.11)")
, optional[¶](https://riskfolio-lib.readthedocs.io/en/latest/plot.html#PlotFunctions.plot_risk_con.percentage "Permalink to this definition")
If risk contribution per asset is expressed as percentage or as a value. The default is False.
erc\_line : [bool](https://docs.python.org/3.11/library/functions.html#bool "(in Python v3.11)")
, optional[¶](https://riskfolio-lib.readthedocs.io/en/latest/plot.html#PlotFunctions.plot_risk_con.erc_line "Permalink to this definition")
If equal risk contribution line is plotted. The default is False.
color : [str](https://docs.python.org/3.11/library/stdtypes.html#str "(in Python v3.11)")
, optional[¶](https://riskfolio-lib.readthedocs.io/en/latest/plot.html#PlotFunctions.plot_risk_con.color "Permalink to this definition")
Color used to plot each asset risk contribution. The default is ‘tab:blue’.
erc\_linecolor : [str](https://docs.python.org/3.11/library/stdtypes.html#str "(in Python v3.11)")
, optional[¶](https://riskfolio-lib.readthedocs.io/en/latest/plot.html#PlotFunctions.plot_risk_con.erc_linecolor "Permalink to this definition")
Color used to plot equal risk contribution line. The default is ‘r’.
height : [float](https://docs.python.org/3.11/library/functions.html#float "(in Python v3.11)")
, optional[¶](https://riskfolio-lib.readthedocs.io/en/latest/plot.html#PlotFunctions.plot_risk_con.height "Permalink to this definition")
Height of the image in inches. The default is 6.
width : [float](https://docs.python.org/3.11/library/functions.html#float "(in Python v3.11)")
, optional[¶](https://riskfolio-lib.readthedocs.io/en/latest/plot.html#PlotFunctions.plot_risk_con.width "Permalink to this definition")
Width of the image in inches. The default is 10.
t\_factor : [float](https://docs.python.org/3.11/library/functions.html#float "(in Python v3.11)")
, optional[¶](https://riskfolio-lib.readthedocs.io/en/latest/plot.html#PlotFunctions.plot_risk_con.t_factor "Permalink to this definition")
Factor used to annualize expected return and expected risks for risk measures based on returns (not drawdowns). The default is 252.
Annualized Return\=Return×t\_factorAnnualized Risk\=Risk×t\_factor
ax : matplotlib axis, optional[¶](https://riskfolio-lib.readthedocs.io/en/latest/plot.html#PlotFunctions.plot_risk_con.ax "Permalink to this definition")
If provided, plot on this axis. The default is None.
Raises:[¶](https://riskfolio-lib.readthedocs.io/en/latest/plot.html#PlotFunctions.plot_risk_con-raises "Permalink to this headline")
[**ValueError**](https://docs.python.org/3.11/library/exceptions.html#ValueError "(in Python v3.11)")
– When the value cannot be calculated.
Returns:[¶](https://riskfolio-lib.readthedocs.io/en/latest/plot.html#PlotFunctions.plot_risk_con-returns "Permalink to this headline")
**ax** – Returns the Axes object with the plot for further tweaking.
Return type:[¶](https://riskfolio-lib.readthedocs.io/en/latest/plot.html#PlotFunctions.plot_risk_con-return-type "Permalink to this headline")
matplotlib axis.
Example
`ax = rp.plot_risk_con(w=w2, cov=cov, returns=Y, rm=rm, rf=0, alpha=0.05, color="tab:blue", height=6, width=10, t_factor=252, ax=None)`
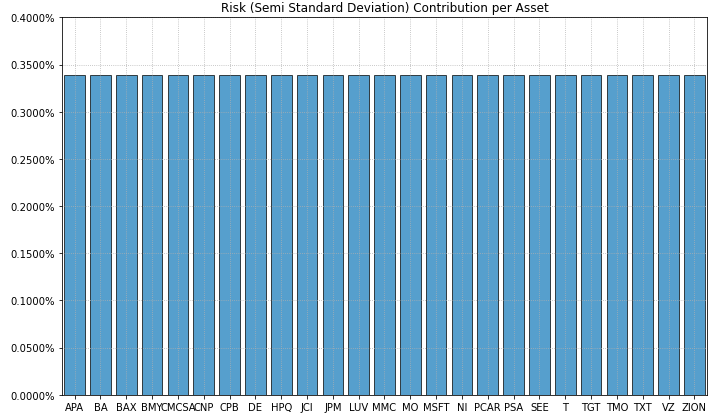
PlotFunctions.plot\_factor\_risk\_con(_[w](https://riskfolio-lib.readthedocs.io/en/latest/plot.html#PlotFunctions.plot_factor_risk_con.w "PlotFunctions.plot_factor_risk_con.w (Python parameter) — Portfolio weights, where n_assets is the number of assets.")
_, _[returns](https://riskfolio-lib.readthedocs.io/en/latest/plot.html#PlotFunctions.plot_factor_risk_con.returns "PlotFunctions.plot_factor_risk_con.returns (Python parameter) — Assets returns DataFrame, where n_samples is the number of observations and n_assets is the number of assets.")
_, _[factors](https://riskfolio-lib.readthedocs.io/en/latest/plot.html#PlotFunctions.plot_factor_risk_con.factors "PlotFunctions.plot_factor_risk_con.factors (Python parameter) — Risk factors returns DataFrame, where n_samples is the number of samples and n_factors is the number of factors.")
_, _[cov](https://riskfolio-lib.readthedocs.io/en/latest/plot.html#PlotFunctions.plot_factor_risk_con.cov "PlotFunctions.plot_factor_risk_con.cov (Python parameter) — Covariance matrix, where n_assets is the number of assets.")
\=`None`_, _[B](https://riskfolio-lib.readthedocs.io/en/latest/plot.html#PlotFunctions.plot_factor_risk_con.B "PlotFunctions.plot_factor_risk_con.B (Python parameter) — Loadings matrix, where n_assets is the number assets and n_factors is the number of risk factors.")
\=`None`_, _[const](https://riskfolio-lib.readthedocs.io/en/latest/plot.html#PlotFunctions.plot_factor_risk_con.const "PlotFunctions.plot_factor_risk_con.const (Python parameter) — Indicate if the loadings matrix has a constant. The default is False.")
\=`True`_, _[rm](https://riskfolio-lib.readthedocs.io/en/latest/plot.html#PlotFunctions.plot_factor_risk_con.rm "PlotFunctions.plot_factor_risk_con.rm (Python parameter) — Risk measure used to estimate risk contribution. The default is 'MV'.")
\=`'MV'`_, _[rf](https://riskfolio-lib.readthedocs.io/en/latest/plot.html#PlotFunctions.plot_factor_risk_con.rf "PlotFunctions.plot_factor_risk_con.rf (Python parameter) — Risk free rate or minimum acceptable return.")
\=`0`_, _[alpha](https://riskfolio-lib.readthedocs.io/en/latest/plot.html#PlotFunctions.plot_factor_risk_con.alpha "PlotFunctions.plot_factor_risk_con.alpha (Python parameter) — Significance level of VaR, CVaR, Tail Gini, EVaR, RLVaR, CDaR, EDaR and RLDaR.")
\=`0.05`_, _[a\_sim](https://riskfolio-lib.readthedocs.io/en/latest/plot.html#PlotFunctions.plot_factor_risk_con.a_sim "PlotFunctions.plot_factor_risk_con.a_sim (Python parameter) — Number of CVaRs used to approximate Tail Gini of losses.")
\=`100`_, _[beta](https://riskfolio-lib.readthedocs.io/en/latest/plot.html#PlotFunctions.plot_factor_risk_con.beta "PlotFunctions.plot_factor_risk_con.beta (Python parameter) — Significance level of CVaR and Tail Gini of gains.")
\=`None`_, _[b\_sim](https://riskfolio-lib.readthedocs.io/en/latest/plot.html#PlotFunctions.plot_factor_risk_con.b_sim "PlotFunctions.plot_factor_risk_con.b_sim (Python parameter) — Number of CVaRs used to approximate Tail Gini of gains.")
\=`None`_, _[kappa](https://riskfolio-lib.readthedocs.io/en/latest/plot.html#PlotFunctions.plot_factor_risk_con.kappa "PlotFunctions.plot_factor_risk_con.kappa (Python parameter) — Deformation parameter of RLVaR and RLDaR for losses, must be between 0 and 1.")
\=`0.3`_, _[kappa\_g](https://riskfolio-lib.readthedocs.io/en/latest/plot.html#PlotFunctions.plot_factor_risk_con.kappa_g "PlotFunctions.plot_factor_risk_con.kappa_g (Python parameter) — Deformation parameter of RLVaR for gains, must be between 0 and 1. The default is None.")
\=`None`_, _[solver](https://riskfolio-lib.readthedocs.io/en/latest/plot.html#PlotFunctions.plot_factor_risk_con.solver "PlotFunctions.plot_factor_risk_con.solver (Python parameter) — Solver available for CVXPY that supports power cone programming.")
\=`'CLARABEL'`_, _[feature\_selection](https://riskfolio-lib.readthedocs.io/en/latest/plot.html#PlotFunctions.plot_factor_risk_con.feature_selection "PlotFunctions.plot_factor_risk_con.feature_selection (Python parameter) — Indicate the method used to estimate the loadings matrix. The default is 'stepwise'.")
\=`'stepwise'`_, _[stepwise](https://riskfolio-lib.readthedocs.io/en/latest/plot.html#PlotFunctions.plot_factor_risk_con.stepwise "PlotFunctions.plot_factor_risk_con.stepwise (Python parameter) — Indicate the method used for stepwise regression. The default is 'Forward'.")
\=`'Forward'`_, _[criterion](https://riskfolio-lib.readthedocs.io/en/latest/plot.html#PlotFunctions.plot_factor_risk_con.criterion "PlotFunctions.plot_factor_risk_con.criterion (Python parameter) — The default is 'pvalue'.")
\=`'pvalue'`_, _[threshold](https://riskfolio-lib.readthedocs.io/en/latest/plot.html#PlotFunctions.plot_factor_risk_con.threshold "PlotFunctions.plot_factor_risk_con.threshold (Python parameter) — Is the maximum p-value for each variable that will be accepted in the model.")
\=`0.05`_, _[n\_components](https://riskfolio-lib.readthedocs.io/en/latest/plot.html#PlotFunctions.plot_factor_risk_con.n_components "PlotFunctions.plot_factor_risk_con.n_components (Python parameter) — if 1 < n_components (int), it represents the number of components that will be keep.")
\=`0.95`_, _[percentage](https://riskfolio-lib.readthedocs.io/en/latest/plot.html#PlotFunctions.plot_factor_risk_con.percentage "PlotFunctions.plot_factor_risk_con.percentage (Python parameter) — If risk contribution per asset is expressed as percentage or as a value.")
\=`False`_, _[erc\_line](https://riskfolio-lib.readthedocs.io/en/latest/plot.html#PlotFunctions.plot_factor_risk_con.erc_line "PlotFunctions.plot_factor_risk_con.erc_line (Python parameter) — If equal risk contribution line is plotted. The default is False.")
\=`True`_, _[color](https://riskfolio-lib.readthedocs.io/en/latest/plot.html#PlotFunctions.plot_factor_risk_con.color "PlotFunctions.plot_factor_risk_con.color (Python parameter) — Color used to plot each asset risk contribution. The default is 'tab:orange'.")
\=`'tab:orange'`_, _[erc\_linecolor](https://riskfolio-lib.readthedocs.io/en/latest/plot.html#PlotFunctions.plot_factor_risk_con.erc_linecolor "PlotFunctions.plot_factor_risk_con.erc_linecolor (Python parameter) — Color used to plot equal risk contribution line. The default is 'r'.")
\=`'r'`_, _[height](https://riskfolio-lib.readthedocs.io/en/latest/plot.html#PlotFunctions.plot_factor_risk_con.height "PlotFunctions.plot_factor_risk_con.height (Python parameter) — Height of the image in inches.")
\=`6`_, _[width](https://riskfolio-lib.readthedocs.io/en/latest/plot.html#PlotFunctions.plot_factor_risk_con.width "PlotFunctions.plot_factor_risk_con.width (Python parameter) — Width of the image in inches.")
\=`10`_, _[t\_factor](https://riskfolio-lib.readthedocs.io/en/latest/plot.html#PlotFunctions.plot_factor_risk_con.t_factor "PlotFunctions.plot_factor_risk_con.t_factor (Python parameter) — Factor used to annualize expected return and expected risks for risk measures based on returns (not drawdowns).")
\=`252`_, _[ax](https://riskfolio-lib.readthedocs.io/en/latest/plot.html#PlotFunctions.plot_factor_risk_con.ax "PlotFunctions.plot_factor_risk_con.ax (Python parameter) — If provided, plot on this axis.")
\=`None`_)[\[source\]](https://riskfolio-lib.readthedocs.io/en/latest/_modules/PlotFunctions.html#plot_factor_risk_con)
[¶](https://riskfolio-lib.readthedocs.io/en/latest/plot.html#PlotFunctions.plot_factor_risk_con "Link to this definition")
Create a chart with the risk contribution per risk factor of the portfolio.
Parameters:[¶](https://riskfolio-lib.readthedocs.io/en/latest/plot.html#PlotFunctions.plot_factor_risk_con-parameters "Permalink to this headline")
w : DataFrame or Series of shape (n\_assets, 1)[¶](https://riskfolio-lib.readthedocs.io/en/latest/plot.html#PlotFunctions.plot_factor_risk_con.w "Permalink to this definition")
Portfolio weights, where n\_assets is the number of assets.
cov : DataFrame of shape (n\_assets, n\_assets)[¶](https://riskfolio-lib.readthedocs.io/en/latest/plot.html#PlotFunctions.plot_factor_risk_con.cov "Permalink to this definition")
Covariance matrix, where n\_assets is the number of assets.
returns : DataFrame of shape (n\_samples, n\_assets)[¶](https://riskfolio-lib.readthedocs.io/en/latest/plot.html#PlotFunctions.plot_factor_risk_con.returns "Permalink to this definition")
Assets returns DataFrame, where n\_samples is the number of observations and n\_assets is the number of assets.
factors : DataFrame or nd-array of shape (n\_samples, n\_factors)[¶](https://riskfolio-lib.readthedocs.io/en/latest/plot.html#PlotFunctions.plot_factor_risk_con.factors "Permalink to this definition")
Risk factors returns DataFrame, where n\_samples is the number of samples and n\_factors is the number of factors.
B : DataFrame of shape (n\_assets, n\_factors), optional[¶](https://riskfolio-lib.readthedocs.io/en/latest/plot.html#PlotFunctions.plot_factor_risk_con.B "Permalink to this definition")
Loadings matrix, where n\_assets is the number assets and n\_factors is the number of risk factors. If is not specified, is estimated using stepwise regression. The default is None.
const : [bool](https://docs.python.org/3.11/library/functions.html#bool "(in Python v3.11)")
, optional[¶](https://riskfolio-lib.readthedocs.io/en/latest/plot.html#PlotFunctions.plot_factor_risk_con.const "Permalink to this definition")
Indicate if the loadings matrix has a constant. The default is False.
rm : [str](https://docs.python.org/3.11/library/stdtypes.html#str "(in Python v3.11)")
, optional[¶](https://riskfolio-lib.readthedocs.io/en/latest/plot.html#PlotFunctions.plot_factor_risk_con.rm "Permalink to this definition")
Risk measure used to estimate risk contribution. The default is ‘MV’. Possible values are:
* ’MV’: Standard Deviation.
* ’KT’: Square Root Kurtosis.
* ’MAD’: Mean Absolute Deviation.
* ’GMD’: Gini Mean Difference.
* ’MSV’: Semi Standard Deviation.
* ’SKT’: Square Root Semi Kurtosis.
* ’FLPM’: First Lower Partial Moment (Omega Ratio).
* ’SLPM’: Second Lower Partial Moment (Sortino Ratio).
* ’CVaR’: Conditional Value at Risk.
* ’TG’: Tail Gini.
* ’EVaR’: Entropic Value at Risk.
* ’RLVaR’: Relativistic Value at Risk.
* ’WR’: Worst Realization (Minimax).
* ’CVRG’: CVaR range of returns.
* ’TGRG’: Tail Gini range of returns.
* ’EVRG’: EVaR range of returns.
* ’RVRG’: RLVaR range of returns.
* ’RG’: Range of returns.
* ’MDD’: Maximum Drawdown of uncompounded cumulative returns (Calmar Ratio).
* ’ADD’: Average Drawdown of uncompounded cumulative returns.
* ’CDaR’: Conditional Drawdown at Risk of uncompounded cumulative returns.
* ’EDaR’: Entropic Drawdown at Risk of uncompounded cumulative returns.
* ’RLDaR’: Relativistic Drawdown at Risk of uncompounded cumulative returns.
* ’UCI’: Ulcer Index of uncompounded cumulative returns.
rf : [float](https://docs.python.org/3.11/library/functions.html#float "(in Python v3.11)")
, optional[¶](https://riskfolio-lib.readthedocs.io/en/latest/plot.html#PlotFunctions.plot_factor_risk_con.rf "Permalink to this definition")
Risk free rate or minimum acceptable return. The default is 0.
alpha : [float](https://docs.python.org/3.11/library/functions.html#float "(in Python v3.11)")
, optional[¶](https://riskfolio-lib.readthedocs.io/en/latest/plot.html#PlotFunctions.plot_factor_risk_con.alpha "Permalink to this definition")
Significance level of VaR, CVaR, Tail Gini, EVaR, RLVaR, CDaR, EDaR and RLDaR. The default is 0.05.
a\_sim : [float](https://docs.python.org/3.11/library/functions.html#float "(in Python v3.11)")
, optional[¶](https://riskfolio-lib.readthedocs.io/en/latest/plot.html#PlotFunctions.plot_factor_risk_con.a_sim "Permalink to this definition")
Number of CVaRs used to approximate Tail Gini of losses. The default is 100.
beta : [float](https://docs.python.org/3.11/library/functions.html#float "(in Python v3.11)")
, optional[¶](https://riskfolio-lib.readthedocs.io/en/latest/plot.html#PlotFunctions.plot_factor_risk_con.beta "Permalink to this definition")
Significance level of CVaR and Tail Gini of gains. If None it duplicates alpha value. The default is None.
b\_sim : [float](https://docs.python.org/3.11/library/functions.html#float "(in Python v3.11)")
, optional[¶](https://riskfolio-lib.readthedocs.io/en/latest/plot.html#PlotFunctions.plot_factor_risk_con.b_sim "Permalink to this definition")
Number of CVaRs used to approximate Tail Gini of gains. If None it duplicates a\_sim value. The default is None.
kappa : [float](https://docs.python.org/3.11/library/functions.html#float "(in Python v3.11)")
, optional[¶](https://riskfolio-lib.readthedocs.io/en/latest/plot.html#PlotFunctions.plot_factor_risk_con.kappa "Permalink to this definition")
Deformation parameter of RLVaR and RLDaR for losses, must be between 0 and 1. The default is 0.30.
kappa\_g : [float](https://docs.python.org/3.11/library/functions.html#float "(in Python v3.11)")
, optional[¶](https://riskfolio-lib.readthedocs.io/en/latest/plot.html#PlotFunctions.plot_factor_risk_con.kappa_g "Permalink to this definition")
Deformation parameter of RLVaR for gains, must be between 0 and 1. The default is None.
solver : [str](https://docs.python.org/3.11/library/stdtypes.html#str "(in Python v3.11)")
, optional[¶](https://riskfolio-lib.readthedocs.io/en/latest/plot.html#PlotFunctions.plot_factor_risk_con.solver "Permalink to this definition")
Solver available for CVXPY that supports power cone programming. Used to calculate RLVaR and RLDaR. The default value is ‘CLARABEL’.
feature\_selection : str 'stepwise' or 'PCR', optional[¶](https://riskfolio-lib.readthedocs.io/en/latest/plot.html#PlotFunctions.plot_factor_risk_con.feature_selection "Permalink to this definition")
Indicate the method used to estimate the loadings matrix. The default is ‘stepwise’.
stepwise : str 'Forward' or 'Backward', optional[¶](https://riskfolio-lib.readthedocs.io/en/latest/plot.html#PlotFunctions.plot_factor_risk_con.stepwise "Permalink to this definition")
Indicate the method used for stepwise regression. The default is ‘Forward’.
criterion : [str](https://docs.python.org/3.11/library/stdtypes.html#str "(in Python v3.11)")
, optional[¶](https://riskfolio-lib.readthedocs.io/en/latest/plot.html#PlotFunctions.plot_factor_risk_con.criterion "Permalink to this definition")
The default is ‘pvalue’. Possible values of the criterion used to select the best features are:
* ’pvalue’: select the features based on p-values.
* ’AIC’: select the features based on lowest Akaike Information Criterion.
* ’SIC’: select the features based on lowest Schwarz Information Criterion.
* ’R2’: select the features based on highest R Squared.
* ’R2\_A’: select the features based on highest Adjusted R Squared.
threshold : scalar, optional[¶](https://riskfolio-lib.readthedocs.io/en/latest/plot.html#PlotFunctions.plot_factor_risk_con.threshold "Permalink to this definition")
Is the maximum p-value for each variable that will be accepted in the model. The default is 0.05.
n\_components : [int](https://docs.python.org/3.11/library/functions.html#int "(in Python v3.11)")
, [float](https://docs.python.org/3.11/library/functions.html#float "(in Python v3.11)")
, None or [str](https://docs.python.org/3.11/library/stdtypes.html#str "(in Python v3.11)")
, optional[¶](https://riskfolio-lib.readthedocs.io/en/latest/plot.html#PlotFunctions.plot_factor_risk_con.n_components "Permalink to this definition")
if 1 < n\_components (int), it represents the number of components that will be keep. if 0 < n\_components < 1 (float), it represents the percentage of variance that the is explained by the components kept. See [PCA](https://scikit-learn.org/stable/modules/generated/sklearn.decomposition.PCA.html)
for more details. The default is 0.95.
percentage : [bool](https://docs.python.org/3.11/library/functions.html#bool "(in Python v3.11)")
, optional[¶](https://riskfolio-lib.readthedocs.io/en/latest/plot.html#PlotFunctions.plot_factor_risk_con.percentage "Permalink to this definition")
If risk contribution per asset is expressed as percentage or as a value. The default is False.
erc\_line : [bool](https://docs.python.org/3.11/library/functions.html#bool "(in Python v3.11)")
, optional[¶](https://riskfolio-lib.readthedocs.io/en/latest/plot.html#PlotFunctions.plot_factor_risk_con.erc_line "Permalink to this definition")
If equal risk contribution line is plotted. The default is False.
color : [str](https://docs.python.org/3.11/library/stdtypes.html#str "(in Python v3.11)")
, optional[¶](https://riskfolio-lib.readthedocs.io/en/latest/plot.html#PlotFunctions.plot_factor_risk_con.color "Permalink to this definition")
Color used to plot each asset risk contribution. The default is ‘tab:orange’.
erc\_linecolor : [str](https://docs.python.org/3.11/library/stdtypes.html#str "(in Python v3.11)")
, optional[¶](https://riskfolio-lib.readthedocs.io/en/latest/plot.html#PlotFunctions.plot_factor_risk_con.erc_linecolor "Permalink to this definition")
Color used to plot equal risk contribution line. The default is ‘r’.
height : [float](https://docs.python.org/3.11/library/functions.html#float "(in Python v3.11)")
, optional[¶](https://riskfolio-lib.readthedocs.io/en/latest/plot.html#PlotFunctions.plot_factor_risk_con.height "Permalink to this definition")
Height of the image in inches. The default is 6.
width : [float](https://docs.python.org/3.11/library/functions.html#float "(in Python v3.11)")
, optional[¶](https://riskfolio-lib.readthedocs.io/en/latest/plot.html#PlotFunctions.plot_factor_risk_con.width "Permalink to this definition")
Width of the image in inches. The default is 10.
t\_factor : [float](https://docs.python.org/3.11/library/functions.html#float "(in Python v3.11)")
, optional[¶](https://riskfolio-lib.readthedocs.io/en/latest/plot.html#PlotFunctions.plot_factor_risk_con.t_factor "Permalink to this definition")
Factor used to annualize expected return and expected risks for risk measures based on returns (not drawdowns). The default is 252.
Annualized Return\=Return×t\_factorAnnualized Risk\=Risk×t\_factor
ax : matplotlib axis, optional[¶](https://riskfolio-lib.readthedocs.io/en/latest/plot.html#PlotFunctions.plot_factor_risk_con.ax "Permalink to this definition")
If provided, plot on this axis. The default is None.
Raises:[¶](https://riskfolio-lib.readthedocs.io/en/latest/plot.html#PlotFunctions.plot_factor_risk_con-raises "Permalink to this headline")
[**ValueError**](https://docs.python.org/3.11/library/exceptions.html#ValueError "(in Python v3.11)")
– When the value cannot be calculated.
Returns:[¶](https://riskfolio-lib.readthedocs.io/en/latest/plot.html#PlotFunctions.plot_factor_risk_con-returns "Permalink to this headline")
**ax** – Returns the Axes object with the plot for further tweaking.
Return type:[¶](https://riskfolio-lib.readthedocs.io/en/latest/plot.html#PlotFunctions.plot_factor_risk_con-return-type "Permalink to this headline")
matplotlib axis.
Example
`ax = rp.plot_factor_risk_con(w=w3, cov=cov, returns=Y, factors=X, B=None, const=True, rm=rm, rf=0, feature_selection="stepwise", stepwise="Forward", criterion="pvalue", threshold=0.05, height=6, width=10, t_factor=252, ax=None)`
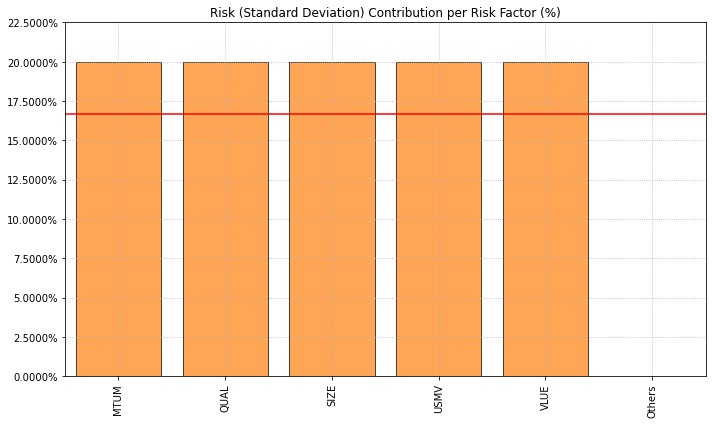
`ax = rp.plot_factor_risk_con(w=w4, cov=cov, returns=Y, factors=X, B=None, const=True, rm=rm, rf=0, feature_selection="PCR", n_components=0.95, height=6, width=10, t_factor=252, ax=None)`
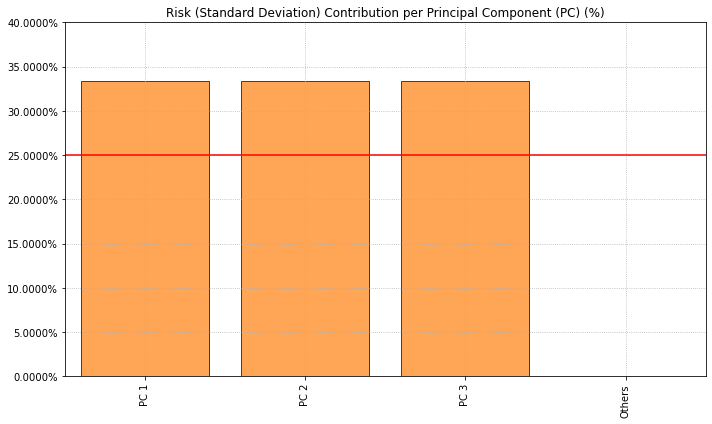
PlotFunctions.plot\_hist(_[returns](https://riskfolio-lib.readthedocs.io/en/latest/plot.html#PlotFunctions.plot_hist.returns "PlotFunctions.plot_hist.returns (Python parameter) — Assets returns DataFrame, where n_samples is the number of observations and n_assets is the number of assets.")
_, _[w](https://riskfolio-lib.readthedocs.io/en/latest/plot.html#PlotFunctions.plot_hist.w "PlotFunctions.plot_hist.w (Python parameter) — Portfolio weights, where n_assets is the number of assets.")
_, _[alpha](https://riskfolio-lib.readthedocs.io/en/latest/plot.html#PlotFunctions.plot_hist.alpha "PlotFunctions.plot_hist.alpha (Python parameter) — Significance level of VaR, CVaR, EVaR, RLVaR and Tail Gini.")
\=`0.05`_, _[a\_sim](https://riskfolio-lib.readthedocs.io/en/latest/plot.html#PlotFunctions.plot_hist.a_sim "PlotFunctions.plot_hist.a_sim (Python parameter) — Number of CVaRs used to approximate Tail Gini of losses.")
\=`100`_, _[kappa](https://riskfolio-lib.readthedocs.io/en/latest/plot.html#PlotFunctions.plot_hist.kappa "PlotFunctions.plot_hist.kappa (Python parameter) — Deformation parameter of RLVaR and RLDaR, must be between 0 and 1.")
\=`0.3`_, _[solver](https://riskfolio-lib.readthedocs.io/en/latest/plot.html#PlotFunctions.plot_hist.solver "PlotFunctions.plot_hist.solver (Python parameter) — Solver available for CVXPY that supports power cone programming.")
\=`'CLARABEL'`_, _[bins](https://riskfolio-lib.readthedocs.io/en/latest/plot.html#PlotFunctions.plot_hist.bins "PlotFunctions.plot_hist.bins (Python parameter) — Number of bins of the histogram.")
\=`50`_, _[height](https://riskfolio-lib.readthedocs.io/en/latest/plot.html#PlotFunctions.plot_hist.height "PlotFunctions.plot_hist.height (Python parameter) — Height of the image in inches.")
\=`6`_, _[width](https://riskfolio-lib.readthedocs.io/en/latest/plot.html#PlotFunctions.plot_hist.width "PlotFunctions.plot_hist.width (Python parameter) — Width of the image in inches.")
\=`10`_, _[ax](https://riskfolio-lib.readthedocs.io/en/latest/plot.html#PlotFunctions.plot_hist.ax "PlotFunctions.plot_hist.ax (Python parameter) — If provided, plot on this axis.")
\=`None`_)[\[source\]](https://riskfolio-lib.readthedocs.io/en/latest/_modules/PlotFunctions.html#plot_hist)
[¶](https://riskfolio-lib.readthedocs.io/en/latest/plot.html#PlotFunctions.plot_hist "Link to this definition")
Create a histogram of portfolio returns with the risk measures.
Parameters:[¶](https://riskfolio-lib.readthedocs.io/en/latest/plot.html#PlotFunctions.plot_hist-parameters "Permalink to this headline")
returns : DataFrame of shape (n\_samples, n\_assets)[¶](https://riskfolio-lib.readthedocs.io/en/latest/plot.html#PlotFunctions.plot_hist.returns "Permalink to this definition")
Assets returns DataFrame, where n\_samples is the number of observations and n\_assets is the number of assets.
w : DataFrame or Series of shape (n\_assets, 1)[¶](https://riskfolio-lib.readthedocs.io/en/latest/plot.html#PlotFunctions.plot_hist.w "Permalink to this definition")
Portfolio weights, where n\_assets is the number of assets.
alpha : [float](https://docs.python.org/3.11/library/functions.html#float "(in Python v3.11)")
, optional[¶](https://riskfolio-lib.readthedocs.io/en/latest/plot.html#PlotFunctions.plot_hist.alpha "Permalink to this definition")
Significance level of VaR, CVaR, EVaR, RLVaR and Tail Gini. The default is 0.05.
a\_sim : [float](https://docs.python.org/3.11/library/functions.html#float "(in Python v3.11)")
, optional[¶](https://riskfolio-lib.readthedocs.io/en/latest/plot.html#PlotFunctions.plot_hist.a_sim "Permalink to this definition")
Number of CVaRs used to approximate Tail Gini of losses. The default is 100.
kappa : [float](https://docs.python.org/3.11/library/functions.html#float "(in Python v3.11)")
, optional[¶](https://riskfolio-lib.readthedocs.io/en/latest/plot.html#PlotFunctions.plot_hist.kappa "Permalink to this definition")
Deformation parameter of RLVaR and RLDaR, must be between 0 and 1. The default is 0.30.
solver : [str](https://docs.python.org/3.11/library/stdtypes.html#str "(in Python v3.11)")
, optional[¶](https://riskfolio-lib.readthedocs.io/en/latest/plot.html#PlotFunctions.plot_hist.solver "Permalink to this definition")
Solver available for CVXPY that supports power cone programming. Used to calculate RLVaR and RLDaR. The default value is ‘CLARABEL’.
bins : [float](https://docs.python.org/3.11/library/functions.html#float "(in Python v3.11)")
, optional[¶](https://riskfolio-lib.readthedocs.io/en/latest/plot.html#PlotFunctions.plot_hist.bins "Permalink to this definition")
Number of bins of the histogram. The default is 50.
height : [float](https://docs.python.org/3.11/library/functions.html#float "(in Python v3.11)")
, optional[¶](https://riskfolio-lib.readthedocs.io/en/latest/plot.html#PlotFunctions.plot_hist.height "Permalink to this definition")
Height of the image in inches. The default is 6.
width : [float](https://docs.python.org/3.11/library/functions.html#float "(in Python v3.11)")
, optional[¶](https://riskfolio-lib.readthedocs.io/en/latest/plot.html#PlotFunctions.plot_hist.width "Permalink to this definition")
Width of the image in inches. The default is 10.
ax : matplotlib axis, optional[¶](https://riskfolio-lib.readthedocs.io/en/latest/plot.html#PlotFunctions.plot_hist.ax "Permalink to this definition")
If provided, plot on this axis. The default is None.
Raises:[¶](https://riskfolio-lib.readthedocs.io/en/latest/plot.html#PlotFunctions.plot_hist-raises "Permalink to this headline")
[**ValueError**](https://docs.python.org/3.11/library/exceptions.html#ValueError "(in Python v3.11)")
– When the value cannot be calculated.
Returns:[¶](https://riskfolio-lib.readthedocs.io/en/latest/plot.html#PlotFunctions.plot_hist-returns "Permalink to this headline")
**ax** – Returns the Axes object with the plot for further tweaking.
Return type:[¶](https://riskfolio-lib.readthedocs.io/en/latest/plot.html#PlotFunctions.plot_hist-return-type "Permalink to this headline")
matplotlib axis.
Example
`ax = rp.plot_hist(returns=Y, w=w1, alpha=0.05, bins=50, height=6, width=10, ax=None)`
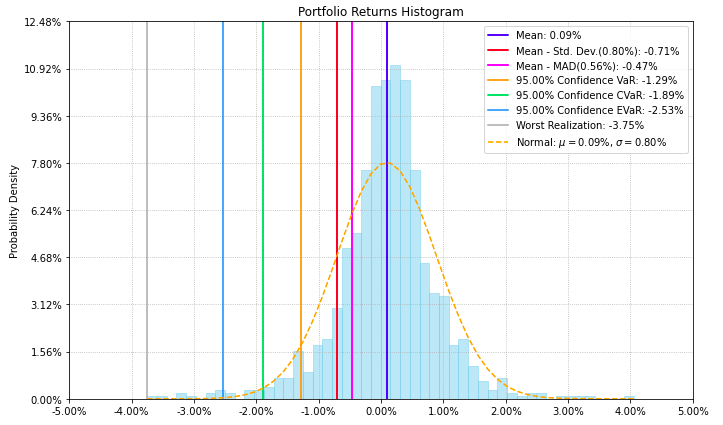
PlotFunctions.plot\_range(_[returns](https://riskfolio-lib.readthedocs.io/en/latest/plot.html#PlotFunctions.plot_range.returns "PlotFunctions.plot_range.returns (Python parameter) — Assets returns DataFrame, where n_samples is the number of observations and n_assets is the number of assets.")
_, _[w](https://riskfolio-lib.readthedocs.io/en/latest/plot.html#PlotFunctions.plot_range.w "PlotFunctions.plot_range.w (Python parameter) — Portfolio weights, where n_assets is the number of assets.")
_, _[alpha](https://riskfolio-lib.readthedocs.io/en/latest/plot.html#PlotFunctions.plot_range.alpha "PlotFunctions.plot_range.alpha (Python parameter) — Significance level of CVaR and Tail Gini of losses. The default is 0.05.")
\=`0.05`_, _[a\_sim](https://riskfolio-lib.readthedocs.io/en/latest/plot.html#PlotFunctions.plot_range.a_sim "PlotFunctions.plot_range.a_sim (Python parameter) — Number of CVaRs used to approximate Tail Gini of losses.")
\=`100`_, _[beta](https://riskfolio-lib.readthedocs.io/en/latest/plot.html#PlotFunctions.plot_range.beta "PlotFunctions.plot_range.beta (Python parameter) — Significance level of CVaR and Tail Gini of gains.")
\=`None`_, _[b\_sim](https://riskfolio-lib.readthedocs.io/en/latest/plot.html#PlotFunctions.plot_range.b_sim "PlotFunctions.plot_range.b_sim (Python parameter) — Number of CVaRs used to approximate Tail Gini of gains.")
\=`None`_, _[kappa](https://riskfolio-lib.readthedocs.io/en/latest/plot.html#PlotFunctions.plot_range "PlotFunctions.plot_range.kappa (Python parameter)")
\=`0.3`_, _[kappa\_g](https://riskfolio-lib.readthedocs.io/en/latest/plot.html#PlotFunctions.plot_range "PlotFunctions.plot_range.kappa_g (Python parameter)")
\=`0.3`_, _[solver](https://riskfolio-lib.readthedocs.io/en/latest/plot.html#PlotFunctions.plot_range "PlotFunctions.plot_range.solver (Python parameter)")
\=`'CLARABEL'`_, _[bins](https://riskfolio-lib.readthedocs.io/en/latest/plot.html#PlotFunctions.plot_range.bins "PlotFunctions.plot_range.bins (Python parameter) — Number of bins of the histogram.")
\=`50`_, _[height](https://riskfolio-lib.readthedocs.io/en/latest/plot.html#PlotFunctions.plot_range.height "PlotFunctions.plot_range.height (Python parameter) — Height of the image in inches.")
\=`6`_, _[width](https://riskfolio-lib.readthedocs.io/en/latest/plot.html#PlotFunctions.plot_range.width "PlotFunctions.plot_range.width (Python parameter) — Width of the image in inches.")
\=`10`_, _[ax](https://riskfolio-lib.readthedocs.io/en/latest/plot.html#PlotFunctions.plot_range.ax "PlotFunctions.plot_range.ax (Python parameter) — If provided, plot on this axis.")
\=`None`_)[\[source\]](https://riskfolio-lib.readthedocs.io/en/latest/_modules/PlotFunctions.html#plot_range)
[¶](https://riskfolio-lib.readthedocs.io/en/latest/plot.html#PlotFunctions.plot_range "Link to this definition")
Create a histogram of portfolio returns with the range risk measures.
Parameters:[¶](https://riskfolio-lib.readthedocs.io/en/latest/plot.html#PlotFunctions.plot_range-parameters "Permalink to this headline")
returns : DataFrame of shape (n\_samples, n\_assets)[¶](https://riskfolio-lib.readthedocs.io/en/latest/plot.html#PlotFunctions.plot_range.returns "Permalink to this definition")
Assets returns DataFrame, where n\_samples is the number of observations and n\_assets is the number of assets.
w : DataFrame or Series of shape (n\_assets, 1)[¶](https://riskfolio-lib.readthedocs.io/en/latest/plot.html#PlotFunctions.plot_range.w "Permalink to this definition")
Portfolio weights, where n\_assets is the number of assets.
alpha : [float](https://docs.python.org/3.11/library/functions.html#float "(in Python v3.11)")
, optional[¶](https://riskfolio-lib.readthedocs.io/en/latest/plot.html#PlotFunctions.plot_range.alpha "Permalink to this definition")
Significance level of CVaR and Tail Gini of losses. The default is 0.05.
a\_sim : [float](https://docs.python.org/3.11/library/functions.html#float "(in Python v3.11)")
, optional[¶](https://riskfolio-lib.readthedocs.io/en/latest/plot.html#PlotFunctions.plot_range.a_sim "Permalink to this definition")
Number of CVaRs used to approximate Tail Gini of losses. The default is 100.
beta : [float](https://docs.python.org/3.11/library/functions.html#float "(in Python v3.11)")
, optional[¶](https://riskfolio-lib.readthedocs.io/en/latest/plot.html#PlotFunctions.plot_range.beta "Permalink to this definition")
Significance level of CVaR and Tail Gini of gains. If None it duplicates alpha value. The default is None.
b\_sim : [float](https://docs.python.org/3.11/library/functions.html#float "(in Python v3.11)")
, optional[¶](https://riskfolio-lib.readthedocs.io/en/latest/plot.html#PlotFunctions.plot_range.b_sim "Permalink to this definition")
Number of CVaRs used to approximate Tail Gini of gains. If None it duplicates a\_sim value. The default is None.
bins : [float](https://docs.python.org/3.11/library/functions.html#float "(in Python v3.11)")
, optional[¶](https://riskfolio-lib.readthedocs.io/en/latest/plot.html#PlotFunctions.plot_range.bins "Permalink to this definition")
Number of bins of the histogram. The default is 50.
height : [float](https://docs.python.org/3.11/library/functions.html#float "(in Python v3.11)")
, optional[¶](https://riskfolio-lib.readthedocs.io/en/latest/plot.html#PlotFunctions.plot_range.height "Permalink to this definition")
Height of the image in inches. The default is 6.
width : [float](https://docs.python.org/3.11/library/functions.html#float "(in Python v3.11)")
, optional[¶](https://riskfolio-lib.readthedocs.io/en/latest/plot.html#PlotFunctions.plot_range.width "Permalink to this definition")
Width of the image in inches. The default is 10.
ax : matplotlib axis, optional[¶](https://riskfolio-lib.readthedocs.io/en/latest/plot.html#PlotFunctions.plot_range.ax "Permalink to this definition")
If provided, plot on this axis. The default is None.
Raises:[¶](https://riskfolio-lib.readthedocs.io/en/latest/plot.html#PlotFunctions.plot_range-raises "Permalink to this headline")
[**ValueError**](https://docs.python.org/3.11/library/exceptions.html#ValueError "(in Python v3.11)")
– When the value cannot be calculated.
Returns:[¶](https://riskfolio-lib.readthedocs.io/en/latest/plot.html#PlotFunctions.plot_range-returns "Permalink to this headline")
**ax** – Returns the Axes object with the plot for further tweaking.
Return type:[¶](https://riskfolio-lib.readthedocs.io/en/latest/plot.html#PlotFunctions.plot_range-return-type "Permalink to this headline")
matplotlib axis.
Example
`ax = rp.plot_range(returns=Y, w=w1, alpha=0.05, a_sim=100, beta=None, b_sim=None, bins=50, height=6, width=10, ax=None)`
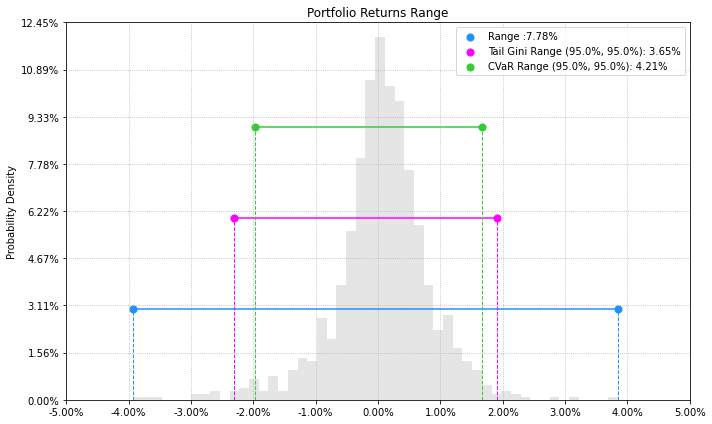
PlotFunctions.plot\_drawdown(_[returns](https://riskfolio-lib.readthedocs.io/en/latest/plot.html#PlotFunctions.plot_drawdown.returns "PlotFunctions.plot_drawdown.returns (Python parameter) — Assets returns DataFrame, where n_samples is the number of observations and n_assets is the number of assets.")
_, _[w](https://riskfolio-lib.readthedocs.io/en/latest/plot.html#PlotFunctions.plot_drawdown.w "PlotFunctions.plot_drawdown.w (Python parameter) — Portfolio weights, where n_assets is the number of assets.")
_, _[alpha](https://riskfolio-lib.readthedocs.io/en/latest/plot.html#PlotFunctions.plot_drawdown.alpha "PlotFunctions.plot_drawdown.alpha (Python parameter) — Significance level of DaR, CDaR, EDaR and RLDaR.")
\=`0.05`_, _[kappa](https://riskfolio-lib.readthedocs.io/en/latest/plot.html#PlotFunctions.plot_drawdown.kappa "PlotFunctions.plot_drawdown.kappa (Python parameter) — Deformation parameter of RLVaR and RLDaR, must be between 0 and 1.")
\=`0.3`_, _[solver](https://riskfolio-lib.readthedocs.io/en/latest/plot.html#PlotFunctions.plot_drawdown.solver "PlotFunctions.plot_drawdown.solver (Python parameter) — Solver available for CVXPY that supports power cone programming.")
\=`'CLARABEL'`_, _[height](https://riskfolio-lib.readthedocs.io/en/latest/plot.html#PlotFunctions.plot_drawdown.height "PlotFunctions.plot_drawdown.height (Python parameter) — Height of the image in inches.")
\=`8`_, _[width](https://riskfolio-lib.readthedocs.io/en/latest/plot.html#PlotFunctions.plot_drawdown.width "PlotFunctions.plot_drawdown.width (Python parameter) — Width of the image in inches.")
\=`10`_, _[height\_ratios](https://riskfolio-lib.readthedocs.io/en/latest/plot.html#PlotFunctions.plot_drawdown.height_ratios "PlotFunctions.plot_drawdown.height_ratios (Python parameter) — Defines the relative heights of the rows.")
\=`[2, 3]`_, _[ax](https://riskfolio-lib.readthedocs.io/en/latest/plot.html#PlotFunctions.plot_drawdown.ax "PlotFunctions.plot_drawdown.ax (Python parameter) — If provided, plot on this axis.")
\=`None`_)[\[source\]](https://riskfolio-lib.readthedocs.io/en/latest/_modules/PlotFunctions.html#plot_drawdown)
[¶](https://riskfolio-lib.readthedocs.io/en/latest/plot.html#PlotFunctions.plot_drawdown "Link to this definition")
Create a chart with the evolution of portfolio prices and drawdown.
Parameters:[¶](https://riskfolio-lib.readthedocs.io/en/latest/plot.html#PlotFunctions.plot_drawdown-parameters "Permalink to this headline")
returns : DataFrame of shape (n\_samples, n\_assets)[¶](https://riskfolio-lib.readthedocs.io/en/latest/plot.html#PlotFunctions.plot_drawdown.returns "Permalink to this definition")
Assets returns DataFrame, where n\_samples is the number of observations and n\_assets is the number of assets.
w : DataFrame or Series of shape (n\_assets, 1)[¶](https://riskfolio-lib.readthedocs.io/en/latest/plot.html#PlotFunctions.plot_drawdown.w "Permalink to this definition")
Portfolio weights, where n\_assets is the number of assets.
alpha : [float](https://docs.python.org/3.11/library/functions.html#float "(in Python v3.11)")
, optional[¶](https://riskfolio-lib.readthedocs.io/en/latest/plot.html#PlotFunctions.plot_drawdown.alpha "Permalink to this definition")
Significance level of DaR, CDaR, EDaR and RLDaR. The default is 0.05.
kappa : [float](https://docs.python.org/3.11/library/functions.html#float "(in Python v3.11)")
, optional[¶](https://riskfolio-lib.readthedocs.io/en/latest/plot.html#PlotFunctions.plot_drawdown.kappa "Permalink to this definition")
Deformation parameter of RLVaR and RLDaR, must be between 0 and 1. The default is 0.30.
solver : [str](https://docs.python.org/3.11/library/stdtypes.html#str "(in Python v3.11)")
, optional[¶](https://riskfolio-lib.readthedocs.io/en/latest/plot.html#PlotFunctions.plot_drawdown.solver "Permalink to this definition")
Solver available for CVXPY that supports power cone programming. Used to calculate RLVaR and RLDaR. The default value is ‘CLARABEL’.
height : [float](https://docs.python.org/3.11/library/functions.html#float "(in Python v3.11)")
, optional[¶](https://riskfolio-lib.readthedocs.io/en/latest/plot.html#PlotFunctions.plot_drawdown.height "Permalink to this definition")
Height of the image in inches. The default is 8.
width : [float](https://docs.python.org/3.11/library/functions.html#float "(in Python v3.11)")
, optional[¶](https://riskfolio-lib.readthedocs.io/en/latest/plot.html#PlotFunctions.plot_drawdown.width "Permalink to this definition")
Width of the image in inches. The default is 10.
height\_ratios : [list](https://docs.python.org/3.11/library/stdtypes.html#list "(in Python v3.11)")
or ndarray[¶](https://riskfolio-lib.readthedocs.io/en/latest/plot.html#PlotFunctions.plot_drawdown.height_ratios "Permalink to this definition")
Defines the relative heights of the rows. Each row gets a relative height of height\_ratios\[i\] / sum(height\_ratios). The default value is \[2,3\].
ax : matplotlib axis of size (2,1), optional[¶](https://riskfolio-lib.readthedocs.io/en/latest/plot.html#PlotFunctions.plot_drawdown.ax "Permalink to this definition")
If provided, plot on this axis. The default is None.
Raises:[¶](https://riskfolio-lib.readthedocs.io/en/latest/plot.html#PlotFunctions.plot_drawdown-raises "Permalink to this headline")
[**ValueError**](https://docs.python.org/3.11/library/exceptions.html#ValueError "(in Python v3.11)")
– When the value cannot be calculated.
Returns:[¶](https://riskfolio-lib.readthedocs.io/en/latest/plot.html#PlotFunctions.plot_drawdown-returns "Permalink to this headline")
**ax** – Returns the a np.array with Axes objects with plots for further tweaking.
Return type:[¶](https://riskfolio-lib.readthedocs.io/en/latest/plot.html#PlotFunctions.plot_drawdown-return-type "Permalink to this headline")
np.array
Example
`ax = rp.plot_drawdown(returns=Y, w=w1, alpha=0.05, height=8, width=10, ax=None)`
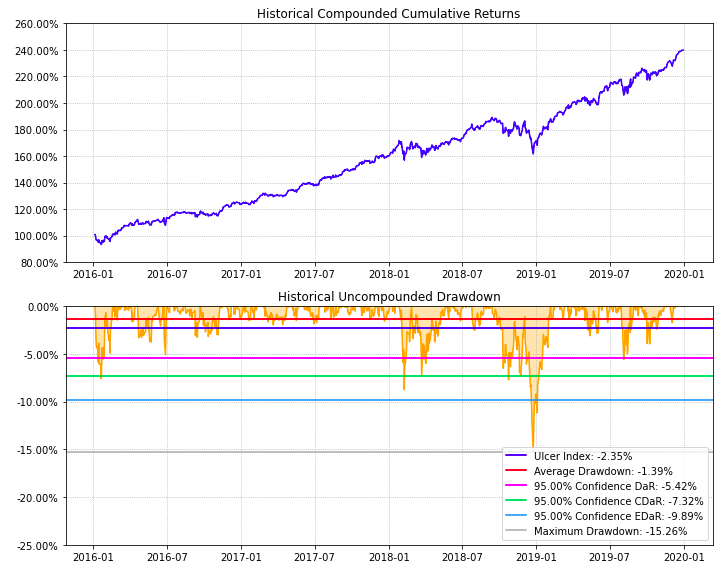
PlotFunctions.plot\_table(_[returns](https://riskfolio-lib.readthedocs.io/en/latest/plot.html#PlotFunctions.plot_table.returns "PlotFunctions.plot_table.returns (Python parameter) — Assets returns DataFrame, where n_samples is the number of observations and n_assets is the number of assets.")
_, _[w](https://riskfolio-lib.readthedocs.io/en/latest/plot.html#PlotFunctions.plot_table.w "PlotFunctions.plot_table.w (Python parameter) — Portfolio weights, where n_assets is the number of assets.")
_, _[MAR](https://riskfolio-lib.readthedocs.io/en/latest/plot.html#PlotFunctions.plot_table.MAR "PlotFunctions.plot_table.MAR (Python parameter) — Minimum acceptable return.")
\=`0`_, _[alpha](https://riskfolio-lib.readthedocs.io/en/latest/plot.html#PlotFunctions.plot_table.alpha "PlotFunctions.plot_table.alpha (Python parameter) — Significance level of VaR, CVaR, Tail Gini, EVaR, RLVaR, CDaR, EDaR and RLDaR. The default is 0.05.")
\=`0.05`_, _[a\_sim](https://riskfolio-lib.readthedocs.io/en/latest/plot.html#PlotFunctions.plot_table.a_sim "PlotFunctions.plot_table.a_sim (Python parameter) — Number of CVaRs used to approximate Tail Gini of losses.")
\=`100`_, _[kappa](https://riskfolio-lib.readthedocs.io/en/latest/plot.html#PlotFunctions.plot_table.kappa "PlotFunctions.plot_table.kappa (Python parameter) — Deformation parameter of RLVaR and RLDaR, must be between 0 and 1.")
\=`0.3`_, _[solver](https://riskfolio-lib.readthedocs.io/en/latest/plot.html#PlotFunctions.plot_table.solver "PlotFunctions.plot_table.solver (Python parameter) — Solver available for CVXPY that supports power cone programming.")
\=`'CLARABEL'`_, _[height](https://riskfolio-lib.readthedocs.io/en/latest/plot.html#PlotFunctions.plot_table.height "PlotFunctions.plot_table.height (Python parameter) — Height of the image in inches.")
\=`9`_, _[width](https://riskfolio-lib.readthedocs.io/en/latest/plot.html#PlotFunctions.plot_table.width "PlotFunctions.plot_table.width (Python parameter) — Width of the image in inches.")
\=`12`_, _[t\_factor](https://riskfolio-lib.readthedocs.io/en/latest/plot.html#PlotFunctions.plot_table.t_factor "PlotFunctions.plot_table.t_factor (Python parameter) — Factor used to annualize expected return and expected risks for risk measures based on returns (not drawdowns).")
\=`252`_, _[ini\_days](https://riskfolio-lib.readthedocs.io/en/latest/plot.html#PlotFunctions.plot_table.ini_days "PlotFunctions.plot_table.ini_days (Python parameter) — If provided, it is the number of days of compounding for first return. It is used to calculate Compound Annual Growth Rate (CAGR).")
\=`1`_, _[days\_per\_year](https://riskfolio-lib.readthedocs.io/en/latest/plot.html#PlotFunctions.plot_table.days_per_year "PlotFunctions.plot_table.days_per_year (Python parameter) — Days per year assumption.")
\=`252`_, _[ax](https://riskfolio-lib.readthedocs.io/en/latest/plot.html#PlotFunctions.plot_table.ax "PlotFunctions.plot_table.ax (Python parameter) — If provided, plot on this axis.")
\=`None`_)[\[source\]](https://riskfolio-lib.readthedocs.io/en/latest/_modules/PlotFunctions.html#plot_table)
[¶](https://riskfolio-lib.readthedocs.io/en/latest/plot.html#PlotFunctions.plot_table "Link to this definition")
Create a table with information about risk measures and risk adjusted return ratios.
Parameters:[¶](https://riskfolio-lib.readthedocs.io/en/latest/plot.html#PlotFunctions.plot_table-parameters "Permalink to this headline")
returns : DataFrame of shape (n\_samples, n\_assets)[¶](https://riskfolio-lib.readthedocs.io/en/latest/plot.html#PlotFunctions.plot_table.returns "Permalink to this definition")
Assets returns DataFrame, where n\_samples is the number of observations and n\_assets is the number of assets.
w : DataFrame or Series of shape (n\_assets, 1)[¶](https://riskfolio-lib.readthedocs.io/en/latest/plot.html#PlotFunctions.plot_table.w "Permalink to this definition")
Portfolio weights, where n\_assets is the number of assets.
MAR : [float](https://docs.python.org/3.11/library/functions.html#float "(in Python v3.11)")
, optional[¶](https://riskfolio-lib.readthedocs.io/en/latest/plot.html#PlotFunctions.plot_table.MAR "Permalink to this definition")
Minimum acceptable return.
alpha : [float](https://docs.python.org/3.11/library/functions.html#float "(in Python v3.11)")
, optional[¶](https://riskfolio-lib.readthedocs.io/en/latest/plot.html#PlotFunctions.plot_table.alpha "Permalink to this definition")
Significance level of VaR, CVaR, Tail Gini, EVaR, RLVaR, CDaR, EDaR and RLDaR. The default is 0.05.
a\_sim : [float](https://docs.python.org/3.11/library/functions.html#float "(in Python v3.11)")
, optional[¶](https://riskfolio-lib.readthedocs.io/en/latest/plot.html#PlotFunctions.plot_table.a_sim "Permalink to this definition")
Number of CVaRs used to approximate Tail Gini of losses. The default is 100.
kappa : [float](https://docs.python.org/3.11/library/functions.html#float "(in Python v3.11)")
, optional[¶](https://riskfolio-lib.readthedocs.io/en/latest/plot.html#PlotFunctions.plot_table.kappa "Permalink to this definition")
Deformation parameter of RLVaR and RLDaR, must be between 0 and 1. The default is 0.30.
solver : [str](https://docs.python.org/3.11/library/stdtypes.html#str "(in Python v3.11)")
, optional[¶](https://riskfolio-lib.readthedocs.io/en/latest/plot.html#PlotFunctions.plot_table.solver "Permalink to this definition")
Solver available for CVXPY that supports power cone programming. Used to calculate RLVaR and RLDaR. The default value is ‘CLARABEL’.
height : [float](https://docs.python.org/3.11/library/functions.html#float "(in Python v3.11)")
, optional[¶](https://riskfolio-lib.readthedocs.io/en/latest/plot.html#PlotFunctions.plot_table.height "Permalink to this definition")
Height of the image in inches. The default is 9.
width : [float](https://docs.python.org/3.11/library/functions.html#float "(in Python v3.11)")
, optional[¶](https://riskfolio-lib.readthedocs.io/en/latest/plot.html#PlotFunctions.plot_table.width "Permalink to this definition")
Width of the image in inches. The default is 12.
t\_factor : [float](https://docs.python.org/3.11/library/functions.html#float "(in Python v3.11)")
, optional[¶](https://riskfolio-lib.readthedocs.io/en/latest/plot.html#PlotFunctions.plot_table.t_factor "Permalink to this definition")
Factor used to annualize expected return and expected risks for risk measures based on returns (not drawdowns). The default is 252.
Annualized Return\=Return×t\_factorAnnualized Risk\=Risk×t\_factor
ini\_days : [float](https://docs.python.org/3.11/library/functions.html#float "(in Python v3.11)")
, optional[¶](https://riskfolio-lib.readthedocs.io/en/latest/plot.html#PlotFunctions.plot_table.ini_days "Permalink to this definition")
If provided, it is the number of days of compounding for first return. It is used to calculate Compound Annual Growth Rate (CAGR). This value depend on assumptions used in t\_factor, for example if data is monthly you can use 21 (252 days per year) or 30 (360 days per year). The default is 1 for daily returns.
days\_per\_year : [float](https://docs.python.org/3.11/library/functions.html#float "(in Python v3.11)")
, optional[¶](https://riskfolio-lib.readthedocs.io/en/latest/plot.html#PlotFunctions.plot_table.days_per_year "Permalink to this definition")
Days per year assumption. It is used to calculate Compound Annual Growth Rate (CAGR). Default value is 252 trading days per year.
ax : matplotlib axis, optional[¶](https://riskfolio-lib.readthedocs.io/en/latest/plot.html#PlotFunctions.plot_table.ax "Permalink to this definition")
If provided, plot on this axis. The default is None.
Raises:[¶](https://riskfolio-lib.readthedocs.io/en/latest/plot.html#PlotFunctions.plot_table-raises "Permalink to this headline")
[**ValueError**](https://docs.python.org/3.11/library/exceptions.html#ValueError "(in Python v3.11)")
– When the value cannot be calculated.
Returns:[¶](https://riskfolio-lib.readthedocs.io/en/latest/plot.html#PlotFunctions.plot_table-returns "Permalink to this headline")
**ax** – Returns the Axes object with the plot for further tweaking.
Return type:[¶](https://riskfolio-lib.readthedocs.io/en/latest/plot.html#PlotFunctions.plot_table-return-type "Permalink to this headline")
matplotlib axis
Example
`ax = rp.plot_table(returns=Y, w=w1, MAR=0, alpha=0.05, ax=None)`
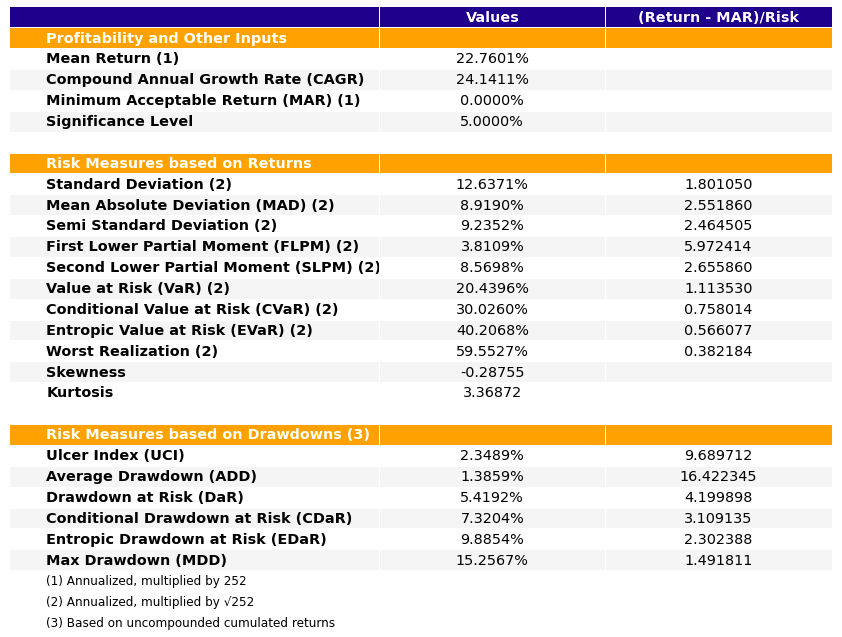
PlotFunctions.plot\_clusters(_[returns](https://riskfolio-lib.readthedocs.io/en/latest/plot.html#PlotFunctions.plot_clusters.returns "PlotFunctions.plot_clusters.returns (Python parameter) — Assets returns DataFrame, where n_samples is the number of observations and n_assets is the number of assets.")
_, _[custom\_cov](https://riskfolio-lib.readthedocs.io/en/latest/plot.html#PlotFunctions.plot_clusters.custom_cov "PlotFunctions.plot_clusters.custom_cov (Python parameter) — Custom covariance matrix, used when codependence parameter has value 'custom_cov'.")
\=`None`_, _[codependence](https://riskfolio-lib.readthedocs.io/en/latest/plot.html#PlotFunctions.plot_clusters.codependence "PlotFunctions.plot_clusters.codependence (Python parameter) — The codependence or similarity matrix used to build the distance metric and clusters.")
\=`'pearson'`_, _[linkage](https://riskfolio-lib.readthedocs.io/en/latest/plot.html#PlotFunctions.plot_clusters.linkage "PlotFunctions.plot_clusters.linkage (Python parameter) — Linkage method of hierarchical clustering, see linkage for more details. The default is 'ward'.")
\=`'ward'`_, _[opt\_k\_method](https://riskfolio-lib.readthedocs.io/en/latest/plot.html#PlotFunctions.plot_clusters.opt_k_method "PlotFunctions.plot_clusters.opt_k_method (Python parameter) — Method used to calculate the optimum number of clusters. The default is 'twodiff'.")
\=`'twodiff'`_, _[k](https://riskfolio-lib.readthedocs.io/en/latest/plot.html#PlotFunctions.plot_clusters.k "PlotFunctions.plot_clusters.k (Python parameter) — Number of clusters.")
\=`None`_, _[max\_k](https://riskfolio-lib.readthedocs.io/en/latest/plot.html#PlotFunctions.plot_clusters.max_k "PlotFunctions.plot_clusters.max_k (Python parameter) — Max number of clusters used by the two difference gap statistic to find the optimal number of clusters.")
\=`10`_, _[bins\_info](https://riskfolio-lib.readthedocs.io/en/latest/plot.html#PlotFunctions.plot_clusters.bins_info "PlotFunctions.plot_clusters.bins_info (Python parameter) — Number of bins used to calculate variation of information.")
\=`'KN'`_, _[alpha\_tail](https://riskfolio-lib.readthedocs.io/en/latest/plot.html#PlotFunctions.plot_clusters.alpha_tail "PlotFunctions.plot_clusters.alpha_tail (Python parameter) — Significance level for lower tail dependence index.")
\=`0.05`_, _[gs\_threshold](https://riskfolio-lib.readthedocs.io/en/latest/plot.html#PlotFunctions.plot_clusters.gs_threshold "PlotFunctions.plot_clusters.gs_threshold (Python parameter) — Gerber statistic threshold.")
\=`0.5`_, _[leaf\_order](https://riskfolio-lib.readthedocs.io/en/latest/plot.html#PlotFunctions.plot_clusters.leaf_order "PlotFunctions.plot_clusters.leaf_order (Python parameter) — Indicates if the cluster are ordered so that the distance between successive leaves is minimal.")
\=`True`_, _[show\_clusters](https://riskfolio-lib.readthedocs.io/en/latest/plot.html#PlotFunctions.plot_clusters.show_clusters "PlotFunctions.plot_clusters.show_clusters (Python parameter) — Indicates if clusters are plot.")
\=`True`_, _[dendrogram](https://riskfolio-lib.readthedocs.io/en/latest/plot.html#PlotFunctions.plot_clusters.dendrogram "PlotFunctions.plot_clusters.dendrogram (Python parameter) — Indicates if the plot has or not a dendrogram.")
\=`True`_, _[cmap](https://riskfolio-lib.readthedocs.io/en/latest/plot.html#PlotFunctions.plot_clusters.cmap "PlotFunctions.plot_clusters.cmap (Python parameter) — Colormap used to plot the pcolormesh plot.")
\=`'RdYlBu'`_, _[linecolor](https://riskfolio-lib.readthedocs.io/en/latest/plot.html#PlotFunctions.plot_clusters.linecolor "PlotFunctions.plot_clusters.linecolor (Python parameter) — Color used to identify the clusters in the pcolormesh plot. The default is fuchsia'.")
\=`'fuchsia'`_, _[title](https://riskfolio-lib.readthedocs.io/en/latest/plot.html#PlotFunctions.plot_clusters.title "PlotFunctions.plot_clusters.title (Python parameter) — Title of the chart.")
\=`''`_, _[height](https://riskfolio-lib.readthedocs.io/en/latest/plot.html#PlotFunctions.plot_clusters.height "PlotFunctions.plot_clusters.height (Python parameter) — Height of the image in inches.")
\=`11`_, _[width](https://riskfolio-lib.readthedocs.io/en/latest/plot.html#PlotFunctions.plot_clusters.width "PlotFunctions.plot_clusters.width (Python parameter) — Width of the image in inches.")
\=`12`_, _[ax](https://riskfolio-lib.readthedocs.io/en/latest/plot.html#PlotFunctions.plot_clusters.ax "PlotFunctions.plot_clusters.ax (Python parameter) — If provided, plot on this axis.")
\=`None`_)[\[source\]](https://riskfolio-lib.readthedocs.io/en/latest/_modules/PlotFunctions.html#plot_clusters)
[¶](https://riskfolio-lib.readthedocs.io/en/latest/plot.html#PlotFunctions.plot_clusters "Link to this definition")
Create a clustermap plot based on the selected codependence measure.
Parameters:[¶](https://riskfolio-lib.readthedocs.io/en/latest/plot.html#PlotFunctions.plot_clusters-parameters "Permalink to this headline")
returns : DataFrame of shape (n\_samples, n\_assets)[¶](https://riskfolio-lib.readthedocs.io/en/latest/plot.html#PlotFunctions.plot_clusters.returns "Permalink to this definition")
Assets returns DataFrame, where n\_samples is the number of observations and n\_assets is the number of assets.
custom\_cov : DataFrame or None, optional[¶](https://riskfolio-lib.readthedocs.io/en/latest/plot.html#PlotFunctions.plot_clusters.custom_cov "Permalink to this definition")
Custom covariance matrix, used when codependence parameter has value ‘custom\_cov’. The default is None.
codependence : [str](https://docs.python.org/3.11/library/stdtypes.html#str "(in Python v3.11)")
, can be {'pearson', 'spearman', 'abs\_pearson', 'abs\_spearman', 'distance', 'mutual\_info', 'tail' or 'custom\_cov'}[¶](https://riskfolio-lib.readthedocs.io/en/latest/plot.html#PlotFunctions.plot_clusters.codependence "Permalink to this definition")
The codependence or similarity matrix used to build the distance metric and clusters. The default is ‘pearson’. Possible values are:
* ’pearson’: pearson correlation matrix. Distance formula: Di,j\=0.5(1−ρi,j).
* ’spearman’: spearman correlation matrix. Distance formula: Di,j\=0.5(1−ρi,j).
* ’kendall’: kendall correlation matrix. Distance formula: Di,j\=0.5(1−ρi,jkendall).
* ’gerber1’: Gerber statistic 1 correlation matrix. Distance formula: Di,j\=0.5(1−ρi,jgerber1).
* ’gerber2’: Gerber statistic 2 correlation matrix. Distance formula: Di,j\=0.5(1−ρi,jgerber2).
* ’abs\_pearson’: absolute value pearson correlation matrix. Distance formula: Di,j\=(1−|ρi,j|).
* ’abs\_spearman’: absolute value spearman correlation matrix. Distance formula: Di,j\=(1−|ρi,j|).
* ’abs\_kendall’: absolute value kendall correlation matrix. Distance formula: Di,j\=(1−|ρi,jkendall|).
* ’distance’: distance correlation matrix. Distance formula Di,j\=(1−|ρi,j|).
* ’mutual\_info’: mutual information matrix. Distance used is variation information matrix.
* ’tail’: lower tail dependence index matrix. Dissimilarity formula Di,j\=−logλi,j.
* ’custom\_cov’: use custom correlation matrix based on the custom\_cov parameter. Distance formula: Di,j\=0.5(1−ρi,jpearson).
linkage : string, optional[¶](https://riskfolio-lib.readthedocs.io/en/latest/plot.html#PlotFunctions.plot_clusters.linkage "Permalink to this definition")
Linkage method of hierarchical clustering, see [linkage](https://docs.scipy.org/doc/scipy/reference/generated/scipy.cluster.hierarchy.linkage.html?highlight=linkage#scipy.cluster.hierarchy.linkage)
for more details. The default is ‘ward’. Possible values are:
* ’single’.
* ’complete’.
* ’average’.
* ’weighted’.
* ’centroid’.
* ’median’.
* ’ward’.
* ’DBHT’: Direct Bubble Hierarchical Tree.
opt\_k\_method : [str](https://docs.python.org/3.11/library/stdtypes.html#str "(in Python v3.11)")
[¶](https://riskfolio-lib.readthedocs.io/en/latest/plot.html#PlotFunctions.plot_clusters.opt_k_method "Permalink to this definition")
Method used to calculate the optimum number of clusters. The default is ‘twodiff’. Possible values are:
* ’twodiff’: two difference gap statistic.
* ’stdsil’: standarized silhouette score.
k : [int](https://docs.python.org/3.11/library/functions.html#int "(in Python v3.11)")
, optional[¶](https://riskfolio-lib.readthedocs.io/en/latest/plot.html#PlotFunctions.plot_clusters.k "Permalink to this definition")
Number of clusters. This value is took instead of the optimal number of clusters calculated with the two difference gap statistic. The default is None.
max\_k : [int](https://docs.python.org/3.11/library/functions.html#int "(in Python v3.11)")
, optional[¶](https://riskfolio-lib.readthedocs.io/en/latest/plot.html#PlotFunctions.plot_clusters.max_k "Permalink to this definition")
Max number of clusters used by the two difference gap statistic to find the optimal number of clusters. The default is 10.
bins\_info : [int](https://docs.python.org/3.11/library/functions.html#int "(in Python v3.11)")
or [str](https://docs.python.org/3.11/library/stdtypes.html#str "(in Python v3.11)")
[¶](https://riskfolio-lib.readthedocs.io/en/latest/plot.html#PlotFunctions.plot_clusters.bins_info "Permalink to this definition")
Number of bins used to calculate variation of information. The default value is ‘KN’. Possible values are:
* ’KN’: Knuth’s choice method. See more in [knuth\_bin\_width](https://docs.astropy.org/en/stable/api/astropy.stats.knuth_bin_width.html)
.
* ’FD’: Freedman–Diaconis’ choice method. See more in [freedman\_bin\_width](https://docs.astropy.org/en/stable/api/astropy.stats.freedman_bin_width.html)
.
* ’SC’: Scotts’ choice method. See more in [scott\_bin\_width](https://docs.astropy.org/en/stable/api/astropy.stats.scott_bin_width.html)
.
* ’HGR’: Hacine-Gharbi and Ravier’ choice method.
* int: integer value chosen by user.
alpha\_tail : [float](https://docs.python.org/3.11/library/functions.html#float "(in Python v3.11)")
, optional[¶](https://riskfolio-lib.readthedocs.io/en/latest/plot.html#PlotFunctions.plot_clusters.alpha_tail "Permalink to this definition")
Significance level for lower tail dependence index. The default is 0.05.
gs\_threshold : [float](https://docs.python.org/3.11/library/functions.html#float "(in Python v3.11)")
, optional[¶](https://riskfolio-lib.readthedocs.io/en/latest/plot.html#PlotFunctions.plot_clusters.gs_threshold "Permalink to this definition")
Gerber statistic threshold. The default is 0.5.
leaf\_order : [bool](https://docs.python.org/3.11/library/functions.html#bool "(in Python v3.11)")
, optional[¶](https://riskfolio-lib.readthedocs.io/en/latest/plot.html#PlotFunctions.plot_clusters.leaf_order "Permalink to this definition")
Indicates if the cluster are ordered so that the distance between successive leaves is minimal. The default is True.
show\_clusters : [bool](https://docs.python.org/3.11/library/functions.html#bool "(in Python v3.11)")
, optional[¶](https://riskfolio-lib.readthedocs.io/en/latest/plot.html#PlotFunctions.plot_clusters.show_clusters "Permalink to this definition")
Indicates if clusters are plot. The default is True.
dendrogram : [bool](https://docs.python.org/3.11/library/functions.html#bool "(in Python v3.11)")
, optional[¶](https://riskfolio-lib.readthedocs.io/en/latest/plot.html#PlotFunctions.plot_clusters.dendrogram "Permalink to this definition")
Indicates if the plot has or not a dendrogram. The default is True.
cmap : [str](https://docs.python.org/3.11/library/stdtypes.html#str "(in Python v3.11)")
or cmap, optional[¶](https://riskfolio-lib.readthedocs.io/en/latest/plot.html#PlotFunctions.plot_clusters.cmap "Permalink to this definition")
Colormap used to plot the pcolormesh plot. The default is ‘viridis’.
linecolor : [str](https://docs.python.org/3.11/library/stdtypes.html#str "(in Python v3.11)")
, optional[¶](https://riskfolio-lib.readthedocs.io/en/latest/plot.html#PlotFunctions.plot_clusters.linecolor "Permalink to this definition")
Color used to identify the clusters in the pcolormesh plot. The default is fuchsia’.
title : [str](https://docs.python.org/3.11/library/stdtypes.html#str "(in Python v3.11)")
, optional[¶](https://riskfolio-lib.readthedocs.io/en/latest/plot.html#PlotFunctions.plot_clusters.title "Permalink to this definition")
Title of the chart. The default is “”.
height : [float](https://docs.python.org/3.11/library/functions.html#float "(in Python v3.11)")
, optional[¶](https://riskfolio-lib.readthedocs.io/en/latest/plot.html#PlotFunctions.plot_clusters.height "Permalink to this definition")
Height of the image in inches. The default is 12.
width : [float](https://docs.python.org/3.11/library/functions.html#float "(in Python v3.11)")
, optional[¶](https://riskfolio-lib.readthedocs.io/en/latest/plot.html#PlotFunctions.plot_clusters.width "Permalink to this definition")
Width of the image in inches. The default is 12.
ax : matplotlib axis, optional[¶](https://riskfolio-lib.readthedocs.io/en/latest/plot.html#PlotFunctions.plot_clusters.ax "Permalink to this definition")
If provided, plot on this axis. The default is None.
Raises:[¶](https://riskfolio-lib.readthedocs.io/en/latest/plot.html#PlotFunctions.plot_clusters-raises "Permalink to this headline")
[**ValueError**](https://docs.python.org/3.11/library/exceptions.html#ValueError "(in Python v3.11)")
– When the value cannot be calculated.
Returns:[¶](https://riskfolio-lib.readthedocs.io/en/latest/plot.html#PlotFunctions.plot_clusters-returns "Permalink to this headline")
**ax** – Returns the Axes object with the plot for further tweaking.
Return type:[¶](https://riskfolio-lib.readthedocs.io/en/latest/plot.html#PlotFunctions.plot_clusters-return-type "Permalink to this headline")
matplotlib axis
Example
`ax = rp.plot_clusters(returns=Y, codependence='spearman', linkage='ward', k=None, max_k=10, leaf_order=True, dendrogram=True, ax=None)`
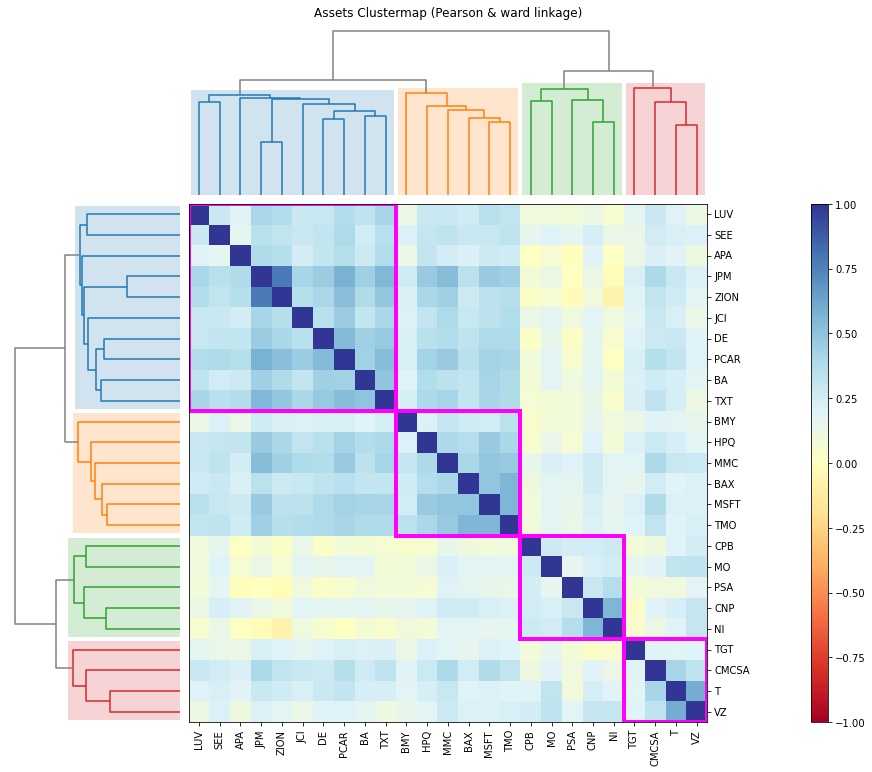
PlotFunctions.plot\_dendrogram(_[returns](https://riskfolio-lib.readthedocs.io/en/latest/plot.html#PlotFunctions.plot_dendrogram.returns "PlotFunctions.plot_dendrogram.returns (Python parameter) — Assets returns DataFrame, where n_samples is the number of observations and n_assets is the number of assets.")
_, _[custom\_cov](https://riskfolio-lib.readthedocs.io/en/latest/plot.html#PlotFunctions.plot_dendrogram.custom_cov "PlotFunctions.plot_dendrogram.custom_cov (Python parameter) — Custom covariance matrix, used when codependence parameter has value 'custom_cov'.")
\=`None`_, _[codependence](https://riskfolio-lib.readthedocs.io/en/latest/plot.html#PlotFunctions.plot_dendrogram.codependence "PlotFunctions.plot_dendrogram.codependence (Python parameter) — The codependence or similarity matrix used to build the distance metric and clusters.")
\=`'pearson'`_, _[linkage](https://riskfolio-lib.readthedocs.io/en/latest/plot.html#PlotFunctions.plot_dendrogram.linkage "PlotFunctions.plot_dendrogram.linkage (Python parameter) — Duplicate explicit target name: "linkage".")
\=`'ward'`_, _[opt\_k\_method](https://riskfolio-lib.readthedocs.io/en/latest/plot.html#PlotFunctions.plot_dendrogram.opt_k_method "PlotFunctions.plot_dendrogram.opt_k_method (Python parameter) — Method used to calculate the optimum number of clusters. The default is 'twodiff'.")
\=`'twodiff'`_, _[k](https://riskfolio-lib.readthedocs.io/en/latest/plot.html#PlotFunctions.plot_dendrogram.k "PlotFunctions.plot_dendrogram.k (Python parameter) — Number of clusters.")
\=`None`_, _[max\_k](https://riskfolio-lib.readthedocs.io/en/latest/plot.html#PlotFunctions.plot_dendrogram.max_k "PlotFunctions.plot_dendrogram.max_k (Python parameter) — Max number of clusters used by the two difference gap statistic to find the optimal number of clusters.")
\=`10`_, _[bins\_info](https://riskfolio-lib.readthedocs.io/en/latest/plot.html#PlotFunctions.plot_dendrogram.bins_info "PlotFunctions.plot_dendrogram.bins_info (Python parameter) — Number of bins used to calculate variation of information.")
\=`'KN'`_, _[alpha\_tail](https://riskfolio-lib.readthedocs.io/en/latest/plot.html#PlotFunctions.plot_dendrogram.alpha_tail "PlotFunctions.plot_dendrogram.alpha_tail (Python parameter) — Significance level for lower tail dependence index.")
\=`0.05`_, _[gs\_threshold](https://riskfolio-lib.readthedocs.io/en/latest/plot.html#PlotFunctions.plot_dendrogram.gs_threshold "PlotFunctions.plot_dendrogram.gs_threshold (Python parameter) — Gerber statistic threshold.")
\=`0.5`_, _[leaf\_order](https://riskfolio-lib.readthedocs.io/en/latest/plot.html#PlotFunctions.plot_dendrogram.leaf_order "PlotFunctions.plot_dendrogram.leaf_order (Python parameter) — Indicates if the cluster are ordered so that the distance between successive leaves is minimal.")
\=`True`_, _[show\_clusters](https://riskfolio-lib.readthedocs.io/en/latest/plot.html#PlotFunctions.plot_dendrogram.show_clusters "PlotFunctions.plot_dendrogram.show_clusters (Python parameter) — Indicates if clusters are plot.")
\=`True`_, _[title](https://riskfolio-lib.readthedocs.io/en/latest/plot.html#PlotFunctions.plot_dendrogram.title "PlotFunctions.plot_dendrogram.title (Python parameter) — Title of the chart.")
\=`''`_, _[height](https://riskfolio-lib.readthedocs.io/en/latest/plot.html#PlotFunctions.plot_dendrogram.height "PlotFunctions.plot_dendrogram.height (Python parameter) — Height of the image in inches.")
\=`5`_, _[width](https://riskfolio-lib.readthedocs.io/en/latest/plot.html#PlotFunctions.plot_dendrogram.width "PlotFunctions.plot_dendrogram.width (Python parameter) — Width of the image in inches.")
\=`12`_, _[ax](https://riskfolio-lib.readthedocs.io/en/latest/plot.html#PlotFunctions.plot_dendrogram.ax "PlotFunctions.plot_dendrogram.ax (Python parameter) — If provided, plot on this axis.")
\=`None`_)[\[source\]](https://riskfolio-lib.readthedocs.io/en/latest/_modules/PlotFunctions.html#plot_dendrogram)
[¶](https://riskfolio-lib.readthedocs.io/en/latest/plot.html#PlotFunctions.plot_dendrogram "Link to this definition")
Create a dendrogram based on the selected codependence measure.
Parameters:[¶](https://riskfolio-lib.readthedocs.io/en/latest/plot.html#PlotFunctions.plot_dendrogram-parameters "Permalink to this headline")
returns : DataFrame of shape (n\_samples, n\_assets)[¶](https://riskfolio-lib.readthedocs.io/en/latest/plot.html#PlotFunctions.plot_dendrogram.returns "Permalink to this definition")
Assets returns DataFrame, where n\_samples is the number of observations and n\_assets is the number of assets.
custom\_cov : DataFrame or None, optional[¶](https://riskfolio-lib.readthedocs.io/en/latest/plot.html#PlotFunctions.plot_dendrogram.custom_cov "Permalink to this definition")
Custom covariance matrix, used when codependence parameter has value ‘custom\_cov’. The default is None.
codependence : [str](https://docs.python.org/3.11/library/stdtypes.html#str "(in Python v3.11)")
, can be {'pearson', 'spearman', 'abs\_pearson', 'abs\_spearman', 'distance', 'mutual\_info', 'tail' or 'custom\_cov'}[¶](https://riskfolio-lib.readthedocs.io/en/latest/plot.html#PlotFunctions.plot_dendrogram.codependence "Permalink to this definition")
The codependence or similarity matrix used to build the distance metric and clusters. The default is ‘pearson’. Possible values are:
* ’pearson’: pearson correlation matrix. Distance formula: Di,j\=0.5(1−ρi,j).
* ’spearman’: spearman correlation matrix. Distance formula: Di,j\=0.5(1−ρi,j).
* ’kendall’: kendall correlation matrix. Distance formula: Di,j\=0.5(1−ρi,jkendall).
* ’gerber1’: Gerber statistic 1 correlation matrix. Distance formula: Di,j\=0.5(1−ρi,jgerber1).
* ’gerber2’: Gerber statistic 2 correlation matrix. Distance formula: Di,j\=0.5(1−ρi,jgerber2).
* ’abs\_pearson’: absolute value pearson correlation matrix. Distance formula: Di,j\=(1−|ρi,j|).
* ’abs\_spearman’: absolute value spearman correlation matrix. Distance formula: Di,j\=(1−|ρi,j|).
* ’abs\_kendall’: absolute value kendall correlation matrix. Distance formula: Di,j\=(1−|ρi,jkendall|).
* ’distance’: distance correlation matrix. Distance formula Di,j\=(1−|ρi,j|).
* ’mutual\_info’: mutual information matrix. Distance used is variation information matrix.
* ’tail’: lower tail dependence index matrix. Dissimilarity formula Di,j\=−logλi,j.
* ’custom\_cov’: use custom correlation matrix based on the custom\_cov parameter. Distance formula: Di,j\=0.5(1−ρi,jpearson).
linkage : string, optional[¶](https://riskfolio-lib.readthedocs.io/en/latest/plot.html#PlotFunctions.plot_dendrogram.linkage "Permalink to this definition")
Linkage method of hierarchical clustering, see [linkage](https://docs.scipy.org/doc/scipy/reference/generated/scipy.cluster.hierarchy.linkage.html?highlight=linkage#scipy.cluster.hierarchy.linkage)
for more details. The default is ‘ward’. Possible values are:
* ’single’.
* ’complete’.
* ’average’.
* ’weighted’.
* ’centroid’.
* ’median’.
* ’ward’.
* ’DBHT’: Direct Bubble Hierarchical Tree.
opt\_k\_method : [str](https://docs.python.org/3.11/library/stdtypes.html#str "(in Python v3.11)")
[¶](https://riskfolio-lib.readthedocs.io/en/latest/plot.html#PlotFunctions.plot_dendrogram.opt_k_method "Permalink to this definition")
Method used to calculate the optimum number of clusters. The default is ‘twodiff’. Possible values are:
* ’twodiff’: two difference gap statistic.
* ’stdsil’: standarized silhouette score.
k : [int](https://docs.python.org/3.11/library/functions.html#int "(in Python v3.11)")
, optional[¶](https://riskfolio-lib.readthedocs.io/en/latest/plot.html#PlotFunctions.plot_dendrogram.k "Permalink to this definition")
Number of clusters. This value is took instead of the optimal number of clusters calculated with the two difference gap statistic. The default is None.
max\_k : [int](https://docs.python.org/3.11/library/functions.html#int "(in Python v3.11)")
, optional[¶](https://riskfolio-lib.readthedocs.io/en/latest/plot.html#PlotFunctions.plot_dendrogram.max_k "Permalink to this definition")
Max number of clusters used by the two difference gap statistic to find the optimal number of clusters. The default is 10.
bins\_info : [int](https://docs.python.org/3.11/library/functions.html#int "(in Python v3.11)")
or [str](https://docs.python.org/3.11/library/stdtypes.html#str "(in Python v3.11)")
[¶](https://riskfolio-lib.readthedocs.io/en/latest/plot.html#PlotFunctions.plot_dendrogram.bins_info "Permalink to this definition")
Number of bins used to calculate variation of information. The default value is ‘KN’. Possible values are:
* ’KN’: Knuth’s choice method. See more in [knuth\_bin\_width](https://docs.astropy.org/en/stable/api/astropy.stats.knuth_bin_width.html)
.
* ’FD’: Freedman–Diaconis’ choice method. See more in [freedman\_bin\_width](https://docs.astropy.org/en/stable/api/astropy.stats.freedman_bin_width.html)
.
* ’SC’: Scotts’ choice method. See more in [scott\_bin\_width](https://docs.astropy.org/en/stable/api/astropy.stats.scott_bin_width.html)
.
* ’HGR’: Hacine-Gharbi and Ravier’ choice method.
* int: integer value chosen by user.
alpha\_tail : [float](https://docs.python.org/3.11/library/functions.html#float "(in Python v3.11)")
, optional[¶](https://riskfolio-lib.readthedocs.io/en/latest/plot.html#PlotFunctions.plot_dendrogram.alpha_tail "Permalink to this definition")
Significance level for lower tail dependence index. The default is 0.05.
gs\_threshold : [float](https://docs.python.org/3.11/library/functions.html#float "(in Python v3.11)")
, optional[¶](https://riskfolio-lib.readthedocs.io/en/latest/plot.html#PlotFunctions.plot_dendrogram.gs_threshold "Permalink to this definition")
Gerber statistic threshold. The default is 0.5.
leaf\_order : [bool](https://docs.python.org/3.11/library/functions.html#bool "(in Python v3.11)")
, optional[¶](https://riskfolio-lib.readthedocs.io/en/latest/plot.html#PlotFunctions.plot_dendrogram.leaf_order "Permalink to this definition")
Indicates if the cluster are ordered so that the distance between successive leaves is minimal. The default is True.
show\_clusters : [bool](https://docs.python.org/3.11/library/functions.html#bool "(in Python v3.11)")
, optional[¶](https://riskfolio-lib.readthedocs.io/en/latest/plot.html#PlotFunctions.plot_dendrogram.show_clusters "Permalink to this definition")
Indicates if clusters are plot. The default is True.
title : [str](https://docs.python.org/3.11/library/stdtypes.html#str "(in Python v3.11)")
, optional[¶](https://riskfolio-lib.readthedocs.io/en/latest/plot.html#PlotFunctions.plot_dendrogram.title "Permalink to this definition")
Title of the chart. The default is “”.
height : [float](https://docs.python.org/3.11/library/functions.html#float "(in Python v3.11)")
, optional[¶](https://riskfolio-lib.readthedocs.io/en/latest/plot.html#PlotFunctions.plot_dendrogram.height "Permalink to this definition")
Height of the image in inches. The default is 5.
width : [float](https://docs.python.org/3.11/library/functions.html#float "(in Python v3.11)")
, optional[¶](https://riskfolio-lib.readthedocs.io/en/latest/plot.html#PlotFunctions.plot_dendrogram.width "Permalink to this definition")
Width of the image in inches. The default is 12.
ax : matplotlib axis, optional[¶](https://riskfolio-lib.readthedocs.io/en/latest/plot.html#PlotFunctions.plot_dendrogram.ax "Permalink to this definition")
If provided, plot on this axis. The default is None.
Raises:[¶](https://riskfolio-lib.readthedocs.io/en/latest/plot.html#PlotFunctions.plot_dendrogram-raises "Permalink to this headline")
[**ValueError**](https://docs.python.org/3.11/library/exceptions.html#ValueError "(in Python v3.11)")
– When the value cannot be calculated.
Returns:[¶](https://riskfolio-lib.readthedocs.io/en/latest/plot.html#PlotFunctions.plot_dendrogram-returns "Permalink to this headline")
**ax** – Returns the Axes object with the plot for further tweaking.
Return type:[¶](https://riskfolio-lib.readthedocs.io/en/latest/plot.html#PlotFunctions.plot_dendrogram-return-type "Permalink to this headline")
matplotlib axis
Example
`ax = rp.plot_dendrogram(returns=Y, codependence='spearman', linkage='ward', k=None, max_k=10, leaf_order=True, ax=None)`
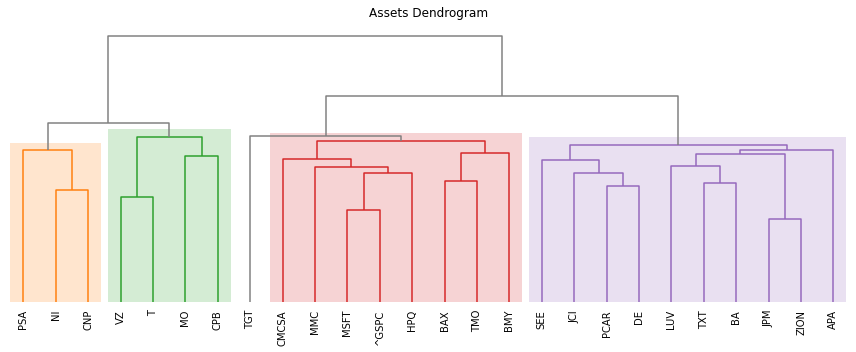
PlotFunctions.plot\_network(_[returns](https://riskfolio-lib.readthedocs.io/en/latest/plot.html#PlotFunctions.plot_network.returns "PlotFunctions.plot_network.returns (Python parameter) — Assets returns DataFrame, where n_samples is the number of observations and n_assets is the number of assets.")
_, _[custom\_cov](https://riskfolio-lib.readthedocs.io/en/latest/plot.html#PlotFunctions.plot_network.custom_cov "PlotFunctions.plot_network.custom_cov (Python parameter) — Custom covariance matrix, used when codependence parameter has value 'custom_cov'.")
\=`None`_, _[codependence](https://riskfolio-lib.readthedocs.io/en/latest/plot.html#PlotFunctions.plot_network.codependence "PlotFunctions.plot_network.codependence (Python parameter) — The codependence or similarity matrix used to build the distance metric and clusters.")
\=`'pearson'`_, _[linkage](https://riskfolio-lib.readthedocs.io/en/latest/plot.html#PlotFunctions.plot_network.linkage "PlotFunctions.plot_network.linkage (Python parameter) — Duplicate explicit target name: "linkage".")
\=`'ward'`_, _[opt\_k\_method](https://riskfolio-lib.readthedocs.io/en/latest/plot.html#PlotFunctions.plot_network.opt_k_method "PlotFunctions.plot_network.opt_k_method (Python parameter) — Method used to calculate the optimum number of clusters. The default is 'twodiff'.")
\=`'twodiff'`_, _[k](https://riskfolio-lib.readthedocs.io/en/latest/plot.html#PlotFunctions.plot_network.k "PlotFunctions.plot_network.k (Python parameter) — Number of clusters.")
\=`None`_, _[max\_k](https://riskfolio-lib.readthedocs.io/en/latest/plot.html#PlotFunctions.plot_network.max_k "PlotFunctions.plot_network.max_k (Python parameter) — Max number of clusters used by the two difference gap statistic to find the optimal number of clusters.")
\=`10`_, _[bins\_info](https://riskfolio-lib.readthedocs.io/en/latest/plot.html#PlotFunctions.plot_network.bins_info "PlotFunctions.plot_network.bins_info (Python parameter) — Number of bins used to calculate variation of information.")
\=`'KN'`_, _[alpha\_tail](https://riskfolio-lib.readthedocs.io/en/latest/plot.html#PlotFunctions.plot_network.alpha_tail "PlotFunctions.plot_network.alpha_tail (Python parameter) — Significance level for lower tail dependence index.")
\=`0.05`_, _[gs\_threshold](https://riskfolio-lib.readthedocs.io/en/latest/plot.html#PlotFunctions.plot_network.gs_threshold "PlotFunctions.plot_network.gs_threshold (Python parameter) — Gerber statistic threshold.")
\=`0.5`_, _[leaf\_order](https://riskfolio-lib.readthedocs.io/en/latest/plot.html#PlotFunctions.plot_network.leaf_order "PlotFunctions.plot_network.leaf_order (Python parameter) — Indicates if the cluster are ordered so that the distance between successive leaves is minimal.")
\=`True`_, _[kind](https://riskfolio-lib.readthedocs.io/en/latest/plot.html#PlotFunctions.plot_network.kind "PlotFunctions.plot_network.kind (Python parameter) — Kind of networkx layout.")
\=`'spring'`_, _[seed](https://riskfolio-lib.readthedocs.io/en/latest/plot.html#PlotFunctions.plot_network.seed "PlotFunctions.plot_network.seed (Python parameter) — Seed for networkx spring layout.")
\=`0`_, _[node\_labels](https://riskfolio-lib.readthedocs.io/en/latest/plot.html#PlotFunctions.plot_network.node_labels "PlotFunctions.plot_network.node_labels (Python parameter) — Specify if node lables are visible.")
\=`True`_, _[node\_size](https://riskfolio-lib.readthedocs.io/en/latest/plot.html#PlotFunctions.plot_network.node_size "PlotFunctions.plot_network.node_size (Python parameter) — Size of the nodes.")
\=`1400`_, _[node\_alpha](https://riskfolio-lib.readthedocs.io/en/latest/plot.html#PlotFunctions.plot_network.node_alpha "PlotFunctions.plot_network.node_alpha (Python parameter) — Alpha parameter or transparency of nodes.")
\=`0.7`_, _[font\_size](https://riskfolio-lib.readthedocs.io/en/latest/plot.html#PlotFunctions.plot_network.font_size "PlotFunctions.plot_network.font_size (Python parameter) — Font size of node labels.")
\=`10`_, _[title](https://riskfolio-lib.readthedocs.io/en/latest/plot.html#PlotFunctions.plot_network.title "PlotFunctions.plot_network.title (Python parameter) — Title of the chart.")
\=`''`_, _[height](https://riskfolio-lib.readthedocs.io/en/latest/plot.html#PlotFunctions.plot_network.height "PlotFunctions.plot_network.height (Python parameter) — Height of the image in inches.")
\=`8`_, _[width](https://riskfolio-lib.readthedocs.io/en/latest/plot.html#PlotFunctions.plot_network.width "PlotFunctions.plot_network.width (Python parameter) — Width of the image in inches.")
\=`10`_, _[ax](https://riskfolio-lib.readthedocs.io/en/latest/plot.html#PlotFunctions.plot_network.ax "PlotFunctions.plot_network.ax (Python parameter) — If provided, plot on this axis.")
\=`None`_)[\[source\]](https://riskfolio-lib.readthedocs.io/en/latest/_modules/PlotFunctions.html#plot_network)
[¶](https://riskfolio-lib.readthedocs.io/en/latest/plot.html#PlotFunctions.plot_network "Link to this definition")
Create a network plot. The Planar Maximally Filtered Graph (PMFG) for DBHT linkage and Minimum Spanning Tree (MST) for other linkage methods.
Parameters:[¶](https://riskfolio-lib.readthedocs.io/en/latest/plot.html#PlotFunctions.plot_network-parameters "Permalink to this headline")
returns : DataFrame of shape (n\_samples, n\_assets)[¶](https://riskfolio-lib.readthedocs.io/en/latest/plot.html#PlotFunctions.plot_network.returns "Permalink to this definition")
Assets returns DataFrame, where n\_samples is the number of observations and n\_assets is the number of assets.
custom\_cov : DataFrame or None, optional[¶](https://riskfolio-lib.readthedocs.io/en/latest/plot.html#PlotFunctions.plot_network.custom_cov "Permalink to this definition")
Custom covariance matrix, used when codependence parameter has value ‘custom\_cov’. The default is None.
codependence : [str](https://docs.python.org/3.11/library/stdtypes.html#str "(in Python v3.11)")
, can be {'pearson', 'spearman', 'abs\_pearson', 'abs\_spearman', 'distance', 'mutual\_info', 'tail' or 'custom\_cov'}[¶](https://riskfolio-lib.readthedocs.io/en/latest/plot.html#PlotFunctions.plot_network.codependence "Permalink to this definition")
The codependence or similarity matrix used to build the distance metric and clusters. The default is ‘pearson’. Possible values are:
* ’pearson’: pearson correlation matrix. Distance formula: Di,j\=0.5(1−ρi,jpearson).
* ’spearman’: spearman correlation matrix. Distance formula: Di,j\=0.5(1−ρi,jspearman).
* ’kendall’: kendall correlation matrix. Distance formula: Di,j\=0.5(1−ρi,jkendall).
* ’gerber1’: Gerber statistic 1 correlation matrix. Distance formula: Di,j\=0.5(1−ρi,jgerber1).
* ’gerber2’: Gerber statistic 2 correlation matrix. Distance formula: Di,j\=0.5(1−ρi,jgerber2).
* ’abs\_pearson’: absolute value pearson correlation matrix. Distance formula: Di,j\=(1−|ρi,j|).
* ’abs\_spearman’: absolute value spearman correlation matrix. Distance formula: Di,j\=(1−|ρi,j|).
* ’abs\_kendall’: absolute value kendall correlation matrix. Distance formula: Di,j\=(1−|ρi,jkendall|).
* ’distance’: distance correlation matrix. Distance formula Di,j\=(1−ρi,jdistance).
* ’mutual\_info’: mutual information matrix. Distance used is variation information matrix.
* ’tail’: lower tail dependence index matrix. Dissimilarity formula Di,j\=−logλi,j.
* ’custom\_cov’: use custom correlation matrix based on the custom\_cov parameter. Distance formula: Di,j\=0.5(1−ρi,jpearson).
linkage : string, optional[¶](https://riskfolio-lib.readthedocs.io/en/latest/plot.html#PlotFunctions.plot_network.linkage "Permalink to this definition")
Linkage method of hierarchical clustering, see [linkage](https://docs.scipy.org/doc/scipy/reference/generated/scipy.cluster.hierarchy.linkage.html?highlight=linkage#scipy.cluster.hierarchy.linkage)
for more details. The default is ‘ward’. Possible values are:
* ’single’.
* ’complete’.
* ’average’.
* ’weighted’.
* ’centroid’.
* ’median’.
* ’ward’.
* ’DBHT’: Direct Bubble Hierarchical Tree.
opt\_k\_method : [str](https://docs.python.org/3.11/library/stdtypes.html#str "(in Python v3.11)")
[¶](https://riskfolio-lib.readthedocs.io/en/latest/plot.html#PlotFunctions.plot_network.opt_k_method "Permalink to this definition")
Method used to calculate the optimum number of clusters. The default is ‘twodiff’. Possible values are:
* ’twodiff’: two difference gap statistic.
* ’stdsil’: standarized silhouette score.
k : [int](https://docs.python.org/3.11/library/functions.html#int "(in Python v3.11)")
, optional[¶](https://riskfolio-lib.readthedocs.io/en/latest/plot.html#PlotFunctions.plot_network.k "Permalink to this definition")
Number of clusters. This value is took instead of the optimal number of clusters calculated with the two difference gap statistic. The default is None.
max\_k : [int](https://docs.python.org/3.11/library/functions.html#int "(in Python v3.11)")
, optional[¶](https://riskfolio-lib.readthedocs.io/en/latest/plot.html#PlotFunctions.plot_network.max_k "Permalink to this definition")
Max number of clusters used by the two difference gap statistic to find the optimal number of clusters. The default is 10.
bins\_info : [int](https://docs.python.org/3.11/library/functions.html#int "(in Python v3.11)")
or [str](https://docs.python.org/3.11/library/stdtypes.html#str "(in Python v3.11)")
[¶](https://riskfolio-lib.readthedocs.io/en/latest/plot.html#PlotFunctions.plot_network.bins_info "Permalink to this definition")
Number of bins used to calculate variation of information. The default value is ‘KN’. Possible values are:
* ’KN’: Knuth’s choice method. See more in [knuth\_bin\_width](https://docs.astropy.org/en/stable/api/astropy.stats.knuth_bin_width.html)
.
* ’FD’: Freedman–Diaconis’ choice method. See more in [freedman\_bin\_width](https://docs.astropy.org/en/stable/api/astropy.stats.freedman_bin_width.html)
.
* ’SC’: Scotts’ choice method. See more in [scott\_bin\_width](https://docs.astropy.org/en/stable/api/astropy.stats.scott_bin_width.html)
.
* ’HGR’: Hacine-Gharbi and Ravier’ choice method.
* int: integer value chosen by user.
alpha\_tail : [float](https://docs.python.org/3.11/library/functions.html#float "(in Python v3.11)")
, optional[¶](https://riskfolio-lib.readthedocs.io/en/latest/plot.html#PlotFunctions.plot_network.alpha_tail "Permalink to this definition")
Significance level for lower tail dependence index. The default is 0.05.
gs\_threshold : [float](https://docs.python.org/3.11/library/functions.html#float "(in Python v3.11)")
, optional[¶](https://riskfolio-lib.readthedocs.io/en/latest/plot.html#PlotFunctions.plot_network.gs_threshold "Permalink to this definition")
Gerber statistic threshold. The default is 0.5.
leaf\_order : [bool](https://docs.python.org/3.11/library/functions.html#bool "(in Python v3.11)")
, optional[¶](https://riskfolio-lib.readthedocs.io/en/latest/plot.html#PlotFunctions.plot_network.leaf_order "Permalink to this definition")
Indicates if the cluster are ordered so that the distance between successive leaves is minimal. The default is True.
kind : [str](https://docs.python.org/3.11/library/stdtypes.html#str "(in Python v3.11)")
, optional[¶](https://riskfolio-lib.readthedocs.io/en/latest/plot.html#PlotFunctions.plot_network.kind "Permalink to this definition")
Kind of networkx layout. The default value is ‘spring’. Possible values are:
* ’spring’: networkx spring\_layout.
* ’planar’. networkx planar\_layout.
* ’circular’. networkx circular\_layout.
* ’kamada’. networkx kamada\_kawai\_layout.
seed : [int](https://docs.python.org/3.11/library/functions.html#int "(in Python v3.11)")
, optional[¶](https://riskfolio-lib.readthedocs.io/en/latest/plot.html#PlotFunctions.plot_network.seed "Permalink to this definition")
Seed for networkx spring layout. The default value is 0.
node\_labels : [bool](https://docs.python.org/3.11/library/functions.html#bool "(in Python v3.11)")
, optional[¶](https://riskfolio-lib.readthedocs.io/en/latest/plot.html#PlotFunctions.plot_network.node_labels "Permalink to this definition")
Specify if node lables are visible. The default value is True.
node\_size : [float](https://docs.python.org/3.11/library/functions.html#float "(in Python v3.11)")
, optional[¶](https://riskfolio-lib.readthedocs.io/en/latest/plot.html#PlotFunctions.plot_network.node_size "Permalink to this definition")
Size of the nodes. The default value is 1600.
node\_alpha : [float](https://docs.python.org/3.11/library/functions.html#float "(in Python v3.11)")
, optional[¶](https://riskfolio-lib.readthedocs.io/en/latest/plot.html#PlotFunctions.plot_network.node_alpha "Permalink to this definition")
Alpha parameter or transparency of nodes. The default value is 0.7.
font\_size : [float](https://docs.python.org/3.11/library/functions.html#float "(in Python v3.11)")
, optional[¶](https://riskfolio-lib.readthedocs.io/en/latest/plot.html#PlotFunctions.plot_network.font_size "Permalink to this definition")
Font size of node labels. The default value is 12.
title : [str](https://docs.python.org/3.11/library/stdtypes.html#str "(in Python v3.11)")
, optional[¶](https://riskfolio-lib.readthedocs.io/en/latest/plot.html#PlotFunctions.plot_network.title "Permalink to this definition")
Title of the chart. The default is “”.
height : [float](https://docs.python.org/3.11/library/functions.html#float "(in Python v3.11)")
, optional[¶](https://riskfolio-lib.readthedocs.io/en/latest/plot.html#PlotFunctions.plot_network.height "Permalink to this definition")
Height of the image in inches. The default is 8.
width : [float](https://docs.python.org/3.11/library/functions.html#float "(in Python v3.11)")
, optional[¶](https://riskfolio-lib.readthedocs.io/en/latest/plot.html#PlotFunctions.plot_network.width "Permalink to this definition")
Width of the image in inches. The default is 10.
ax : matplotlib axis, optional[¶](https://riskfolio-lib.readthedocs.io/en/latest/plot.html#PlotFunctions.plot_network.ax "Permalink to this definition")
If provided, plot on this axis. The default is None.
Raises:[¶](https://riskfolio-lib.readthedocs.io/en/latest/plot.html#PlotFunctions.plot_network-raises "Permalink to this headline")
[**ValueError**](https://docs.python.org/3.11/library/exceptions.html#ValueError "(in Python v3.11)")
– When the value cannot be calculated.
Returns:[¶](https://riskfolio-lib.readthedocs.io/en/latest/plot.html#PlotFunctions.plot_network-returns "Permalink to this headline")
**ax** – Returns the Axes object with the plot for further tweaking.
Return type:[¶](https://riskfolio-lib.readthedocs.io/en/latest/plot.html#PlotFunctions.plot_network-return-type "Permalink to this headline")
matplotlib axis
Example
`ax = rp.plot_network(returns=Y, codependence="pearson", linkage="ward", k=None, max_k=10, alpha_tail=0.05, leaf_order=True, kind='kamada', ax=None)`
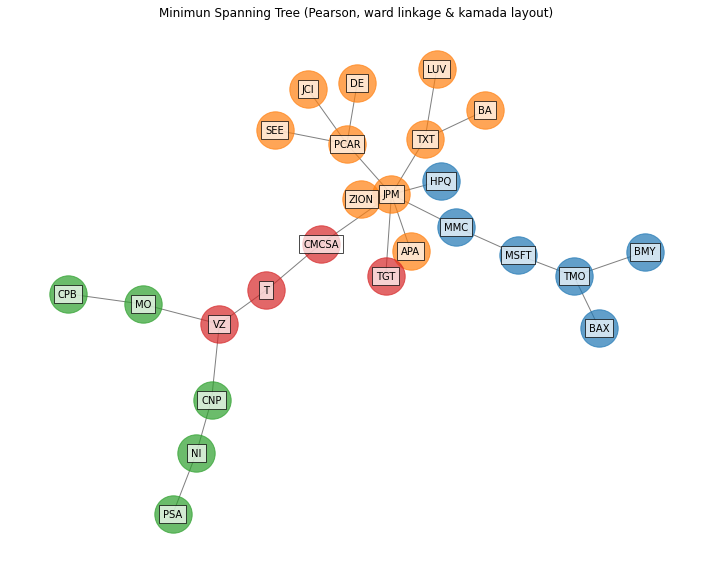
PlotFunctions.plot\_network\_allocation(_[returns](https://riskfolio-lib.readthedocs.io/en/latest/plot.html#PlotFunctions.plot_network_allocation.returns "PlotFunctions.plot_network_allocation.returns (Python parameter) — Assets returns DataFrame, where n_samples is the number of observations and n_assets is the number of assets.")
_, _[w](https://riskfolio-lib.readthedocs.io/en/latest/plot.html#PlotFunctions.plot_network_allocation.w "PlotFunctions.plot_network_allocation.w (Python parameter) — Portfolio weights, where n_assets is the number of assets.")
_, _[custom\_cov](https://riskfolio-lib.readthedocs.io/en/latest/plot.html#PlotFunctions.plot_network_allocation.custom_cov "PlotFunctions.plot_network_allocation.custom_cov (Python parameter) — Custom covariance matrix, used when codependence parameter has value 'custom_cov'.")
\=`None`_, _[codependence](https://riskfolio-lib.readthedocs.io/en/latest/plot.html#PlotFunctions.plot_network_allocation.codependence "PlotFunctions.plot_network_allocation.codependence (Python parameter) — The codependence or similarity matrix used to build the distance metric and clusters.")
\=`'pearson'`_, _[linkage](https://riskfolio-lib.readthedocs.io/en/latest/plot.html#PlotFunctions.plot_network_allocation.linkage "PlotFunctions.plot_network_allocation.linkage (Python parameter) — Duplicate explicit target name: "linkage".")
\=`'ward'`_, _[bins\_info](https://riskfolio-lib.readthedocs.io/en/latest/plot.html#PlotFunctions.plot_network_allocation.bins_info "PlotFunctions.plot_network_allocation.bins_info (Python parameter) — Number of bins used to calculate variation of information.")
\=`'KN'`_, _[alpha\_tail](https://riskfolio-lib.readthedocs.io/en/latest/plot.html#PlotFunctions.plot_network_allocation.alpha_tail "PlotFunctions.plot_network_allocation.alpha_tail (Python parameter) — Significance level for lower tail dependence index.")
\=`0.05`_, _[gs\_threshold](https://riskfolio-lib.readthedocs.io/en/latest/plot.html#PlotFunctions.plot_network_allocation.gs_threshold "PlotFunctions.plot_network_allocation.gs_threshold (Python parameter) — Gerber statistic threshold.")
\=`0.5`_, _[leaf\_order](https://riskfolio-lib.readthedocs.io/en/latest/plot.html#PlotFunctions.plot_network_allocation.leaf_order "PlotFunctions.plot_network_allocation.leaf_order (Python parameter) — Indicates if the cluster are ordered so that the distance between successive leaves is minimal.")
\=`True`_, _[kind](https://riskfolio-lib.readthedocs.io/en/latest/plot.html#PlotFunctions.plot_network_allocation.kind "PlotFunctions.plot_network_allocation.kind (Python parameter) — Kind of networkx layout.")
\=`'spring'`_, _[seed](https://riskfolio-lib.readthedocs.io/en/latest/plot.html#PlotFunctions.plot_network_allocation.seed "PlotFunctions.plot_network_allocation.seed (Python parameter) — Seed for networkx spring layout.")
\=`0`_, _[node\_labels](https://riskfolio-lib.readthedocs.io/en/latest/plot.html#PlotFunctions.plot_network_allocation.node_labels "PlotFunctions.plot_network_allocation.node_labels (Python parameter) — Specify if node lables are visible.")
\=`True`_, _[max\_node\_size](https://riskfolio-lib.readthedocs.io/en/latest/plot.html#PlotFunctions.plot_network_allocation.max_node_size "PlotFunctions.plot_network_allocation.max_node_size (Python parameter) — Size of the node with maximum weight in absolute value.")
\=`2000`_, _[color\_lng](https://riskfolio-lib.readthedocs.io/en/latest/plot.html#PlotFunctions.plot_network_allocation.color_lng "PlotFunctions.plot_network_allocation.color_lng (Python parameter) — Color of assets with long positions.")
\=`'tab:blue'`_, _[color\_sht](https://riskfolio-lib.readthedocs.io/en/latest/plot.html#PlotFunctions.plot_network_allocation.color_sht "PlotFunctions.plot_network_allocation.color_sht (Python parameter) — Color of assets with short positions.")
\=`'tab:red'`_, _[label\_v](https://riskfolio-lib.readthedocs.io/en/latest/plot.html#PlotFunctions.plot_network_allocation.label_v "PlotFunctions.plot_network_allocation.label_v (Python parameter) — Vertical distance the label is offset from the center.")
\=`0.08`_, _[label\_h](https://riskfolio-lib.readthedocs.io/en/latest/plot.html#PlotFunctions.plot_network_allocation.label_h "PlotFunctions.plot_network_allocation.label_h (Python parameter) — Horizontal distance the label is offset from the center.")
\=`0`_, _[font\_size](https://riskfolio-lib.readthedocs.io/en/latest/plot.html#PlotFunctions.plot_network_allocation.font_size "PlotFunctions.plot_network_allocation.font_size (Python parameter) — Font size of node labels.")
\=`10`_, _[title](https://riskfolio-lib.readthedocs.io/en/latest/plot.html#PlotFunctions.plot_network_allocation.title "PlotFunctions.plot_network_allocation.title (Python parameter) — Title of the chart.")
\=`''`_, _[height](https://riskfolio-lib.readthedocs.io/en/latest/plot.html#PlotFunctions.plot_network_allocation.height "PlotFunctions.plot_network_allocation.height (Python parameter) — Height of the image in inches.")
\=`8`_, _[width](https://riskfolio-lib.readthedocs.io/en/latest/plot.html#PlotFunctions.plot_network_allocation.width "PlotFunctions.plot_network_allocation.width (Python parameter) — Width of the image in inches.")
\=`10`_, _[ax](https://riskfolio-lib.readthedocs.io/en/latest/plot.html#PlotFunctions.plot_network_allocation.ax "PlotFunctions.plot_network_allocation.ax (Python parameter) — If provided, plot on this axis.")
\=`None`_)[\[source\]](https://riskfolio-lib.readthedocs.io/en/latest/_modules/PlotFunctions.html#plot_network_allocation)
[¶](https://riskfolio-lib.readthedocs.io/en/latest/plot.html#PlotFunctions.plot_network_allocation "Link to this definition")
Create a network plot with node size of the nodes and color represents the amount invested and direction (long-short) respectively. The Planar Maximally Filtered Graph (PMFG) for DBHT linkage and Minimum Spanning Tree (MST) for other linkage methods.
Parameters:[¶](https://riskfolio-lib.readthedocs.io/en/latest/plot.html#PlotFunctions.plot_network_allocation-parameters "Permalink to this headline")
returns : DataFrame of shape (n\_samples, n\_assets)[¶](https://riskfolio-lib.readthedocs.io/en/latest/plot.html#PlotFunctions.plot_network_allocation.returns "Permalink to this definition")
Assets returns DataFrame, where n\_samples is the number of observations and n\_assets is the number of assets.
w : DataFrame or Series of shape (n\_assets, 1)[¶](https://riskfolio-lib.readthedocs.io/en/latest/plot.html#PlotFunctions.plot_network_allocation.w "Permalink to this definition")
Portfolio weights, where n\_assets is the number of assets.
custom\_cov : DataFrame or None, optional[¶](https://riskfolio-lib.readthedocs.io/en/latest/plot.html#PlotFunctions.plot_network_allocation.custom_cov "Permalink to this definition")
Custom covariance matrix, used when codependence parameter has value ‘custom\_cov’. The default is None.
codependence : [str](https://docs.python.org/3.11/library/stdtypes.html#str "(in Python v3.11)")
, can be {'pearson', 'spearman', 'abs\_pearson', 'abs\_spearman', 'distance', 'mutual\_info', 'tail' or 'custom\_cov'}[¶](https://riskfolio-lib.readthedocs.io/en/latest/plot.html#PlotFunctions.plot_network_allocation.codependence "Permalink to this definition")
The codependence or similarity matrix used to build the distance metric and clusters. The default is ‘pearson’. Possible values are:
* ’pearson’: pearson correlation matrix. Distance formula: Di,j\=0.5(1−ρi,jpearson).
* ’spearman’: spearman correlation matrix. Distance formula: Di,j\=0.5(1−ρi,jspearman).
* ’kendall’: kendall correlation matrix. Distance formula: Di,j\=0.5(1−ρi,jkendall).
* ’gerber1’: Gerber statistic 1 correlation matrix. Distance formula: Di,j\=0.5(1−ρi,jgerber1).
* ’gerber2’: Gerber statistic 2 correlation matrix. Distance formula: Di,j\=0.5(1−ρi,jgerber2).
* ’abs\_pearson’: absolute value pearson correlation matrix. Distance formula: Di,j\=(1−|ρi,j|).
* ’abs\_spearman’: absolute value spearman correlation matrix. Distance formula: Di,j\=(1−|ρi,j|).
* ’abs\_kendall’: absolute value kendall correlation matrix. Distance formula: Di,j\=(1−|ρi,jkendall|).
* ’distance’: distance correlation matrix. Distance formula Di,j\=(1−ρi,jdistance).
* ’mutual\_info’: mutual information matrix. Distance used is variation information matrix.
* ’tail’: lower tail dependence index matrix. Dissimilarity formula Di,j\=−logλi,j.
* ’custom\_cov’: use custom correlation matrix based on the custom\_cov parameter. Distance formula: Di,j\=0.5(1−ρi,jpearson).
linkage : string, optional[¶](https://riskfolio-lib.readthedocs.io/en/latest/plot.html#PlotFunctions.plot_network_allocation.linkage "Permalink to this definition")
Linkage method of hierarchical clustering, see [linkage](https://docs.scipy.org/doc/scipy/reference/generated/scipy.cluster.hierarchy.linkage.html?highlight=linkage#scipy.cluster.hierarchy.linkage)
for more details. The default is ‘ward’. Possible values are:
* ’single’.
* ’complete’.
* ’average’.
* ’weighted’.
* ’centroid’.
* ’median’.
* ’ward’.
* ’DBHT’: Direct Bubble Hierarchical Tree.
bins\_info : [int](https://docs.python.org/3.11/library/functions.html#int "(in Python v3.11)")
or [str](https://docs.python.org/3.11/library/stdtypes.html#str "(in Python v3.11)")
[¶](https://riskfolio-lib.readthedocs.io/en/latest/plot.html#PlotFunctions.plot_network_allocation.bins_info "Permalink to this definition")
Number of bins used to calculate variation of information. The default value is ‘KN’. Possible values are:
* ’KN’: Knuth’s choice method. See more in [knuth\_bin\_width](https://docs.astropy.org/en/stable/api/astropy.stats.knuth_bin_width.html)
.
* ’FD’: Freedman–Diaconis’ choice method. See more in [freedman\_bin\_width](https://docs.astropy.org/en/stable/api/astropy.stats.freedman_bin_width.html)
.
* ’SC’: Scotts’ choice method. See more in [scott\_bin\_width](https://docs.astropy.org/en/stable/api/astropy.stats.scott_bin_width.html)
.
* ’HGR’: Hacine-Gharbi and Ravier’ choice method.
* int: integer value chosen by user.
alpha\_tail : [float](https://docs.python.org/3.11/library/functions.html#float "(in Python v3.11)")
, optional[¶](https://riskfolio-lib.readthedocs.io/en/latest/plot.html#PlotFunctions.plot_network_allocation.alpha_tail "Permalink to this definition")
Significance level for lower tail dependence index. The default is 0.05.
gs\_threshold : [float](https://docs.python.org/3.11/library/functions.html#float "(in Python v3.11)")
, optional[¶](https://riskfolio-lib.readthedocs.io/en/latest/plot.html#PlotFunctions.plot_network_allocation.gs_threshold "Permalink to this definition")
Gerber statistic threshold. The default is 0.5.
leaf\_order : [bool](https://docs.python.org/3.11/library/functions.html#bool "(in Python v3.11)")
, optional[¶](https://riskfolio-lib.readthedocs.io/en/latest/plot.html#PlotFunctions.plot_network_allocation.leaf_order "Permalink to this definition")
Indicates if the cluster are ordered so that the distance between successive leaves is minimal. The default is True.
kind : [str](https://docs.python.org/3.11/library/stdtypes.html#str "(in Python v3.11)")
, optional[¶](https://riskfolio-lib.readthedocs.io/en/latest/plot.html#PlotFunctions.plot_network_allocation.kind "Permalink to this definition")
Kind of networkx layout. The default value is ‘spring’. Possible values are:
* ’spring’: networkx spring\_layout.
* ’planar’. networkx planar\_layout.
* ’circular’. networkx circular\_layout.
* ’kamada’. networkx kamada\_kawai\_layout.
seed : [int](https://docs.python.org/3.11/library/functions.html#int "(in Python v3.11)")
, optional[¶](https://riskfolio-lib.readthedocs.io/en/latest/plot.html#PlotFunctions.plot_network_allocation.seed "Permalink to this definition")
Seed for networkx spring layout. The default value is 0.
node\_labels : [bool](https://docs.python.org/3.11/library/functions.html#bool "(in Python v3.11)")
, optional[¶](https://riskfolio-lib.readthedocs.io/en/latest/plot.html#PlotFunctions.plot_network_allocation.node_labels "Permalink to this definition")
Specify if node lables are visible. The default value is True.
max\_node\_size : [float](https://docs.python.org/3.11/library/functions.html#float "(in Python v3.11)")
, optional[¶](https://riskfolio-lib.readthedocs.io/en/latest/plot.html#PlotFunctions.plot_network_allocation.max_node_size "Permalink to this definition")
Size of the node with maximum weight in absolute value. The default value is 2000.
color\_lng : [str](https://docs.python.org/3.11/library/stdtypes.html#str "(in Python v3.11)")
, optional[¶](https://riskfolio-lib.readthedocs.io/en/latest/plot.html#PlotFunctions.plot_network_allocation.color_lng "Permalink to this definition")
Color of assets with long positions. The default value is ‘tab:blue’.
color\_sht : [str](https://docs.python.org/3.11/library/stdtypes.html#str "(in Python v3.11)")
, optional[¶](https://riskfolio-lib.readthedocs.io/en/latest/plot.html#PlotFunctions.plot_network_allocation.color_sht "Permalink to this definition")
Color of assets with short positions. The default value is ‘tab:red’.
label\_v : [float](https://docs.python.org/3.11/library/functions.html#float "(in Python v3.11)")
, optional[¶](https://riskfolio-lib.readthedocs.io/en/latest/plot.html#PlotFunctions.plot_network_allocation.label_v "Permalink to this definition")
Vertical distance the label is offset from the center. The default value is 0.08.
label\_h : [float](https://docs.python.org/3.11/library/functions.html#float "(in Python v3.11)")
, optional[¶](https://riskfolio-lib.readthedocs.io/en/latest/plot.html#PlotFunctions.plot_network_allocation.label_h "Permalink to this definition")
Horizontal distance the label is offset from the center. The default value is 0.
font\_size : [float](https://docs.python.org/3.11/library/functions.html#float "(in Python v3.11)")
, optional[¶](https://riskfolio-lib.readthedocs.io/en/latest/plot.html#PlotFunctions.plot_network_allocation.font_size "Permalink to this definition")
Font size of node labels. The default value is 12.
title : [str](https://docs.python.org/3.11/library/stdtypes.html#str "(in Python v3.11)")
, optional[¶](https://riskfolio-lib.readthedocs.io/en/latest/plot.html#PlotFunctions.plot_network_allocation.title "Permalink to this definition")
Title of the chart. The default is “”.
height : [float](https://docs.python.org/3.11/library/functions.html#float "(in Python v3.11)")
, optional[¶](https://riskfolio-lib.readthedocs.io/en/latest/plot.html#PlotFunctions.plot_network_allocation.height "Permalink to this definition")
Height of the image in inches. The default is 8.
width : [float](https://docs.python.org/3.11/library/functions.html#float "(in Python v3.11)")
, optional[¶](https://riskfolio-lib.readthedocs.io/en/latest/plot.html#PlotFunctions.plot_network_allocation.width "Permalink to this definition")
Width of the image in inches. The default is 10.
ax : matplotlib axis, optional[¶](https://riskfolio-lib.readthedocs.io/en/latest/plot.html#PlotFunctions.plot_network_allocation.ax "Permalink to this definition")
If provided, plot on this axis. The default is None.
Raises:[¶](https://riskfolio-lib.readthedocs.io/en/latest/plot.html#PlotFunctions.plot_network_allocation-raises "Permalink to this headline")
[**ValueError**](https://docs.python.org/3.11/library/exceptions.html#ValueError "(in Python v3.11)")
– When the value cannot be calculated.
Returns:[¶](https://riskfolio-lib.readthedocs.io/en/latest/plot.html#PlotFunctions.plot_network_allocation-returns "Permalink to this headline")
**ax** – Returns the Axes object with the plot for further tweaking.
Return type:[¶](https://riskfolio-lib.readthedocs.io/en/latest/plot.html#PlotFunctions.plot_network_allocation-return-type "Permalink to this headline")
matplotlib axis
Example
`ax = rp.plot_network_allocation(returns=Y, w=w1, codependence="pearson", linkage="ward", alpha_tail=0.05, leaf_order=True, kind='kamada', ax=None)`
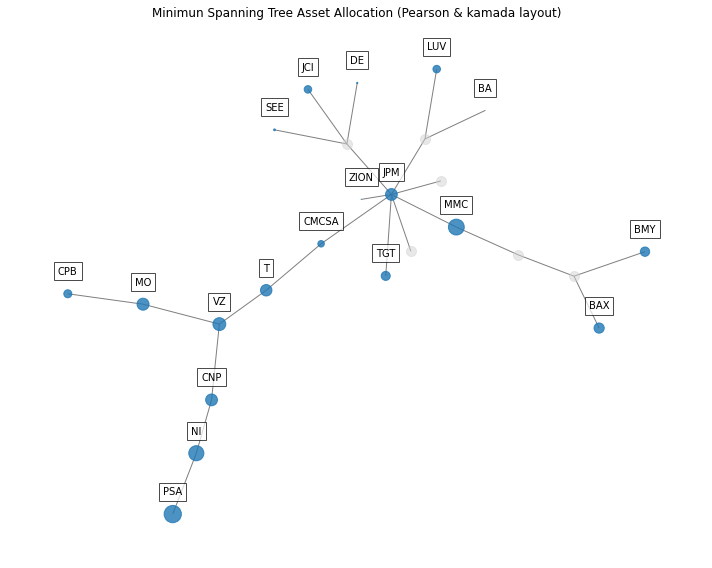
PlotFunctions.plot\_clusters\_network(_[returns](https://riskfolio-lib.readthedocs.io/en/latest/plot.html#PlotFunctions.plot_clusters_network.returns "PlotFunctions.plot_clusters_network.returns (Python parameter) — Assets returns DataFrame, where n_samples is the number of observations and n_assets is the number of assets.")
_, _[custom\_cov](https://riskfolio-lib.readthedocs.io/en/latest/plot.html#PlotFunctions.plot_clusters_network.custom_cov "PlotFunctions.plot_clusters_network.custom_cov (Python parameter) — Custom covariance matrix, used when codependence parameter has value 'custom_cov'.")
\=`None`_, _[codependence](https://riskfolio-lib.readthedocs.io/en/latest/plot.html#PlotFunctions.plot_clusters_network.codependence "PlotFunctions.plot_clusters_network.codependence (Python parameter) — The codependence or similarity matrix used to build the distance metric and clusters.")
\=`'pearson'`_, _[linkage](https://riskfolio-lib.readthedocs.io/en/latest/plot.html#PlotFunctions.plot_clusters_network.linkage "PlotFunctions.plot_clusters_network.linkage (Python parameter) — Duplicate explicit target name: "linkage".")
\=`'ward'`_, _[opt\_k\_method](https://riskfolio-lib.readthedocs.io/en/latest/plot.html#PlotFunctions.plot_clusters_network.opt_k_method "PlotFunctions.plot_clusters_network.opt_k_method (Python parameter) — Method used to calculate the optimum number of clusters. The default is 'twodiff'.")
\=`'twodiff'`_, _[k](https://riskfolio-lib.readthedocs.io/en/latest/plot.html#PlotFunctions.plot_clusters_network.k "PlotFunctions.plot_clusters_network.k (Python parameter) — Number of clusters.")
\=`None`_, _[max\_k](https://riskfolio-lib.readthedocs.io/en/latest/plot.html#PlotFunctions.plot_clusters_network.max_k "PlotFunctions.plot_clusters_network.max_k (Python parameter) — Max number of clusters used by the two difference gap statistic to find the optimal number of clusters.")
\=`10`_, _[bins\_info](https://riskfolio-lib.readthedocs.io/en/latest/plot.html#PlotFunctions.plot_clusters_network.bins_info "PlotFunctions.plot_clusters_network.bins_info (Python parameter) — Number of bins used to calculate variation of information.")
\=`'KN'`_, _[alpha\_tail](https://riskfolio-lib.readthedocs.io/en/latest/plot.html#PlotFunctions.plot_clusters_network.alpha_tail "PlotFunctions.plot_clusters_network.alpha_tail (Python parameter) — Significance level for lower tail dependence index.")
\=`0.05`_, _[gs\_threshold](https://riskfolio-lib.readthedocs.io/en/latest/plot.html#PlotFunctions.plot_clusters_network.gs_threshold "PlotFunctions.plot_clusters_network.gs_threshold (Python parameter) — Gerber statistic threshold.")
\=`0.5`_, _[leaf\_order](https://riskfolio-lib.readthedocs.io/en/latest/plot.html#PlotFunctions.plot_clusters_network.leaf_order "PlotFunctions.plot_clusters_network.leaf_order (Python parameter) — Indicates if the cluster are ordered so that the distance between successive leaves is minimal.")
\=`True`_, _[seed](https://riskfolio-lib.readthedocs.io/en/latest/plot.html#PlotFunctions.plot_clusters_network.seed "PlotFunctions.plot_clusters_network.seed (Python parameter) — Seed for networkx spring layout.")
\=`0`_, _[node\_labels](https://riskfolio-lib.readthedocs.io/en/latest/plot.html#PlotFunctions.plot_clusters_network.node_labels "PlotFunctions.plot_clusters_network.node_labels (Python parameter) — Specify if node lables are visible.")
\=`True`_, _[node\_size](https://riskfolio-lib.readthedocs.io/en/latest/plot.html#PlotFunctions.plot_clusters_network.node_size "PlotFunctions.plot_clusters_network.node_size (Python parameter) — Size of the node.")
\=`2000`_, _[node\_alpha](https://riskfolio-lib.readthedocs.io/en/latest/plot.html#PlotFunctions.plot_clusters_network.node_alpha "PlotFunctions.plot_clusters_network.node_alpha (Python parameter) — Alpha parameter or transparency of nodes.")
\=`0.7`_, _[scale](https://riskfolio-lib.readthedocs.io/en/latest/plot.html#PlotFunctions.plot_clusters_network.scale "PlotFunctions.plot_clusters_network.scale (Python parameter) — Scale of whole graph.")
\=`10`_, _[subscale](https://riskfolio-lib.readthedocs.io/en/latest/plot.html#PlotFunctions.plot_clusters_network.subscale "PlotFunctions.plot_clusters_network.subscale (Python parameter) — Scale of clusters.")
\=`5`_, _[font\_size](https://riskfolio-lib.readthedocs.io/en/latest/plot.html#PlotFunctions.plot_clusters_network.font_size "PlotFunctions.plot_clusters_network.font_size (Python parameter) — Font size of node labels.")
\=`10`_, _[title](https://riskfolio-lib.readthedocs.io/en/latest/plot.html#PlotFunctions.plot_clusters_network.title "PlotFunctions.plot_clusters_network.title (Python parameter) — Title of the chart.")
\=`''`_, _[height](https://riskfolio-lib.readthedocs.io/en/latest/plot.html#PlotFunctions.plot_clusters_network.height "PlotFunctions.plot_clusters_network.height (Python parameter) — Height of the image in inches.")
\=`8`_, _[width](https://riskfolio-lib.readthedocs.io/en/latest/plot.html#PlotFunctions.plot_clusters_network.width "PlotFunctions.plot_clusters_network.width (Python parameter) — Width of the image in inches.")
\=`10`_, _[ax](https://riskfolio-lib.readthedocs.io/en/latest/plot.html#PlotFunctions.plot_clusters_network.ax "PlotFunctions.plot_clusters_network.ax (Python parameter) — If provided, plot on this axis.")
\=`None`_)[\[source\]](https://riskfolio-lib.readthedocs.io/en/latest/_modules/PlotFunctions.html#plot_clusters_network)
[¶](https://riskfolio-lib.readthedocs.io/en/latest/plot.html#PlotFunctions.plot_clusters_network "Link to this definition")
Create a network plot that show each cluster obtained from the dendrogram as an independent graph.
Parameters:[¶](https://riskfolio-lib.readthedocs.io/en/latest/plot.html#PlotFunctions.plot_clusters_network-parameters "Permalink to this headline")
returns : DataFrame of shape (n\_samples, n\_assets)[¶](https://riskfolio-lib.readthedocs.io/en/latest/plot.html#PlotFunctions.plot_clusters_network.returns "Permalink to this definition")
Assets returns DataFrame, where n\_samples is the number of observations and n\_assets is the number of assets.
custom\_cov : DataFrame or None, optional[¶](https://riskfolio-lib.readthedocs.io/en/latest/plot.html#PlotFunctions.plot_clusters_network.custom_cov "Permalink to this definition")
Custom covariance matrix, used when codependence parameter has value ‘custom\_cov’. The default is None.
codependence : [str](https://docs.python.org/3.11/library/stdtypes.html#str "(in Python v3.11)")
, can be {'pearson', 'spearman', 'abs\_pearson', 'abs\_spearman', 'distance', 'mutual\_info', 'tail' or 'custom\_cov'}[¶](https://riskfolio-lib.readthedocs.io/en/latest/plot.html#PlotFunctions.plot_clusters_network.codependence "Permalink to this definition")
The codependence or similarity matrix used to build the distance metric and clusters. The default is ‘pearson’. Possible values are:
* ’pearson’: pearson correlation matrix. Distance formula: Di,j\=0.5(1−ρi,jpearson).
* ’spearman’: spearman correlation matrix. Distance formula: Di,j\=0.5(1−ρi,jspearman).
* ’kendall’: kendall correlation matrix. Distance formula: Di,j\=0.5(1−ρi,jkendall).
* ’gerber1’: Gerber statistic 1 correlation matrix. Distance formula: Di,j\=0.5(1−ρi,jgerber1).
* ’gerber2’: Gerber statistic 2 correlation matrix. Distance formula: Di,j\=0.5(1−ρi,jgerber2).
* ’abs\_pearson’: absolute value pearson correlation matrix. Distance formula: Di,j\=(1−|ρi,j|).
* ’abs\_spearman’: absolute value spearman correlation matrix. Distance formula: Di,j\=(1−|ρi,j|).
* ’abs\_kendall’: absolute value kendall correlation matrix. Distance formula: Di,j\=(1−|ρi,jkendall|).
* ’distance’: distance correlation matrix. Distance formula Di,j\=(1−ρi,jdistance).
* ’mutual\_info’: mutual information matrix. Distance used is variation information matrix.
* ’tail’: lower tail dependence index matrix. Dissimilarity formula Di,j\=−logλi,j.
* ’custom\_cov’: use custom correlation matrix based on the custom\_cov parameter. Distance formula: Di,j\=0.5(1−ρi,jpearson).
linkage : string, optional[¶](https://riskfolio-lib.readthedocs.io/en/latest/plot.html#PlotFunctions.plot_clusters_network.linkage "Permalink to this definition")
Linkage method of hierarchical clustering, see [linkage](https://docs.scipy.org/doc/scipy/reference/generated/scipy.cluster.hierarchy.linkage.html?highlight=linkage#scipy.cluster.hierarchy.linkage)
for more details. The default is ‘ward’. Possible values are:
* ’single’.
* ’complete’.
* ’average’.
* ’weighted’.
* ’centroid’.
* ’median’.
* ’ward’.
* ’DBHT’: Direct Bubble Hierarchical Tree.
opt\_k\_method : [str](https://docs.python.org/3.11/library/stdtypes.html#str "(in Python v3.11)")
[¶](https://riskfolio-lib.readthedocs.io/en/latest/plot.html#PlotFunctions.plot_clusters_network.opt_k_method "Permalink to this definition")
Method used to calculate the optimum number of clusters. The default is ‘twodiff’. Possible values are:
* ’twodiff’: two difference gap statistic.
* ’stdsil’: standarized silhouette score.
k : [int](https://docs.python.org/3.11/library/functions.html#int "(in Python v3.11)")
, optional[¶](https://riskfolio-lib.readthedocs.io/en/latest/plot.html#PlotFunctions.plot_clusters_network.k "Permalink to this definition")
Number of clusters. This value is took instead of the optimal number of clusters calculated with the two difference gap statistic. The default is None.
max\_k : [int](https://docs.python.org/3.11/library/functions.html#int "(in Python v3.11)")
, optional[¶](https://riskfolio-lib.readthedocs.io/en/latest/plot.html#PlotFunctions.plot_clusters_network.max_k "Permalink to this definition")
Max number of clusters used by the two difference gap statistic to find the optimal number of clusters. The default is 10.
bins\_info : [int](https://docs.python.org/3.11/library/functions.html#int "(in Python v3.11)")
or [str](https://docs.python.org/3.11/library/stdtypes.html#str "(in Python v3.11)")
[¶](https://riskfolio-lib.readthedocs.io/en/latest/plot.html#PlotFunctions.plot_clusters_network.bins_info "Permalink to this definition")
Number of bins used to calculate variation of information. The default value is ‘KN’. Possible values are:
* ’KN’: Knuth’s choice method. See more in [knuth\_bin\_width](https://docs.astropy.org/en/stable/api/astropy.stats.knuth_bin_width.html)
.
* ’FD’: Freedman–Diaconis’ choice method. See more in [freedman\_bin\_width](https://docs.astropy.org/en/stable/api/astropy.stats.freedman_bin_width.html)
.
* ’SC’: Scotts’ choice method. See more in [scott\_bin\_width](https://docs.astropy.org/en/stable/api/astropy.stats.scott_bin_width.html)
.
* ’HGR’: Hacine-Gharbi and Ravier’ choice method.
* int: integer value chosen by user.
alpha\_tail : [float](https://docs.python.org/3.11/library/functions.html#float "(in Python v3.11)")
, optional[¶](https://riskfolio-lib.readthedocs.io/en/latest/plot.html#PlotFunctions.plot_clusters_network.alpha_tail "Permalink to this definition")
Significance level for lower tail dependence index. The default is 0.05.
gs\_threshold : [float](https://docs.python.org/3.11/library/functions.html#float "(in Python v3.11)")
, optional[¶](https://riskfolio-lib.readthedocs.io/en/latest/plot.html#PlotFunctions.plot_clusters_network.gs_threshold "Permalink to this definition")
Gerber statistic threshold. The default is 0.5.
leaf\_order : [bool](https://docs.python.org/3.11/library/functions.html#bool "(in Python v3.11)")
, optional[¶](https://riskfolio-lib.readthedocs.io/en/latest/plot.html#PlotFunctions.plot_clusters_network.leaf_order "Permalink to this definition")
Indicates if the cluster are ordered so that the distance between successive leaves is minimal. The default is True.
seed : [int](https://docs.python.org/3.11/library/functions.html#int "(in Python v3.11)")
, optional[¶](https://riskfolio-lib.readthedocs.io/en/latest/plot.html#PlotFunctions.plot_clusters_network.seed "Permalink to this definition")
Seed for networkx spring layout. The default value is 0.
node\_labels : [bool](https://docs.python.org/3.11/library/functions.html#bool "(in Python v3.11)")
, optional[¶](https://riskfolio-lib.readthedocs.io/en/latest/plot.html#PlotFunctions.plot_clusters_network.node_labels "Permalink to this definition")
Specify if node lables are visible. The default value is True.
node\_size : [float](https://docs.python.org/3.11/library/functions.html#float "(in Python v3.11)")
, optional[¶](https://riskfolio-lib.readthedocs.io/en/latest/plot.html#PlotFunctions.plot_clusters_network.node_size "Permalink to this definition")
Size of the node. The default value is 2000.
node\_alpha : [float](https://docs.python.org/3.11/library/functions.html#float "(in Python v3.11)")
, optional[¶](https://riskfolio-lib.readthedocs.io/en/latest/plot.html#PlotFunctions.plot_clusters_network.node_alpha "Permalink to this definition")
Alpha parameter or transparency of nodes. The default value is 0.7.
scale : [float](https://docs.python.org/3.11/library/functions.html#float "(in Python v3.11)")
, optional[¶](https://riskfolio-lib.readthedocs.io/en/latest/plot.html#PlotFunctions.plot_clusters_network.scale "Permalink to this definition")
Scale of whole graph. The default value is 10.
subscale : [float](https://docs.python.org/3.11/library/functions.html#float "(in Python v3.11)")
, optional[¶](https://riskfolio-lib.readthedocs.io/en/latest/plot.html#PlotFunctions.plot_clusters_network.subscale "Permalink to this definition")
Scale of clusters. The default value is 5.
font\_size : [float](https://docs.python.org/3.11/library/functions.html#float "(in Python v3.11)")
, optional[¶](https://riskfolio-lib.readthedocs.io/en/latest/plot.html#PlotFunctions.plot_clusters_network.font_size "Permalink to this definition")
Font size of node labels. The default value is 12.
title : [str](https://docs.python.org/3.11/library/stdtypes.html#str "(in Python v3.11)")
, optional[¶](https://riskfolio-lib.readthedocs.io/en/latest/plot.html#PlotFunctions.plot_clusters_network.title "Permalink to this definition")
Title of the chart. The default is “”.
height : [float](https://docs.python.org/3.11/library/functions.html#float "(in Python v3.11)")
, optional[¶](https://riskfolio-lib.readthedocs.io/en/latest/plot.html#PlotFunctions.plot_clusters_network.height "Permalink to this definition")
Height of the image in inches. The default is 8.
width : [float](https://docs.python.org/3.11/library/functions.html#float "(in Python v3.11)")
, optional[¶](https://riskfolio-lib.readthedocs.io/en/latest/plot.html#PlotFunctions.plot_clusters_network.width "Permalink to this definition")
Width of the image in inches. The default is 10.
ax : matplotlib axis, optional[¶](https://riskfolio-lib.readthedocs.io/en/latest/plot.html#PlotFunctions.plot_clusters_network.ax "Permalink to this definition")
If provided, plot on this axis. The default is None.
Raises:[¶](https://riskfolio-lib.readthedocs.io/en/latest/plot.html#PlotFunctions.plot_clusters_network-raises "Permalink to this headline")
[**ValueError**](https://docs.python.org/3.11/library/exceptions.html#ValueError "(in Python v3.11)")
– When the value cannot be calculated.
Returns:[¶](https://riskfolio-lib.readthedocs.io/en/latest/plot.html#PlotFunctions.plot_clusters_network-returns "Permalink to this headline")
**ax** – Returns the Axes object with the plot for further tweaking.
Return type:[¶](https://riskfolio-lib.readthedocs.io/en/latest/plot.html#PlotFunctions.plot_clusters_network-return-type "Permalink to this headline")
matplotlib axis
Example
`ax = rp.plot_clusters_network(returns=Y, codependence="pearson", linkage="ward", k=None, max_k=10, ax=None)`
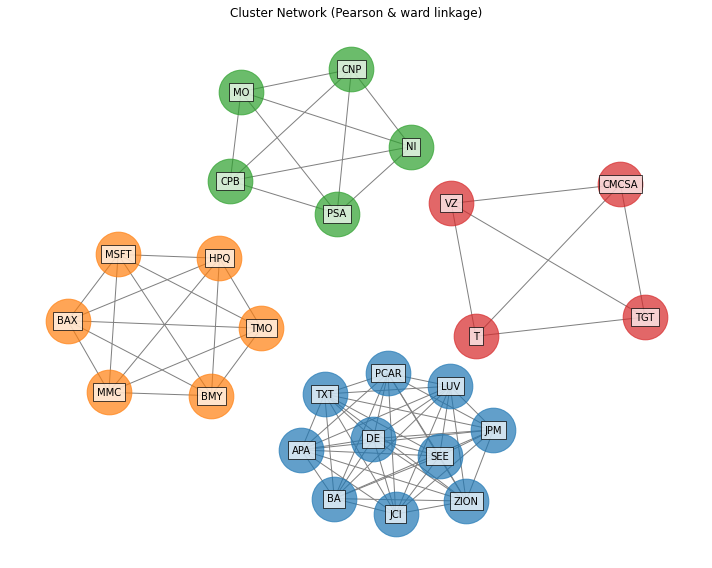
PlotFunctions.plot\_clusters\_network\_allocation(_[returns](https://riskfolio-lib.readthedocs.io/en/latest/plot.html#PlotFunctions.plot_clusters_network_allocation.returns "PlotFunctions.plot_clusters_network_allocation.returns (Python parameter) — Assets returns DataFrame, where n_samples is the number of observations and n_assets is the number of assets.")
_, _[w](https://riskfolio-lib.readthedocs.io/en/latest/plot.html#PlotFunctions.plot_clusters_network_allocation.w "PlotFunctions.plot_clusters_network_allocation.w (Python parameter) — Portfolio weights, where n_assets is the number of assets.")
_, _[custom\_cov](https://riskfolio-lib.readthedocs.io/en/latest/plot.html#PlotFunctions.plot_clusters_network_allocation.custom_cov "PlotFunctions.plot_clusters_network_allocation.custom_cov (Python parameter) — Custom covariance matrix, used when codependence parameter has value 'custom_cov'.")
\=`None`_, _[codependence](https://riskfolio-lib.readthedocs.io/en/latest/plot.html#PlotFunctions.plot_clusters_network_allocation.codependence "PlotFunctions.plot_clusters_network_allocation.codependence (Python parameter) — The codependence or similarity matrix used to build the distance metric and clusters.")
\=`'pearson'`_, _[linkage](https://riskfolio-lib.readthedocs.io/en/latest/plot.html#PlotFunctions.plot_clusters_network_allocation.linkage "PlotFunctions.plot_clusters_network_allocation.linkage (Python parameter) — Duplicate explicit target name: "linkage".")
\=`'ward'`_, _[opt\_k\_method](https://riskfolio-lib.readthedocs.io/en/latest/plot.html#PlotFunctions.plot_clusters_network_allocation "PlotFunctions.plot_clusters_network_allocation.opt_k_method (Python parameter)")
\=`'twodiff'`_, _[k](https://riskfolio-lib.readthedocs.io/en/latest/plot.html#PlotFunctions.plot_clusters_network_allocation "PlotFunctions.plot_clusters_network_allocation.k (Python parameter)")
\=`None`_, _[max\_k](https://riskfolio-lib.readthedocs.io/en/latest/plot.html#PlotFunctions.plot_clusters_network_allocation "PlotFunctions.plot_clusters_network_allocation.max_k (Python parameter)")
\=`10`_, _[bins\_info](https://riskfolio-lib.readthedocs.io/en/latest/plot.html#PlotFunctions.plot_clusters_network_allocation.bins_info "PlotFunctions.plot_clusters_network_allocation.bins_info (Python parameter) — Number of bins used to calculate variation of information.")
\=`'KN'`_, _[alpha\_tail](https://riskfolio-lib.readthedocs.io/en/latest/plot.html#PlotFunctions.plot_clusters_network_allocation.alpha_tail "PlotFunctions.plot_clusters_network_allocation.alpha_tail (Python parameter) — Significance level for lower tail dependence index.")
\=`0.05`_, _[gs\_threshold](https://riskfolio-lib.readthedocs.io/en/latest/plot.html#PlotFunctions.plot_clusters_network_allocation.gs_threshold "PlotFunctions.plot_clusters_network_allocation.gs_threshold (Python parameter) — Gerber statistic threshold.")
\=`0.5`_, _[leaf\_order](https://riskfolio-lib.readthedocs.io/en/latest/plot.html#PlotFunctions.plot_clusters_network_allocation.leaf_order "PlotFunctions.plot_clusters_network_allocation.leaf_order (Python parameter) — Indicates if the cluster are ordered so that the distance between successive leaves is minimal.")
\=`True`_, _[seed](https://riskfolio-lib.readthedocs.io/en/latest/plot.html#PlotFunctions.plot_clusters_network_allocation.seed "PlotFunctions.plot_clusters_network_allocation.seed (Python parameter) — Seed for networkx spring layout.")
\=`0`_, _[node\_labels](https://riskfolio-lib.readthedocs.io/en/latest/plot.html#PlotFunctions.plot_clusters_network_allocation.node_labels "PlotFunctions.plot_clusters_network_allocation.node_labels (Python parameter) — Specify if node lables are visible.")
\=`True`_, _[max\_node\_size](https://riskfolio-lib.readthedocs.io/en/latest/plot.html#PlotFunctions.plot_clusters_network_allocation.max_node_size "PlotFunctions.plot_clusters_network_allocation.max_node_size (Python parameter) — Size of the node with maximum weight in absolute value.")
\=`2000`_, _[color\_lng](https://riskfolio-lib.readthedocs.io/en/latest/plot.html#PlotFunctions.plot_clusters_network_allocation.color_lng "PlotFunctions.plot_clusters_network_allocation.color_lng (Python parameter) — Color of assets with long positions.")
\=`'tab:blue'`_, _[color\_sht](https://riskfolio-lib.readthedocs.io/en/latest/plot.html#PlotFunctions.plot_clusters_network_allocation.color_sht "PlotFunctions.plot_clusters_network_allocation.color_sht (Python parameter) — Color of assets with short positions.")
\=`'tab:red'`_, _[scale](https://riskfolio-lib.readthedocs.io/en/latest/plot.html#PlotFunctions.plot_clusters_network_allocation.scale "PlotFunctions.plot_clusters_network_allocation.scale (Python parameter) — Scale of whole graph.")
\=`10`_, _[subscale](https://riskfolio-lib.readthedocs.io/en/latest/plot.html#PlotFunctions.plot_clusters_network_allocation.subscale "PlotFunctions.plot_clusters_network_allocation.subscale (Python parameter) — Scale of clusters.")
\=`5`_, _[label\_v](https://riskfolio-lib.readthedocs.io/en/latest/plot.html#PlotFunctions.plot_clusters_network_allocation.label_v "PlotFunctions.plot_clusters_network_allocation.label_v (Python parameter) — Vertical distance the label is offset from the center.")
\=`1.5`_, _[label\_h](https://riskfolio-lib.readthedocs.io/en/latest/plot.html#PlotFunctions.plot_clusters_network_allocation.label_h "PlotFunctions.plot_clusters_network_allocation.label_h (Python parameter) — Horizontal distance the label is offset from the center.")
\=`0`_, _[font\_size](https://riskfolio-lib.readthedocs.io/en/latest/plot.html#PlotFunctions.plot_clusters_network_allocation.font_size "PlotFunctions.plot_clusters_network_allocation.font_size (Python parameter) — Font size of node labels.")
\=`10`_, _[title](https://riskfolio-lib.readthedocs.io/en/latest/plot.html#PlotFunctions.plot_clusters_network_allocation.title "PlotFunctions.plot_clusters_network_allocation.title (Python parameter) — Title of the chart.")
\=`''`_, _[height](https://riskfolio-lib.readthedocs.io/en/latest/plot.html#PlotFunctions.plot_clusters_network_allocation.height "PlotFunctions.plot_clusters_network_allocation.height (Python parameter) — Height of the image in inches.")
\=`8`_, _[width](https://riskfolio-lib.readthedocs.io/en/latest/plot.html#PlotFunctions.plot_clusters_network_allocation.width "PlotFunctions.plot_clusters_network_allocation.width (Python parameter) — Width of the image in inches.")
\=`10`_, _[ax](https://riskfolio-lib.readthedocs.io/en/latest/plot.html#PlotFunctions.plot_clusters_network_allocation.ax "PlotFunctions.plot_clusters_network_allocation.ax (Python parameter) — If provided, plot on this axis.")
\=`None`_)[\[source\]](https://riskfolio-lib.readthedocs.io/en/latest/_modules/PlotFunctions.html#plot_clusters_network_allocation)
[¶](https://riskfolio-lib.readthedocs.io/en/latest/plot.html#PlotFunctions.plot_clusters_network_allocation "Link to this definition")
Create a network plot that show each cluster obtained from the dendrogram as an independent graph. The size of the nodes and color represents the amount invested and direction (long-short) respectively.
Parameters:[¶](https://riskfolio-lib.readthedocs.io/en/latest/plot.html#PlotFunctions.plot_clusters_network_allocation-parameters "Permalink to this headline")
returns : DataFrame of shape (n\_samples, n\_assets)[¶](https://riskfolio-lib.readthedocs.io/en/latest/plot.html#PlotFunctions.plot_clusters_network_allocation.returns "Permalink to this definition")
Assets returns DataFrame, where n\_samples is the number of observations and n\_assets is the number of assets.
w : DataFrame or Series of shape (n\_assets, 1)[¶](https://riskfolio-lib.readthedocs.io/en/latest/plot.html#PlotFunctions.plot_clusters_network_allocation.w "Permalink to this definition")
Portfolio weights, where n\_assets is the number of assets.
custom\_cov : DataFrame or None, optional[¶](https://riskfolio-lib.readthedocs.io/en/latest/plot.html#PlotFunctions.plot_clusters_network_allocation.custom_cov "Permalink to this definition")
Custom covariance matrix, used when codependence parameter has value ‘custom\_cov’. The default is None.
codependence : [str](https://docs.python.org/3.11/library/stdtypes.html#str "(in Python v3.11)")
, can be {'pearson', 'spearman', 'abs\_pearson', 'abs\_spearman', 'distance', 'mutual\_info', 'tail' or 'custom\_cov'}[¶](https://riskfolio-lib.readthedocs.io/en/latest/plot.html#PlotFunctions.plot_clusters_network_allocation.codependence "Permalink to this definition")
The codependence or similarity matrix used to build the distance metric and clusters. The default is ‘pearson’. Possible values are:
* ’pearson’: pearson correlation matrix. Distance formula: Di,j\=0.5(1−ρi,jpearson).
* ’spearman’: spearman correlation matrix. Distance formula: Di,j\=0.5(1−ρi,jspearman).
* ’kendall’: kendall correlation matrix. Distance formula: Di,j\=0.5(1−ρi,jkendall).
* ’gerber1’: Gerber statistic 1 correlation matrix. Distance formula: Di,j\=0.5(1−ρi,jgerber1).
* ’gerber2’: Gerber statistic 2 correlation matrix. Distance formula: Di,j\=0.5(1−ρi,jgerber2).
* ’abs\_pearson’: absolute value pearson correlation matrix. Distance formula: Di,j\=(1−|ρi,j|).
* ’abs\_spearman’: absolute value spearman correlation matrix. Distance formula: Di,j\=(1−|ρi,j|).
* ’abs\_kendall’: absolute value kendall correlation matrix. Distance formula: Di,j\=(1−|ρi,jkendall|).
* ’distance’: distance correlation matrix. Distance formula Di,j\=(1−ρi,jdistance).
* ’mutual\_info’: mutual information matrix. Distance used is variation information matrix.
* ’tail’: lower tail dependence index matrix. Dissimilarity formula Di,j\=−logλi,j.
* ’custom\_cov’: use custom correlation matrix based on the custom\_cov parameter. Distance formula: Di,j\=0.5(1−ρi,jpearson).
linkage : string, optional[¶](https://riskfolio-lib.readthedocs.io/en/latest/plot.html#PlotFunctions.plot_clusters_network_allocation.linkage "Permalink to this definition")
Linkage method of hierarchical clustering, see [linkage](https://docs.scipy.org/doc/scipy/reference/generated/scipy.cluster.hierarchy.linkage.html?highlight=linkage#scipy.cluster.hierarchy.linkage)
for more details. The default is ‘ward’. Possible values are:
* ’single’.
* ’complete’.
* ’average’.
* ’weighted’.
* ’centroid’.
* ’median’.
* ’ward’.
* ’DBHT’: Direct Bubble Hierarchical Tree.
bins\_info : [int](https://docs.python.org/3.11/library/functions.html#int "(in Python v3.11)")
or [str](https://docs.python.org/3.11/library/stdtypes.html#str "(in Python v3.11)")
[¶](https://riskfolio-lib.readthedocs.io/en/latest/plot.html#PlotFunctions.plot_clusters_network_allocation.bins_info "Permalink to this definition")
Number of bins used to calculate variation of information. The default value is ‘KN’. Possible values are:
* ’KN’: Knuth’s choice method. See more in [knuth\_bin\_width](https://docs.astropy.org/en/stable/api/astropy.stats.knuth_bin_width.html)
.
* ’FD’: Freedman–Diaconis’ choice method. See more in [freedman\_bin\_width](https://docs.astropy.org/en/stable/api/astropy.stats.freedman_bin_width.html)
.
* ’SC’: Scotts’ choice method. See more in [scott\_bin\_width](https://docs.astropy.org/en/stable/api/astropy.stats.scott_bin_width.html)
.
* ’HGR’: Hacine-Gharbi and Ravier’ choice method.
* int: integer value chosen by user.
alpha\_tail : [float](https://docs.python.org/3.11/library/functions.html#float "(in Python v3.11)")
, optional[¶](https://riskfolio-lib.readthedocs.io/en/latest/plot.html#PlotFunctions.plot_clusters_network_allocation.alpha_tail "Permalink to this definition")
Significance level for lower tail dependence index. The default is 0.05.
gs\_threshold : [float](https://docs.python.org/3.11/library/functions.html#float "(in Python v3.11)")
, optional[¶](https://riskfolio-lib.readthedocs.io/en/latest/plot.html#PlotFunctions.plot_clusters_network_allocation.gs_threshold "Permalink to this definition")
Gerber statistic threshold. The default is 0.5.
leaf\_order : [bool](https://docs.python.org/3.11/library/functions.html#bool "(in Python v3.11)")
, optional[¶](https://riskfolio-lib.readthedocs.io/en/latest/plot.html#PlotFunctions.plot_clusters_network_allocation.leaf_order "Permalink to this definition")
Indicates if the cluster are ordered so that the distance between successive leaves is minimal. The default is True.
seed : [int](https://docs.python.org/3.11/library/functions.html#int "(in Python v3.11)")
, optional[¶](https://riskfolio-lib.readthedocs.io/en/latest/plot.html#PlotFunctions.plot_clusters_network_allocation.seed "Permalink to this definition")
Seed for networkx spring layout. The default value is 0.
node\_labels : [bool](https://docs.python.org/3.11/library/functions.html#bool "(in Python v3.11)")
, optional[¶](https://riskfolio-lib.readthedocs.io/en/latest/plot.html#PlotFunctions.plot_clusters_network_allocation.node_labels "Permalink to this definition")
Specify if node lables are visible. The default value is True.
max\_node\_size : [float](https://docs.python.org/3.11/library/functions.html#float "(in Python v3.11)")
, optional[¶](https://riskfolio-lib.readthedocs.io/en/latest/plot.html#PlotFunctions.plot_clusters_network_allocation.max_node_size "Permalink to this definition")
Size of the node with maximum weight in absolute value. The default value is 2000.
color\_lng : [str](https://docs.python.org/3.11/library/stdtypes.html#str "(in Python v3.11)")
, optional[¶](https://riskfolio-lib.readthedocs.io/en/latest/plot.html#PlotFunctions.plot_clusters_network_allocation.color_lng "Permalink to this definition")
Color of assets with long positions. The default value is ‘tab:blue’.
color\_sht : [str](https://docs.python.org/3.11/library/stdtypes.html#str "(in Python v3.11)")
, optional[¶](https://riskfolio-lib.readthedocs.io/en/latest/plot.html#PlotFunctions.plot_clusters_network_allocation.color_sht "Permalink to this definition")
Color of assets with short positions. The default value is ‘tab:red’.
scale : [float](https://docs.python.org/3.11/library/functions.html#float "(in Python v3.11)")
, optional[¶](https://riskfolio-lib.readthedocs.io/en/latest/plot.html#PlotFunctions.plot_clusters_network_allocation.scale "Permalink to this definition")
Scale of whole graph. The default value is 10.
subscale : [float](https://docs.python.org/3.11/library/functions.html#float "(in Python v3.11)")
, optional[¶](https://riskfolio-lib.readthedocs.io/en/latest/plot.html#PlotFunctions.plot_clusters_network_allocation.subscale "Permalink to this definition")
Scale of clusters. The default value is 5.
label\_v : [float](https://docs.python.org/3.11/library/functions.html#float "(in Python v3.11)")
, optional[¶](https://riskfolio-lib.readthedocs.io/en/latest/plot.html#PlotFunctions.plot_clusters_network_allocation.label_v "Permalink to this definition")
Vertical distance the label is offset from the center. The default value is 1.5.
label\_h : [float](https://docs.python.org/3.11/library/functions.html#float "(in Python v3.11)")
, optional[¶](https://riskfolio-lib.readthedocs.io/en/latest/plot.html#PlotFunctions.plot_clusters_network_allocation.label_h "Permalink to this definition")
Horizontal distance the label is offset from the center. The default value is 0.
font\_size : [float](https://docs.python.org/3.11/library/functions.html#float "(in Python v3.11)")
, optional[¶](https://riskfolio-lib.readthedocs.io/en/latest/plot.html#PlotFunctions.plot_clusters_network_allocation.font_size "Permalink to this definition")
Font size of node labels. The default value is 10.
title : [str](https://docs.python.org/3.11/library/stdtypes.html#str "(in Python v3.11)")
, optional[¶](https://riskfolio-lib.readthedocs.io/en/latest/plot.html#PlotFunctions.plot_clusters_network_allocation.title "Permalink to this definition")
Title of the chart. The default is “”.
height : [float](https://docs.python.org/3.11/library/functions.html#float "(in Python v3.11)")
, optional[¶](https://riskfolio-lib.readthedocs.io/en/latest/plot.html#PlotFunctions.plot_clusters_network_allocation.height "Permalink to this definition")
Height of the image in inches. The default is 8.
width : [float](https://docs.python.org/3.11/library/functions.html#float "(in Python v3.11)")
, optional[¶](https://riskfolio-lib.readthedocs.io/en/latest/plot.html#PlotFunctions.plot_clusters_network_allocation.width "Permalink to this definition")
Width of the image in inches. The default is 10.
ax : matplotlib axis, optional[¶](https://riskfolio-lib.readthedocs.io/en/latest/plot.html#PlotFunctions.plot_clusters_network_allocation.ax "Permalink to this definition")
If provided, plot on this axis. The default is None.
Raises:[¶](https://riskfolio-lib.readthedocs.io/en/latest/plot.html#PlotFunctions.plot_clusters_network_allocation-raises "Permalink to this headline")
[**ValueError**](https://docs.python.org/3.11/library/exceptions.html#ValueError "(in Python v3.11)")
– When the value cannot be calculated.
Returns:[¶](https://riskfolio-lib.readthedocs.io/en/latest/plot.html#PlotFunctions.plot_clusters_network_allocation-returns "Permalink to this headline")
**ax** – Returns the Axes object with the plot for further tweaking.
Return type:[¶](https://riskfolio-lib.readthedocs.io/en/latest/plot.html#PlotFunctions.plot_clusters_network_allocation-return-type "Permalink to this headline")
matplotlib axis
Example
`ax = rp.plot_clusters_network_allocation(returns=Y, w=w1, codependence="pearson", linkage="ward", k=None, max_k=10, ax=None)`
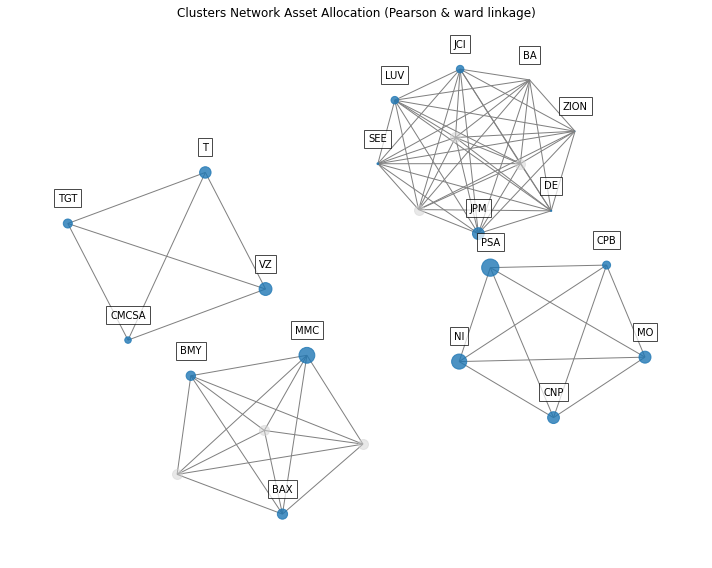
PlotFunctions.plot\_BrinsonAttribution(_[prices](https://riskfolio-lib.readthedocs.io/en/latest/plot.html#PlotFunctions.plot_BrinsonAttribution.prices "PlotFunctions.plot_BrinsonAttribution.prices (Python parameter) — Assets prices DataFrame, where n_samples is the number of observations and n_assets is the number of assets.")
_, _[w](https://riskfolio-lib.readthedocs.io/en/latest/plot.html#PlotFunctions.plot_BrinsonAttribution.w "PlotFunctions.plot_BrinsonAttribution.w (Python parameter) — A portfolio specified by the user.")
_, _[wb](https://riskfolio-lib.readthedocs.io/en/latest/plot.html#PlotFunctions.plot_BrinsonAttribution.wb "PlotFunctions.plot_BrinsonAttribution.wb (Python parameter) — A benchmark specified by the user.")
_, _[start](https://riskfolio-lib.readthedocs.io/en/latest/plot.html#PlotFunctions.plot_BrinsonAttribution.start "PlotFunctions.plot_BrinsonAttribution.start (Python parameter) — Start date in format 'YYYY-MM-DD' specified by the user.")
_, _[end](https://riskfolio-lib.readthedocs.io/en/latest/plot.html#PlotFunctions.plot_BrinsonAttribution.end "PlotFunctions.plot_BrinsonAttribution.end (Python parameter) — End date in format 'YYYY-MM-DD' specified by the user.")
_, _[asset\_classes](https://riskfolio-lib.readthedocs.io/en/latest/plot.html#PlotFunctions.plot_BrinsonAttribution.asset_classes "PlotFunctions.plot_BrinsonAttribution.asset_classes (Python parameter) — Asset's classes DataFrame, where n_assets is the number of assets and n_cols is the number of columns of the DataFrame where the first column is the asset list and the next columns are the different asset's classes sets.")
_, _[classes\_col](https://riskfolio-lib.readthedocs.io/en/latest/plot.html#PlotFunctions.plot_BrinsonAttribution.classes_col "PlotFunctions.plot_BrinsonAttribution.classes_col (Python parameter) — If value is str, it is the column name of the set of classes from asset_classes dataframe.")
_, _[method](https://riskfolio-lib.readthedocs.io/en/latest/plot.html#PlotFunctions.plot_BrinsonAttribution.method "PlotFunctions.plot_BrinsonAttribution.method (Python parameter) — Method used to calculate the nearest start or end dates in case one of them is not in prices DataFrame.")
\=`'nearest'`_, _[sector](https://riskfolio-lib.readthedocs.io/en/latest/plot.html#PlotFunctions.plot_BrinsonAttribution.sector "PlotFunctions.plot_BrinsonAttribution.sector (Python parameter) — Is the sector or class for which the function will plot the Brinson performance attribution.")
\=`'Total'`_, _[height](https://riskfolio-lib.readthedocs.io/en/latest/plot.html#PlotFunctions.plot_BrinsonAttribution.height "PlotFunctions.plot_BrinsonAttribution.height (Python parameter) — Height of the image in inches.")
\=`6`_, _[width](https://riskfolio-lib.readthedocs.io/en/latest/plot.html#PlotFunctions.plot_BrinsonAttribution.width "PlotFunctions.plot_BrinsonAttribution.width (Python parameter) — Width of the image in inches.")
\=`10`_, _[ax](https://riskfolio-lib.readthedocs.io/en/latest/plot.html#PlotFunctions.plot_BrinsonAttribution.ax "PlotFunctions.plot_BrinsonAttribution.ax (Python parameter) — If provided, plot on this axis.")
\=`None`_)[\[source\]](https://riskfolio-lib.readthedocs.io/en/latest/_modules/PlotFunctions.html#plot_BrinsonAttribution)
[¶](https://riskfolio-lib.readthedocs.io/en/latest/plot.html#PlotFunctions.plot_BrinsonAttribution "Link to this definition")
Creates a plot with the Brinson Performance Attribution specified by the sector parameter.
Parameters:[¶](https://riskfolio-lib.readthedocs.io/en/latest/plot.html#PlotFunctions.plot_BrinsonAttribution-parameters "Permalink to this headline")
prices : DataFrame of shape (n\_samples, n\_assets)[¶](https://riskfolio-lib.readthedocs.io/en/latest/plot.html#PlotFunctions.plot_BrinsonAttribution.prices "Permalink to this definition")
Assets prices DataFrame, where n\_samples is the number of observations and n\_assets is the number of assets.
w : DataFrame or Series of shape (n\_assets, 1)[¶](https://riskfolio-lib.readthedocs.io/en/latest/plot.html#PlotFunctions.plot_BrinsonAttribution.w "Permalink to this definition")
A portfolio specified by the user.
wb : DataFrame or Series of shape (n\_assets, 1)[¶](https://riskfolio-lib.readthedocs.io/en/latest/plot.html#PlotFunctions.plot_BrinsonAttribution.wb "Permalink to this definition")
A benchmark specified by the user.
start : [str](https://docs.python.org/3.11/library/stdtypes.html#str "(in Python v3.11)")
[¶](https://riskfolio-lib.readthedocs.io/en/latest/plot.html#PlotFunctions.plot_BrinsonAttribution.start "Permalink to this definition")
Start date in format ‘YYYY-MM-DD’ specified by the user.
end : [str](https://docs.python.org/3.11/library/stdtypes.html#str "(in Python v3.11)")
[¶](https://riskfolio-lib.readthedocs.io/en/latest/plot.html#PlotFunctions.plot_BrinsonAttribution.end "Permalink to this definition")
End date in format ‘YYYY-MM-DD’ specified by the user.
asset\_classes : DataFrame of shape (n\_assets, n\_cols)[¶](https://riskfolio-lib.readthedocs.io/en/latest/plot.html#PlotFunctions.plot_BrinsonAttribution.asset_classes "Permalink to this definition")
Asset’s classes DataFrame, where n\_assets is the number of assets and n\_cols is the number of columns of the DataFrame where the first column is the asset list and the next columns are the different asset’s classes sets. It is only used when kind value is ‘classes’. The default value is None.
classes\_col : [str](https://docs.python.org/3.11/library/stdtypes.html#str "(in Python v3.11)")
or [int](https://docs.python.org/3.11/library/functions.html#int "(in Python v3.11)")
[¶](https://riskfolio-lib.readthedocs.io/en/latest/plot.html#PlotFunctions.plot_BrinsonAttribution.classes_col "Permalink to this definition")
If value is str, it is the column name of the set of classes from asset\_classes dataframe. If value is int, it is the column number of the set of classes from asset\_classes dataframe. The default value is None.
method : [str](https://docs.python.org/3.11/library/stdtypes.html#str "(in Python v3.11)")
[¶](https://riskfolio-lib.readthedocs.io/en/latest/plot.html#PlotFunctions.plot_BrinsonAttribution.method "Permalink to this definition")
Method used to calculate the nearest start or end dates in case one of them is not in prices DataFrame. The default value is ‘nearest’. See [get\_indexer](https://pandas.pydata.org/docs/reference/api/pandas.Index.get_indexer.html#pandas.Index.get_indexer)
for more details.
sector : [str](https://docs.python.org/3.11/library/stdtypes.html#str "(in Python v3.11)")
[¶](https://riskfolio-lib.readthedocs.io/en/latest/plot.html#PlotFunctions.plot_BrinsonAttribution.sector "Permalink to this definition")
Is the sector or class for which the function will plot the Brinson performance attribution. Possible values are all classes in the set of classes specified by classes\_col parameter and ‘Total’ for aggregate performance attribution. Default value is ‘Total’.
height : [float](https://docs.python.org/3.11/library/functions.html#float "(in Python v3.11)")
, optional[¶](https://riskfolio-lib.readthedocs.io/en/latest/plot.html#PlotFunctions.plot_BrinsonAttribution.height "Permalink to this definition")
Height of the image in inches. The default is 8.
width : [float](https://docs.python.org/3.11/library/functions.html#float "(in Python v3.11)")
, optional[¶](https://riskfolio-lib.readthedocs.io/en/latest/plot.html#PlotFunctions.plot_BrinsonAttribution.width "Permalink to this definition")
Width of the image in inches. The default is 10.
ax : matplotlib axis, optional[¶](https://riskfolio-lib.readthedocs.io/en/latest/plot.html#PlotFunctions.plot_BrinsonAttribution.ax "Permalink to this definition")
If provided, plot on this axis. The default is None.
Raises:[¶](https://riskfolio-lib.readthedocs.io/en/latest/plot.html#PlotFunctions.plot_BrinsonAttribution-raises "Permalink to this headline")
[**ValueError**](https://docs.python.org/3.11/library/exceptions.html#ValueError "(in Python v3.11)")
– When the value cannot be calculated.
Returns:[¶](https://riskfolio-lib.readthedocs.io/en/latest/plot.html#PlotFunctions.plot_BrinsonAttribution-returns "Permalink to this headline")
**ax** – Returns the Axes object with the plot for further tweaking.
Return type:[¶](https://riskfolio-lib.readthedocs.io/en/latest/plot.html#PlotFunctions.plot_BrinsonAttribution-return-type "Permalink to this headline")
matplotlib axis.
Example
`ax = plot_BrinsonAttribution( prices=data, w=w, wb=wb, start='2019-01-07', end='2019-12-06', asset_classes=asset_classes, classes_col='Industry', method='nearest', sector='Total', height=6, width=10, ax=None )`

[**On-Demand H100 SXM GPUs for $2.99/hr/GPU with Lambda** 640 GB of vRAM in one 8x instance **Launch now**](https://server.ethicalads.io/proxy/click/9837/019d0edd-c206-7461-96f3-a10da9851c4e/)
[Ads by EthicalAds](https://www.ethicalads.io/advertisers/topics/data-science/?ref=ea-text)
---
# Risk Functions - Riskfolio-Lib 7.2
[Skip to content](https://riskfolio-lib.readthedocs.io/en/latest/risk.html#module-RiskFunctions)
Risk Functions[¶](https://riskfolio-lib.readthedocs.io/en/latest/risk.html#risk-functions "Link to this heading")
==================================================================================================================
[Buy Advanced Portfolio Optimization Book on Springer](https://www.kqzyfj.com/click-101359873-15150084?url=https%3A%2F%2Flink.springer.com%2Fbook%2F9783031843037)
[Enroll in the Portfolio Optimization with Python Course](https://www.paypal.com/ncp/payment/GN55W4UQ7VAMN)
[](https://github.com/sponsors/dcajasn)
[](https://ko-fi.com/B0B833SXD)
This module has functions that calculates several risk measures that are widely used by the asset management industry and academics.
Module Functions[¶](https://riskfolio-lib.readthedocs.io/en/latest/risk.html#module-RiskFunctions "Link to this heading")
--------------------------------------------------------------------------------------------------------------------------
RiskFunctions.MAD(_[X](https://riskfolio-lib.readthedocs.io/en/latest/risk.html#RiskFunctions.MAD.X "RiskFunctions.MAD.X (Python parameter) — Returns series, must have Tx1 size.")
_)[\[source\]](https://riskfolio-lib.readthedocs.io/en/latest/_modules/RiskFunctions.html#MAD)
[¶](https://riskfolio-lib.readthedocs.io/en/latest/risk.html#RiskFunctions.MAD "Link to this definition")
Calculate the Mean Absolute Deviation (MAD) of a returns series.
MAD(X)\=1T∑t\=1T|Xt−E(Xt)|
Parameters:[¶](https://riskfolio-lib.readthedocs.io/en/latest/risk.html#RiskFunctions.MAD-parameters "Permalink to this headline")
X : 1d-array[¶](https://riskfolio-lib.readthedocs.io/en/latest/risk.html#RiskFunctions.MAD.X "Permalink to this definition")
Returns series, must have Tx1 size.
Returns:[¶](https://riskfolio-lib.readthedocs.io/en/latest/risk.html#RiskFunctions.MAD-returns "Permalink to this headline")
**value** – MAD of a returns series.
Return type:[¶](https://riskfolio-lib.readthedocs.io/en/latest/risk.html#RiskFunctions.MAD-return-type "Permalink to this headline")
[float](https://docs.python.org/3.11/library/functions.html#float "(in Python v3.11)")
RiskFunctions.SemiDeviation(_[X](https://riskfolio-lib.readthedocs.io/en/latest/risk.html#RiskFunctions.SemiDeviation.X "RiskFunctions.SemiDeviation.X (Python parameter) — Returns series, must have Tx1 size.")
_)[\[source\]](https://riskfolio-lib.readthedocs.io/en/latest/_modules/RiskFunctions.html#SemiDeviation)
[¶](https://riskfolio-lib.readthedocs.io/en/latest/risk.html#RiskFunctions.SemiDeviation "Link to this definition")
Calculate the Semi Deviation of a returns series.
SemiDev(X)\=\[1T−1∑t\=1Tmin(Xt−E(Xt),0)2\]1/2
Parameters:[¶](https://riskfolio-lib.readthedocs.io/en/latest/risk.html#RiskFunctions.SemiDeviation-parameters "Permalink to this headline")
X : 1d-array[¶](https://riskfolio-lib.readthedocs.io/en/latest/risk.html#RiskFunctions.SemiDeviation.X "Permalink to this definition")
Returns series, must have Tx1 size.
Raises:[¶](https://riskfolio-lib.readthedocs.io/en/latest/risk.html#RiskFunctions.SemiDeviation-raises "Permalink to this headline")
[**ValueError**](https://docs.python.org/3.11/library/exceptions.html#ValueError "(in Python v3.11)")
– When the value cannot be calculated.
Returns:[¶](https://riskfolio-lib.readthedocs.io/en/latest/risk.html#RiskFunctions.SemiDeviation-returns "Permalink to this headline")
**value** – Semi Deviation of a returns series.
Return type:[¶](https://riskfolio-lib.readthedocs.io/en/latest/risk.html#RiskFunctions.SemiDeviation-return-type "Permalink to this headline")
[float](https://docs.python.org/3.11/library/functions.html#float "(in Python v3.11)")
RiskFunctions.Kurtosis(_[X](https://riskfolio-lib.readthedocs.io/en/latest/risk.html#RiskFunctions.Kurtosis.X "RiskFunctions.Kurtosis.X (Python parameter) — Returns series, must have Tx1 size.")
_)[\[source\]](https://riskfolio-lib.readthedocs.io/en/latest/_modules/RiskFunctions.html#Kurtosis)
[¶](https://riskfolio-lib.readthedocs.io/en/latest/risk.html#RiskFunctions.Kurtosis "Link to this definition")
Calculate the Square Root Kurtosis of a returns series.
Kurt(X)\=\[1T∑t\=1T(Xt−E(Xt))4\]1/2
Parameters:[¶](https://riskfolio-lib.readthedocs.io/en/latest/risk.html#RiskFunctions.Kurtosis-parameters "Permalink to this headline")
X : 1d-array[¶](https://riskfolio-lib.readthedocs.io/en/latest/risk.html#RiskFunctions.Kurtosis.X "Permalink to this definition")
Returns series, must have Tx1 size.
Raises:[¶](https://riskfolio-lib.readthedocs.io/en/latest/risk.html#RiskFunctions.Kurtosis-raises "Permalink to this headline")
[**ValueError**](https://docs.python.org/3.11/library/exceptions.html#ValueError "(in Python v3.11)")
– When the value cannot be calculated.
Returns:[¶](https://riskfolio-lib.readthedocs.io/en/latest/risk.html#RiskFunctions.Kurtosis-returns "Permalink to this headline")
**value** – Square Root Kurtosis of a returns series.
Return type:[¶](https://riskfolio-lib.readthedocs.io/en/latest/risk.html#RiskFunctions.Kurtosis-return-type "Permalink to this headline")
[float](https://docs.python.org/3.11/library/functions.html#float "(in Python v3.11)")
RiskFunctions.SemiKurtosis(_[X](https://riskfolio-lib.readthedocs.io/en/latest/risk.html#RiskFunctions.SemiKurtosis.X "RiskFunctions.SemiKurtosis.X (Python parameter) — Returns series, must have Tx1 size.")
_)[\[source\]](https://riskfolio-lib.readthedocs.io/en/latest/_modules/RiskFunctions.html#SemiKurtosis)
[¶](https://riskfolio-lib.readthedocs.io/en/latest/risk.html#RiskFunctions.SemiKurtosis "Link to this definition")
Calculate the Semi Square Root Kurtosis of a returns series.
SemiKurt(X)\=\[1T∑t\=1Tmin(Xt−E(Xt),0)4\]1/2
Parameters:[¶](https://riskfolio-lib.readthedocs.io/en/latest/risk.html#RiskFunctions.SemiKurtosis-parameters "Permalink to this headline")
X : 1d-array[¶](https://riskfolio-lib.readthedocs.io/en/latest/risk.html#RiskFunctions.SemiKurtosis.X "Permalink to this definition")
Returns series, must have Tx1 size.
Raises:[¶](https://riskfolio-lib.readthedocs.io/en/latest/risk.html#RiskFunctions.SemiKurtosis-raises "Permalink to this headline")
[**ValueError**](https://docs.python.org/3.11/library/exceptions.html#ValueError "(in Python v3.11)")
– When the value cannot be calculated.
Returns:[¶](https://riskfolio-lib.readthedocs.io/en/latest/risk.html#RiskFunctions.SemiKurtosis-returns "Permalink to this headline")
**value** – Semi Square Root Kurtosis of a returns series.
Return type:[¶](https://riskfolio-lib.readthedocs.io/en/latest/risk.html#RiskFunctions.SemiKurtosis-return-type "Permalink to this headline")
[float](https://docs.python.org/3.11/library/functions.html#float "(in Python v3.11)")
RiskFunctions.VaR\_Hist(_[X](https://riskfolio-lib.readthedocs.io/en/latest/risk.html#RiskFunctions.VaR_Hist.X "RiskFunctions.VaR_Hist.X (Python parameter) — Returns series, must have Tx1 size.")
_, _[alpha](https://riskfolio-lib.readthedocs.io/en/latest/risk.html#RiskFunctions.VaR_Hist.alpha "RiskFunctions.VaR_Hist.alpha (Python parameter) — Significance level of VaR.")
\=`0.05`_)[\[source\]](https://riskfolio-lib.readthedocs.io/en/latest/_modules/RiskFunctions.html#VaR_Hist)
[¶](https://riskfolio-lib.readthedocs.io/en/latest/risk.html#RiskFunctions.VaR_Hist "Link to this definition")
Calculate the Value at Risk (VaR) of a returns series.
VaRα(X)\=−inft∈(0,T){Xt∈R:FX(Xt)\>α}
Parameters:[¶](https://riskfolio-lib.readthedocs.io/en/latest/risk.html#RiskFunctions.VaR_Hist-parameters "Permalink to this headline")
X : 1d-array[¶](https://riskfolio-lib.readthedocs.io/en/latest/risk.html#RiskFunctions.VaR_Hist.X "Permalink to this definition")
Returns series, must have Tx1 size.
alpha : [float](https://docs.python.org/3.11/library/functions.html#float "(in Python v3.11)")
, optional[¶](https://riskfolio-lib.readthedocs.io/en/latest/risk.html#RiskFunctions.VaR_Hist.alpha "Permalink to this definition")
Significance level of VaR. The default is 0.05.
Raises:[¶](https://riskfolio-lib.readthedocs.io/en/latest/risk.html#RiskFunctions.VaR_Hist-raises "Permalink to this headline")
[**ValueError**](https://docs.python.org/3.11/library/exceptions.html#ValueError "(in Python v3.11)")
– When the value cannot be calculated.
Returns:[¶](https://riskfolio-lib.readthedocs.io/en/latest/risk.html#RiskFunctions.VaR_Hist-returns "Permalink to this headline")
**value** – VaR of a returns series.
Return type:[¶](https://riskfolio-lib.readthedocs.io/en/latest/risk.html#RiskFunctions.VaR_Hist-return-type "Permalink to this headline")
[float](https://docs.python.org/3.11/library/functions.html#float "(in Python v3.11)")
RiskFunctions.CVaR\_Hist(_[X](https://riskfolio-lib.readthedocs.io/en/latest/risk.html#RiskFunctions.CVaR_Hist.X "RiskFunctions.CVaR_Hist.X (Python parameter) — Returns series, must have Tx1 size.")
_, _[alpha](https://riskfolio-lib.readthedocs.io/en/latest/risk.html#RiskFunctions.CVaR_Hist.alpha "RiskFunctions.CVaR_Hist.alpha (Python parameter) — Significance level of CVaR.")
\=`0.05`_)[\[source\]](https://riskfolio-lib.readthedocs.io/en/latest/_modules/RiskFunctions.html#CVaR_Hist)
[¶](https://riskfolio-lib.readthedocs.io/en/latest/risk.html#RiskFunctions.CVaR_Hist "Link to this definition")
Calculate the Conditional Value at Risk (CVaR) of a returns series.
CVaRα(X)\=VaRα(X)+1αT∑t\=1Tmax(−Xt−VaRα(X),0)
Parameters:[¶](https://riskfolio-lib.readthedocs.io/en/latest/risk.html#RiskFunctions.CVaR_Hist-parameters "Permalink to this headline")
X : 1d-array[¶](https://riskfolio-lib.readthedocs.io/en/latest/risk.html#RiskFunctions.CVaR_Hist.X "Permalink to this definition")
Returns series, must have Tx1 size.
alpha : [float](https://docs.python.org/3.11/library/functions.html#float "(in Python v3.11)")
, optional[¶](https://riskfolio-lib.readthedocs.io/en/latest/risk.html#RiskFunctions.CVaR_Hist.alpha "Permalink to this definition")
Significance level of CVaR. The default is 0.05.
Raises:[¶](https://riskfolio-lib.readthedocs.io/en/latest/risk.html#RiskFunctions.CVaR_Hist-raises "Permalink to this headline")
[**ValueError**](https://docs.python.org/3.11/library/exceptions.html#ValueError "(in Python v3.11)")
– When the value cannot be calculated.
Returns:[¶](https://riskfolio-lib.readthedocs.io/en/latest/risk.html#RiskFunctions.CVaR_Hist-returns "Permalink to this headline")
**value** – CVaR of a returns series.
Return type:[¶](https://riskfolio-lib.readthedocs.io/en/latest/risk.html#RiskFunctions.CVaR_Hist-return-type "Permalink to this headline")
[float](https://docs.python.org/3.11/library/functions.html#float "(in Python v3.11)")
RiskFunctions.WR(_[X](https://riskfolio-lib.readthedocs.io/en/latest/risk.html#RiskFunctions.WR.X "RiskFunctions.WR.X (Python parameter) — Returns series, must have Tx1 size.")
_)[\[source\]](https://riskfolio-lib.readthedocs.io/en/latest/_modules/RiskFunctions.html#WR)
[¶](https://riskfolio-lib.readthedocs.io/en/latest/risk.html#RiskFunctions.WR "Link to this definition")
Calculate the Worst Realization (WR) or Worst Scenario of a returns series.
WR(X)\=max(−X)
Parameters:[¶](https://riskfolio-lib.readthedocs.io/en/latest/risk.html#RiskFunctions.WR-parameters "Permalink to this headline")
X : 1d-array[¶](https://riskfolio-lib.readthedocs.io/en/latest/risk.html#RiskFunctions.WR.X "Permalink to this definition")
Returns series, must have Tx1 size.
Raises:[¶](https://riskfolio-lib.readthedocs.io/en/latest/risk.html#RiskFunctions.WR-raises "Permalink to this headline")
[**ValueError**](https://docs.python.org/3.11/library/exceptions.html#ValueError "(in Python v3.11)")
– When the value cannot be calculated.
Returns:[¶](https://riskfolio-lib.readthedocs.io/en/latest/risk.html#RiskFunctions.WR-returns "Permalink to this headline")
**value** – WR of a returns series.
Return type:[¶](https://riskfolio-lib.readthedocs.io/en/latest/risk.html#RiskFunctions.WR-return-type "Permalink to this headline")
[float](https://docs.python.org/3.11/library/functions.html#float "(in Python v3.11)")
RiskFunctions.LPM(_[X](https://riskfolio-lib.readthedocs.io/en/latest/risk.html#RiskFunctions.LPM.X "RiskFunctions.LPM.X (Python parameter) — Returns series, must have Tx1 size.")
_, _[MAR](https://riskfolio-lib.readthedocs.io/en/latest/risk.html#RiskFunctions.LPM.MAR "RiskFunctions.LPM.MAR (Python parameter) — Minimum acceptable return.")
\=`0`_, _[p](https://riskfolio-lib.readthedocs.io/en/latest/risk.html#RiskFunctions.LPM.p "RiskFunctions.LPM.p (Python parameter) — order of the \text{LPM}.")
\=`1`_)[\[source\]](https://riskfolio-lib.readthedocs.io/en/latest/_modules/RiskFunctions.html#LPM)
[¶](https://riskfolio-lib.readthedocs.io/en/latest/risk.html#RiskFunctions.LPM "Link to this definition")
Calculate the First or Second Lower Partial Moment of a returns series.
LPM(X,MAR,1)\=1T∑t\=1Tmax(MAR−Xt,0)LPM(X,MAR,2)\=\[1T−1∑t\=1Tmax(MAR−Xt,0)2\]12
Where:
MAR is the minimum acceptable return. p is the order of the LPM.
Parameters:[¶](https://riskfolio-lib.readthedocs.io/en/latest/risk.html#RiskFunctions.LPM-parameters "Permalink to this headline")
X : 1d-array[¶](https://riskfolio-lib.readthedocs.io/en/latest/risk.html#RiskFunctions.LPM.X "Permalink to this definition")
Returns series, must have Tx1 size.
MAR : [float](https://docs.python.org/3.11/library/functions.html#float "(in Python v3.11)")
, optional[¶](https://riskfolio-lib.readthedocs.io/en/latest/risk.html#RiskFunctions.LPM.MAR "Permalink to this definition")
Minimum acceptable return. The default is 0.
p : [float](https://docs.python.org/3.11/library/functions.html#float "(in Python v3.11)")
, optional can be {1,2}[¶](https://riskfolio-lib.readthedocs.io/en/latest/risk.html#RiskFunctions.LPM.p "Permalink to this definition")
order of the LPM. The default is 1.
Raises:[¶](https://riskfolio-lib.readthedocs.io/en/latest/risk.html#RiskFunctions.LPM-raises "Permalink to this headline")
[**ValueError**](https://docs.python.org/3.11/library/exceptions.html#ValueError "(in Python v3.11)")
– When the value cannot be calculated.
Returns:[¶](https://riskfolio-lib.readthedocs.io/en/latest/risk.html#RiskFunctions.LPM-returns "Permalink to this headline")
**value** – p-th Lower Partial Moment of a returns series.
Return type:[¶](https://riskfolio-lib.readthedocs.io/en/latest/risk.html#RiskFunctions.LPM-return-type "Permalink to this headline")
[float](https://docs.python.org/3.11/library/functions.html#float "(in Python v3.11)")
RiskFunctions.Entropic\_RM(_[X](https://riskfolio-lib.readthedocs.io/en/latest/risk.html#RiskFunctions.Entropic_RM.X "RiskFunctions.Entropic_RM.X (Python parameter) — Returns series, must have Tx1 size.")
_, _[z](https://riskfolio-lib.readthedocs.io/en/latest/risk.html#RiskFunctions.Entropic_RM.z "RiskFunctions.Entropic_RM.z (Python parameter) — Risk aversion parameter, must be greater than zero.")
\=`1`_, _[alpha](https://riskfolio-lib.readthedocs.io/en/latest/risk.html#RiskFunctions.Entropic_RM.alpha "RiskFunctions.Entropic_RM.alpha (Python parameter) — Significance level of EVaR.")
\=`0.05`_)[\[source\]](https://riskfolio-lib.readthedocs.io/en/latest/_modules/RiskFunctions.html#Entropic_RM)
[¶](https://riskfolio-lib.readthedocs.io/en/latest/risk.html#RiskFunctions.Entropic_RM "Link to this definition")
Calculate the Entropic Risk Measure (ERM) of a returns series.
ERMα(X)\=zln(MX(z−1)α)
Where:
MX(z) is the moment generating function of X.
Parameters:[¶](https://riskfolio-lib.readthedocs.io/en/latest/risk.html#RiskFunctions.Entropic_RM-parameters "Permalink to this headline")
X : 1d-array[¶](https://riskfolio-lib.readthedocs.io/en/latest/risk.html#RiskFunctions.Entropic_RM.X "Permalink to this definition")
Returns series, must have Tx1 size.
z : [float](https://docs.python.org/3.11/library/functions.html#float "(in Python v3.11)")
, optional[¶](https://riskfolio-lib.readthedocs.io/en/latest/risk.html#RiskFunctions.Entropic_RM.z "Permalink to this definition")
Risk aversion parameter, must be greater than zero. The default is 1.
alpha : [float](https://docs.python.org/3.11/library/functions.html#float "(in Python v3.11)")
, optional[¶](https://riskfolio-lib.readthedocs.io/en/latest/risk.html#RiskFunctions.Entropic_RM.alpha "Permalink to this definition")
Significance level of EVaR. The default is 0.05.
Raises:[¶](https://riskfolio-lib.readthedocs.io/en/latest/risk.html#RiskFunctions.Entropic_RM-raises "Permalink to this headline")
[**ValueError**](https://docs.python.org/3.11/library/exceptions.html#ValueError "(in Python v3.11)")
– When the value cannot be calculated.
Returns:[¶](https://riskfolio-lib.readthedocs.io/en/latest/risk.html#RiskFunctions.Entropic_RM-returns "Permalink to this headline")
**value** – ERM of a returns series.
Return type:[¶](https://riskfolio-lib.readthedocs.io/en/latest/risk.html#RiskFunctions.Entropic_RM-return-type "Permalink to this headline")
[float](https://docs.python.org/3.11/library/functions.html#float "(in Python v3.11)")
RiskFunctions.EVaR\_Hist(_[X](https://riskfolio-lib.readthedocs.io/en/latest/risk.html#RiskFunctions.EVaR_Hist.X "RiskFunctions.EVaR_Hist.X (Python parameter) — Returns series, must have Tx1 size.")
_, _[alpha](https://riskfolio-lib.readthedocs.io/en/latest/risk.html#RiskFunctions.EVaR_Hist.alpha "RiskFunctions.EVaR_Hist.alpha (Python parameter) — Significance level of EVaR.")
\=`0.05`_, _[solver](https://riskfolio-lib.readthedocs.io/en/latest/risk.html#RiskFunctions.EVaR_Hist.solver "RiskFunctions.EVaR_Hist.solver (Python parameter) — Solver available for CVXPY that supports exponential cone programming. Used to calculate EVaR, EVRG and EDaR.")
\=`'CLARABEL'`_)[\[source\]](https://riskfolio-lib.readthedocs.io/en/latest/_modules/RiskFunctions.html#EVaR_Hist)
[¶](https://riskfolio-lib.readthedocs.io/en/latest/risk.html#RiskFunctions.EVaR_Hist "Link to this definition")
Calculate the Entropic Value at Risk (EVaR) of a returns series.
EVaRα(X)\=infz\>0{zln(MX(z−1)α)}
Where:
MX(t) is the moment generating function of X.
Parameters:[¶](https://riskfolio-lib.readthedocs.io/en/latest/risk.html#RiskFunctions.EVaR_Hist-parameters "Permalink to this headline")
X : 1d-array[¶](https://riskfolio-lib.readthedocs.io/en/latest/risk.html#RiskFunctions.EVaR_Hist.X "Permalink to this definition")
Returns series, must have Tx1 size.
alpha : [float](https://docs.python.org/3.11/library/functions.html#float "(in Python v3.11)")
, optional[¶](https://riskfolio-lib.readthedocs.io/en/latest/risk.html#RiskFunctions.EVaR_Hist.alpha "Permalink to this definition")
Significance level of EVaR. The default is 0.05.
solver : [str](https://docs.python.org/3.11/library/stdtypes.html#str "(in Python v3.11)")
, optional[¶](https://riskfolio-lib.readthedocs.io/en/latest/risk.html#RiskFunctions.EVaR_Hist.solver "Permalink to this definition")
Solver available for CVXPY that supports exponential cone programming. Used to calculate EVaR, EVRG and EDaR. The default value is ‘CLARABEL’.
Raises:[¶](https://riskfolio-lib.readthedocs.io/en/latest/risk.html#RiskFunctions.EVaR_Hist-raises "Permalink to this headline")
[**ValueError**](https://docs.python.org/3.11/library/exceptions.html#ValueError "(in Python v3.11)")
– When the value cannot be calculated.
Returns:[¶](https://riskfolio-lib.readthedocs.io/en/latest/risk.html#RiskFunctions.EVaR_Hist-returns "Permalink to this headline")
**(value, z)** – EVaR of a returns series and value of z that minimize EVaR.
Return type:[¶](https://riskfolio-lib.readthedocs.io/en/latest/risk.html#RiskFunctions.EVaR_Hist-return-type "Permalink to this headline")
[tuple](https://docs.python.org/3.11/library/stdtypes.html#tuple "(in Python v3.11)")
RiskFunctions.RLVaR\_Hist(_[X](https://riskfolio-lib.readthedocs.io/en/latest/risk.html#RiskFunctions.RLVaR_Hist.X "RiskFunctions.RLVaR_Hist.X (Python parameter) — Returns series, must have Tx1 size.")
_, _[alpha](https://riskfolio-lib.readthedocs.io/en/latest/risk.html#RiskFunctions.RLVaR_Hist.alpha "RiskFunctions.RLVaR_Hist.alpha (Python parameter) — Significance level of EVaR.")
\=`0.05`_, _[kappa](https://riskfolio-lib.readthedocs.io/en/latest/risk.html#RiskFunctions.RLVaR_Hist.kappa "RiskFunctions.RLVaR_Hist.kappa (Python parameter) — Deformation parameter of RLVaR, must be between 0 and 1.")
\=`0.3`_, _[solver](https://riskfolio-lib.readthedocs.io/en/latest/risk.html#RiskFunctions.RLVaR_Hist.solver "RiskFunctions.RLVaR_Hist.solver (Python parameter) — Solver available for CVXPY that supports power cone programming.")
\=`'CLARABEL'`_)[\[source\]](https://riskfolio-lib.readthedocs.io/en/latest/_modules/RiskFunctions.html#RLVaR_Hist)
[¶](https://riskfolio-lib.readthedocs.io/en/latest/risk.html#RiskFunctions.RLVaR_Hist "Link to this definition")
Calculate the Relativistic Value at Risk (RLVaR) of a returns series. I recommend only use this function with MOSEK solver.
RLVaRακ(X)\={infz,t,ψ,θ,ε,ωt+zlnκ(1αT)+∑i\=1T(ψi+θi)s.t.−X−t+ε+ω≤0z≥0(z(1+κ2κ),ψi(1+κκ),εi)∈P31/(1+κ),κ/(1+κ)(ωi(11−κ),θi(1κ),−z(12κ))∈P31−κ,κ
Where:
P3α,1−α is the power cone 3D.
κ is the deformation parameter.
Parameters:[¶](https://riskfolio-lib.readthedocs.io/en/latest/risk.html#RiskFunctions.RLVaR_Hist-parameters "Permalink to this headline")
X : 1d-array[¶](https://riskfolio-lib.readthedocs.io/en/latest/risk.html#RiskFunctions.RLVaR_Hist.X "Permalink to this definition")
Returns series, must have Tx1 size.
alpha : [float](https://docs.python.org/3.11/library/functions.html#float "(in Python v3.11)")
, optional[¶](https://riskfolio-lib.readthedocs.io/en/latest/risk.html#RiskFunctions.RLVaR_Hist.alpha "Permalink to this definition")
Significance level of EVaR. The default is 0.05.
kappa : [float](https://docs.python.org/3.11/library/functions.html#float "(in Python v3.11)")
, optional[¶](https://riskfolio-lib.readthedocs.io/en/latest/risk.html#RiskFunctions.RLVaR_Hist.kappa "Permalink to this definition")
Deformation parameter of RLVaR, must be between 0 and 1. The default is 0.3.
solver : [str](https://docs.python.org/3.11/library/stdtypes.html#str "(in Python v3.11)")
, optional[¶](https://riskfolio-lib.readthedocs.io/en/latest/risk.html#RiskFunctions.RLVaR_Hist.solver "Permalink to this definition")
Solver available for CVXPY that supports power cone programming. Used to calculate RLVaR and RLDaR. The default value is ‘CLARABEL’.
Raises:[¶](https://riskfolio-lib.readthedocs.io/en/latest/risk.html#RiskFunctions.RLVaR_Hist-raises "Permalink to this headline")
[**ValueError**](https://docs.python.org/3.11/library/exceptions.html#ValueError "(in Python v3.11)")
– When the value cannot be calculated.
Returns:[¶](https://riskfolio-lib.readthedocs.io/en/latest/risk.html#RiskFunctions.RLVaR_Hist-returns "Permalink to this headline")
**value** – RLVaR of a returns series.
Return type:[¶](https://riskfolio-lib.readthedocs.io/en/latest/risk.html#RiskFunctions.RLVaR_Hist-return-type "Permalink to this headline")
[tuple](https://docs.python.org/3.11/library/stdtypes.html#tuple "(in Python v3.11)")
RiskFunctions.MDD\_Abs(_[X](https://riskfolio-lib.readthedocs.io/en/latest/risk.html#RiskFunctions.MDD_Abs.X "RiskFunctions.MDD_Abs.X (Python parameter) — Returns series, must have Tx1 size.")
_)[\[source\]](https://riskfolio-lib.readthedocs.io/en/latest/_modules/RiskFunctions.html#MDD_Abs)
[¶](https://riskfolio-lib.readthedocs.io/en/latest/risk.html#RiskFunctions.MDD_Abs "Link to this definition")
Calculate the Maximum Drawdown (MDD) of a returns series using uncompounded cumulative returns.
MDD(X)\=maxj∈(0,T)\[maxt∈(0,j)(∑i\=0tXi)−∑i\=0jXi\]
Parameters:[¶](https://riskfolio-lib.readthedocs.io/en/latest/risk.html#RiskFunctions.MDD_Abs-parameters "Permalink to this headline")
X : 1d-array[¶](https://riskfolio-lib.readthedocs.io/en/latest/risk.html#RiskFunctions.MDD_Abs.X "Permalink to this definition")
Returns series, must have Tx1 size.
Raises:[¶](https://riskfolio-lib.readthedocs.io/en/latest/risk.html#RiskFunctions.MDD_Abs-raises "Permalink to this headline")
[**ValueError**](https://docs.python.org/3.11/library/exceptions.html#ValueError "(in Python v3.11)")
– When the value cannot be calculated.
Returns:[¶](https://riskfolio-lib.readthedocs.io/en/latest/risk.html#RiskFunctions.MDD_Abs-returns "Permalink to this headline")
**value** – MDD of an uncompounded cumulative returns.
Return type:[¶](https://riskfolio-lib.readthedocs.io/en/latest/risk.html#RiskFunctions.MDD_Abs-return-type "Permalink to this headline")
[float](https://docs.python.org/3.11/library/functions.html#float "(in Python v3.11)")
RiskFunctions.ADD\_Abs(_[X](https://riskfolio-lib.readthedocs.io/en/latest/risk.html#RiskFunctions.ADD_Abs.X "RiskFunctions.ADD_Abs.X (Python parameter) — Returns series, must have Tx1 size.")
_)[\[source\]](https://riskfolio-lib.readthedocs.io/en/latest/_modules/RiskFunctions.html#ADD_Abs)
[¶](https://riskfolio-lib.readthedocs.io/en/latest/risk.html#RiskFunctions.ADD_Abs "Link to this definition")
Calculate the Average Drawdown (ADD) of a returns series using uncompounded cumulative returns.
ADD(X)\=1T∑j\=0T\[maxt∈(0,j)(∑i\=0tXi)−∑i\=0jXi\]
Parameters:[¶](https://riskfolio-lib.readthedocs.io/en/latest/risk.html#RiskFunctions.ADD_Abs-parameters "Permalink to this headline")
X : 1d-array[¶](https://riskfolio-lib.readthedocs.io/en/latest/risk.html#RiskFunctions.ADD_Abs.X "Permalink to this definition")
Returns series, must have Tx1 size.
Raises:[¶](https://riskfolio-lib.readthedocs.io/en/latest/risk.html#RiskFunctions.ADD_Abs-raises "Permalink to this headline")
[**ValueError**](https://docs.python.org/3.11/library/exceptions.html#ValueError "(in Python v3.11)")
– When the value cannot be calculated.
Returns:[¶](https://riskfolio-lib.readthedocs.io/en/latest/risk.html#RiskFunctions.ADD_Abs-returns "Permalink to this headline")
**value** – ADD of an uncompounded cumulative returns.
Return type:[¶](https://riskfolio-lib.readthedocs.io/en/latest/risk.html#RiskFunctions.ADD_Abs-return-type "Permalink to this headline")
[float](https://docs.python.org/3.11/library/functions.html#float "(in Python v3.11)")
RiskFunctions.DaR\_Abs(_[X](https://riskfolio-lib.readthedocs.io/en/latest/risk.html#RiskFunctions.DaR_Abs.X "RiskFunctions.DaR_Abs.X (Python parameter) — Returns series, must have Tx1 size..")
_, _[alpha](https://riskfolio-lib.readthedocs.io/en/latest/risk.html#RiskFunctions.DaR_Abs.alpha "RiskFunctions.DaR_Abs.alpha (Python parameter) — Significance level of DaR.")
\=`0.05`_)[\[source\]](https://riskfolio-lib.readthedocs.io/en/latest/_modules/RiskFunctions.html#DaR_Abs)
[¶](https://riskfolio-lib.readthedocs.io/en/latest/risk.html#RiskFunctions.DaR_Abs "Link to this definition")
Calculate the Drawdown at Risk (DaR) of a returns series using uncompounded cumulative returns.
DaRα(X)\=maxj∈(0,T){DD(X,j)∈R:FDD(DD(X,j))<1−α}DD(X,j)\=maxt∈(0,j)(∑i\=0tXi)−∑i\=0jXi
Parameters:[¶](https://riskfolio-lib.readthedocs.io/en/latest/risk.html#RiskFunctions.DaR_Abs-parameters "Permalink to this headline")
X : 1d-array[¶](https://riskfolio-lib.readthedocs.io/en/latest/risk.html#RiskFunctions.DaR_Abs.X "Permalink to this definition")
Returns series, must have Tx1 size..
alpha : [float](https://docs.python.org/3.11/library/functions.html#float "(in Python v3.11)")
, optional[¶](https://riskfolio-lib.readthedocs.io/en/latest/risk.html#RiskFunctions.DaR_Abs.alpha "Permalink to this definition")
Significance level of DaR. The default is 0.05.
Raises:[¶](https://riskfolio-lib.readthedocs.io/en/latest/risk.html#RiskFunctions.DaR_Abs-raises "Permalink to this headline")
[**ValueError**](https://docs.python.org/3.11/library/exceptions.html#ValueError "(in Python v3.11)")
– When the value cannot be calculated.
Returns:[¶](https://riskfolio-lib.readthedocs.io/en/latest/risk.html#RiskFunctions.DaR_Abs-returns "Permalink to this headline")
**value** – DaR of an uncompounded cumulative returns series.
Return type:[¶](https://riskfolio-lib.readthedocs.io/en/latest/risk.html#RiskFunctions.DaR_Abs-return-type "Permalink to this headline")
[float](https://docs.python.org/3.11/library/functions.html#float "(in Python v3.11)")
RiskFunctions.CDaR\_Abs(_[X](https://riskfolio-lib.readthedocs.io/en/latest/risk.html#RiskFunctions.CDaR_Abs.X "RiskFunctions.CDaR_Abs.X (Python parameter) — Returns series, must have Tx1 size..")
_, _[alpha](https://riskfolio-lib.readthedocs.io/en/latest/risk.html#RiskFunctions.CDaR_Abs.alpha "RiskFunctions.CDaR_Abs.alpha (Python parameter) — Significance level of CDaR.")
\=`0.05`_)[\[source\]](https://riskfolio-lib.readthedocs.io/en/latest/_modules/RiskFunctions.html#CDaR_Abs)
[¶](https://riskfolio-lib.readthedocs.io/en/latest/risk.html#RiskFunctions.CDaR_Abs "Link to this definition")
Calculate the Conditional Drawdown at Risk (CDaR) of a returns series using uncompounded cumulative returns.
CDaRα(X)\=DaRα(X)+1αT∑j\=0Tmax\[maxt∈(0,j)(∑i\=0tXi)−∑i\=0jXi−DaRα(X),0\]
Where:
DaRα is the Drawdown at Risk of an uncompounded cumulated return series X.
Parameters:[¶](https://riskfolio-lib.readthedocs.io/en/latest/risk.html#RiskFunctions.CDaR_Abs-parameters "Permalink to this headline")
X : 1d-array[¶](https://riskfolio-lib.readthedocs.io/en/latest/risk.html#RiskFunctions.CDaR_Abs.X "Permalink to this definition")
Returns series, must have Tx1 size..
alpha : [float](https://docs.python.org/3.11/library/functions.html#float "(in Python v3.11)")
, optional[¶](https://riskfolio-lib.readthedocs.io/en/latest/risk.html#RiskFunctions.CDaR_Abs.alpha "Permalink to this definition")
Significance level of CDaR. The default is 0.05.
Raises:[¶](https://riskfolio-lib.readthedocs.io/en/latest/risk.html#RiskFunctions.CDaR_Abs-raises "Permalink to this headline")
[**ValueError**](https://docs.python.org/3.11/library/exceptions.html#ValueError "(in Python v3.11)")
– When the value cannot be calculated.
Returns:[¶](https://riskfolio-lib.readthedocs.io/en/latest/risk.html#RiskFunctions.CDaR_Abs-returns "Permalink to this headline")
**value** – CDaR of an uncompounded cumulative returns series.
Return type:[¶](https://riskfolio-lib.readthedocs.io/en/latest/risk.html#RiskFunctions.CDaR_Abs-return-type "Permalink to this headline")
[float](https://docs.python.org/3.11/library/functions.html#float "(in Python v3.11)")
RiskFunctions.EDaR\_Abs(_[X](https://riskfolio-lib.readthedocs.io/en/latest/risk.html#RiskFunctions.EDaR_Abs.X "RiskFunctions.EDaR_Abs.X (Python parameter) — Returns series, must have Tx1 size..")
_, _[alpha](https://riskfolio-lib.readthedocs.io/en/latest/risk.html#RiskFunctions.EDaR_Abs.alpha "RiskFunctions.EDaR_Abs.alpha (Python parameter) — Significance level of EDaR.")
\=`0.05`_, _[solver](https://riskfolio-lib.readthedocs.io/en/latest/risk.html#RiskFunctions.EDaR_Abs "RiskFunctions.EDaR_Abs.solver (Python parameter)")
\=`'CLARABEL'`_)[\[source\]](https://riskfolio-lib.readthedocs.io/en/latest/_modules/RiskFunctions.html#EDaR_Abs)
[¶](https://riskfolio-lib.readthedocs.io/en/latest/risk.html#RiskFunctions.EDaR_Abs "Link to this definition")
Calculate the Entropic Drawdown at Risk (EDaR) of a returns series using uncompounded cumulative returns.
EDaRα(X)\=infz\>0{zln(MDD(X)(z−1)α)}DD(X,j)\=maxt∈(0,j)(∑i\=0tXi)−∑i\=0jXi
Parameters:[¶](https://riskfolio-lib.readthedocs.io/en/latest/risk.html#RiskFunctions.EDaR_Abs-parameters "Permalink to this headline")
X : 1d-array[¶](https://riskfolio-lib.readthedocs.io/en/latest/risk.html#RiskFunctions.EDaR_Abs.X "Permalink to this definition")
Returns series, must have Tx1 size..
alpha : [float](https://docs.python.org/3.11/library/functions.html#float "(in Python v3.11)")
, optional[¶](https://riskfolio-lib.readthedocs.io/en/latest/risk.html#RiskFunctions.EDaR_Abs.alpha "Permalink to this definition")
Significance level of EDaR. The default is 0.05.
Raises:[¶](https://riskfolio-lib.readthedocs.io/en/latest/risk.html#RiskFunctions.EDaR_Abs-raises "Permalink to this headline")
[**ValueError**](https://docs.python.org/3.11/library/exceptions.html#ValueError "(in Python v3.11)")
– When the value cannot be calculated.
Returns:[¶](https://riskfolio-lib.readthedocs.io/en/latest/risk.html#RiskFunctions.EDaR_Abs-returns "Permalink to this headline")
**(value, z)** – EDaR of an uncompounded cumulative returns series and value of z that minimize EDaR.
Return type:[¶](https://riskfolio-lib.readthedocs.io/en/latest/risk.html#RiskFunctions.EDaR_Abs-return-type "Permalink to this headline")
[tuple](https://docs.python.org/3.11/library/stdtypes.html#tuple "(in Python v3.11)")
RiskFunctions.RLDaR\_Abs(_[X](https://riskfolio-lib.readthedocs.io/en/latest/risk.html#RiskFunctions.RLDaR_Abs.X "RiskFunctions.RLDaR_Abs.X (Python parameter) — Returns series, must have Tx1 size.")
_, _[alpha](https://riskfolio-lib.readthedocs.io/en/latest/risk.html#RiskFunctions.RLDaR_Abs.alpha "RiskFunctions.RLDaR_Abs.alpha (Python parameter) — Significance level of EVaR.")
\=`0.05`_, _[kappa](https://riskfolio-lib.readthedocs.io/en/latest/risk.html#RiskFunctions.RLDaR_Abs.kappa "RiskFunctions.RLDaR_Abs.kappa (Python parameter) — Deformation parameter of RLDaR, must be between 0 and 1.")
\=`0.3`_, _[solver](https://riskfolio-lib.readthedocs.io/en/latest/risk.html#RiskFunctions.RLDaR_Abs.solver "RiskFunctions.RLDaR_Abs.solver (Python parameter) — Solver available for CVXPY that supports power cone programming.")
\=`'CLARABEL'`_)[\[source\]](https://riskfolio-lib.readthedocs.io/en/latest/_modules/RiskFunctions.html#RLDaR_Abs)
[¶](https://riskfolio-lib.readthedocs.io/en/latest/risk.html#RiskFunctions.RLDaR_Abs "Link to this definition")
Calculate the Relativistic Drawdown at Risk (RLDaR) of a returns series using uncompounded cumulative returns. I recommend only use this function with MOSEK solver.
RLDaRακ(X)\=RLVaRακ(DD(X))DD(X,j)\=maxt∈(0,j)(∑i\=0tXi)−∑i\=0jXi
Parameters:[¶](https://riskfolio-lib.readthedocs.io/en/latest/risk.html#RiskFunctions.RLDaR_Abs-parameters "Permalink to this headline")
X : 1d-array[¶](https://riskfolio-lib.readthedocs.io/en/latest/risk.html#RiskFunctions.RLDaR_Abs.X "Permalink to this definition")
Returns series, must have Tx1 size.
alpha : [float](https://docs.python.org/3.11/library/functions.html#float "(in Python v3.11)")
, optional[¶](https://riskfolio-lib.readthedocs.io/en/latest/risk.html#RiskFunctions.RLDaR_Abs.alpha "Permalink to this definition")
Significance level of EVaR. The default is 0.05.
kappa : [float](https://docs.python.org/3.11/library/functions.html#float "(in Python v3.11)")
, optional[¶](https://riskfolio-lib.readthedocs.io/en/latest/risk.html#RiskFunctions.RLDaR_Abs.kappa "Permalink to this definition")
Deformation parameter of RLDaR, must be between 0 and 1. The default is 0.3.
solver : [str](https://docs.python.org/3.11/library/stdtypes.html#str "(in Python v3.11)")
, optional[¶](https://riskfolio-lib.readthedocs.io/en/latest/risk.html#RiskFunctions.RLDaR_Abs.solver "Permalink to this definition")
Solver available for CVXPY that supports power cone programming. Used to calculate RLVaR, RVRG and RLDaR. The default value is ‘CLARABEL’.
Raises:[¶](https://riskfolio-lib.readthedocs.io/en/latest/risk.html#RiskFunctions.RLDaR_Abs-raises "Permalink to this headline")
[**ValueError**](https://docs.python.org/3.11/library/exceptions.html#ValueError "(in Python v3.11)")
– When the value cannot be calculated.
Returns:[¶](https://riskfolio-lib.readthedocs.io/en/latest/risk.html#RiskFunctions.RLDaR_Abs-returns "Permalink to this headline")
**value** – RLDaR of an uncompounded cumulative returns series.
Return type:[¶](https://riskfolio-lib.readthedocs.io/en/latest/risk.html#RiskFunctions.RLDaR_Abs-return-type "Permalink to this headline")
[tuple](https://docs.python.org/3.11/library/stdtypes.html#tuple "(in Python v3.11)")
RiskFunctions.UCI\_Abs(_[X](https://riskfolio-lib.readthedocs.io/en/latest/risk.html#RiskFunctions.UCI_Abs.X "RiskFunctions.UCI_Abs.X (Python parameter) — Returns series, must have Tx1 size.")
_)[\[source\]](https://riskfolio-lib.readthedocs.io/en/latest/_modules/RiskFunctions.html#UCI_Abs)
[¶](https://riskfolio-lib.readthedocs.io/en/latest/risk.html#RiskFunctions.UCI_Abs "Link to this definition")
Calculate the Ulcer Index (UCI) of a returns series using uncompounded cumulative returns.
UCI(X)\=1T∑j\=0T\[maxt∈(0,j)(∑i\=0tXi)−∑i\=0jXi\]2
Parameters:[¶](https://riskfolio-lib.readthedocs.io/en/latest/risk.html#RiskFunctions.UCI_Abs-parameters "Permalink to this headline")
X : 1d-array[¶](https://riskfolio-lib.readthedocs.io/en/latest/risk.html#RiskFunctions.UCI_Abs.X "Permalink to this definition")
Returns series, must have Tx1 size.
Raises:[¶](https://riskfolio-lib.readthedocs.io/en/latest/risk.html#RiskFunctions.UCI_Abs-raises "Permalink to this headline")
[**ValueError**](https://docs.python.org/3.11/library/exceptions.html#ValueError "(in Python v3.11)")
– When the value cannot be calculated.
Returns:[¶](https://riskfolio-lib.readthedocs.io/en/latest/risk.html#RiskFunctions.UCI_Abs-returns "Permalink to this headline")
**value** – Ulcer Index of an uncompounded cumulative returns.
Return type:[¶](https://riskfolio-lib.readthedocs.io/en/latest/risk.html#RiskFunctions.UCI_Abs-return-type "Permalink to this headline")
[float](https://docs.python.org/3.11/library/functions.html#float "(in Python v3.11)")
RiskFunctions.MDD\_Rel(_[X](https://riskfolio-lib.readthedocs.io/en/latest/risk.html#RiskFunctions.MDD_Rel.X "RiskFunctions.MDD_Rel.X (Python parameter) — Returns series, must have Tx1 size.")
_)[\[source\]](https://riskfolio-lib.readthedocs.io/en/latest/_modules/RiskFunctions.html#MDD_Rel)
[¶](https://riskfolio-lib.readthedocs.io/en/latest/risk.html#RiskFunctions.MDD_Rel "Link to this definition")
Calculate the Maximum Drawdown (MDD) of a returns series using cumpounded cumulative returns.
MDD(X)\=maxj∈(0,T)\[maxt∈(0,j)(∏i\=0t(1+Xi))−∏i\=0j(1+Xi)\]
Parameters:[¶](https://riskfolio-lib.readthedocs.io/en/latest/risk.html#RiskFunctions.MDD_Rel-parameters "Permalink to this headline")
X : 1d-array[¶](https://riskfolio-lib.readthedocs.io/en/latest/risk.html#RiskFunctions.MDD_Rel.X "Permalink to this definition")
Returns series, must have Tx1 size.
Raises:[¶](https://riskfolio-lib.readthedocs.io/en/latest/risk.html#RiskFunctions.MDD_Rel-raises "Permalink to this headline")
[**ValueError**](https://docs.python.org/3.11/library/exceptions.html#ValueError "(in Python v3.11)")
– When the value cannot be calculated.
Returns:[¶](https://riskfolio-lib.readthedocs.io/en/latest/risk.html#RiskFunctions.MDD_Rel-returns "Permalink to this headline")
**value** – MDD of a cumpounded cumulative returns.
Return type:[¶](https://riskfolio-lib.readthedocs.io/en/latest/risk.html#RiskFunctions.MDD_Rel-return-type "Permalink to this headline")
[float](https://docs.python.org/3.11/library/functions.html#float "(in Python v3.11)")
RiskFunctions.ADD\_Rel(_[X](https://riskfolio-lib.readthedocs.io/en/latest/risk.html#RiskFunctions.ADD_Rel.X "RiskFunctions.ADD_Rel.X (Python parameter) — Returns series, must have Tx1 size.")
_)[\[source\]](https://riskfolio-lib.readthedocs.io/en/latest/_modules/RiskFunctions.html#ADD_Rel)
[¶](https://riskfolio-lib.readthedocs.io/en/latest/risk.html#RiskFunctions.ADD_Rel "Link to this definition")
Calculate the Average Drawdown (ADD) of a returns series using cumpounded cumulative returns.
ADD(X)\=1T∑j\=0T\[maxt∈(0,j)(∏i\=0t(1+Xi))−∏i\=0j(1+Xi)\]
Parameters:[¶](https://riskfolio-lib.readthedocs.io/en/latest/risk.html#RiskFunctions.ADD_Rel-parameters "Permalink to this headline")
X : 1d-array[¶](https://riskfolio-lib.readthedocs.io/en/latest/risk.html#RiskFunctions.ADD_Rel.X "Permalink to this definition")
Returns series, must have Tx1 size.
Raises:[¶](https://riskfolio-lib.readthedocs.io/en/latest/risk.html#RiskFunctions.ADD_Rel-raises "Permalink to this headline")
[**ValueError**](https://docs.python.org/3.11/library/exceptions.html#ValueError "(in Python v3.11)")
– When the value cannot be calculated.
Returns:[¶](https://riskfolio-lib.readthedocs.io/en/latest/risk.html#RiskFunctions.ADD_Rel-returns "Permalink to this headline")
**value** – ADD of a cumpounded cumulative returns.
Return type:[¶](https://riskfolio-lib.readthedocs.io/en/latest/risk.html#RiskFunctions.ADD_Rel-return-type "Permalink to this headline")
[float](https://docs.python.org/3.11/library/functions.html#float "(in Python v3.11)")
RiskFunctions.DaR\_Rel(_[X](https://riskfolio-lib.readthedocs.io/en/latest/risk.html#RiskFunctions.DaR_Rel.X "RiskFunctions.DaR_Rel.X (Python parameter) — Returns series, must have Tx1 size..")
_, _[alpha](https://riskfolio-lib.readthedocs.io/en/latest/risk.html#RiskFunctions.DaR_Rel.alpha "RiskFunctions.DaR_Rel.alpha (Python parameter) — Significance level of DaR.")
\=`0.05`_)[\[source\]](https://riskfolio-lib.readthedocs.io/en/latest/_modules/RiskFunctions.html#DaR_Rel)
[¶](https://riskfolio-lib.readthedocs.io/en/latest/risk.html#RiskFunctions.DaR_Rel "Link to this definition")
Calculate the Drawdown at Risk (DaR) of a returns series using cumpounded cumulative returns.
DaRα(X)\=maxj∈(0,T){DD(X,j)∈R:FDD(DD(X,j))<1−α}DD(X,j)\=maxt∈(0,j)(∏i\=0t(1+Xi))−∏i\=0j(1+Xi)
Parameters:[¶](https://riskfolio-lib.readthedocs.io/en/latest/risk.html#RiskFunctions.DaR_Rel-parameters "Permalink to this headline")
X : 1d-array[¶](https://riskfolio-lib.readthedocs.io/en/latest/risk.html#RiskFunctions.DaR_Rel.X "Permalink to this definition")
Returns series, must have Tx1 size..
alpha : [float](https://docs.python.org/3.11/library/functions.html#float "(in Python v3.11)")
, optional[¶](https://riskfolio-lib.readthedocs.io/en/latest/risk.html#RiskFunctions.DaR_Rel.alpha "Permalink to this definition")
Significance level of DaR. The default is 0.05.
Raises:[¶](https://riskfolio-lib.readthedocs.io/en/latest/risk.html#RiskFunctions.DaR_Rel-raises "Permalink to this headline")
[**ValueError**](https://docs.python.org/3.11/library/exceptions.html#ValueError "(in Python v3.11)")
– When the value cannot be calculated.
Returns:[¶](https://riskfolio-lib.readthedocs.io/en/latest/risk.html#RiskFunctions.DaR_Rel-returns "Permalink to this headline")
**value** – DaR of a cumpounded cumulative returns series.
Return type:[¶](https://riskfolio-lib.readthedocs.io/en/latest/risk.html#RiskFunctions.DaR_Rel-return-type "Permalink to this headline")
[float](https://docs.python.org/3.11/library/functions.html#float "(in Python v3.11)")
RiskFunctions.CDaR\_Rel(_[X](https://riskfolio-lib.readthedocs.io/en/latest/risk.html#RiskFunctions.CDaR_Rel.X "RiskFunctions.CDaR_Rel.X (Python parameter) — Returns series, must have Tx1 size..")
_, _[alpha](https://riskfolio-lib.readthedocs.io/en/latest/risk.html#RiskFunctions.CDaR_Rel.alpha "RiskFunctions.CDaR_Rel.alpha (Python parameter) — Significance level of CDaR.")
\=`0.05`_)[\[source\]](https://riskfolio-lib.readthedocs.io/en/latest/_modules/RiskFunctions.html#CDaR_Rel)
[¶](https://riskfolio-lib.readthedocs.io/en/latest/risk.html#RiskFunctions.CDaR_Rel "Link to this definition")
Calculate the Conditional Drawdown at Risk (CDaR) of a returns series using cumpounded cumulative returns.
CDaRα(X)\=DaRα(X)+1αT∑i\=0Tmax\[maxt∈(0,T)(∏i\=0t(1+Xi))−∏i\=0j(1+Xi)−DaRα(X),0\]
Where:
DaRα is the Drawdown at Risk of a cumpound cumulated return series X.
Parameters:[¶](https://riskfolio-lib.readthedocs.io/en/latest/risk.html#RiskFunctions.CDaR_Rel-parameters "Permalink to this headline")
X : 1d-array[¶](https://riskfolio-lib.readthedocs.io/en/latest/risk.html#RiskFunctions.CDaR_Rel.X "Permalink to this definition")
Returns series, must have Tx1 size..
alpha : [float](https://docs.python.org/3.11/library/functions.html#float "(in Python v3.11)")
, optional[¶](https://riskfolio-lib.readthedocs.io/en/latest/risk.html#RiskFunctions.CDaR_Rel.alpha "Permalink to this definition")
Significance level of CDaR. The default is 0.05.
Raises:[¶](https://riskfolio-lib.readthedocs.io/en/latest/risk.html#RiskFunctions.CDaR_Rel-raises "Permalink to this headline")
[**ValueError**](https://docs.python.org/3.11/library/exceptions.html#ValueError "(in Python v3.11)")
– When the value cannot be calculated.
Returns:[¶](https://riskfolio-lib.readthedocs.io/en/latest/risk.html#RiskFunctions.CDaR_Rel-returns "Permalink to this headline")
**value** – CDaR of a cumpounded cumulative returns series.
Return type:[¶](https://riskfolio-lib.readthedocs.io/en/latest/risk.html#RiskFunctions.CDaR_Rel-return-type "Permalink to this headline")
[float](https://docs.python.org/3.11/library/functions.html#float "(in Python v3.11)")
RiskFunctions.EDaR\_Rel(_[X](https://riskfolio-lib.readthedocs.io/en/latest/risk.html#RiskFunctions.EDaR_Rel.X "RiskFunctions.EDaR_Rel.X (Python parameter) — Returns series, must have Tx1 size..")
_, _[alpha](https://riskfolio-lib.readthedocs.io/en/latest/risk.html#RiskFunctions.EDaR_Rel.alpha "RiskFunctions.EDaR_Rel.alpha (Python parameter) — Significance level of EDaR.")
\=`0.05`_, _[solver](https://riskfolio-lib.readthedocs.io/en/latest/risk.html#RiskFunctions.EDaR_Rel "RiskFunctions.EDaR_Rel.solver (Python parameter)")
\=`'CLARABEL'`_)[\[source\]](https://riskfolio-lib.readthedocs.io/en/latest/_modules/RiskFunctions.html#EDaR_Rel)
[¶](https://riskfolio-lib.readthedocs.io/en/latest/risk.html#RiskFunctions.EDaR_Rel "Link to this definition")
Calculate the Entropic Drawdown at Risk (EDaR) of a returns series using cumpounded cumulative returns.
EDaRα(X)\=infz\>0{zln(MDD(X)(z−1)α)}DD(X,j)\=maxt∈(0,j)(∏i\=0t(1+Xi))−∏i\=0j(1+Xi)
Parameters:[¶](https://riskfolio-lib.readthedocs.io/en/latest/risk.html#RiskFunctions.EDaR_Rel-parameters "Permalink to this headline")
X : 1d-array[¶](https://riskfolio-lib.readthedocs.io/en/latest/risk.html#RiskFunctions.EDaR_Rel.X "Permalink to this definition")
Returns series, must have Tx1 size..
alpha : [float](https://docs.python.org/3.11/library/functions.html#float "(in Python v3.11)")
, optional[¶](https://riskfolio-lib.readthedocs.io/en/latest/risk.html#RiskFunctions.EDaR_Rel.alpha "Permalink to this definition")
Significance level of EDaR. The default is 0.05.
Raises:[¶](https://riskfolio-lib.readthedocs.io/en/latest/risk.html#RiskFunctions.EDaR_Rel-raises "Permalink to this headline")
[**ValueError**](https://docs.python.org/3.11/library/exceptions.html#ValueError "(in Python v3.11)")
– When the value cannot be calculated.
Returns:[¶](https://riskfolio-lib.readthedocs.io/en/latest/risk.html#RiskFunctions.EDaR_Rel-returns "Permalink to this headline")
**(value, z)** – EDaR of a cumpounded cumulative returns series and value of z that minimize EDaR.
Return type:[¶](https://riskfolio-lib.readthedocs.io/en/latest/risk.html#RiskFunctions.EDaR_Rel-return-type "Permalink to this headline")
[tuple](https://docs.python.org/3.11/library/stdtypes.html#tuple "(in Python v3.11)")
RiskFunctions.RLDaR\_Rel(_[X](https://riskfolio-lib.readthedocs.io/en/latest/risk.html#RiskFunctions.RLDaR_Rel.X "RiskFunctions.RLDaR_Rel.X (Python parameter) — Returns series, must have Tx1 size.")
_, _[alpha](https://riskfolio-lib.readthedocs.io/en/latest/risk.html#RiskFunctions.RLDaR_Rel.alpha "RiskFunctions.RLDaR_Rel.alpha (Python parameter) — Significance level of RLDaR.")
\=`0.05`_, _[kappa](https://riskfolio-lib.readthedocs.io/en/latest/risk.html#RiskFunctions.RLDaR_Rel.kappa "RiskFunctions.RLDaR_Rel.kappa (Python parameter) — Deformation parameter of RLDaR, must be between 0 and 1.")
\=`0.3`_, _[solver](https://riskfolio-lib.readthedocs.io/en/latest/risk.html#RiskFunctions.RLDaR_Rel.solver "RiskFunctions.RLDaR_Rel.solver (Python parameter) — Solver available for CVXPY that supports power cone programming.")
\=`'CLARABEL'`_)[\[source\]](https://riskfolio-lib.readthedocs.io/en/latest/_modules/RiskFunctions.html#RLDaR_Rel)
[¶](https://riskfolio-lib.readthedocs.io/en/latest/risk.html#RiskFunctions.RLDaR_Rel "Link to this definition")
Calculate the Relativistic Drawdown at Risk (RLDaR) of a returns series using compounded cumulative returns. I recommend only use this function with MOSEK solver.
RLDaRακ(X)\=RLVaRακ(DD(X))DD(X,j)\=maxt∈(0,j)(∏i\=0t(1+Xi))−∏i\=0j(1+Xi)
Parameters:[¶](https://riskfolio-lib.readthedocs.io/en/latest/risk.html#RiskFunctions.RLDaR_Rel-parameters "Permalink to this headline")
X : 1d-array[¶](https://riskfolio-lib.readthedocs.io/en/latest/risk.html#RiskFunctions.RLDaR_Rel.X "Permalink to this definition")
Returns series, must have Tx1 size.
alpha : [float](https://docs.python.org/3.11/library/functions.html#float "(in Python v3.11)")
, optional[¶](https://riskfolio-lib.readthedocs.io/en/latest/risk.html#RiskFunctions.RLDaR_Rel.alpha "Permalink to this definition")
Significance level of RLDaR. The default is 0.05.
kappa : [float](https://docs.python.org/3.11/library/functions.html#float "(in Python v3.11)")
, optional[¶](https://riskfolio-lib.readthedocs.io/en/latest/risk.html#RiskFunctions.RLDaR_Rel.kappa "Permalink to this definition")
Deformation parameter of RLDaR, must be between 0 and 1. The default is 0.3.
solver : [str](https://docs.python.org/3.11/library/stdtypes.html#str "(in Python v3.11)")
, optional[¶](https://riskfolio-lib.readthedocs.io/en/latest/risk.html#RiskFunctions.RLDaR_Rel.solver "Permalink to this definition")
Solver available for CVXPY that supports power cone programming. Used to calculate RLVaR, RVRG and RLDaR. The default value is ‘CLARABEL’.
Raises:[¶](https://riskfolio-lib.readthedocs.io/en/latest/risk.html#RiskFunctions.RLDaR_Rel-raises "Permalink to this headline")
[**ValueError**](https://docs.python.org/3.11/library/exceptions.html#ValueError "(in Python v3.11)")
– When the value cannot be calculated.
Returns:[¶](https://riskfolio-lib.readthedocs.io/en/latest/risk.html#RiskFunctions.RLDaR_Rel-returns "Permalink to this headline")
**value** – RLDaR of a compounded cumulative returns series.
Return type:[¶](https://riskfolio-lib.readthedocs.io/en/latest/risk.html#RiskFunctions.RLDaR_Rel-return-type "Permalink to this headline")
[tuple](https://docs.python.org/3.11/library/stdtypes.html#tuple "(in Python v3.11)")
RiskFunctions.UCI\_Rel(_[X](https://riskfolio-lib.readthedocs.io/en/latest/risk.html#RiskFunctions.UCI_Rel.X "RiskFunctions.UCI_Rel.X (Python parameter) — Returns series, must have Tx1 size.")
_)[\[source\]](https://riskfolio-lib.readthedocs.io/en/latest/_modules/RiskFunctions.html#UCI_Rel)
[¶](https://riskfolio-lib.readthedocs.io/en/latest/risk.html#RiskFunctions.UCI_Rel "Link to this definition")
Calculate the Ulcer Index (UCI) of a returns series using cumpounded cumulative returns.
UCI(X)\=1T∑j\=0T\[maxt∈(0,j)(∏i\=0t(1+Xi))−∏i\=0j(1+Xi)\]2
Parameters:[¶](https://riskfolio-lib.readthedocs.io/en/latest/risk.html#RiskFunctions.UCI_Rel-parameters "Permalink to this headline")
X : 1d-array[¶](https://riskfolio-lib.readthedocs.io/en/latest/risk.html#RiskFunctions.UCI_Rel.X "Permalink to this definition")
Returns series, must have Tx1 size.
Raises:[¶](https://riskfolio-lib.readthedocs.io/en/latest/risk.html#RiskFunctions.UCI_Rel-raises "Permalink to this headline")
[**ValueError**](https://docs.python.org/3.11/library/exceptions.html#ValueError "(in Python v3.11)")
– When the value cannot be calculated.
Returns:[¶](https://riskfolio-lib.readthedocs.io/en/latest/risk.html#RiskFunctions.UCI_Rel-returns "Permalink to this headline")
**value** – Ulcer Index of a cumpounded cumulative returns.
Return type:[¶](https://riskfolio-lib.readthedocs.io/en/latest/risk.html#RiskFunctions.UCI_Rel-return-type "Permalink to this headline")
[float](https://docs.python.org/3.11/library/functions.html#float "(in Python v3.11)")
RiskFunctions.GMD(_[X](https://riskfolio-lib.readthedocs.io/en/latest/risk.html#RiskFunctions.GMD.X "RiskFunctions.GMD.X (Python parameter) — Returns series, must have Tx1 size.")
_)[\[source\]](https://riskfolio-lib.readthedocs.io/en/latest/_modules/RiskFunctions.html#GMD)
[¶](https://riskfolio-lib.readthedocs.io/en/latest/risk.html#RiskFunctions.GMD "Link to this definition")
Calculate the Gini Mean Difference (GMD) of a returns series.
Parameters:[¶](https://riskfolio-lib.readthedocs.io/en/latest/risk.html#RiskFunctions.GMD-parameters "Permalink to this headline")
X : 1d-array[¶](https://riskfolio-lib.readthedocs.io/en/latest/risk.html#RiskFunctions.GMD.X "Permalink to this definition")
Returns series, must have Tx1 size.
Raises:[¶](https://riskfolio-lib.readthedocs.io/en/latest/risk.html#RiskFunctions.GMD-raises "Permalink to this headline")
[**ValueError**](https://docs.python.org/3.11/library/exceptions.html#ValueError "(in Python v3.11)")
– When the value cannot be calculated.
Returns:[¶](https://riskfolio-lib.readthedocs.io/en/latest/risk.html#RiskFunctions.GMD-returns "Permalink to this headline")
**value** – Gini Mean Difference of a returns series.
Return type:[¶](https://riskfolio-lib.readthedocs.io/en/latest/risk.html#RiskFunctions.GMD-return-type "Permalink to this headline")
[float](https://docs.python.org/3.11/library/functions.html#float "(in Python v3.11)")
RiskFunctions.TG(_[X](https://riskfolio-lib.readthedocs.io/en/latest/risk.html#RiskFunctions.TG.X "RiskFunctions.TG.X (Python parameter) — Returns series, must have Tx1 size.")
_, _[alpha](https://riskfolio-lib.readthedocs.io/en/latest/risk.html#RiskFunctions.TG.alpha "RiskFunctions.TG.alpha (Python parameter) — Significance level of Tail Gini.")
\=`0.05`_, _[a\_sim](https://riskfolio-lib.readthedocs.io/en/latest/risk.html#RiskFunctions.TG.a_sim "RiskFunctions.TG.a_sim (Python parameter) — Number of CVaRs used to approximate Tail Gini.")
\=`100`_)[\[source\]](https://riskfolio-lib.readthedocs.io/en/latest/_modules/RiskFunctions.html#TG)
[¶](https://riskfolio-lib.readthedocs.io/en/latest/risk.html#RiskFunctions.TG "Link to this definition")
Calculate the Tail Gini of a returns series.
Parameters:[¶](https://riskfolio-lib.readthedocs.io/en/latest/risk.html#RiskFunctions.TG-parameters "Permalink to this headline")
X : 1d-array[¶](https://riskfolio-lib.readthedocs.io/en/latest/risk.html#RiskFunctions.TG.X "Permalink to this definition")
Returns series, must have Tx1 size.
alpha : [float](https://docs.python.org/3.11/library/functions.html#float "(in Python v3.11)")
, optional[¶](https://riskfolio-lib.readthedocs.io/en/latest/risk.html#RiskFunctions.TG.alpha "Permalink to this definition")
Significance level of Tail Gini. The default is 0.05.
a\_sim : [float](https://docs.python.org/3.11/library/functions.html#float "(in Python v3.11)")
, optional[¶](https://riskfolio-lib.readthedocs.io/en/latest/risk.html#RiskFunctions.TG.a_sim "Permalink to this definition")
Number of CVaRs used to approximate Tail Gini. The default is 100.
Raises:[¶](https://riskfolio-lib.readthedocs.io/en/latest/risk.html#RiskFunctions.TG-raises "Permalink to this headline")
[**ValueError**](https://docs.python.org/3.11/library/exceptions.html#ValueError "(in Python v3.11)")
– When the value cannot be calculated.
Returns:[¶](https://riskfolio-lib.readthedocs.io/en/latest/risk.html#RiskFunctions.TG-returns "Permalink to this headline")
**value** – Ulcer Index of a cumpounded cumulative returns.
Return type:[¶](https://riskfolio-lib.readthedocs.io/en/latest/risk.html#RiskFunctions.TG-return-type "Permalink to this headline")
[float](https://docs.python.org/3.11/library/functions.html#float "(in Python v3.11)")
RiskFunctions.RG(_[X](https://riskfolio-lib.readthedocs.io/en/latest/risk.html#RiskFunctions.RG.X "RiskFunctions.RG.X (Python parameter) — Returns series, must have Tx1 size.")
_)[\[source\]](https://riskfolio-lib.readthedocs.io/en/latest/_modules/RiskFunctions.html#RG)
[¶](https://riskfolio-lib.readthedocs.io/en/latest/risk.html#RiskFunctions.RG "Link to this definition")
Calculate the range of a returns series.
Parameters:[¶](https://riskfolio-lib.readthedocs.io/en/latest/risk.html#RiskFunctions.RG-parameters "Permalink to this headline")
X : 1d-array[¶](https://riskfolio-lib.readthedocs.io/en/latest/risk.html#RiskFunctions.RG.X "Permalink to this definition")
Returns series, must have Tx1 size.
Raises:[¶](https://riskfolio-lib.readthedocs.io/en/latest/risk.html#RiskFunctions.RG-raises "Permalink to this headline")
[**ValueError**](https://docs.python.org/3.11/library/exceptions.html#ValueError "(in Python v3.11)")
– When the value cannot be calculated.
Returns:[¶](https://riskfolio-lib.readthedocs.io/en/latest/risk.html#RiskFunctions.RG-returns "Permalink to this headline")
**value** – Ulcer Index of a cumpounded cumulative returns.
Return type:[¶](https://riskfolio-lib.readthedocs.io/en/latest/risk.html#RiskFunctions.RG-return-type "Permalink to this headline")
[float](https://docs.python.org/3.11/library/functions.html#float "(in Python v3.11)")
RiskFunctions.VRG(_[X](https://riskfolio-lib.readthedocs.io/en/latest/risk.html#RiskFunctions.VRG.X "RiskFunctions.VRG.X (Python parameter) — Returns series, must have Tx1 size.")
_, _[alpha](https://riskfolio-lib.readthedocs.io/en/latest/risk.html#RiskFunctions.VRG.alpha "RiskFunctions.VRG.alpha (Python parameter) — Significance level of VaR of losses.")
\=`0.05`_, _[beta](https://riskfolio-lib.readthedocs.io/en/latest/risk.html#RiskFunctions.VRG.beta "RiskFunctions.VRG.beta (Python parameter) — Significance level of VaR of gains.")
\=`None`_)[\[source\]](https://riskfolio-lib.readthedocs.io/en/latest/_modules/RiskFunctions.html#VRG)
[¶](https://riskfolio-lib.readthedocs.io/en/latest/risk.html#RiskFunctions.VRG "Link to this definition")
Calculate the CVaR range of a returns series.
Parameters:[¶](https://riskfolio-lib.readthedocs.io/en/latest/risk.html#RiskFunctions.VRG-parameters "Permalink to this headline")
X : 1d-array[¶](https://riskfolio-lib.readthedocs.io/en/latest/risk.html#RiskFunctions.VRG.X "Permalink to this definition")
Returns series, must have Tx1 size.
alpha : [float](https://docs.python.org/3.11/library/functions.html#float "(in Python v3.11)")
, optional[¶](https://riskfolio-lib.readthedocs.io/en/latest/risk.html#RiskFunctions.VRG.alpha "Permalink to this definition")
Significance level of VaR of losses. The default is 0.05.
beta : [float](https://docs.python.org/3.11/library/functions.html#float "(in Python v3.11)")
, optional[¶](https://riskfolio-lib.readthedocs.io/en/latest/risk.html#RiskFunctions.VRG.beta "Permalink to this definition")
Significance level of VaR of gains. If None it duplicates alpha value. The default is None.
Raises:[¶](https://riskfolio-lib.readthedocs.io/en/latest/risk.html#RiskFunctions.VRG-raises "Permalink to this headline")
[**ValueError**](https://docs.python.org/3.11/library/exceptions.html#ValueError "(in Python v3.11)")
– When the value cannot be calculated.
Returns:[¶](https://riskfolio-lib.readthedocs.io/en/latest/risk.html#RiskFunctions.VRG-returns "Permalink to this headline")
**value** – Ulcer Index of a cumpounded cumulative returns.
Return type:[¶](https://riskfolio-lib.readthedocs.io/en/latest/risk.html#RiskFunctions.VRG-return-type "Permalink to this headline")
[float](https://docs.python.org/3.11/library/functions.html#float "(in Python v3.11)")
RiskFunctions.CVRG(_[X](https://riskfolio-lib.readthedocs.io/en/latest/risk.html#RiskFunctions.CVRG.X "RiskFunctions.CVRG.X (Python parameter) — Returns series, must have Tx1 size.")
_, _[alpha](https://riskfolio-lib.readthedocs.io/en/latest/risk.html#RiskFunctions.CVRG.alpha "RiskFunctions.CVRG.alpha (Python parameter) — Significance level of CVaR of losses.")
\=`0.05`_, _[beta](https://riskfolio-lib.readthedocs.io/en/latest/risk.html#RiskFunctions.CVRG.beta "RiskFunctions.CVRG.beta (Python parameter) — Significance level of CVaR of gains.")
\=`None`_)[\[source\]](https://riskfolio-lib.readthedocs.io/en/latest/_modules/RiskFunctions.html#CVRG)
[¶](https://riskfolio-lib.readthedocs.io/en/latest/risk.html#RiskFunctions.CVRG "Link to this definition")
Calculate the CVaR range of a returns series.
Parameters:[¶](https://riskfolio-lib.readthedocs.io/en/latest/risk.html#RiskFunctions.CVRG-parameters "Permalink to this headline")
X : 1d-array[¶](https://riskfolio-lib.readthedocs.io/en/latest/risk.html#RiskFunctions.CVRG.X "Permalink to this definition")
Returns series, must have Tx1 size.
alpha : [float](https://docs.python.org/3.11/library/functions.html#float "(in Python v3.11)")
, optional[¶](https://riskfolio-lib.readthedocs.io/en/latest/risk.html#RiskFunctions.CVRG.alpha "Permalink to this definition")
Significance level of CVaR of losses. The default is 0.05.
beta : [float](https://docs.python.org/3.11/library/functions.html#float "(in Python v3.11)")
, optional[¶](https://riskfolio-lib.readthedocs.io/en/latest/risk.html#RiskFunctions.CVRG.beta "Permalink to this definition")
Significance level of CVaR of gains. If None it duplicates alpha value. The default is None.
Raises:[¶](https://riskfolio-lib.readthedocs.io/en/latest/risk.html#RiskFunctions.CVRG-raises "Permalink to this headline")
[**ValueError**](https://docs.python.org/3.11/library/exceptions.html#ValueError "(in Python v3.11)")
– When the value cannot be calculated.
Returns:[¶](https://riskfolio-lib.readthedocs.io/en/latest/risk.html#RiskFunctions.CVRG-returns "Permalink to this headline")
**value** – Ulcer Index of a cumpounded cumulative returns.
Return type:[¶](https://riskfolio-lib.readthedocs.io/en/latest/risk.html#RiskFunctions.CVRG-return-type "Permalink to this headline")
[float](https://docs.python.org/3.11/library/functions.html#float "(in Python v3.11)")
RiskFunctions.TGRG(_[X](https://riskfolio-lib.readthedocs.io/en/latest/risk.html#RiskFunctions.TGRG.X "RiskFunctions.TGRG.X (Python parameter) — Returns series, must have Tx1 size.")
_, _[alpha](https://riskfolio-lib.readthedocs.io/en/latest/risk.html#RiskFunctions.TGRG.alpha "RiskFunctions.TGRG.alpha (Python parameter) — Significance level of Tail Gini of losses.")
\=`0.05`_, _[a\_sim](https://riskfolio-lib.readthedocs.io/en/latest/risk.html#RiskFunctions.TGRG.a_sim "RiskFunctions.TGRG.a_sim (Python parameter) — Number of CVaRs used to approximate Tail Gini of losses.")
\=`100`_, _[beta](https://riskfolio-lib.readthedocs.io/en/latest/risk.html#RiskFunctions.TGRG.beta "RiskFunctions.TGRG.beta (Python parameter) — Significance level of Tail Gini of gains.")
\=`None`_, _[b\_sim](https://riskfolio-lib.readthedocs.io/en/latest/risk.html#RiskFunctions.TGRG.b_sim "RiskFunctions.TGRG.b_sim (Python parameter) — Number of CVaRs used to approximate Tail Gini of gains.")
\=`None`_)[\[source\]](https://riskfolio-lib.readthedocs.io/en/latest/_modules/RiskFunctions.html#TGRG)
[¶](https://riskfolio-lib.readthedocs.io/en/latest/risk.html#RiskFunctions.TGRG "Link to this definition")
Calculate the Tail Gini range of a returns series.
Parameters:[¶](https://riskfolio-lib.readthedocs.io/en/latest/risk.html#RiskFunctions.TGRG-parameters "Permalink to this headline")
X : 1d-array[¶](https://riskfolio-lib.readthedocs.io/en/latest/risk.html#RiskFunctions.TGRG.X "Permalink to this definition")
Returns series, must have Tx1 size.
alpha : [float](https://docs.python.org/3.11/library/functions.html#float "(in Python v3.11)")
, optional[¶](https://riskfolio-lib.readthedocs.io/en/latest/risk.html#RiskFunctions.TGRG.alpha "Permalink to this definition")
Significance level of Tail Gini of losses. The default is 0.05.
a\_sim : [float](https://docs.python.org/3.11/library/functions.html#float "(in Python v3.11)")
, optional[¶](https://riskfolio-lib.readthedocs.io/en/latest/risk.html#RiskFunctions.TGRG.a_sim "Permalink to this definition")
Number of CVaRs used to approximate Tail Gini of losses. The default is 100.
beta : [float](https://docs.python.org/3.11/library/functions.html#float "(in Python v3.11)")
, optional[¶](https://riskfolio-lib.readthedocs.io/en/latest/risk.html#RiskFunctions.TGRG.beta "Permalink to this definition")
Significance level of Tail Gini of gains. If None it duplicates alpha value. The default is None.
b\_sim : [float](https://docs.python.org/3.11/library/functions.html#float "(in Python v3.11)")
, optional[¶](https://riskfolio-lib.readthedocs.io/en/latest/risk.html#RiskFunctions.TGRG.b_sim "Permalink to this definition")
Number of CVaRs used to approximate Tail Gini of gains. If None it duplicates a\_sim value. The default is None.
Raises:[¶](https://riskfolio-lib.readthedocs.io/en/latest/risk.html#RiskFunctions.TGRG-raises "Permalink to this headline")
[**ValueError**](https://docs.python.org/3.11/library/exceptions.html#ValueError "(in Python v3.11)")
– When the value cannot be calculated.
Returns:[¶](https://riskfolio-lib.readthedocs.io/en/latest/risk.html#RiskFunctions.TGRG-returns "Permalink to this headline")
**value** – Ulcer Index of a cumpounded cumulative returns.
Return type:[¶](https://riskfolio-lib.readthedocs.io/en/latest/risk.html#RiskFunctions.TGRG-return-type "Permalink to this headline")
[float](https://docs.python.org/3.11/library/functions.html#float "(in Python v3.11)")
RiskFunctions.EVRG(_[X](https://riskfolio-lib.readthedocs.io/en/latest/risk.html#RiskFunctions.EVRG.X "RiskFunctions.EVRG.X (Python parameter) — Returns series, must have Tx1 size.")
_, _[alpha](https://riskfolio-lib.readthedocs.io/en/latest/risk.html#RiskFunctions.EVRG.alpha "RiskFunctions.EVRG.alpha (Python parameter) — Significance level of EVaR of losses.")
\=`0.05`_, _[beta](https://riskfolio-lib.readthedocs.io/en/latest/risk.html#RiskFunctions.EVRG.beta "RiskFunctions.EVRG.beta (Python parameter) — Significance level of EVaR of gains.")
\=`None`_, _[solver](https://riskfolio-lib.readthedocs.io/en/latest/risk.html#RiskFunctions.EVRG.solver "RiskFunctions.EVRG.solver (Python parameter) — Solver available for CVXPY that supports exponential cone programming. Used to calculate EVaR, EVRG and EDaR.")
\=`'CLARABEL'`_)[\[source\]](https://riskfolio-lib.readthedocs.io/en/latest/_modules/RiskFunctions.html#EVRG)
[¶](https://riskfolio-lib.readthedocs.io/en/latest/risk.html#RiskFunctions.EVRG "Link to this definition")
Calculate the CVaR range of a returns series.
Parameters:[¶](https://riskfolio-lib.readthedocs.io/en/latest/risk.html#RiskFunctions.EVRG-parameters "Permalink to this headline")
X : 1d-array[¶](https://riskfolio-lib.readthedocs.io/en/latest/risk.html#RiskFunctions.EVRG.X "Permalink to this definition")
Returns series, must have Tx1 size.
alpha : [float](https://docs.python.org/3.11/library/functions.html#float "(in Python v3.11)")
, optional[¶](https://riskfolio-lib.readthedocs.io/en/latest/risk.html#RiskFunctions.EVRG.alpha "Permalink to this definition")
Significance level of EVaR of losses. The default is 0.05.
beta : [float](https://docs.python.org/3.11/library/functions.html#float "(in Python v3.11)")
, optional[¶](https://riskfolio-lib.readthedocs.io/en/latest/risk.html#RiskFunctions.EVRG.beta "Permalink to this definition")
Significance level of EVaR of gains. If None it duplicates alpha value. The default is None.
solver : [str](https://docs.python.org/3.11/library/stdtypes.html#str "(in Python v3.11)")
, optional[¶](https://riskfolio-lib.readthedocs.io/en/latest/risk.html#RiskFunctions.EVRG.solver "Permalink to this definition")
Solver available for CVXPY that supports exponential cone programming. Used to calculate EVaR, EVRG and EDaR. The default value is ‘CLARABEL’.
Raises:[¶](https://riskfolio-lib.readthedocs.io/en/latest/risk.html#RiskFunctions.EVRG-raises "Permalink to this headline")
[**ValueError**](https://docs.python.org/3.11/library/exceptions.html#ValueError "(in Python v3.11)")
– When the value cannot be calculated.
Returns:[¶](https://riskfolio-lib.readthedocs.io/en/latest/risk.html#RiskFunctions.EVRG-returns "Permalink to this headline")
**value** – Ulcer Index of a cumpounded cumulative returns.
Return type:[¶](https://riskfolio-lib.readthedocs.io/en/latest/risk.html#RiskFunctions.EVRG-return-type "Permalink to this headline")
[float](https://docs.python.org/3.11/library/functions.html#float "(in Python v3.11)")
RiskFunctions.RVRG(_[X](https://riskfolio-lib.readthedocs.io/en/latest/risk.html#RiskFunctions.RVRG.X "RiskFunctions.RVRG.X (Python parameter) — Returns series, must have Tx1 size.")
_, _[alpha](https://riskfolio-lib.readthedocs.io/en/latest/risk.html#RiskFunctions.RVRG.alpha "RiskFunctions.RVRG.alpha (Python parameter) — Significance level of RLVaR of losses.")
\=`0.05`_, _[beta](https://riskfolio-lib.readthedocs.io/en/latest/risk.html#RiskFunctions.RVRG.beta "RiskFunctions.RVRG.beta (Python parameter) — Significance level of RLVaR of gains.")
\=`None`_, _[kappa](https://riskfolio-lib.readthedocs.io/en/latest/risk.html#RiskFunctions.RVRG.kappa "RiskFunctions.RVRG.kappa (Python parameter) — Deformation parameter of RLVaR for losses, must be between 0 and 1. The default is 0.3.")
\=`0.3`_, _[kappa\_g](https://riskfolio-lib.readthedocs.io/en/latest/risk.html#RiskFunctions.RVRG.kappa_g "RiskFunctions.RVRG.kappa_g (Python parameter) — Deformation parameter of RLVaR for gains, must be between 0 and 1. The default is None.")
\=`None`_, _[solver](https://riskfolio-lib.readthedocs.io/en/latest/risk.html#RiskFunctions.RVRG.solver "RiskFunctions.RVRG.solver (Python parameter) — Solver available for CVXPY that supports power cone programming. Used to calculate EVaR, EVRG and EDaR.")
\=`'CLARABEL'`_)[\[source\]](https://riskfolio-lib.readthedocs.io/en/latest/_modules/RiskFunctions.html#RVRG)
[¶](https://riskfolio-lib.readthedocs.io/en/latest/risk.html#RiskFunctions.RVRG "Link to this definition")
Calculate the CVaR range of a returns series.
Parameters:[¶](https://riskfolio-lib.readthedocs.io/en/latest/risk.html#RiskFunctions.RVRG-parameters "Permalink to this headline")
X : 1d-array[¶](https://riskfolio-lib.readthedocs.io/en/latest/risk.html#RiskFunctions.RVRG.X "Permalink to this definition")
Returns series, must have Tx1 size.
alpha : [float](https://docs.python.org/3.11/library/functions.html#float "(in Python v3.11)")
, optional[¶](https://riskfolio-lib.readthedocs.io/en/latest/risk.html#RiskFunctions.RVRG.alpha "Permalink to this definition")
Significance level of RLVaR of losses. The default is 0.05.
beta : [float](https://docs.python.org/3.11/library/functions.html#float "(in Python v3.11)")
, optional[¶](https://riskfolio-lib.readthedocs.io/en/latest/risk.html#RiskFunctions.RVRG.beta "Permalink to this definition")
Significance level of RLVaR of gains. If None it duplicates alpha value. The default is None.
kappa : [float](https://docs.python.org/3.11/library/functions.html#float "(in Python v3.11)")
, optional[¶](https://riskfolio-lib.readthedocs.io/en/latest/risk.html#RiskFunctions.RVRG.kappa "Permalink to this definition")
Deformation parameter of RLVaR for losses, must be between 0 and 1. The default is 0.3.
kappa\_g : [float](https://docs.python.org/3.11/library/functions.html#float "(in Python v3.11)")
, optional[¶](https://riskfolio-lib.readthedocs.io/en/latest/risk.html#RiskFunctions.RVRG.kappa_g "Permalink to this definition")
Deformation parameter of RLVaR for gains, must be between 0 and 1. The default is None.
solver : [str](https://docs.python.org/3.11/library/stdtypes.html#str "(in Python v3.11)")
, optional[¶](https://riskfolio-lib.readthedocs.io/en/latest/risk.html#RiskFunctions.RVRG.solver "Permalink to this definition")
Solver available for CVXPY that supports power cone programming. Used to calculate EVaR, EVRG and EDaR. The default value is ‘CLARABEL’.
Raises:[¶](https://riskfolio-lib.readthedocs.io/en/latest/risk.html#RiskFunctions.RVRG-raises "Permalink to this headline")
[**ValueError**](https://docs.python.org/3.11/library/exceptions.html#ValueError "(in Python v3.11)")
– When the value cannot be calculated.
Returns:[¶](https://riskfolio-lib.readthedocs.io/en/latest/risk.html#RiskFunctions.RVRG-returns "Permalink to this headline")
**value** – Ulcer Index of a cumpounded cumulative returns.
Return type:[¶](https://riskfolio-lib.readthedocs.io/en/latest/risk.html#RiskFunctions.RVRG-return-type "Permalink to this headline")
[float](https://docs.python.org/3.11/library/functions.html#float "(in Python v3.11)")
RiskFunctions.L\_Moment(_[X](https://riskfolio-lib.readthedocs.io/en/latest/risk.html#RiskFunctions.L_Moment.X "RiskFunctions.L_Moment.X (Python parameter) — Returns series, must have Tx1 size.")
_, _[k](https://riskfolio-lib.readthedocs.io/en/latest/risk.html#RiskFunctions.L_Moment.k "RiskFunctions.L_Moment.k (Python parameter) — Order of the l-moment.")
\=`2`_)[\[source\]](https://riskfolio-lib.readthedocs.io/en/latest/_modules/RiskFunctions.html#L_Moment)
[¶](https://riskfolio-lib.readthedocs.io/en/latest/risk.html#RiskFunctions.L_Moment "Link to this definition")
Calculate the kth l-moment of a returns series.
Where $y\_{\[i\]}$ is the ith-ordered statistic.
Parameters:[¶](https://riskfolio-lib.readthedocs.io/en/latest/risk.html#RiskFunctions.L_Moment-parameters "Permalink to this headline")
X : 1d-array[¶](https://riskfolio-lib.readthedocs.io/en/latest/risk.html#RiskFunctions.L_Moment.X "Permalink to this definition")
Returns series, must have Tx1 size.
k : [int](https://docs.python.org/3.11/library/functions.html#int "(in Python v3.11)")
[¶](https://riskfolio-lib.readthedocs.io/en/latest/risk.html#RiskFunctions.L_Moment.k "Permalink to this definition")
Order of the l-moment. Must be an integer higher or equal than 1.
Raises:[¶](https://riskfolio-lib.readthedocs.io/en/latest/risk.html#RiskFunctions.L_Moment-raises "Permalink to this headline")
[**ValueError**](https://docs.python.org/3.11/library/exceptions.html#ValueError "(in Python v3.11)")
– When the value cannot be calculated.
Returns:[¶](https://riskfolio-lib.readthedocs.io/en/latest/risk.html#RiskFunctions.L_Moment-returns "Permalink to this headline")
**value** – Kth l-moment of a returns series.
Return type:[¶](https://riskfolio-lib.readthedocs.io/en/latest/risk.html#RiskFunctions.L_Moment-return-type "Permalink to this headline")
[float](https://docs.python.org/3.11/library/functions.html#float "(in Python v3.11)")
RiskFunctions.L\_Moment\_CRM(_[X](https://riskfolio-lib.readthedocs.io/en/latest/risk.html#RiskFunctions.L_Moment_CRM.X "RiskFunctions.L_Moment_CRM.X (Python parameter) — Returns series, must have Tx1 size.")
_, _[k](https://riskfolio-lib.readthedocs.io/en/latest/risk.html#RiskFunctions.L_Moment_CRM.k "RiskFunctions.L_Moment_CRM.k (Python parameter) — Order of the l-moment.")
\=`4`_, _[method](https://riskfolio-lib.readthedocs.io/en/latest/risk.html#RiskFunctions.L_Moment_CRM.method "RiskFunctions.L_Moment_CRM.method (Python parameter) — Method to calculate the weights used to combine the l-moments with order higher than 2.")
\=`'MSD'`_, _[g](https://riskfolio-lib.readthedocs.io/en/latest/risk.html#RiskFunctions.L_Moment_CRM.g "RiskFunctions.L_Moment_CRM.g (Python parameter) — Risk aversion coefficient of CRRA utility function.")
\=`0.5`_, _[max\_phi](https://riskfolio-lib.readthedocs.io/en/latest/risk.html#RiskFunctions.L_Moment_CRM.max_phi "RiskFunctions.L_Moment_CRM.max_phi (Python parameter) — Maximum weight constraint of L-moments. The default is 0.5.")
\=`0.5`_, _[solver](https://riskfolio-lib.readthedocs.io/en/latest/risk.html#RiskFunctions.L_Moment_CRM.solver "RiskFunctions.L_Moment_CRM.solver (Python parameter) — Solver available for CVXPY.")
\=`'CLARABEL'`_)[\[source\]](https://riskfolio-lib.readthedocs.io/en/latest/_modules/RiskFunctions.html#L_Moment_CRM)
[¶](https://riskfolio-lib.readthedocs.io/en/latest/risk.html#RiskFunctions.L_Moment_CRM "Link to this definition")
Calculate a custom convex risk measure that is a weighted average of first k-th l-moments.
Parameters:[¶](https://riskfolio-lib.readthedocs.io/en/latest/risk.html#RiskFunctions.L_Moment_CRM-parameters "Permalink to this headline")
X : 1d-array[¶](https://riskfolio-lib.readthedocs.io/en/latest/risk.html#RiskFunctions.L_Moment_CRM.X "Permalink to this definition")
Returns series, must have Tx1 size.
k : [int](https://docs.python.org/3.11/library/functions.html#int "(in Python v3.11)")
[¶](https://riskfolio-lib.readthedocs.io/en/latest/risk.html#RiskFunctions.L_Moment_CRM.k "Permalink to this definition")
Order of the l-moment. Must be an integer higher or equal than 2.
method : [str](https://docs.python.org/3.11/library/stdtypes.html#str "(in Python v3.11)")
, optional[¶](https://riskfolio-lib.readthedocs.io/en/latest/risk.html#RiskFunctions.L_Moment_CRM.method "Permalink to this definition")
Method to calculate the weights used to combine the l-moments with order higher than 2. The default value is ‘MSD’. Possible values are:
* ’CRRA’: Normalized Constant Relative Risk Aversion coefficients.
* ’ME’: Maximum Entropy.
* ’MSS’: Minimum Sum Squares.
* ’MSD’: Minimum Square Distance.
g : [float](https://docs.python.org/3.11/library/functions.html#float "(in Python v3.11)")
, optional[¶](https://riskfolio-lib.readthedocs.io/en/latest/risk.html#RiskFunctions.L_Moment_CRM.g "Permalink to this definition")
Risk aversion coefficient of CRRA utility function. The default is 0.5.
max\_phi : [float](https://docs.python.org/3.11/library/functions.html#float "(in Python v3.11)")
, optional[¶](https://riskfolio-lib.readthedocs.io/en/latest/risk.html#RiskFunctions.L_Moment_CRM.max_phi "Permalink to this definition")
Maximum weight constraint of L-moments. The default is 0.5.
solver : [str](https://docs.python.org/3.11/library/stdtypes.html#str "(in Python v3.11)")
, optional[¶](https://riskfolio-lib.readthedocs.io/en/latest/risk.html#RiskFunctions.L_Moment_CRM.solver "Permalink to this definition")
Solver available for CVXPY. Used to calculate ‘ME’, ‘MSS’ and ‘MSD’ weights. The default value is None.
Raises:[¶](https://riskfolio-lib.readthedocs.io/en/latest/risk.html#RiskFunctions.L_Moment_CRM-raises "Permalink to this headline")
[**ValueError**](https://docs.python.org/3.11/library/exceptions.html#ValueError "(in Python v3.11)")
– When the value cannot be calculated.
Returns:[¶](https://riskfolio-lib.readthedocs.io/en/latest/risk.html#RiskFunctions.L_Moment_CRM-returns "Permalink to this headline")
**value** – Custom convex risk measure that is a weighted average of first k-th l-moments of a returns series.
Return type:[¶](https://riskfolio-lib.readthedocs.io/en/latest/risk.html#RiskFunctions.L_Moment_CRM-return-type "Permalink to this headline")
[float](https://docs.python.org/3.11/library/functions.html#float "(in Python v3.11)")
RiskFunctions.NEA(_[w](https://riskfolio-lib.readthedocs.io/en/latest/risk.html#RiskFunctions.NEA.w "RiskFunctions.NEA.w (Python parameter) — Portfolio weights, where n_assets is the number of assets.")
_)[\[source\]](https://riskfolio-lib.readthedocs.io/en/latest/_modules/RiskFunctions.html#NEA)
[¶](https://riskfolio-lib.readthedocs.io/en/latest/risk.html#RiskFunctions.NEA "Link to this definition")
Calculate the number of effective assets (NEA) that is the inverse of the Herfindahl Hirschman index (HHI).
Parameters:[¶](https://riskfolio-lib.readthedocs.io/en/latest/risk.html#RiskFunctions.NEA-parameters "Permalink to this headline")
w : DataFrame or Series of shape (n\_assets, 1)[¶](https://riskfolio-lib.readthedocs.io/en/latest/risk.html#RiskFunctions.NEA.w "Permalink to this definition")
Portfolio weights, where n\_assets is the number of assets.
Raises:[¶](https://riskfolio-lib.readthedocs.io/en/latest/risk.html#RiskFunctions.NEA-raises "Permalink to this headline")
[**ValueError**](https://docs.python.org/3.11/library/exceptions.html#ValueError "(in Python v3.11)")
– When the value cannot be calculated.
Returns:[¶](https://riskfolio-lib.readthedocs.io/en/latest/risk.html#RiskFunctions.NEA-returns "Permalink to this headline")
**value** – The NEA of the portfolio.
Return type:[¶](https://riskfolio-lib.readthedocs.io/en/latest/risk.html#RiskFunctions.NEA-return-type "Permalink to this headline")
[float](https://docs.python.org/3.11/library/functions.html#float "(in Python v3.11)")
RiskFunctions.Sharpe\_Risk(_[returns](https://riskfolio-lib.readthedocs.io/en/latest/risk.html#RiskFunctions.Sharpe_Risk.returns "RiskFunctions.Sharpe_Risk.returns (Python parameter) — Features matrix, where n_samples is the number of samples and n_features is the number of features.")
_, _[w](https://riskfolio-lib.readthedocs.io/en/latest/risk.html#RiskFunctions.Sharpe_Risk.w "RiskFunctions.Sharpe_Risk.w (Python parameter) — Weights matrix, where n_assets is the number of assets.")
\=`None`_, _[cov](https://riskfolio-lib.readthedocs.io/en/latest/risk.html#RiskFunctions.Sharpe_Risk.cov "RiskFunctions.Sharpe_Risk.cov (Python parameter) — Covariance matrix, where n_assets is the number of assets.")
\=`None`_, _[rm](https://riskfolio-lib.readthedocs.io/en/latest/risk.html#RiskFunctions.Sharpe_Risk.rm "RiskFunctions.Sharpe_Risk.rm (Python parameter) — Risk measure used in the denominator of the ratio.")
\=`'MV'`_, _[rf](https://riskfolio-lib.readthedocs.io/en/latest/risk.html#RiskFunctions.Sharpe_Risk.rf "RiskFunctions.Sharpe_Risk.rf (Python parameter) — Risk free rate.")
\=`0`_, _[alpha](https://riskfolio-lib.readthedocs.io/en/latest/risk.html#RiskFunctions.Sharpe_Risk.alpha "RiskFunctions.Sharpe_Risk.alpha (Python parameter) — Significance level of VaR, CVaR, EVaR, RLVaR, DaR, CDaR, EDaR, RLDaR and Tail Gini of losses.")
\=`0.05`_, _[a\_sim](https://riskfolio-lib.readthedocs.io/en/latest/risk.html#RiskFunctions.Sharpe_Risk.a_sim "RiskFunctions.Sharpe_Risk.a_sim (Python parameter) — Number of CVaRs used to approximate Tail Gini of losses.")
\=`100`_, _[beta](https://riskfolio-lib.readthedocs.io/en/latest/risk.html#RiskFunctions.Sharpe_Risk.beta "RiskFunctions.Sharpe_Risk.beta (Python parameter) — Significance level of CVaR and Tail Gini of gains.")
\=`None`_, _[b\_sim](https://riskfolio-lib.readthedocs.io/en/latest/risk.html#RiskFunctions.Sharpe_Risk.b_sim "RiskFunctions.Sharpe_Risk.b_sim (Python parameter) — Number of CVaRs used to approximate Tail Gini of gains.")
\=`None`_, _[kappa](https://riskfolio-lib.readthedocs.io/en/latest/risk.html#RiskFunctions.Sharpe_Risk.kappa "RiskFunctions.Sharpe_Risk.kappa (Python parameter) — Deformation parameter of RLVaR and RLDaR for losses, must be between 0 and 1. The default is 0.3.")
\=`0.3`_, _[kappa\_g](https://riskfolio-lib.readthedocs.io/en/latest/risk.html#RiskFunctions.Sharpe_Risk.kappa_g "RiskFunctions.Sharpe_Risk.kappa_g (Python parameter) — Deformation parameter of RLVaR and RLDaR for gains, must be between 0 and 1. The default is None.")
\=`None`_, _[solver](https://riskfolio-lib.readthedocs.io/en/latest/risk.html#RiskFunctions.Sharpe_Risk.solver "RiskFunctions.Sharpe_Risk.solver (Python parameter) — Solver available for CVXPY that supports exponential and power cone programming.")
\=`'CLARABEL'`_)[\[source\]](https://riskfolio-lib.readthedocs.io/en/latest/_modules/RiskFunctions.html#Sharpe_Risk)
[¶](https://riskfolio-lib.readthedocs.io/en/latest/risk.html#RiskFunctions.Sharpe_Risk "Link to this definition")
Calculate the risk measure available on the Sharpe function.
Parameters:[¶](https://riskfolio-lib.readthedocs.io/en/latest/risk.html#RiskFunctions.Sharpe_Risk-parameters "Permalink to this headline")
w : DataFrame or 1d-array of shape (n\_assets, 1)[¶](https://riskfolio-lib.readthedocs.io/en/latest/risk.html#RiskFunctions.Sharpe_Risk.w "Permalink to this definition")
Weights matrix, where n\_assets is the number of assets.
cov : DataFrame of shape (n\_assets, n\_assets)[¶](https://riskfolio-lib.readthedocs.io/en/latest/risk.html#RiskFunctions.Sharpe_Risk.cov "Permalink to this definition")
Covariance matrix, where n\_assets is the number of assets.
returns : DataFrame or nd-array of shape (n\_samples, n\_features)[¶](https://riskfolio-lib.readthedocs.io/en/latest/risk.html#RiskFunctions.Sharpe_Risk.returns "Permalink to this definition")
Features matrix, where n\_samples is the number of samples and n\_features is the number of features.
rm : [str](https://docs.python.org/3.11/library/stdtypes.html#str "(in Python v3.11)")
, optional[¶](https://riskfolio-lib.readthedocs.io/en/latest/risk.html#RiskFunctions.Sharpe_Risk.rm "Permalink to this definition")
Risk measure used in the denominator of the ratio. The default is ‘MV’. Possible values are:
* ’MV’: Standard Deviation.
* ’KT’: Square Root Kurtosis.
* ’MAD’: Mean Absolute Deviation.
* ’GMD’: Gini Mean Difference.
* ’MSV’: Semi Standard Deviation.
* ’SKT’: Square Root Semi Kurtosis.
* ’FLPM’: First Lower Partial Moment (Omega Ratio).
* ’SLPM’: Second Lower Partial Moment (Sortino Ratio).
* ’VaR’: Value at Risk.
* ’CVaR’: Conditional Value at Risk.
* ’TG’: Tail Gini.
* ’EVaR’: Entropic Value at Risk.
* ’RLVaR’: Relativistic Value at Risk. I recommend only use this function with MOSEK solver.
* ’WR’: Worst Realization (Minimax).
* ’RG’: Range of returns.
* ’VRG’ VaR range of returns.
* ’CVRG’: CVaR range of returns.
* ’TGRG’: Tail Gini range of returns.
* ’EVRG’: EVaR range of returns.
* ’RVRG’: RLVaR range of returns. I recommend only use this function with MOSEK solver.
* ’MDD’: Maximum Drawdown of uncompounded cumulative returns (Calmar Ratio).
* ’ADD’: Average Drawdown of uncompounded cumulative returns.
* ’DaR’: Drawdown at Risk of uncompounded cumulative returns.
* ’CDaR’: Conditional Drawdown at Risk of uncompounded cumulative returns.
* ’EDaR’: Entropic Drawdown at Risk of uncompounded cumulative returns.
* ’RLDaR’: Relativistic Drawdown at Risk of uncompounded cumulative returns. I recommend only use this risk measure with MOSEK solver.
* ’UCI’: Ulcer Index of uncompounded cumulative returns.
* ’MDD\_Rel’: Maximum Drawdown of compounded cumulative returns (Calmar Ratio).
* ’ADD\_Rel’: Average Drawdown of compounded cumulative returns.
* ’DaR\_Rel’: Drawdown at Risk of compounded cumulative returns.
* ’CDaR\_Rel’: Conditional Drawdown at Risk of compounded cumulative returns.
* ’EDaR\_Rel’: Entropic Drawdown at Risk of compounded cumulative returns.
* ’RLDaR\_Rel’: Relativistic Drawdown at Risk of compounded cumulative returns. I recommend only use this risk measure with MOSEK solver.
* ’UCI\_Rel’: Ulcer Index of compounded cumulative returns.
rf : [float](https://docs.python.org/3.11/library/functions.html#float "(in Python v3.11)")
, optional[¶](https://riskfolio-lib.readthedocs.io/en/latest/risk.html#RiskFunctions.Sharpe_Risk.rf "Permalink to this definition")
Risk free rate. The default is 0.
alpha : [float](https://docs.python.org/3.11/library/functions.html#float "(in Python v3.11)")
, optional[¶](https://riskfolio-lib.readthedocs.io/en/latest/risk.html#RiskFunctions.Sharpe_Risk.alpha "Permalink to this definition")
Significance level of VaR, CVaR, EVaR, RLVaR, DaR, CDaR, EDaR, RLDaR and Tail Gini of losses. The default is 0.05.
a\_sim : [float](https://docs.python.org/3.11/library/functions.html#float "(in Python v3.11)")
, optional[¶](https://riskfolio-lib.readthedocs.io/en/latest/risk.html#RiskFunctions.Sharpe_Risk.a_sim "Permalink to this definition")
Number of CVaRs used to approximate Tail Gini of losses. The default is 100.
beta : [float](https://docs.python.org/3.11/library/functions.html#float "(in Python v3.11)")
, optional[¶](https://riskfolio-lib.readthedocs.io/en/latest/risk.html#RiskFunctions.Sharpe_Risk.beta "Permalink to this definition")
Significance level of CVaR and Tail Gini of gains. If None it duplicates alpha value. The default is None.
b\_sim : [float](https://docs.python.org/3.11/library/functions.html#float "(in Python v3.11)")
, optional[¶](https://riskfolio-lib.readthedocs.io/en/latest/risk.html#RiskFunctions.Sharpe_Risk.b_sim "Permalink to this definition")
Number of CVaRs used to approximate Tail Gini of gains. If None it duplicates a\_sim value. The default is None.
kappa : [float](https://docs.python.org/3.11/library/functions.html#float "(in Python v3.11)")
, optional[¶](https://riskfolio-lib.readthedocs.io/en/latest/risk.html#RiskFunctions.Sharpe_Risk.kappa "Permalink to this definition")
Deformation parameter of RLVaR and RLDaR for losses, must be between 0 and 1. The default is 0.3.
kappa\_g : [float](https://docs.python.org/3.11/library/functions.html#float "(in Python v3.11)")
, optional[¶](https://riskfolio-lib.readthedocs.io/en/latest/risk.html#RiskFunctions.Sharpe_Risk.kappa_g "Permalink to this definition")
Deformation parameter of RLVaR and RLDaR for gains, must be between 0 and 1. The default is None.
solver : [str](https://docs.python.org/3.11/library/stdtypes.html#str "(in Python v3.11)")
, optional[¶](https://riskfolio-lib.readthedocs.io/en/latest/risk.html#RiskFunctions.Sharpe_Risk.solver "Permalink to this definition")
Solver available for CVXPY that supports exponential and power cone programming. Used to calculate RLVaR and RLDaR. The default value is ‘CLARABEL’.
Raises:[¶](https://riskfolio-lib.readthedocs.io/en/latest/risk.html#RiskFunctions.Sharpe_Risk-raises "Permalink to this headline")
[**ValueError**](https://docs.python.org/3.11/library/exceptions.html#ValueError "(in Python v3.11)")
– When the value cannot be calculated.
Returns:[¶](https://riskfolio-lib.readthedocs.io/en/latest/risk.html#RiskFunctions.Sharpe_Risk-returns "Permalink to this headline")
**value** – Risk measure of the portfolio.
Return type:[¶](https://riskfolio-lib.readthedocs.io/en/latest/risk.html#RiskFunctions.Sharpe_Risk-return-type "Permalink to this headline")
[float](https://docs.python.org/3.11/library/functions.html#float "(in Python v3.11)")
RiskFunctions.Sharpe(_[returns](https://riskfolio-lib.readthedocs.io/en/latest/risk.html#RiskFunctions.Sharpe.returns "RiskFunctions.Sharpe.returns (Python parameter) — Features matrix, where n_samples is the number of samples and n_features is the number of features.")
_, _[w](https://riskfolio-lib.readthedocs.io/en/latest/risk.html#RiskFunctions.Sharpe.w "RiskFunctions.Sharpe.w (Python parameter) — Weights matrix, where n_assets is the number of assets.")
\=`None`_, _[mu](https://riskfolio-lib.readthedocs.io/en/latest/risk.html#RiskFunctions.Sharpe.mu "RiskFunctions.Sharpe.mu (Python parameter) — Vector of expected returns, where n_assets is the number of assets.")
\=`None`_, _[cov](https://riskfolio-lib.readthedocs.io/en/latest/risk.html#RiskFunctions.Sharpe.cov "RiskFunctions.Sharpe.cov (Python parameter) — Covariance matrix, where n_assets is the number of assets.")
\=`None`_, _[rm](https://riskfolio-lib.readthedocs.io/en/latest/risk.html#RiskFunctions.Sharpe.rm "RiskFunctions.Sharpe.rm (Python parameter) — Risk measure used in the denominator of the ratio.")
\=`'MV'`_, _[rf](https://riskfolio-lib.readthedocs.io/en/latest/risk.html#RiskFunctions.Sharpe.rf "RiskFunctions.Sharpe.rf (Python parameter) — Risk free rate.")
\=`0`_, _[alpha](https://riskfolio-lib.readthedocs.io/en/latest/risk.html#RiskFunctions.Sharpe.alpha "RiskFunctions.Sharpe.alpha (Python parameter) — Significance level of VaR, CVaR, EVaR, RLVaR, DaR, CDaR, EDaR, RLDaR and Tail Gini of losses. The default is 0.05.")
\=`0.05`_, _[a\_sim](https://riskfolio-lib.readthedocs.io/en/latest/risk.html#RiskFunctions.Sharpe.a_sim "RiskFunctions.Sharpe.a_sim (Python parameter) — Number of CVaRs used to approximate Tail Gini of losses.")
\=`100`_, _[beta](https://riskfolio-lib.readthedocs.io/en/latest/risk.html#RiskFunctions.Sharpe.beta "RiskFunctions.Sharpe.beta (Python parameter) — Significance level of CVaR and Tail Gini of gains.")
\=`None`_, _[b\_sim](https://riskfolio-lib.readthedocs.io/en/latest/risk.html#RiskFunctions.Sharpe.b_sim "RiskFunctions.Sharpe.b_sim (Python parameter) — Number of CVaRs used to approximate Tail Gini of gains.")
\=`None`_, _[kappa](https://riskfolio-lib.readthedocs.io/en/latest/risk.html#RiskFunctions.Sharpe.kappa "RiskFunctions.Sharpe.kappa (Python parameter) — Deformation parameter of RLVaR and RLDaR for losses, must be between 0 and 1. The default is 0.3.")
\=`0.3`_, _[kappa\_g](https://riskfolio-lib.readthedocs.io/en/latest/risk.html#RiskFunctions.Sharpe.kappa_g "RiskFunctions.Sharpe.kappa_g (Python parameter) — Deformation parameter of RLVaR and RLDaR for gains, must be between 0 and 1. The default is None.")
\=`None`_, _[solver](https://riskfolio-lib.readthedocs.io/en/latest/risk.html#RiskFunctions.Sharpe.solver "RiskFunctions.Sharpe.solver (Python parameter) — Solver available for CVXPY that supports power cone programming.")
\=`'CLARABEL'`_)[\[source\]](https://riskfolio-lib.readthedocs.io/en/latest/_modules/RiskFunctions.html#Sharpe)
[¶](https://riskfolio-lib.readthedocs.io/en/latest/risk.html#RiskFunctions.Sharpe "Link to this definition")
Calculate the Risk Adjusted Return Ratio from a portfolio returns series.
Sharpe(X)\=E(X)−rfϕ(X)
Where:
X is the vector of portfolio returns.
rf is the risk free rate, when the risk measure is
LPM uses instead of rf the MAR.
ϕ(X) is a convex risk measure. The risk measures availabe are:
Parameters:[¶](https://riskfolio-lib.readthedocs.io/en/latest/risk.html#RiskFunctions.Sharpe-parameters "Permalink to this headline")
returns : DataFrame or nd-array of shape (n\_samples, n\_features)[¶](https://riskfolio-lib.readthedocs.io/en/latest/risk.html#RiskFunctions.Sharpe.returns "Permalink to this definition")
Features matrix, where n\_samples is the number of samples and n\_features is the number of features.
w : DataFrame or 1d-array of shape (n\_assets, 1)[¶](https://riskfolio-lib.readthedocs.io/en/latest/risk.html#RiskFunctions.Sharpe.w "Permalink to this definition")
Weights matrix, where n\_assets is the number of assets.
mu : DataFrame or nd-array of shape (1, n\_assets)[¶](https://riskfolio-lib.readthedocs.io/en/latest/risk.html#RiskFunctions.Sharpe.mu "Permalink to this definition")
Vector of expected returns, where n\_assets is the number of assets.
cov : DataFrame of shape (n\_assets, n\_assets)[¶](https://riskfolio-lib.readthedocs.io/en/latest/risk.html#RiskFunctions.Sharpe.cov "Permalink to this definition")
Covariance matrix, where n\_assets is the number of assets.
rm : [str](https://docs.python.org/3.11/library/stdtypes.html#str "(in Python v3.11)")
, optional[¶](https://riskfolio-lib.readthedocs.io/en/latest/risk.html#RiskFunctions.Sharpe.rm "Permalink to this definition")
Risk measure used in the denominator of the ratio. The default is ‘MV’. Possible values are:
* ’MV’: Standard Deviation.
* ’KT’: Square Root Kurtosis.
* ’MAD’: Mean Absolute Deviation.
* ’GMD’: Gini Mean Difference.
* ’MSV’: Semi Standard Deviation.
* ’SKT’: Square Root Semi Kurtosis.
* ’FLPM’: First Lower Partial Moment (Omega Ratio).
* ’SLPM’: Second Lower Partial Moment (Sortino Ratio).
* ’VaR’: Value at Risk.
* ’CVaR’: Conditional Value at Risk.
* ’TG’: Tail Gini.
* ’EVaR’: Entropic Value at Risk.
* ’RLVaR’: Relativistic Value at Risk. I recommend only use this function with MOSEK solver.
* ’WR’: Worst Realization (Minimax).
* ’RG’: Range of returns.
* ’VRG’ VaR range of returns.
* ’CVRG’: CVaR range of returns.
* ’TGRG’: Tail Gini range of returns.
* ’EVRG’: EVaR range of returns.
* ’RVRG’: RLVaR range of returns. I recommend only use this function with MOSEK solver.
* ’MDD’: Maximum Drawdown of uncompounded cumulative returns (Calmar Ratio).
* ’ADD’: Average Drawdown of uncompounded cumulative returns.
* ’DaR’: Drawdown at Risk of uncompounded cumulative returns.
* ’CDaR’: Conditional Drawdown at Risk of uncompounded cumulative returns.
* ’EDaR’: Entropic Drawdown at Risk of uncompounded cumulative returns.
* ’RLDaR’: Relativistic Drawdown at Risk of uncompounded cumulative returns. I recommend only use this function with MOSEK solver.
* ’UCI’: Ulcer Index of uncompounded cumulative returns.
* ’MDD\_Rel’: Maximum Drawdown of compounded cumulative returns (Calmar Ratio).
* ’ADD\_Rel’: Average Drawdown of compounded cumulative returns.
* ’DaR\_Rel’: Drawdown at Risk of compounded cumulative returns.
* ’CDaR\_Rel’: Conditional Drawdown at Risk of compounded cumulative returns.
* ’EDaR\_Rel’: Entropic Drawdown at Risk of compounded cumulative returns.
* ’RLDaR\_Rel’: Relativistic Drawdown at Risk of compounded cumulative returns. I recommend only use this function with MOSEK solver.
* ’UCI\_Rel’: Ulcer Index of compounded cumulative returns.
rf : [float](https://docs.python.org/3.11/library/functions.html#float "(in Python v3.11)")
, optional[¶](https://riskfolio-lib.readthedocs.io/en/latest/risk.html#RiskFunctions.Sharpe.rf "Permalink to this definition")
Risk free rate. The default is 0.
alpha : [float](https://docs.python.org/3.11/library/functions.html#float "(in Python v3.11)")
, optional[¶](https://riskfolio-lib.readthedocs.io/en/latest/risk.html#RiskFunctions.Sharpe.alpha "Permalink to this definition")
Significance level of VaR, CVaR, EVaR, RLVaR, DaR, CDaR, EDaR, RLDaR and Tail Gini of losses. The default is 0.05.
a\_sim : [float](https://docs.python.org/3.11/library/functions.html#float "(in Python v3.11)")
, optional[¶](https://riskfolio-lib.readthedocs.io/en/latest/risk.html#RiskFunctions.Sharpe.a_sim "Permalink to this definition")
Number of CVaRs used to approximate Tail Gini of losses. The default is 100.
beta : [float](https://docs.python.org/3.11/library/functions.html#float "(in Python v3.11)")
, optional[¶](https://riskfolio-lib.readthedocs.io/en/latest/risk.html#RiskFunctions.Sharpe.beta "Permalink to this definition")
Significance level of CVaR and Tail Gini of gains. If None it duplicates alpha value. The default is None.
b\_sim : [float](https://docs.python.org/3.11/library/functions.html#float "(in Python v3.11)")
, optional[¶](https://riskfolio-lib.readthedocs.io/en/latest/risk.html#RiskFunctions.Sharpe.b_sim "Permalink to this definition")
Number of CVaRs used to approximate Tail Gini of gains. If None it duplicates a\_sim value. The default is None.
kappa : [float](https://docs.python.org/3.11/library/functions.html#float "(in Python v3.11)")
, optional[¶](https://riskfolio-lib.readthedocs.io/en/latest/risk.html#RiskFunctions.Sharpe.kappa "Permalink to this definition")
Deformation parameter of RLVaR and RLDaR for losses, must be between 0 and 1. The default is 0.3.
kappa\_g : [float](https://docs.python.org/3.11/library/functions.html#float "(in Python v3.11)")
, optional[¶](https://riskfolio-lib.readthedocs.io/en/latest/risk.html#RiskFunctions.Sharpe.kappa_g "Permalink to this definition")
Deformation parameter of RLVaR and RLDaR for gains, must be between 0 and 1. The default is None.
solver : [str](https://docs.python.org/3.11/library/stdtypes.html#str "(in Python v3.11)")
, optional[¶](https://riskfolio-lib.readthedocs.io/en/latest/risk.html#RiskFunctions.Sharpe.solver "Permalink to this definition")
Solver available for CVXPY that supports power cone programming. Used to calculate RLVaR and RLDaR. The default value is None.
Raises:[¶](https://riskfolio-lib.readthedocs.io/en/latest/risk.html#RiskFunctions.Sharpe-raises "Permalink to this headline")
[**ValueError**](https://docs.python.org/3.11/library/exceptions.html#ValueError "(in Python v3.11)")
– When the value cannot be calculated.
Returns:[¶](https://riskfolio-lib.readthedocs.io/en/latest/risk.html#RiskFunctions.Sharpe-returns "Permalink to this headline")
**value** – Risk adjusted return ratio of X.
Return type:[¶](https://riskfolio-lib.readthedocs.io/en/latest/risk.html#RiskFunctions.Sharpe-return-type "Permalink to this headline")
[float](https://docs.python.org/3.11/library/functions.html#float "(in Python v3.11)")
RiskFunctions.Risk\_Contribution(_[w](https://riskfolio-lib.readthedocs.io/en/latest/risk.html#RiskFunctions.Risk_Contribution.w "RiskFunctions.Risk_Contribution.w (Python parameter) — Portfolio weights, where n_assets is the number of assets.")
_, _[returns](https://riskfolio-lib.readthedocs.io/en/latest/risk.html#RiskFunctions.Risk_Contribution.returns "RiskFunctions.Risk_Contribution.returns (Python parameter) — Features matrix, where n_samples is the number of samples and n_features is the number of features.")
_, _[cov](https://riskfolio-lib.readthedocs.io/en/latest/risk.html#RiskFunctions.Risk_Contribution.cov "RiskFunctions.Risk_Contribution.cov (Python parameter) — Covariance matrix, where n_assets is the number of assets.")
\=`None`_, _[rm](https://riskfolio-lib.readthedocs.io/en/latest/risk.html#RiskFunctions.Risk_Contribution.rm "RiskFunctions.Risk_Contribution.rm (Python parameter) — Risk measure used in the denominator of the ratio.")
\=`'MV'`_, _[rf](https://riskfolio-lib.readthedocs.io/en/latest/risk.html#RiskFunctions.Risk_Contribution.rf "RiskFunctions.Risk_Contribution.rf (Python parameter) — Risk free rate.")
\=`0`_, _[alpha](https://riskfolio-lib.readthedocs.io/en/latest/risk.html#RiskFunctions.Risk_Contribution.alpha "RiskFunctions.Risk_Contribution.alpha (Python parameter) — Significance level of VaR, CVaR, EVaR, RLVaR, DaR, CDaR, EDaR, RLDaR and Tail Gini of losses. The default is 0.05.")
\=`0.05`_, _[a\_sim](https://riskfolio-lib.readthedocs.io/en/latest/risk.html#RiskFunctions.Risk_Contribution.a_sim "RiskFunctions.Risk_Contribution.a_sim (Python parameter) — Number of CVaRs used to approximate Tail Gini of losses.")
\=`100`_, _[beta](https://riskfolio-lib.readthedocs.io/en/latest/risk.html#RiskFunctions.Risk_Contribution.beta "RiskFunctions.Risk_Contribution.beta (Python parameter) — Significance level of CVaR and Tail Gini of gains.")
\=`None`_, _[b\_sim](https://riskfolio-lib.readthedocs.io/en/latest/risk.html#RiskFunctions.Risk_Contribution.b_sim "RiskFunctions.Risk_Contribution.b_sim (Python parameter) — Number of CVaRs used to approximate Tail Gini of gains.")
\=`None`_, _[kappa](https://riskfolio-lib.readthedocs.io/en/latest/risk.html#RiskFunctions.Risk_Contribution.kappa "RiskFunctions.Risk_Contribution.kappa (Python parameter) — Deformation parameter of RLVaR and RLDaR for losses, must be between 0 and 1. The default is 0.3.")
\=`0.3`_, _[kappa\_g](https://riskfolio-lib.readthedocs.io/en/latest/risk.html#RiskFunctions.Risk_Contribution.kappa_g "RiskFunctions.Risk_Contribution.kappa_g (Python parameter) — Deformation parameter of RLVaR and RLDaR for gains, must be between 0 and 1. The default is None.")
\=`None`_, _[solver](https://riskfolio-lib.readthedocs.io/en/latest/risk.html#RiskFunctions.Risk_Contribution.solver "RiskFunctions.Risk_Contribution.solver (Python parameter) — Solver available for CVXPY that supports power cone programming.")
\=`'CLARABEL'`_)[\[source\]](https://riskfolio-lib.readthedocs.io/en/latest/_modules/RiskFunctions.html#Risk_Contribution)
[¶](https://riskfolio-lib.readthedocs.io/en/latest/risk.html#RiskFunctions.Risk_Contribution "Link to this definition")
Calculate the risk contribution for each asset based on the selected risk measure.
Parameters:[¶](https://riskfolio-lib.readthedocs.io/en/latest/risk.html#RiskFunctions.Risk_Contribution-parameters "Permalink to this headline")
w : DataFrame or Series of shape (n\_assets, 1)[¶](https://riskfolio-lib.readthedocs.io/en/latest/risk.html#RiskFunctions.Risk_Contribution.w "Permalink to this definition")
Portfolio weights, where n\_assets is the number of assets.
returns : DataFrame or nd-array of shape (n\_samples, n\_features)[¶](https://riskfolio-lib.readthedocs.io/en/latest/risk.html#RiskFunctions.Risk_Contribution.returns "Permalink to this definition")
Features matrix, where n\_samples is the number of samples and n\_features is the number of features.
cov : DataFrame of shape (n\_assets, n\_assets)[¶](https://riskfolio-lib.readthedocs.io/en/latest/risk.html#RiskFunctions.Risk_Contribution.cov "Permalink to this definition")
Covariance matrix, where n\_assets is the number of assets.
rm : [str](https://docs.python.org/3.11/library/stdtypes.html#str "(in Python v3.11)")
, optional[¶](https://riskfolio-lib.readthedocs.io/en/latest/risk.html#RiskFunctions.Risk_Contribution.rm "Permalink to this definition")
Risk measure used in the denominator of the ratio. The default is ‘MV’. Possible values are:
* ’MV’: Standard Deviation.
* ’KT’: Square Root Kurtosis.
* ’MAD’: Mean Absolute Deviation.
* ’GMD’: Gini Mean Difference.
* ’MSV’: Semi Standard Deviation.
* ’SKT’: Square Root Semi Kurtosis.
* ’FLPM’: First Lower Partial Moment (Omega Ratio).
* ’SLPM’: Second Lower Partial Moment (Sortino Ratio).
* ’VaR’: Value at Risk.
* ’CVaR’: Conditional Value at Risk.
* ’TG’: Tail Gini.
* ’EVaR’: Entropic Value at Risk.
* ’RLVaR’: Relativistic Value at Risk. I recommend only use this function with MOSEK solver.
* ’WR’: Worst Realization (Minimax).
* ’RG’: Range of returns.
* ’VRG’ VaR range of returns.
* ’CVRG’: CVaR range of returns.
* ’TGRG’: Tail Gini range of returns.
* ’EVRG’: EVaR range of returns.
* ’RVRG’: RLVaR range of returns. I recommend only use this function with MOSEK solver.
* ’MDD’: Maximum Drawdown of uncompounded cumulative returns (Calmar Ratio).
* ’ADD’: Average Drawdown of uncompounded cumulative returns.
* ’DaR’: Drawdown at Risk of uncompounded cumulative returns.
* ’CDaR’: Conditional Drawdown at Risk of uncompounded cumulative returns.
* ’EDaR’: Entropic Drawdown at Risk of uncompounded cumulative returns.
* ’RLDaR’: Relativistic Drawdown at Risk of uncompounded cumulative returns. I recommend only use this function with MOSEK solver.
* ’UCI’: Ulcer Index of uncompounded cumulative returns.
* ’MDD\_Rel’: Maximum Drawdown of compounded cumulative returns (Calmar Ratio).
* ’ADD\_Rel’: Average Drawdown of compounded cumulative returns.
* ’CDaR\_Rel’: Conditional Drawdown at Risk of compounded cumulative returns.
* ’EDaR\_Rel’: Entropic Drawdown at Risk of compounded cumulative returns.
* ’RLDaR\_Rel’: Relativistic Drawdown at Risk of compounded cumulative returns. I recommend only use this function with MOSEK solver.
* ’UCI\_Rel’: Ulcer Index of compounded cumulative returns.
rf : [float](https://docs.python.org/3.11/library/functions.html#float "(in Python v3.11)")
, optional[¶](https://riskfolio-lib.readthedocs.io/en/latest/risk.html#RiskFunctions.Risk_Contribution.rf "Permalink to this definition")
Risk free rate. The default is 0.
alpha : [float](https://docs.python.org/3.11/library/functions.html#float "(in Python v3.11)")
, optional[¶](https://riskfolio-lib.readthedocs.io/en/latest/risk.html#RiskFunctions.Risk_Contribution.alpha "Permalink to this definition")
Significance level of VaR, CVaR, EVaR, RLVaR, DaR, CDaR, EDaR, RLDaR and Tail Gini of losses. The default is 0.05.
a\_sim : [float](https://docs.python.org/3.11/library/functions.html#float "(in Python v3.11)")
, optional[¶](https://riskfolio-lib.readthedocs.io/en/latest/risk.html#RiskFunctions.Risk_Contribution.a_sim "Permalink to this definition")
Number of CVaRs used to approximate Tail Gini of losses. The default is 100.
beta : [float](https://docs.python.org/3.11/library/functions.html#float "(in Python v3.11)")
, optional[¶](https://riskfolio-lib.readthedocs.io/en/latest/risk.html#RiskFunctions.Risk_Contribution.beta "Permalink to this definition")
Significance level of CVaR and Tail Gini of gains. If None it duplicates alpha value. The default is None.
b\_sim : [float](https://docs.python.org/3.11/library/functions.html#float "(in Python v3.11)")
, optional[¶](https://riskfolio-lib.readthedocs.io/en/latest/risk.html#RiskFunctions.Risk_Contribution.b_sim "Permalink to this definition")
Number of CVaRs used to approximate Tail Gini of gains. If None it duplicates a\_sim value. The default is None.
kappa : [float](https://docs.python.org/3.11/library/functions.html#float "(in Python v3.11)")
, optional[¶](https://riskfolio-lib.readthedocs.io/en/latest/risk.html#RiskFunctions.Risk_Contribution.kappa "Permalink to this definition")
Deformation parameter of RLVaR and RLDaR for losses, must be between 0 and 1. The default is 0.3.
kappa\_g : [float](https://docs.python.org/3.11/library/functions.html#float "(in Python v3.11)")
, optional[¶](https://riskfolio-lib.readthedocs.io/en/latest/risk.html#RiskFunctions.Risk_Contribution.kappa_g "Permalink to this definition")
Deformation parameter of RLVaR and RLDaR for gains, must be between 0 and 1. The default is None.
solver : [str](https://docs.python.org/3.11/library/stdtypes.html#str "(in Python v3.11)")
, optional[¶](https://riskfolio-lib.readthedocs.io/en/latest/risk.html#RiskFunctions.Risk_Contribution.solver "Permalink to this definition")
Solver available for CVXPY that supports power cone programming. Used to calculate RLVaR and RLDaR. The default value is None.
Raises:[¶](https://riskfolio-lib.readthedocs.io/en/latest/risk.html#RiskFunctions.Risk_Contribution-raises "Permalink to this headline")
[**ValueError**](https://docs.python.org/3.11/library/exceptions.html#ValueError "(in Python v3.11)")
– When the value cannot be calculated.
Returns:[¶](https://riskfolio-lib.readthedocs.io/en/latest/risk.html#RiskFunctions.Risk_Contribution-returns "Permalink to this headline")
**value** – Risk measure of the portfolio.
Return type:[¶](https://riskfolio-lib.readthedocs.io/en/latest/risk.html#RiskFunctions.Risk_Contribution-return-type "Permalink to this headline")
[float](https://docs.python.org/3.11/library/functions.html#float "(in Python v3.11)")
RiskFunctions.Risk\_Margin(_[w](https://riskfolio-lib.readthedocs.io/en/latest/risk.html#RiskFunctions.Risk_Margin.w "RiskFunctions.Risk_Margin.w (Python parameter) — Portfolio weights, where n_assets is the number of assets.")
_, _[returns](https://riskfolio-lib.readthedocs.io/en/latest/risk.html#RiskFunctions.Risk_Margin.returns "RiskFunctions.Risk_Margin.returns (Python parameter) — Features matrix, where n_samples is the number of samples and n_features is the number of features.")
_, _[cov](https://riskfolio-lib.readthedocs.io/en/latest/risk.html#RiskFunctions.Risk_Margin.cov "RiskFunctions.Risk_Margin.cov (Python parameter) — Covariance matrix, where n_assets is the number of assets.")
\=`None`_, _[rm](https://riskfolio-lib.readthedocs.io/en/latest/risk.html#RiskFunctions.Risk_Margin.rm "RiskFunctions.Risk_Margin.rm (Python parameter) — Risk measure used in the denominator of the ratio.")
\=`'MV'`_, _[rf](https://riskfolio-lib.readthedocs.io/en/latest/risk.html#RiskFunctions.Risk_Margin.rf "RiskFunctions.Risk_Margin.rf (Python parameter) — Risk free rate.")
\=`0`_, _[alpha](https://riskfolio-lib.readthedocs.io/en/latest/risk.html#RiskFunctions.Risk_Margin.alpha "RiskFunctions.Risk_Margin.alpha (Python parameter) — Significance level of VaR, CVaR, EVaR, RLVaR, DaR, CDaR, EDaR, RLDaR and Tail Gini of losses.")
\=`0.05`_, _[a\_sim](https://riskfolio-lib.readthedocs.io/en/latest/risk.html#RiskFunctions.Risk_Margin.a_sim "RiskFunctions.Risk_Margin.a_sim (Python parameter) — Number of CVaRs used to approximate Tail Gini of losses.")
\=`100`_, _[beta](https://riskfolio-lib.readthedocs.io/en/latest/risk.html#RiskFunctions.Risk_Margin.beta "RiskFunctions.Risk_Margin.beta (Python parameter) — Significance level of VaR, CVaR, Tail Gini, EVaR and RLVaR of gains.")
\=`None`_, _[b\_sim](https://riskfolio-lib.readthedocs.io/en/latest/risk.html#RiskFunctions.Risk_Margin.b_sim "RiskFunctions.Risk_Margin.b_sim (Python parameter) — Number of CVaRs used to approximate Tail Gini of gains.")
\=`None`_, _[kappa](https://riskfolio-lib.readthedocs.io/en/latest/risk.html#RiskFunctions.Risk_Margin.kappa "RiskFunctions.Risk_Margin.kappa (Python parameter) — Deformation parameter of RLVaR and RLDaR for losses, must be between 0 and 1. The default is 0.3.")
\=`0.3`_, _[kappa\_g](https://riskfolio-lib.readthedocs.io/en/latest/risk.html#RiskFunctions.Risk_Margin.kappa_g "RiskFunctions.Risk_Margin.kappa_g (Python parameter) — Deformation parameter of RLVaR and RLDaR for gains, must be between 0 and 1. The default is None.")
\=`None`_, _[solver](https://riskfolio-lib.readthedocs.io/en/latest/risk.html#RiskFunctions.Risk_Margin.solver "RiskFunctions.Risk_Margin.solver (Python parameter) — Solver available for CVXPY that supports exponential and power cone programming.")
\=`'CLARABEL'`_)[\[source\]](https://riskfolio-lib.readthedocs.io/en/latest/_modules/RiskFunctions.html#Risk_Margin)
[¶](https://riskfolio-lib.readthedocs.io/en/latest/risk.html#RiskFunctions.Risk_Margin "Link to this definition")
Calculate the risk margin for each asset based on the risk measure selected.
Parameters:[¶](https://riskfolio-lib.readthedocs.io/en/latest/risk.html#RiskFunctions.Risk_Margin-parameters "Permalink to this headline")
w : DataFrame or Series of shape (n\_assets, 1)[¶](https://riskfolio-lib.readthedocs.io/en/latest/risk.html#RiskFunctions.Risk_Margin.w "Permalink to this definition")
Portfolio weights, where n\_assets is the number of assets.
returns : DataFrame or nd-array of shape (n\_samples, n\_features)[¶](https://riskfolio-lib.readthedocs.io/en/latest/risk.html#RiskFunctions.Risk_Margin.returns "Permalink to this definition")
Features matrix, where n\_samples is the number of samples and n\_features is the number of features.
cov : DataFrame of shape (n\_assets, n\_assets)[¶](https://riskfolio-lib.readthedocs.io/en/latest/risk.html#RiskFunctions.Risk_Margin.cov "Permalink to this definition")
Covariance matrix, where n\_assets is the number of assets.
rm : [str](https://docs.python.org/3.11/library/stdtypes.html#str "(in Python v3.11)")
, optional[¶](https://riskfolio-lib.readthedocs.io/en/latest/risk.html#RiskFunctions.Risk_Margin.rm "Permalink to this definition")
Risk measure used in the denominator of the ratio. The default is ‘MV’. Possible values are:
* ’MV’: Standard Deviation.
* ’KT’: Square Root Kurtosis.
* ’MAD’: Mean Absolute Deviation.
* ’GMD’: Gini Mean Difference.
* ’MSV’: Semi Standard Deviation.
* ’SKT’: Square Root Semi Kurtosis.
* ’FLPM’: First Lower Partial Moment (Omega Ratio).
* ’SLPM’: Second Lower Partial Moment (Sortino Ratio).
* ’VaR’: Value at Risk.
* ’CVaR’: Conditional Value at Risk.
* ’TG’: Tail Gini.
* ’EVaR’: Entropic Value at Risk.
* ’RLVaR’: Relativistic Value at Risk. I recommend only use this function with MOSEK solver.
* ’WR’: Worst Realization (Minimax).
* ’RG’: Range of returns.
* ’VRG’ VaR range of returns.
* ’CVRG’: CVaR range of returns.
* ’TGRG’: Tail Gini range of returns.
* ’EVRG’: EVaR range of returns.
* ’RVRG’: RLVaR range of returns.
* ’MDD’: Maximum Drawdown of uncompounded cumulative returns (Calmar Ratio).
* ’ADD’: Average Drawdown of uncompounded cumulative returns.
* ’DaR’: Drawdown at Risk of uncompounded cumulative returns.
* ’CDaR’: Conditional Drawdown at Risk of uncompounded cumulative returns.
* ’EDaR’: Entropic Drawdown at Risk of uncompounded cumulative returns.
* ’RLDaR’: Relativistic Drawdown at Risk of uncompounded cumulative returns. I recommend only use this function with MOSEK solver.
* ’UCI’: Ulcer Index of uncompounded cumulative returns.
* ’MDD\_Rel’: Maximum Drawdown of compounded cumulative returns (Calmar Ratio).
* ’ADD\_Rel’: Average Drawdown of compounded cumulative returns.
* ’CDaR\_Rel’: Conditional Drawdown at Risk of compounded cumulative returns.
* ’EDaR\_Rel’: Entropic Drawdown at Risk of compounded cumulative returns.
* ’RLDaR\_Rel’: Relativistic Drawdown at Risk of compounded cumulative returns. I recommend only use this function with MOSEK solver.
* ’UCI\_Rel’: Ulcer Index of compounded cumulative returns.
rf : [float](https://docs.python.org/3.11/library/functions.html#float "(in Python v3.11)")
, optional[¶](https://riskfolio-lib.readthedocs.io/en/latest/risk.html#RiskFunctions.Risk_Margin.rf "Permalink to this definition")
Risk free rate. The default is 0.
alpha : [float](https://docs.python.org/3.11/library/functions.html#float "(in Python v3.11)")
, optional[¶](https://riskfolio-lib.readthedocs.io/en/latest/risk.html#RiskFunctions.Risk_Margin.alpha "Permalink to this definition")
Significance level of VaR, CVaR, EVaR, RLVaR, DaR, CDaR, EDaR, RLDaR and Tail Gini of losses. The default is 0.05.
a\_sim : [float](https://docs.python.org/3.11/library/functions.html#float "(in Python v3.11)")
, optional[¶](https://riskfolio-lib.readthedocs.io/en/latest/risk.html#RiskFunctions.Risk_Margin.a_sim "Permalink to this definition")
Number of CVaRs used to approximate Tail Gini of losses. The default is 100.
beta : [float](https://docs.python.org/3.11/library/functions.html#float "(in Python v3.11)")
, optional[¶](https://riskfolio-lib.readthedocs.io/en/latest/risk.html#RiskFunctions.Risk_Margin.beta "Permalink to this definition")
Significance level of VaR, CVaR, Tail Gini, EVaR and RLVaR of gains. If None it duplicates alpha value. The default is None.
b\_sim : [float](https://docs.python.org/3.11/library/functions.html#float "(in Python v3.11)")
, optional[¶](https://riskfolio-lib.readthedocs.io/en/latest/risk.html#RiskFunctions.Risk_Margin.b_sim "Permalink to this definition")
Number of CVaRs used to approximate Tail Gini of gains. If None it duplicates a\_sim value. The default is None.
kappa : [float](https://docs.python.org/3.11/library/functions.html#float "(in Python v3.11)")
, optional[¶](https://riskfolio-lib.readthedocs.io/en/latest/risk.html#RiskFunctions.Risk_Margin.kappa "Permalink to this definition")
Deformation parameter of RLVaR and RLDaR for losses, must be between 0 and 1. The default is 0.3.
kappa\_g : [float](https://docs.python.org/3.11/library/functions.html#float "(in Python v3.11)")
, optional[¶](https://riskfolio-lib.readthedocs.io/en/latest/risk.html#RiskFunctions.Risk_Margin.kappa_g "Permalink to this definition")
Deformation parameter of RLVaR and RLDaR for gains, must be between 0 and 1. The default is None.
solver : [str](https://docs.python.org/3.11/library/stdtypes.html#str "(in Python v3.11)")
, optional[¶](https://riskfolio-lib.readthedocs.io/en/latest/risk.html#RiskFunctions.Risk_Margin.solver "Permalink to this definition")
Solver available for CVXPY that supports exponential and power cone programming. Used to calculate EVaR, EVRG, EDaR, RLVaR, RVRG and RLDaR. The default value is None.
Raises:[¶](https://riskfolio-lib.readthedocs.io/en/latest/risk.html#RiskFunctions.Risk_Margin-raises "Permalink to this headline")
[**ValueError**](https://docs.python.org/3.11/library/exceptions.html#ValueError "(in Python v3.11)")
– When the value cannot be calculated.
Returns:[¶](https://riskfolio-lib.readthedocs.io/en/latest/risk.html#RiskFunctions.Risk_Margin-returns "Permalink to this headline")
**value** – Risk margin of the portfolio.
Return type:[¶](https://riskfolio-lib.readthedocs.io/en/latest/risk.html#RiskFunctions.Risk_Margin-return-type "Permalink to this headline")
[float](https://docs.python.org/3.11/library/functions.html#float "(in Python v3.11)")
RiskFunctions.Factors\_Risk\_Contribution(_[w](https://riskfolio-lib.readthedocs.io/en/latest/risk.html#RiskFunctions.Factors_Risk_Contribution.w "RiskFunctions.Factors_Risk_Contribution.w (Python parameter) — Portfolio weights, where n_assets is the number of assets.")
_, _[returns](https://riskfolio-lib.readthedocs.io/en/latest/risk.html#RiskFunctions.Factors_Risk_Contribution.returns "RiskFunctions.Factors_Risk_Contribution.returns (Python parameter) — Features matrix, where n_samples is the number of samples and n_features is the number of features.")
_, _[factors](https://riskfolio-lib.readthedocs.io/en/latest/risk.html#RiskFunctions.Factors_Risk_Contribution.factors "RiskFunctions.Factors_Risk_Contribution.factors (Python parameter) — Factors matrix, where n_samples is the number of samples and n_factors is the number of factors.")
_, _[cov](https://riskfolio-lib.readthedocs.io/en/latest/risk.html#RiskFunctions.Factors_Risk_Contribution.cov "RiskFunctions.Factors_Risk_Contribution.cov (Python parameter) — Covariance matrix, where n_assets is the number of assets.")
\=`None`_, _[B](https://riskfolio-lib.readthedocs.io/en/latest/risk.html#RiskFunctions.Factors_Risk_Contribution.B "RiskFunctions.Factors_Risk_Contribution.B (Python parameter) — Loadings matrix, where n_assets is the number assets and n_factors is the number of risk factors.")
\=`None`_, _[const](https://riskfolio-lib.readthedocs.io/en/latest/risk.html#RiskFunctions.Factors_Risk_Contribution.const "RiskFunctions.Factors_Risk_Contribution.const (Python parameter) — Indicate if the loadings matrix has a constant. The default is False.")
\=`False`_, _[rm](https://riskfolio-lib.readthedocs.io/en/latest/risk.html#RiskFunctions.Factors_Risk_Contribution.rm "RiskFunctions.Factors_Risk_Contribution.rm (Python parameter) — Risk measure used in the denominator of the ratio.")
\=`'MV'`_, _[rf](https://riskfolio-lib.readthedocs.io/en/latest/risk.html#RiskFunctions.Factors_Risk_Contribution.rf "RiskFunctions.Factors_Risk_Contribution.rf (Python parameter) — Risk free rate.")
\=`0`_, _[alpha](https://riskfolio-lib.readthedocs.io/en/latest/risk.html#RiskFunctions.Factors_Risk_Contribution.alpha "RiskFunctions.Factors_Risk_Contribution.alpha (Python parameter) — Significance level of VaR, CVaR, EVaR, RLVaR, DaR, CDaR, EDaR, RLDaR and Tail Gini of losses. The default is 0.05.")
\=`0.05`_, _[a\_sim](https://riskfolio-lib.readthedocs.io/en/latest/risk.html#RiskFunctions.Factors_Risk_Contribution.a_sim "RiskFunctions.Factors_Risk_Contribution.a_sim (Python parameter) — Number of CVaRs used to approximate Tail Gini of losses.")
\=`100`_, _[beta](https://riskfolio-lib.readthedocs.io/en/latest/risk.html#RiskFunctions.Factors_Risk_Contribution.beta "RiskFunctions.Factors_Risk_Contribution.beta (Python parameter) — Significance level of CVaR and Tail Gini of gains.")
\=`None`_, _[b\_sim](https://riskfolio-lib.readthedocs.io/en/latest/risk.html#RiskFunctions.Factors_Risk_Contribution.b_sim "RiskFunctions.Factors_Risk_Contribution.b_sim (Python parameter) — Number of CVaRs used to approximate Tail Gini of gains.")
\=`None`_, _[kappa](https://riskfolio-lib.readthedocs.io/en/latest/risk.html#RiskFunctions.Factors_Risk_Contribution.kappa "RiskFunctions.Factors_Risk_Contribution.kappa (Python parameter) — Deformation parameter of RLVaR and RLDaR for losses, must be between 0 and 1. The default is 0.3.")
\=`0.3`_, _[kappa\_g](https://riskfolio-lib.readthedocs.io/en/latest/risk.html#RiskFunctions.Factors_Risk_Contribution.kappa_g "RiskFunctions.Factors_Risk_Contribution.kappa_g (Python parameter) — Deformation parameter of RLVaR and RLDaR for gains, must be between 0 and 1. The default is None.")
\=`None`_, _[solver](https://riskfolio-lib.readthedocs.io/en/latest/risk.html#RiskFunctions.Factors_Risk_Contribution.solver "RiskFunctions.Factors_Risk_Contribution.solver (Python parameter) — Solver available for CVXPY that supports power cone programming.")
\=`'CLARABEL'`_, _[feature\_selection](https://riskfolio-lib.readthedocs.io/en/latest/risk.html#RiskFunctions.Factors_Risk_Contribution.feature_selection "RiskFunctions.Factors_Risk_Contribution.feature_selection (Python parameter) — Indicate the method used to estimate the loadings matrix. The default is 'stepwise'.")
\=`'stepwise'`_, _[stepwise](https://riskfolio-lib.readthedocs.io/en/latest/risk.html#RiskFunctions.Factors_Risk_Contribution.stepwise "RiskFunctions.Factors_Risk_Contribution.stepwise (Python parameter) — Indicate the method used for stepwise regression. The default is 'Forward'.")
\=`'Forward'`_, _[criterion](https://riskfolio-lib.readthedocs.io/en/latest/risk.html#RiskFunctions.Factors_Risk_Contribution.criterion "RiskFunctions.Factors_Risk_Contribution.criterion (Python parameter) — The default is 'pvalue'.")
\=`'pvalue'`_, _[threshold](https://riskfolio-lib.readthedocs.io/en/latest/risk.html#RiskFunctions.Factors_Risk_Contribution.threshold "RiskFunctions.Factors_Risk_Contribution.threshold (Python parameter) — Is the maximum p-value for each variable that will be accepted in the model.")
\=`0.05`_, _[n\_components](https://riskfolio-lib.readthedocs.io/en/latest/risk.html#RiskFunctions.Factors_Risk_Contribution.n_components "RiskFunctions.Factors_Risk_Contribution.n_components (Python parameter) — if 1 < n_components (int), it represents the number of components that will be keep.")
\=`0.95`_)[\[source\]](https://riskfolio-lib.readthedocs.io/en/latest/_modules/RiskFunctions.html#Factors_Risk_Contribution)
[¶](https://riskfolio-lib.readthedocs.io/en/latest/risk.html#RiskFunctions.Factors_Risk_Contribution "Link to this definition")
Calculate the risk contribution for each factor based on the selected risk measure.
Parameters:[¶](https://riskfolio-lib.readthedocs.io/en/latest/risk.html#RiskFunctions.Factors_Risk_Contribution-parameters "Permalink to this headline")
w : DataFrame or Series of shape (n\_assets, 1)[¶](https://riskfolio-lib.readthedocs.io/en/latest/risk.html#RiskFunctions.Factors_Risk_Contribution.w "Permalink to this definition")
Portfolio weights, where n\_assets is the number of assets.
returns : DataFrame or nd-array of shape (n\_samples, n\_features)[¶](https://riskfolio-lib.readthedocs.io/en/latest/risk.html#RiskFunctions.Factors_Risk_Contribution.returns "Permalink to this definition")
Features matrix, where n\_samples is the number of samples and n\_features is the number of features.
factors : DataFrame or nd-array of shape (n\_samples, n\_factors)[¶](https://riskfolio-lib.readthedocs.io/en/latest/risk.html#RiskFunctions.Factors_Risk_Contribution.factors "Permalink to this definition")
Factors matrix, where n\_samples is the number of samples and n\_factors is the number of factors.
cov : DataFrame of shape (n\_assets, n\_assets)[¶](https://riskfolio-lib.readthedocs.io/en/latest/risk.html#RiskFunctions.Factors_Risk_Contribution.cov "Permalink to this definition")
Covariance matrix, where n\_assets is the number of assets.
B : DataFrame of shape (n\_assets, n\_factors), optional[¶](https://riskfolio-lib.readthedocs.io/en/latest/risk.html#RiskFunctions.Factors_Risk_Contribution.B "Permalink to this definition")
Loadings matrix, where n\_assets is the number assets and n\_factors is the number of risk factors. If is not specified, is estimated using stepwise regression. The default is None.
const : [bool](https://docs.python.org/3.11/library/functions.html#bool "(in Python v3.11)")
, optional[¶](https://riskfolio-lib.readthedocs.io/en/latest/risk.html#RiskFunctions.Factors_Risk_Contribution.const "Permalink to this definition")
Indicate if the loadings matrix has a constant. The default is False.
rm : [str](https://docs.python.org/3.11/library/stdtypes.html#str "(in Python v3.11)")
, optional[¶](https://riskfolio-lib.readthedocs.io/en/latest/risk.html#RiskFunctions.Factors_Risk_Contribution.rm "Permalink to this definition")
Risk measure used in the denominator of the ratio. The default is ‘MV’. Possible values are:
* ’MV’: Standard Deviation.
* ’KT’: Square Root Kurtosis.
* ’MAD’: Mean Absolute Deviation.
* ’GMD’: Gini Mean Difference.
* ’MSV’: Semi Standard Deviation.
* ’SKT’: Square Root Semi Kurtosis.
* ’FLPM’: First Lower Partial Moment (Omega Ratio).
* ’SLPM’: Second Lower Partial Moment (Sortino Ratio).
* ’VaR’: Value at Risk.
* ’CVaR’: Conditional Value at Risk.
* ’TG’: Tail Gini.
* ’EVaR’: Entropic Value at Risk.
* ’RLVaR’: Relativistic Value at Risk. I recommend only use this function with MOSEK solver.
* ’WR’: Worst Realization (Minimax).
* ’RG’: Range of returns.
* ’VRG’ VaR range of returns.
* ’CVRG’: CVaR range of returns.
* ’TGRG’: Tail Gini range of returns.
* ’EVRG’: EVaR range of returns.
* ’RVRG’: RLVaR range of returns. I recommend only use this function with MOSEK solver.
* ’MDD’: Maximum Drawdown of uncompounded cumulative returns (Calmar Ratio).
* ’ADD’: Average Drawdown of uncompounded cumulative returns.
* ’DaR’: Drawdown at Risk of uncompounded cumulative returns.
* ’CDaR’: Conditional Drawdown at Risk of uncompounded cumulative returns.
* ’EDaR’: Entropic Drawdown at Risk of uncompounded cumulative returns.
* ’RLDaR’: Relativistic Drawdown at Risk of uncompounded cumulative returns. I recommend only use this function with MOSEK solver.
* ’UCI’: Ulcer Index of uncompounded cumulative returns.
* ’MDD\_Rel’: Maximum Drawdown of compounded cumulative returns (Calmar Ratio).
* ’ADD\_Rel’: Average Drawdown of compounded cumulative returns.
* ’CDaR\_Rel’: Conditional Drawdown at Risk of compounded cumulative returns.
* ’EDaR\_Rel’: Entropic Drawdown at Risk of compounded cumulative returns.
* ’RLDaR\_Rel’: Relativistic Drawdown at Risk of compounded cumulative returns. I recommend only use this function with MOSEK solver.
* ’UCI\_Rel’: Ulcer Index of compounded cumulative returns.
rf : [float](https://docs.python.org/3.11/library/functions.html#float "(in Python v3.11)")
, optional[¶](https://riskfolio-lib.readthedocs.io/en/latest/risk.html#RiskFunctions.Factors_Risk_Contribution.rf "Permalink to this definition")
Risk free rate. The default is 0.
alpha : [float](https://docs.python.org/3.11/library/functions.html#float "(in Python v3.11)")
, optional[¶](https://riskfolio-lib.readthedocs.io/en/latest/risk.html#RiskFunctions.Factors_Risk_Contribution.alpha "Permalink to this definition")
Significance level of VaR, CVaR, EVaR, RLVaR, DaR, CDaR, EDaR, RLDaR and Tail Gini of losses. The default is 0.05.
a\_sim : [float](https://docs.python.org/3.11/library/functions.html#float "(in Python v3.11)")
, optional[¶](https://riskfolio-lib.readthedocs.io/en/latest/risk.html#RiskFunctions.Factors_Risk_Contribution.a_sim "Permalink to this definition")
Number of CVaRs used to approximate Tail Gini of losses. The default is 100.
beta : [float](https://docs.python.org/3.11/library/functions.html#float "(in Python v3.11)")
, optional[¶](https://riskfolio-lib.readthedocs.io/en/latest/risk.html#RiskFunctions.Factors_Risk_Contribution.beta "Permalink to this definition")
Significance level of CVaR and Tail Gini of gains. If None it duplicates alpha value. The default is None.
b\_sim : [float](https://docs.python.org/3.11/library/functions.html#float "(in Python v3.11)")
, optional[¶](https://riskfolio-lib.readthedocs.io/en/latest/risk.html#RiskFunctions.Factors_Risk_Contribution.b_sim "Permalink to this definition")
Number of CVaRs used to approximate Tail Gini of gains. If None it duplicates a\_sim value. The default is None.
kappa : [float](https://docs.python.org/3.11/library/functions.html#float "(in Python v3.11)")
, optional[¶](https://riskfolio-lib.readthedocs.io/en/latest/risk.html#RiskFunctions.Factors_Risk_Contribution.kappa "Permalink to this definition")
Deformation parameter of RLVaR and RLDaR for losses, must be between 0 and 1. The default is 0.3.
kappa\_g : [float](https://docs.python.org/3.11/library/functions.html#float "(in Python v3.11)")
, optional[¶](https://riskfolio-lib.readthedocs.io/en/latest/risk.html#RiskFunctions.Factors_Risk_Contribution.kappa_g "Permalink to this definition")
Deformation parameter of RLVaR and RLDaR for gains, must be between 0 and 1. The default is None.
solver : [str](https://docs.python.org/3.11/library/stdtypes.html#str "(in Python v3.11)")
, optional[¶](https://riskfolio-lib.readthedocs.io/en/latest/risk.html#RiskFunctions.Factors_Risk_Contribution.solver "Permalink to this definition")
Solver available for CVXPY that supports power cone programming. Used to calculate RLVaR and RLDaR. The default value is None.
feature\_selection : str 'stepwise' or 'PCR', optional[¶](https://riskfolio-lib.readthedocs.io/en/latest/risk.html#RiskFunctions.Factors_Risk_Contribution.feature_selection "Permalink to this definition")
Indicate the method used to estimate the loadings matrix. The default is ‘stepwise’.
stepwise : str 'Forward' or 'Backward', optional[¶](https://riskfolio-lib.readthedocs.io/en/latest/risk.html#RiskFunctions.Factors_Risk_Contribution.stepwise "Permalink to this definition")
Indicate the method used for stepwise regression. The default is ‘Forward’.
criterion : [str](https://docs.python.org/3.11/library/stdtypes.html#str "(in Python v3.11)")
, optional[¶](https://riskfolio-lib.readthedocs.io/en/latest/risk.html#RiskFunctions.Factors_Risk_Contribution.criterion "Permalink to this definition")
The default is ‘pvalue’. Possible values of the criterion used to select the best features are:
* ’pvalue’: select the features based on p-values.
* ’AIC’: select the features based on lowest Akaike Information Criterion.
* ’SIC’: select the features based on lowest Schwarz Information Criterion.
* ’R2’: select the features based on highest R Squared.
* ’R2\_A’: select the features based on highest Adjusted R Squared.
threshold : scalar, optional[¶](https://riskfolio-lib.readthedocs.io/en/latest/risk.html#RiskFunctions.Factors_Risk_Contribution.threshold "Permalink to this definition")
Is the maximum p-value for each variable that will be accepted in the model. The default is 0.05.
n\_components : [int](https://docs.python.org/3.11/library/functions.html#int "(in Python v3.11)")
, [float](https://docs.python.org/3.11/library/functions.html#float "(in Python v3.11)")
, None or [str](https://docs.python.org/3.11/library/stdtypes.html#str "(in Python v3.11)")
, optional[¶](https://riskfolio-lib.readthedocs.io/en/latest/risk.html#RiskFunctions.Factors_Risk_Contribution.n_components "Permalink to this definition")
if 1 < n\_components (int), it represents the number of components that will be keep. if 0 < n\_components < 1 (float), it represents the percentage of variance that the is explained by the components kept. See [PCA](https://scikit-learn.org/stable/modules/generated/sklearn.decomposition.PCA.html)
for more details. The default is 0.95.
Raises:[¶](https://riskfolio-lib.readthedocs.io/en/latest/risk.html#RiskFunctions.Factors_Risk_Contribution-raises "Permalink to this headline")
[**ValueError**](https://docs.python.org/3.11/library/exceptions.html#ValueError "(in Python v3.11)")
– When the value cannot be calculated.
Returns:[¶](https://riskfolio-lib.readthedocs.io/en/latest/risk.html#RiskFunctions.Factors_Risk_Contribution-returns "Permalink to this headline")
**value** – Risk measure of the portfolio.
Return type:[¶](https://riskfolio-lib.readthedocs.io/en/latest/risk.html#RiskFunctions.Factors_Risk_Contribution-return-type "Permalink to this headline")
[float](https://docs.python.org/3.11/library/functions.html#float "(in Python v3.11)")
RiskFunctions.BrinsonAttribution(_[prices](https://riskfolio-lib.readthedocs.io/en/latest/risk.html#RiskFunctions.BrinsonAttribution.prices "RiskFunctions.BrinsonAttribution.prices (Python parameter) — Assets prices DataFrame, where n_samples is the number of observations and n_assets is the number of assets.")
_, _[w](https://riskfolio-lib.readthedocs.io/en/latest/risk.html#RiskFunctions.BrinsonAttribution.w "RiskFunctions.BrinsonAttribution.w (Python parameter) — A portfolio specified by the user.")
_, _[wb](https://riskfolio-lib.readthedocs.io/en/latest/risk.html#RiskFunctions.BrinsonAttribution.wb "RiskFunctions.BrinsonAttribution.wb (Python parameter) — A benchmark specified by the user.")
_, _[start](https://riskfolio-lib.readthedocs.io/en/latest/risk.html#RiskFunctions.BrinsonAttribution.start "RiskFunctions.BrinsonAttribution.start (Python parameter) — Start date in format 'YYYY-MM-DD' specified by the user.")
_, _[end](https://riskfolio-lib.readthedocs.io/en/latest/risk.html#RiskFunctions.BrinsonAttribution.end "RiskFunctions.BrinsonAttribution.end (Python parameter) — End date in format 'YYYY-MM-DD' specified by the user.")
_, _[asset\_classes](https://riskfolio-lib.readthedocs.io/en/latest/risk.html#RiskFunctions.BrinsonAttribution.asset_classes "RiskFunctions.BrinsonAttribution.asset_classes (Python parameter) — Asset's classes DataFrame, where n_assets is the number of assets and n_cols is the number of columns of the DataFrame where the first column is the asset list and the next columns are the different asset's classes sets.")
_, _[classes\_col](https://riskfolio-lib.readthedocs.io/en/latest/risk.html#RiskFunctions.BrinsonAttribution.classes_col "RiskFunctions.BrinsonAttribution.classes_col (Python parameter) — If value is str, it is the column name of the set of classes from asset_classes dataframe.")
_, _[method](https://riskfolio-lib.readthedocs.io/en/latest/risk.html#RiskFunctions.BrinsonAttribution.method "RiskFunctions.BrinsonAttribution.method (Python parameter) — Method used to calculate the nearest start or end dates in case one of them is not in prices DataFrame.")
\=`'nearest'`_)[\[source\]](https://riskfolio-lib.readthedocs.io/en/latest/_modules/RiskFunctions.html#BrinsonAttribution)
[¶](https://riskfolio-lib.readthedocs.io/en/latest/risk.html#RiskFunctions.BrinsonAttribution "Link to this definition")
Creates a DataFrame with the Brinson Performance Attribution per class and aggregate based on \[[F1](https://riskfolio-lib.readthedocs.io/en/latest/risk.html#id92 "Gary P Brinson and Nimrod Fachler. Measuring non-US. equity portfolio performance. J. Portf. Manag., 11(3):73–76, 04 1985.")\
\].
Parameters:[¶](https://riskfolio-lib.readthedocs.io/en/latest/risk.html#RiskFunctions.BrinsonAttribution-parameters "Permalink to this headline")
prices : DataFrame of shape (n\_samples, n\_assets)[¶](https://riskfolio-lib.readthedocs.io/en/latest/risk.html#RiskFunctions.BrinsonAttribution.prices "Permalink to this definition")
Assets prices DataFrame, where n\_samples is the number of observations and n\_assets is the number of assets.
w : DataFrame or Series of shape (n\_assets, 1)[¶](https://riskfolio-lib.readthedocs.io/en/latest/risk.html#RiskFunctions.BrinsonAttribution.w "Permalink to this definition")
A portfolio specified by the user.
wb : DataFrame or Series of shape (n\_assets, 1)[¶](https://riskfolio-lib.readthedocs.io/en/latest/risk.html#RiskFunctions.BrinsonAttribution.wb "Permalink to this definition")
A benchmark specified by the user.
start : [str](https://docs.python.org/3.11/library/stdtypes.html#str "(in Python v3.11)")
[¶](https://riskfolio-lib.readthedocs.io/en/latest/risk.html#RiskFunctions.BrinsonAttribution.start "Permalink to this definition")
Start date in format ‘YYYY-MM-DD’ specified by the user.
end : [str](https://docs.python.org/3.11/library/stdtypes.html#str "(in Python v3.11)")
[¶](https://riskfolio-lib.readthedocs.io/en/latest/risk.html#RiskFunctions.BrinsonAttribution.end "Permalink to this definition")
End date in format ‘YYYY-MM-DD’ specified by the user.
asset\_classes : DataFrame of shape (n\_assets, n\_cols)[¶](https://riskfolio-lib.readthedocs.io/en/latest/risk.html#RiskFunctions.BrinsonAttribution.asset_classes "Permalink to this definition")
Asset’s classes DataFrame, where n\_assets is the number of assets and n\_cols is the number of columns of the DataFrame where the first column is the asset list and the next columns are the different asset’s classes sets. It is only used when kind value is ‘classes’. The default value is None.
classes\_col : [str](https://docs.python.org/3.11/library/stdtypes.html#str "(in Python v3.11)")
or [int](https://docs.python.org/3.11/library/functions.html#int "(in Python v3.11)")
[¶](https://riskfolio-lib.readthedocs.io/en/latest/risk.html#RiskFunctions.BrinsonAttribution.classes_col "Permalink to this definition")
If value is str, it is the column name of the set of classes from asset\_classes dataframe. If value is int, it is the column number of the set of classes from asset\_classes dataframe. The default value is None.
method : [str](https://docs.python.org/3.11/library/stdtypes.html#str "(in Python v3.11)")
[¶](https://riskfolio-lib.readthedocs.io/en/latest/risk.html#RiskFunctions.BrinsonAttribution.method "Permalink to this definition")
Method used to calculate the nearest start or end dates in case one of them is not in prices DataFrame. The default value is ‘nearest’. See [get\_indexer](https://pandas.pydata.org/docs/reference/api/pandas.Index.get_indexer.html#pandas.Index.get_indexer)
for more details.
Raises:[¶](https://riskfolio-lib.readthedocs.io/en/latest/risk.html#RiskFunctions.BrinsonAttribution-raises "Permalink to this headline")
[**ValueError**](https://docs.python.org/3.11/library/exceptions.html#ValueError "(in Python v3.11)")
– When the value cannot be calculated.
Returns:[¶](https://riskfolio-lib.readthedocs.io/en/latest/risk.html#RiskFunctions.BrinsonAttribution-returns "Permalink to this headline")
* **BrinAttr** (_DataFrame_) – A DataFrame with the Brinson Performance Attribution per class and aggregate.
* **(start\_, end\_)** (_tuple_) – Start and end dates calculated using get\_indexer method in string format.
Example
`BrinAttr, (start, end) = BrinsonAttribution( prices=data, w=w, wb=wb, start='2019-01-07', end='2019-12-06', asset_classes=asset_classes, classes_col='Industry', )`

Bibliography[¶](https://riskfolio-lib.readthedocs.io/en/latest/risk.html#bibliography "Link to this heading")
--------------------------------------------------------------------------------------------------------------
\[[F1](https://riskfolio-lib.readthedocs.io/en/latest/risk.html#id1)\
\]
Gary P Brinson and Nimrod Fachler. Measuring non-US. equity portfolio performance. _J. Portf. Manag._, 11(3):73–76, 04 1985.
[**On-Demand H100 SXM GPUs for $2.99/hr/GPU with Lambda** 640 GB of vRAM in one 8x instance **Launch now**](https://server.ethicalads.io/proxy/click/9837/019d0edd-c206-7461-96f3-a10da9851c4e/)
[Ads by EthicalAds](https://www.ethicalads.io/advertisers/topics/data-science/?ref=ea-text)
---
# DBHT, OWA Weights, Gerber Statistic, CPP and Auxiliary Functions - Riskfolio-Lib 7.2
[Skip to content](https://riskfolio-lib.readthedocs.io/en/latest/auxiliary.html#module-DBHT)
DBHT, OWA Weights, Gerber Statistic, CPP and Auxiliary Functions[¶](https://riskfolio-lib.readthedocs.io/en/latest/auxiliary.html#dbht-owa-weights-gerber-statistic-cpp-and-auxiliary-functions "Link to this heading")
========================================================================================================================================================================================================================
[Buy Advanced Portfolio Optimization Book on Springer](https://www.kqzyfj.com/click-101359873-15150084?url=https%3A%2F%2Flink.springer.com%2Fbook%2F9783031843037)
[Enroll in the Portfolio Optimization with Python Course](https://www.paypal.com/ncp/payment/GN55W4UQ7VAMN)
[](https://github.com/sponsors/dcajasn)
[](https://ko-fi.com/B0B833SXD)
The DBHT module has functions that allows us to use the Direct Bubble Hierarchical Tree (DBHT) \[[D1](https://riskfolio-lib.readthedocs.io/en/latest/auxiliary.html#id111 "Won-Min Song, T. Di Matteo, and Tomaso Aste. Hierarchical information clustering by means of topologically embedded graphs. PLOS ONE, 7(3):1-14, 03 2012. URL: https://doi.org/10.1371/journal.pone.0031929, doi:10.1371/journal.pone.0031929.")\
\], a new linkage method; and the j-LoGo \[[D2](https://riskfolio-lib.readthedocs.io/en/latest/auxiliary.html#id118 "Wolfram Barfuss, Guido Previde Massara, T. Di Matteo, and Tomaso Aste. Parsimonious modeling with information filtering networks. Physical Review E, 12 2016. URL: http://dx.doi.org/10.1103/PhysRevE.94.062306, doi:10.1103/physreve.94.062306.")\
\] covariance estimation method.
The OwaWeights module has functions that allows us to build the weights of some special cases of the OWA Portfolio optimization model \[[D3](https://riskfolio-lib.readthedocs.io/en/latest/auxiliary.html#id120 "Dany Cajas. Owa portfolio optimization: a disciplined convex programming framework. SSRN Electronic Journal, 2021. URL: https://doi.org/10.2139/ssrn.3988927, doi:10.2139/ssrn.3988927.")\
\].
The GerberStatistic module has functions that allows us to use the Gerber Statistic \[[D4](https://riskfolio-lib.readthedocs.io/en/latest/auxiliary.html#id123 "Sander Gerber, Harry Markowitz, Philip Ernst, Yinsen Miao, Babak Javid, and Paul Sargen. The gerber statistic: a robust co-movement measure for portfolio optimization. SSRN Electronic Journal, 2021. URL: https://doi.org/10.2139/ssrn.3880054, doi:10.2139/ssrn.3880054.")\
\].
The cppfunctions module has functions that allows us to build some special matrixes defined in \[[D5](https://riskfolio-lib.readthedocs.io/en/latest/auxiliary.html#id125 "Jan R. Magnus and H. Neudecker. The elimination matrix: some lemmas and applications. SIAM Journal on Algebraic Discrete Methods, 1(4):422-449, 1980. URL: https://doi.org/10.1137/0601049, arXiv:https://doi.org/10.1137/0601049, doi:10.1137/0601049.")\
\] and \[[D6](https://riskfolio-lib.readthedocs.io/en/latest/auxiliary.html#id124 "Dany Cajas. Convex optimization of portfolio kurtosis. SSRN Electronic Journal, 2022. URL: https://doi.org/10.2139/ssrn.4202967, doi:10.2139/ssrn.4202967.")\
\].
The AuxFunctions module has some auxiliary functions that are used in other modules.
DBHT Methods[¶](https://riskfolio-lib.readthedocs.io/en/latest/auxiliary.html#module-DBHT "Link to this heading")
------------------------------------------------------------------------------------------------------------------
DBHT.DBHTs(_[D](https://riskfolio-lib.readthedocs.io/en/latest/auxiliary.html#DBHT.DBHTs.D "DBHT.DBHTs.D (Python parameter) — N x N dissimilarity matrix - e.g.")
_, _[S](https://riskfolio-lib.readthedocs.io/en/latest/auxiliary.html#DBHT.DBHTs.S "DBHT.DBHTs.S (Python parameter) — N x N similarity matrix (non-negative)- e.g.")
_, _[leaf\_order](https://riskfolio-lib.readthedocs.io/en/latest/auxiliary.html#DBHT.DBHTs "DBHT.DBHTs.leaf_order (Python parameter)")
\=`True`_)[\[source\]](https://riskfolio-lib.readthedocs.io/en/latest/_modules/DBHT.html#DBHTs)
[¶](https://riskfolio-lib.readthedocs.io/en/latest/auxiliary.html#DBHT.DBHTs "Link to this definition")
Perform Direct Bubble Hierarchical Tree (DBHT) clustering, a deterministic technique which only requires a similarity matrix S, and related dissimilarity matrix D. For more information see “Hierarchical information clustering by means of topologically embedded graphs.” \[[D1](https://riskfolio-lib.readthedocs.io/en/latest/auxiliary.html#id111 "Won-Min Song, T. Di Matteo, and Tomaso Aste. Hierarchical information clustering by means of topologically embedded graphs. PLOS ONE, 7(3):1-14, 03 2012. URL: https://doi.org/10.1371/journal.pone.0031929, doi:10.1371/journal.pone.0031929.")\
\]. This version makes extensive use of graph-theoretic filtering technique called Triangulated Maximally Filtered Graph (TMFG).
Parameters:[¶](https://riskfolio-lib.readthedocs.io/en/latest/auxiliary.html#DBHT.DBHTs-parameters "Permalink to this headline")
D : nd-array[¶](https://riskfolio-lib.readthedocs.io/en/latest/auxiliary.html#DBHT.DBHTs.D "Permalink to this definition")
N x N dissimilarity matrix - e.g. a distance: D=pdist(data,’euclidean’) and then D=squareform(D).
S : nd-array[¶](https://riskfolio-lib.readthedocs.io/en/latest/auxiliary.html#DBHT.DBHTs.S "Permalink to this definition")
N x N similarity matrix (non-negative)- e.g. correlation coefficient+1: S = 2-D\*\*2/2 or another possible choice can be S = exp(-D).
Returns:[¶](https://riskfolio-lib.readthedocs.io/en/latest/auxiliary.html#DBHT.DBHTs-returns "Permalink to this headline")
* **T8** (_DataFrame_) – N x 1 cluster membership vector.
* **Rpm** (_nd-array_) – N x N adjacency matrix of Plannar Maximally Filtered Graph (PMFG).
* **Adjv** (_nd-array_) – Bubble cluster membership matrix from BubbleCluster8.
* **Dpm** (_nd-array_) – N x N shortest path length matrix of PMFG
* **Mv** (_nd-array_) – N x Nb bubble membership matrix. Nb(n,bi)=1 indicates vertex n is a vertex of bubble bi.
* **Z** (_nd-array_) – Linkage matrix using DBHT hierarchy.
DBHT.j\_LoGo(_[S](https://riskfolio-lib.readthedocs.io/en/latest/auxiliary.html#DBHT.j_LoGo.S "DBHT.j_LoGo.S (Python parameter) — It is the complete covariance matrix.")
_, _[separators](https://riskfolio-lib.readthedocs.io/en/latest/auxiliary.html#DBHT.j_LoGo.separators "DBHT.j_LoGo.separators (Python parameter) — It is the list of separators.")
_, _[cliques](https://riskfolio-lib.readthedocs.io/en/latest/auxiliary.html#DBHT.j_LoGo.cliques "DBHT.j_LoGo.cliques (Python parameter) — It is the list of cliques.")
_)[\[source\]](https://riskfolio-lib.readthedocs.io/en/latest/_modules/DBHT.html#j_LoGo)
[¶](https://riskfolio-lib.readthedocs.io/en/latest/auxiliary.html#DBHT.j_LoGo "Link to this definition")
computes sparse inverse covariance, J, from a clique tree made of cliques and separators. For more information see: \[[D2](https://riskfolio-lib.readthedocs.io/en/latest/auxiliary.html#id118 "Wolfram Barfuss, Guido Previde Massara, T. Di Matteo, and Tomaso Aste. Parsimonious modeling with information filtering networks. Physical Review E, 12 2016. URL: http://dx.doi.org/10.1103/PhysRevE.94.062306, doi:10.1103/physreve.94.062306.")\
\].
Parameters:[¶](https://riskfolio-lib.readthedocs.io/en/latest/auxiliary.html#DBHT.j_LoGo-parameters "Permalink to this headline")
S : ndarray[¶](https://riskfolio-lib.readthedocs.io/en/latest/auxiliary.html#DBHT.j_LoGo.S "Permalink to this definition")
It is the complete covariance matrix.
separators : nd-array[¶](https://riskfolio-lib.readthedocs.io/en/latest/auxiliary.html#DBHT.j_LoGo.separators "Permalink to this definition")
It is the list of separators.
cliques : nd-array[¶](https://riskfolio-lib.readthedocs.io/en/latest/auxiliary.html#DBHT.j_LoGo.cliques "Permalink to this definition")
It is the list of cliques.
Returns:[¶](https://riskfolio-lib.readthedocs.io/en/latest/auxiliary.html#DBHT.j_LoGo-returns "Permalink to this headline")
**JLogo** – Inverse covariance.
Return type:[¶](https://riskfolio-lib.readthedocs.io/en/latest/auxiliary.html#DBHT.j_LoGo-return-type "Permalink to this headline")
nd-array
Notes
separators and cliques can be the outputs of TMFG function
DBHT.PMFG\_T2s(_[W](https://riskfolio-lib.readthedocs.io/en/latest/auxiliary.html#DBHT.PMFG_T2s.W "DBHT.PMFG_T2s.W (Python parameter) — An N x N matrix of non-negative weights.")
_, _[nargout](https://riskfolio-lib.readthedocs.io/en/latest/auxiliary.html#DBHT.PMFG_T2s.nargout "DBHT.PMFG_T2s.nargout (Python parameter) — Number of results, Possible values are 3, 4 and 5.")
\=`3`_)[\[source\]](https://riskfolio-lib.readthedocs.io/en/latest/_modules/DBHT.html#PMFG_T2s)
[¶](https://riskfolio-lib.readthedocs.io/en/latest/auxiliary.html#DBHT.PMFG_T2s "Link to this definition")
Computes a Triangulated Maximally Filtered Graph (TMFG) \[[D7](https://riskfolio-lib.readthedocs.io/en/latest/auxiliary.html#id112 "Guido Previde Massara, T. Di Matteo, and Tomaso Aste. Network Filtering for Big Data: Triangulated Maximally Filtered Graph. Journal of Complex Networks, 5(2):161-178, 06 2016. URL: https://doi.org/10.1093/comnet/cnw015, arXiv:https://academic.oup.com/comnet/article-pdf/5/2/161/13794756/cnw015.pdf, doi:10.1093/comnet/cnw015.")\
\] starting from a tetrahedron and inserting recursively vertices inside existing triangles (T2 move) in order to approximate a maximal planar graph with the largest total weight - non negative weights.
Parameters:[¶](https://riskfolio-lib.readthedocs.io/en/latest/auxiliary.html#DBHT.PMFG_T2s-parameters "Permalink to this headline")
W : nd-array[¶](https://riskfolio-lib.readthedocs.io/en/latest/auxiliary.html#DBHT.PMFG_T2s.W "Permalink to this definition")
An N x N matrix of non-negative weights.
nargout : [int](https://docs.python.org/3.11/library/functions.html#int "(in Python v3.11)")
, optional[¶](https://riskfolio-lib.readthedocs.io/en/latest/auxiliary.html#DBHT.PMFG_T2s.nargout "Permalink to this definition")
Number of results, Possible values are 3, 4 and 5.
Returns:[¶](https://riskfolio-lib.readthedocs.io/en/latest/auxiliary.html#DBHT.PMFG_T2s-returns "Permalink to this headline")
* **A** (_nd-array_) – Adjacency matrix of the PMFG (with weights)
* **tri** (_nd-array_) – Matrix of triangles (triangular faces) of size 2N - 4 x 3
* **separators** (_nd-array_) – Matrix of 3-cliques that are not triangular faces (all 3-cliques are given by: \[tri;separators\]).
* **clique4** (_nd-array, optional_) – List of all 4-cliques.
* **cliqueTree** (_nd-array, optional_) – 4-cliques tree structure (adjacency matrix).
DBHT.distance\_wei(_[L](https://riskfolio-lib.readthedocs.io/en/latest/auxiliary.html#DBHT.distance_wei.L "DBHT.distance_wei.L (Python parameter) — Directed/undirected connection-length matrix.")
_)[\[source\]](https://riskfolio-lib.readthedocs.io/en/latest/_modules/DBHT.html#distance_wei)
[¶](https://riskfolio-lib.readthedocs.io/en/latest/auxiliary.html#DBHT.distance_wei "Link to this definition")
The distance matrix contains lengths of shortest paths between all pairs of nodes. An entry (u,v) represents the length of shortest path from node u to node v. The average shortest path length is the characteristic path length of the network.
Parameters:[¶](https://riskfolio-lib.readthedocs.io/en/latest/auxiliary.html#DBHT.distance_wei-parameters "Permalink to this headline")
L : nd-array[¶](https://riskfolio-lib.readthedocs.io/en/latest/auxiliary.html#DBHT.distance_wei.L "Permalink to this definition")
Directed/undirected connection-length matrix.
Returns:[¶](https://riskfolio-lib.readthedocs.io/en/latest/auxiliary.html#DBHT.distance_wei-returns "Permalink to this headline")
* **D** (_nd-array_) – Distance (shortest weighted path) matrix
* **B** (_nd-array_) – Number of edges in shortest weighted path matrix
Notes
The input matrix must be a connection-length matrix, typically obtained via a mapping from weight to length. For instance, in a weighted correlation network higher correlations are more naturally interpreted as shorter distances and the input matrix should consequently be some inverse of the connectivity matrix. The number of edges in shortest weighted paths may in general exceed the number of edges in shortest binary paths (i.e. shortest paths computed on the binarized connectivity matrix), because shortest weighted paths have the minimal weighted distance, but not necessarily the minimal number of edges.
Lengths between disconnected nodes are set to Inf. Lengths on the main diagonal are set to 0.
Algorithm: Dijkstra’s algorithm.
Mika Rubinov, UNSW/U Cambridge, 2007-2012. Rick Betzel and Andrea Avena, IU, 2012 Modification history : 2007: original (MR) 2009-08-04: min() function vectorized (MR) 2012: added number of edges in shortest path as additional output (RB/AA) 2013: variable names changed for consistency with other functions (MR)
DBHT.CliqHierarchyTree2s(_[Apm](https://riskfolio-lib.readthedocs.io/en/latest/auxiliary.html#DBHT.CliqHierarchyTree2s.Apm "DBHT.CliqHierarchyTree2s.Apm (Python parameter) — N x N Adjacency matrix of a maximal planar graph.")
_, _[method1](https://riskfolio-lib.readthedocs.io/en/latest/auxiliary.html#DBHT.CliqHierarchyTree2s.method1 "DBHT.CliqHierarchyTree2s.method1 (Python parameter) — Choose between 'uniqueroot' and 'equalroot'.")
_)[\[source\]](https://riskfolio-lib.readthedocs.io/en/latest/_modules/DBHT.html#CliqHierarchyTree2s)
[¶](https://riskfolio-lib.readthedocs.io/en/latest/auxiliary.html#DBHT.CliqHierarchyTree2s "Link to this definition")
ClqHierarchyTree2 looks for 3-cliques of a maximal planar graph, then construct hierarchy of the cliques with the definition of ‘inside’ a clique to be a subgraph with smaller size, when the entire graph is made disjoint by removing the clique \[[D8](https://riskfolio-lib.readthedocs.io/en/latest/auxiliary.html#id113 "Won-Min Song, T. Di Matteo, and Tomaso Aste. Nested hierarchies in planar graphs. Discrete Applied Mathematics, 159(17):2135-2146, 2011. URL: https://www.sciencedirect.com/science/article/pii/S0166218X11002794, doi:https://doi.org/10.1016/j.dam.2011.07.018.")\
\].
Parameters:[¶](https://riskfolio-lib.readthedocs.io/en/latest/auxiliary.html#DBHT.CliqHierarchyTree2s-parameters "Permalink to this headline")
Apm : N[¶](https://riskfolio-lib.readthedocs.io/en/latest/auxiliary.html#DBHT.CliqHierarchyTree2s.Apm "Permalink to this definition")
N x N Adjacency matrix of a maximal planar graph.
method1 : [str](https://docs.python.org/3.11/library/stdtypes.html#str "(in Python v3.11)")
[¶](https://riskfolio-lib.readthedocs.io/en/latest/auxiliary.html#DBHT.CliqHierarchyTree2s.method1 "Permalink to this definition")
Choose between ‘uniqueroot’ and ‘equalroot’. Assigns connections between final root cliques. Uses Voronoi tesselation between tiling triangles.
Returns:[¶](https://riskfolio-lib.readthedocs.io/en/latest/auxiliary.html#DBHT.CliqHierarchyTree2s-returns "Permalink to this headline")
* **H1** (_nd-array_) – Nc x Nc adjacency matrix for 3-clique hierarchical tree where Nc is the number of 3-cliques.
* **H2** (_nd-array_) – Nb x Nb adjacency matrix for bubble hierarchical tree where Nb is the number of bubbles.
* **Mb** (_nd-array_) – Nc x Nb matrix bubble membership matrix. Mb(n,bi)=1 indicates that 3-clique n belongs to bi bubble.
* **CliqList** (_nd-array_) – Nc x 3 matrix. Each row vector lists three vertices consisting a 3-clique in the maximal planar graph.
* **Sb** (_nd-array_) – Nc x 1 vector. Sb(n)=1 indicates nth 3-clique is separating.
DBHT.clique3(_[A](https://riskfolio-lib.readthedocs.io/en/latest/auxiliary.html#DBHT.clique3.A "DBHT.clique3.A (Python parameter) — N x N sparse adjacency matrix.")
_)[\[source\]](https://riskfolio-lib.readthedocs.io/en/latest/_modules/DBHT.html#clique3)
[¶](https://riskfolio-lib.readthedocs.io/en/latest/auxiliary.html#DBHT.clique3 "Link to this definition")
Computes the list of 3-cliques.
Parameters:[¶](https://riskfolio-lib.readthedocs.io/en/latest/auxiliary.html#DBHT.clique3-parameters "Permalink to this headline")
A : nd-array[¶](https://riskfolio-lib.readthedocs.io/en/latest/auxiliary.html#DBHT.clique3.A "Permalink to this definition")
N x N sparse adjacency matrix.
Returns:[¶](https://riskfolio-lib.readthedocs.io/en/latest/auxiliary.html#DBHT.clique3-returns "Permalink to this headline")
**clique** – Nc x 3 matrix. Each row vector contains the list of vertices for a 3-clique.
Return type:[¶](https://riskfolio-lib.readthedocs.io/en/latest/auxiliary.html#DBHT.clique3-return-type "Permalink to this headline")
nd-array
DBHT.breadth(_[CIJ](https://riskfolio-lib.readthedocs.io/en/latest/auxiliary.html#DBHT.breadth.CIJ "DBHT.breadth.CIJ (Python parameter) — Binary (directed/undirected) connection matrix")
_, _[source](https://riskfolio-lib.readthedocs.io/en/latest/auxiliary.html#DBHT.breadth.source "DBHT.breadth.source (Python parameter) — Source vertex")
_)[\[source\]](https://riskfolio-lib.readthedocs.io/en/latest/_modules/DBHT.html#breadth)
[¶](https://riskfolio-lib.readthedocs.io/en/latest/auxiliary.html#DBHT.breadth "Link to this definition")
Implementation of breadth-first search.
Parameters:[¶](https://riskfolio-lib.readthedocs.io/en/latest/auxiliary.html#DBHT.breadth-parameters "Permalink to this headline")
CIJ : nd-array[¶](https://riskfolio-lib.readthedocs.io/en/latest/auxiliary.html#DBHT.breadth.CIJ "Permalink to this definition")
Binary (directed/undirected) connection matrix
source : nd-array[¶](https://riskfolio-lib.readthedocs.io/en/latest/auxiliary.html#DBHT.breadth.source "Permalink to this definition")
Source vertex
Returns:[¶](https://riskfolio-lib.readthedocs.io/en/latest/auxiliary.html#DBHT.breadth-returns "Permalink to this headline")
* **distance** (_nd-array_) – Distance between ‘source’ and i’th vertex (0 for source vertex).
* **branch** (_nd-array_) – Vertex that precedes i in the breadth-first search tree (-1 for source vertex)
Notes
Breadth-first search tree does not contain all paths (or all shortest paths), but allows the determination of at least one path with minimum distance. The entire graph is explored, starting from source vertex ‘source’.
Olaf Sporns, Indiana University, 2002/2007/2008
DBHT.BubbleCluster8s(_[Rpm](https://riskfolio-lib.readthedocs.io/en/latest/auxiliary.html#DBHT.BubbleCluster8s.Rpm "DBHT.BubbleCluster8s.Rpm (Python parameter) — N x N sparse weighted adjacency matrix of PMFG.")
_, _[Dpm](https://riskfolio-lib.readthedocs.io/en/latest/auxiliary.html#DBHT.BubbleCluster8s.Dpm "DBHT.BubbleCluster8s.Dpm (Python parameter) — N x N shortest path lengths matrix of PMFG")
_, _[Hb](https://riskfolio-lib.readthedocs.io/en/latest/auxiliary.html#DBHT.BubbleCluster8s.Hb "DBHT.BubbleCluster8s.Hb (Python parameter) — Undirected bubble tree of PMFG")
_, _[Mb](https://riskfolio-lib.readthedocs.io/en/latest/auxiliary.html#DBHT.BubbleCluster8s.Mb "DBHT.BubbleCluster8s.Mb (Python parameter) — Nc x Nb bubble membership matrix for 3-cliques.")
_, _[Mv](https://riskfolio-lib.readthedocs.io/en/latest/auxiliary.html#DBHT.BubbleCluster8s.Mv "DBHT.BubbleCluster8s.Mv (Python parameter) — N x Nb bubble membership matrix for vertices.")
_, _[CliqList](https://riskfolio-lib.readthedocs.io/en/latest/auxiliary.html#DBHT.BubbleCluster8s.CliqList "DBHT.BubbleCluster8s.CliqList (Python parameter) — Nc x 3 matrix of list of 3-cliques.")
_)[\[source\]](https://riskfolio-lib.readthedocs.io/en/latest/_modules/DBHT.html#BubbleCluster8s)
[¶](https://riskfolio-lib.readthedocs.io/en/latest/auxiliary.html#DBHT.BubbleCluster8s "Link to this definition")
Obtains non-discrete and discrete clusterings from the bubble topology of PMFG.
Parameters:[¶](https://riskfolio-lib.readthedocs.io/en/latest/auxiliary.html#DBHT.BubbleCluster8s-parameters "Permalink to this headline")
Rpm : nd-array[¶](https://riskfolio-lib.readthedocs.io/en/latest/auxiliary.html#DBHT.BubbleCluster8s.Rpm "Permalink to this definition")
N x N sparse weighted adjacency matrix of PMFG.
Dpm : nd-array[¶](https://riskfolio-lib.readthedocs.io/en/latest/auxiliary.html#DBHT.BubbleCluster8s.Dpm "Permalink to this definition")
N x N shortest path lengths matrix of PMFG
Hb : nd-array[¶](https://riskfolio-lib.readthedocs.io/en/latest/auxiliary.html#DBHT.BubbleCluster8s.Hb "Permalink to this definition")
Undirected bubble tree of PMFG
Mb : nd-array[¶](https://riskfolio-lib.readthedocs.io/en/latest/auxiliary.html#DBHT.BubbleCluster8s.Mb "Permalink to this definition")
Nc x Nb bubble membership matrix for 3-cliques. Mb(n,bi)=1 indicates that 3-clique n belongs to bi bubble.
Mv : nd-array[¶](https://riskfolio-lib.readthedocs.io/en/latest/auxiliary.html#DBHT.BubbleCluster8s.Mv "Permalink to this definition")
N x Nb bubble membership matrix for vertices.
CliqList : nd-array[¶](https://riskfolio-lib.readthedocs.io/en/latest/auxiliary.html#DBHT.BubbleCluster8s.CliqList "Permalink to this definition")
Nc x 3 matrix of list of 3-cliques. Each row vector contains the list of vertices for a particular 3-clique.
Returns:[¶](https://riskfolio-lib.readthedocs.io/en/latest/auxiliary.html#DBHT.BubbleCluster8s-returns "Permalink to this headline")
* **Adjv** (_nd-array_) – N x Nk cluster membership matrix for vertices for non-discrete clustering via the bubble topology. Adjv(n,k)=1 indicates cluster membership of vertex n to kth non-discrete cluster.
* **Tc** (_nd-array_) – N x 1 cluster membership vector. Tc(n)=k indicates cluster membership of vertex n to kth discrete cluster.
DBHT.DirectHb(_[Rpm](https://riskfolio-lib.readthedocs.io/en/latest/auxiliary.html#DBHT.DirectHb.Rpm "DBHT.DirectHb.Rpm (Python parameter) — N x N sparse weighted adjacency matrix of PMFG")
_, _[Hb](https://riskfolio-lib.readthedocs.io/en/latest/auxiliary.html#DBHT.DirectHb.Hb "DBHT.DirectHb.Hb (Python parameter) — Undirected bubble tree of PMFG")
_, _[Mb](https://riskfolio-lib.readthedocs.io/en/latest/auxiliary.html#DBHT.DirectHb.Mb "DBHT.DirectHb.Mb (Python parameter) — Nc x Nb bubble membership matrix for 3-cliques.")
_, _[Mv](https://riskfolio-lib.readthedocs.io/en/latest/auxiliary.html#DBHT.DirectHb.Mv "DBHT.DirectHb.Mv (Python parameter) — N x Nb bubble membership matrix for vertices.")
_, _[CliqList](https://riskfolio-lib.readthedocs.io/en/latest/auxiliary.html#DBHT.DirectHb.CliqList "DBHT.DirectHb.CliqList (Python parameter) — Nc x 3 matrix of list of 3-cliques.")
_)[\[source\]](https://riskfolio-lib.readthedocs.io/en/latest/_modules/DBHT.html#DirectHb)
[¶](https://riskfolio-lib.readthedocs.io/en/latest/auxiliary.html#DBHT.DirectHb "Link to this definition")
Computes directions on each separating 3-clique of a maximal planar graph, hence computes Directed Bubble Hierarchical Tree (DBHT).
Parameters:[¶](https://riskfolio-lib.readthedocs.io/en/latest/auxiliary.html#DBHT.DirectHb-parameters "Permalink to this headline")
Rpm : nd-array[¶](https://riskfolio-lib.readthedocs.io/en/latest/auxiliary.html#DBHT.DirectHb.Rpm "Permalink to this definition")
N x N sparse weighted adjacency matrix of PMFG
Hb : nd-array[¶](https://riskfolio-lib.readthedocs.io/en/latest/auxiliary.html#DBHT.DirectHb.Hb "Permalink to this definition")
Undirected bubble tree of PMFG
Mb : nd-array[¶](https://riskfolio-lib.readthedocs.io/en/latest/auxiliary.html#DBHT.DirectHb.Mb "Permalink to this definition")
Nc x Nb bubble membership matrix for 3-cliques. Mb(n,bi)=1 indicates that 3-clique n belongs to bi bubble.
Mv : nd-array[¶](https://riskfolio-lib.readthedocs.io/en/latest/auxiliary.html#DBHT.DirectHb.Mv "Permalink to this definition")
N x Nb bubble membership matrix for vertices.
CliqList : nd-array[¶](https://riskfolio-lib.readthedocs.io/en/latest/auxiliary.html#DBHT.DirectHb.CliqList "Permalink to this definition")
Nc x 3 matrix of list of 3-cliques. Each row vector contains the list of vertices for a particular 3-clique.
Returns:[¶](https://riskfolio-lib.readthedocs.io/en/latest/auxiliary.html#DBHT.DirectHb-returns "Permalink to this headline")
**Hc** – Nb x Nb unweighted directed adjacency matrix of DBHT. Hc(i,j)=1 indicates a directed edge from bubble i to bubble j.
Return type:[¶](https://riskfolio-lib.readthedocs.io/en/latest/auxiliary.html#DBHT.DirectHb-return-type "Permalink to this headline")
nd-array
DBHT.HierarchyConstruct4s(_[Rpm](https://riskfolio-lib.readthedocs.io/en/latest/auxiliary.html#DBHT.HierarchyConstruct4s.Rpm "DBHT.HierarchyConstruct4s.Rpm (Python parameter) — N x N Weighted adjacency matrix of PMFG.")
_, _[Dpm](https://riskfolio-lib.readthedocs.io/en/latest/auxiliary.html#DBHT.HierarchyConstruct4s.Dpm "DBHT.HierarchyConstruct4s.Dpm (Python parameter) — N x N shortest path length matrix of PMFG.")
_, _[Tc](https://riskfolio-lib.readthedocs.io/en/latest/auxiliary.html#DBHT.HierarchyConstruct4s.Tc "DBHT.HierarchyConstruct4s.Tc (Python parameter) — N x 1 cluster membership vector from DBHT clustering.")
_, _[Adjv](https://riskfolio-lib.readthedocs.io/en/latest/auxiliary.html#DBHT.HierarchyConstruct4s.Adjv "DBHT.HierarchyConstruct4s.Adjv (Python parameter) — Bubble cluster membership matrix from BubbleCluster8s.")
_, _[Mv](https://riskfolio-lib.readthedocs.io/en/latest/auxiliary.html#DBHT.HierarchyConstruct4s.Mv "DBHT.HierarchyConstruct4s.Mv (Python parameter) — Bubble membership of vertices from BubbleCluster8s.")
_)[\[source\]](https://riskfolio-lib.readthedocs.io/en/latest/_modules/DBHT.html#HierarchyConstruct4s)
[¶](https://riskfolio-lib.readthedocs.io/en/latest/auxiliary.html#DBHT.HierarchyConstruct4s "Link to this definition")
Constructs intra- and inter-cluster hierarchy by utilizing Bubble hierarchy structure of a maximal planar graph, namely Planar Maximally Filtered Graph (PMFG).
Parameters:[¶](https://riskfolio-lib.readthedocs.io/en/latest/auxiliary.html#DBHT.HierarchyConstruct4s-parameters "Permalink to this headline")
Rpm : nd-array[¶](https://riskfolio-lib.readthedocs.io/en/latest/auxiliary.html#DBHT.HierarchyConstruct4s.Rpm "Permalink to this definition")
N x N Weighted adjacency matrix of PMFG.
Dpm : nd-array[¶](https://riskfolio-lib.readthedocs.io/en/latest/auxiliary.html#DBHT.HierarchyConstruct4s.Dpm "Permalink to this definition")
N x N shortest path length matrix of PMFG.
Tc : nd-array[¶](https://riskfolio-lib.readthedocs.io/en/latest/auxiliary.html#DBHT.HierarchyConstruct4s.Tc "Permalink to this definition")
N x 1 cluster membership vector from DBHT clustering. Tc(n)=z\_i indicate cluster of nth vertex.
Adjv : nd-array[¶](https://riskfolio-lib.readthedocs.io/en/latest/auxiliary.html#DBHT.HierarchyConstruct4s.Adjv "Permalink to this definition")
Bubble cluster membership matrix from BubbleCluster8s.
Mv : nd-array[¶](https://riskfolio-lib.readthedocs.io/en/latest/auxiliary.html#DBHT.HierarchyConstruct4s.Mv "Permalink to this definition")
Bubble membership of vertices from BubbleCluster8s.
Returns:[¶](https://riskfolio-lib.readthedocs.io/en/latest/auxiliary.html#DBHT.HierarchyConstruct4s-returns "Permalink to this headline")
**Z** – (N-1) x 4 linkage matrix, in the same format as the output from matlab function ‘linkage’.
Return type:[¶](https://riskfolio-lib.readthedocs.io/en/latest/auxiliary.html#DBHT.HierarchyConstruct4s-return-type "Permalink to this headline")
nd-array
OWA Weights Functions[¶](https://riskfolio-lib.readthedocs.io/en/latest/auxiliary.html#module-OwaWeights "Link to this heading")
---------------------------------------------------------------------------------------------------------------------------------
OwaWeights.owa\_l\_moment(_[T](https://riskfolio-lib.readthedocs.io/en/latest/auxiliary.html#OwaWeights.owa_l_moment.T "OwaWeights.owa_l_moment.T (Python parameter) — Number of observations of the returns series.")
_, _[k](https://riskfolio-lib.readthedocs.io/en/latest/auxiliary.html#OwaWeights.owa_l_moment.k "OwaWeights.owa_l_moment.k (Python parameter) — Order of the l-moment.")
\=`2`_)[\[source\]](https://riskfolio-lib.readthedocs.io/en/latest/_modules/OwaWeights.html#owa_l_moment)
[¶](https://riskfolio-lib.readthedocs.io/en/latest/auxiliary.html#OwaWeights.owa_l_moment "Link to this definition")
Calculate the OWA weights to calculate the kth linear moment (l-moment) of a returns series as shown in \[[D9](https://riskfolio-lib.readthedocs.io/en/latest/auxiliary.html#id127 "Dany Cajas. Higher order moment portfolio optimization with l-moments. SSRN Electronic Journal, 2023. URL: https://papers.ssrn.com/sol3/papers.cfm?abstract_id=4393155, doi:10.2139/ssrn.4393155.")\
\].
Parameters:[¶](https://riskfolio-lib.readthedocs.io/en/latest/auxiliary.html#OwaWeights.owa_l_moment-parameters "Permalink to this headline")
T : [int](https://docs.python.org/3.11/library/functions.html#int "(in Python v3.11)")
[¶](https://riskfolio-lib.readthedocs.io/en/latest/auxiliary.html#OwaWeights.owa_l_moment.T "Permalink to this definition")
Number of observations of the returns series.
k : [int](https://docs.python.org/3.11/library/functions.html#int "(in Python v3.11)")
[¶](https://riskfolio-lib.readthedocs.io/en/latest/auxiliary.html#OwaWeights.owa_l_moment.k "Permalink to this definition")
Order of the l-moment. Must be an integer higher or equal than 1.
Returns:[¶](https://riskfolio-lib.readthedocs.io/en/latest/auxiliary.html#OwaWeights.owa_l_moment-returns "Permalink to this headline")
**value** – An OWA weights vector of size Tx1.
Return type:[¶](https://riskfolio-lib.readthedocs.io/en/latest/auxiliary.html#OwaWeights.owa_l_moment-return-type "Permalink to this headline")
1d-array
OwaWeights.owa\_gmd(_[T](https://riskfolio-lib.readthedocs.io/en/latest/auxiliary.html#OwaWeights.owa_gmd.T "OwaWeights.owa_gmd.T (Python parameter) — Number of observations of the returns series.")
_)[\[source\]](https://riskfolio-lib.readthedocs.io/en/latest/_modules/OwaWeights.html#owa_gmd)
[¶](https://riskfolio-lib.readthedocs.io/en/latest/auxiliary.html#OwaWeights.owa_gmd "Link to this definition")
Calculate the OWA weights to calculate the Gini mean difference (GMD) of a returns series as shown in \[[D3](https://riskfolio-lib.readthedocs.io/en/latest/auxiliary.html#id120 "Dany Cajas. Owa portfolio optimization: a disciplined convex programming framework. SSRN Electronic Journal, 2021. URL: https://doi.org/10.2139/ssrn.3988927, doi:10.2139/ssrn.3988927.")\
\].
Parameters:[¶](https://riskfolio-lib.readthedocs.io/en/latest/auxiliary.html#OwaWeights.owa_gmd-parameters "Permalink to this headline")
T : [int](https://docs.python.org/3.11/library/functions.html#int "(in Python v3.11)")
[¶](https://riskfolio-lib.readthedocs.io/en/latest/auxiliary.html#OwaWeights.owa_gmd.T "Permalink to this definition")
Number of observations of the returns series.
Returns:[¶](https://riskfolio-lib.readthedocs.io/en/latest/auxiliary.html#OwaWeights.owa_gmd-returns "Permalink to this headline")
**value** – An OWA weights vector of size Tx1.
Return type:[¶](https://riskfolio-lib.readthedocs.io/en/latest/auxiliary.html#OwaWeights.owa_gmd-return-type "Permalink to this headline")
1d-array
OwaWeights.owa\_cvar(_[T](https://riskfolio-lib.readthedocs.io/en/latest/auxiliary.html#OwaWeights.owa_cvar.T "OwaWeights.owa_cvar.T (Python parameter) — Number of observations of the returns series.")
_, _[alpha](https://riskfolio-lib.readthedocs.io/en/latest/auxiliary.html#OwaWeights.owa_cvar.alpha "OwaWeights.owa_cvar.alpha (Python parameter) — Significance level of CVaR.")
\=`0.05`_)[\[source\]](https://riskfolio-lib.readthedocs.io/en/latest/_modules/OwaWeights.html#owa_cvar)
[¶](https://riskfolio-lib.readthedocs.io/en/latest/auxiliary.html#OwaWeights.owa_cvar "Link to this definition")
Calculate the OWA weights to calculate the Conditional Value at Risk (CVaR) of a returns series as shown in \[[D3](https://riskfolio-lib.readthedocs.io/en/latest/auxiliary.html#id120 "Dany Cajas. Owa portfolio optimization: a disciplined convex programming framework. SSRN Electronic Journal, 2021. URL: https://doi.org/10.2139/ssrn.3988927, doi:10.2139/ssrn.3988927.")\
\].
Parameters:[¶](https://riskfolio-lib.readthedocs.io/en/latest/auxiliary.html#OwaWeights.owa_cvar-parameters "Permalink to this headline")
T : [int](https://docs.python.org/3.11/library/functions.html#int "(in Python v3.11)")
[¶](https://riskfolio-lib.readthedocs.io/en/latest/auxiliary.html#OwaWeights.owa_cvar.T "Permalink to this definition")
Number of observations of the returns series.
alpha : [float](https://docs.python.org/3.11/library/functions.html#float "(in Python v3.11)")
, optional[¶](https://riskfolio-lib.readthedocs.io/en/latest/auxiliary.html#OwaWeights.owa_cvar.alpha "Permalink to this definition")
Significance level of CVaR. The default is 0.05.
Returns:[¶](https://riskfolio-lib.readthedocs.io/en/latest/auxiliary.html#OwaWeights.owa_cvar-returns "Permalink to this headline")
**value** – An OWA weights vector of size Tx1.
Return type:[¶](https://riskfolio-lib.readthedocs.io/en/latest/auxiliary.html#OwaWeights.owa_cvar-return-type "Permalink to this headline")
1d-array
OwaWeights.owa\_wcvar(_[T](https://riskfolio-lib.readthedocs.io/en/latest/auxiliary.html#OwaWeights.owa_wcvar.T "OwaWeights.owa_wcvar.T (Python parameter) — Number of observations of the returns series.")
_, _[alphas](https://riskfolio-lib.readthedocs.io/en/latest/auxiliary.html#OwaWeights.owa_wcvar.alphas "OwaWeights.owa_wcvar.alphas (Python parameter) — List of significance levels of each CVaR model.")
_, _[weights](https://riskfolio-lib.readthedocs.io/en/latest/auxiliary.html#OwaWeights.owa_wcvar.weights "OwaWeights.owa_wcvar.weights (Python parameter) — List of weights of each CVaR model.")
_)[\[source\]](https://riskfolio-lib.readthedocs.io/en/latest/_modules/OwaWeights.html#owa_wcvar)
[¶](https://riskfolio-lib.readthedocs.io/en/latest/auxiliary.html#OwaWeights.owa_wcvar "Link to this definition")
Calculate the OWA weights to calculate the Weighted Conditional Value at Risk (WCVaR) of a returns series as shown in \[[D3](https://riskfolio-lib.readthedocs.io/en/latest/auxiliary.html#id120 "Dany Cajas. Owa portfolio optimization: a disciplined convex programming framework. SSRN Electronic Journal, 2021. URL: https://doi.org/10.2139/ssrn.3988927, doi:10.2139/ssrn.3988927.")\
\].
Parameters:[¶](https://riskfolio-lib.readthedocs.io/en/latest/auxiliary.html#OwaWeights.owa_wcvar-parameters "Permalink to this headline")
T : [int](https://docs.python.org/3.11/library/functions.html#int "(in Python v3.11)")
[¶](https://riskfolio-lib.readthedocs.io/en/latest/auxiliary.html#OwaWeights.owa_wcvar.T "Permalink to this definition")
Number of observations of the returns series.
alphas : [list](https://docs.python.org/3.11/library/stdtypes.html#list "(in Python v3.11)")
[¶](https://riskfolio-lib.readthedocs.io/en/latest/auxiliary.html#OwaWeights.owa_wcvar.alphas "Permalink to this definition")
List of significance levels of each CVaR model.
weights : [list](https://docs.python.org/3.11/library/stdtypes.html#list "(in Python v3.11)")
[¶](https://riskfolio-lib.readthedocs.io/en/latest/auxiliary.html#OwaWeights.owa_wcvar.weights "Permalink to this definition")
List of weights of each CVaR model.
Returns:[¶](https://riskfolio-lib.readthedocs.io/en/latest/auxiliary.html#OwaWeights.owa_wcvar-returns "Permalink to this headline")
**value** – An OWA weights vector of size Tx1.
Return type:[¶](https://riskfolio-lib.readthedocs.io/en/latest/auxiliary.html#OwaWeights.owa_wcvar-return-type "Permalink to this headline")
1d-array
OwaWeights.owa\_tg(_[T](https://riskfolio-lib.readthedocs.io/en/latest/auxiliary.html#OwaWeights.owa_tg.T "OwaWeights.owa_tg.T (Python parameter) — Number of observations of the returns series.")
_, _[alpha](https://riskfolio-lib.readthedocs.io/en/latest/auxiliary.html#OwaWeights.owa_tg.alpha "OwaWeights.owa_tg.alpha (Python parameter) — Significance level of TaiL Gini.")
\=`0.05`_, _[a\_sim](https://riskfolio-lib.readthedocs.io/en/latest/auxiliary.html#OwaWeights.owa_tg.a_sim "OwaWeights.owa_tg.a_sim (Python parameter) — Number of CVaRs used to approximate the Tail Gini.")
\=`100`_)[\[source\]](https://riskfolio-lib.readthedocs.io/en/latest/_modules/OwaWeights.html#owa_tg)
[¶](https://riskfolio-lib.readthedocs.io/en/latest/auxiliary.html#OwaWeights.owa_tg "Link to this definition")
Calculate the OWA weights to calculate the Tail Gini of a returns series as shown in \[[D3](https://riskfolio-lib.readthedocs.io/en/latest/auxiliary.html#id120 "Dany Cajas. Owa portfolio optimization: a disciplined convex programming framework. SSRN Electronic Journal, 2021. URL: https://doi.org/10.2139/ssrn.3988927, doi:10.2139/ssrn.3988927.")\
\].
Parameters:[¶](https://riskfolio-lib.readthedocs.io/en/latest/auxiliary.html#OwaWeights.owa_tg-parameters "Permalink to this headline")
T : [int](https://docs.python.org/3.11/library/functions.html#int "(in Python v3.11)")
[¶](https://riskfolio-lib.readthedocs.io/en/latest/auxiliary.html#OwaWeights.owa_tg.T "Permalink to this definition")
Number of observations of the returns series.
alpha : [float](https://docs.python.org/3.11/library/functions.html#float "(in Python v3.11)")
, optional[¶](https://riskfolio-lib.readthedocs.io/en/latest/auxiliary.html#OwaWeights.owa_tg.alpha "Permalink to this definition")
Significance level of TaiL Gini. The default is 0.05.
a\_sim : [float](https://docs.python.org/3.11/library/functions.html#float "(in Python v3.11)")
, optional[¶](https://riskfolio-lib.readthedocs.io/en/latest/auxiliary.html#OwaWeights.owa_tg.a_sim "Permalink to this definition")
Number of CVaRs used to approximate the Tail Gini. The default is 100.
Returns:[¶](https://riskfolio-lib.readthedocs.io/en/latest/auxiliary.html#OwaWeights.owa_tg-returns "Permalink to this headline")
**value** – A OWA weights vector of size Tx1.
Return type:[¶](https://riskfolio-lib.readthedocs.io/en/latest/auxiliary.html#OwaWeights.owa_tg-return-type "Permalink to this headline")
1d-array
OwaWeights.owa\_wr(_[T](https://riskfolio-lib.readthedocs.io/en/latest/auxiliary.html#OwaWeights.owa_wr.T "OwaWeights.owa_wr.T (Python parameter) — Number of observations of the returns series.")
_)[\[source\]](https://riskfolio-lib.readthedocs.io/en/latest/_modules/OwaWeights.html#owa_wr)
[¶](https://riskfolio-lib.readthedocs.io/en/latest/auxiliary.html#OwaWeights.owa_wr "Link to this definition")
Calculate the OWA weights to calculate the Worst realization (minimum) of a returns series as shown in \[[D3](https://riskfolio-lib.readthedocs.io/en/latest/auxiliary.html#id120 "Dany Cajas. Owa portfolio optimization: a disciplined convex programming framework. SSRN Electronic Journal, 2021. URL: https://doi.org/10.2139/ssrn.3988927, doi:10.2139/ssrn.3988927.")\
\].
Parameters:[¶](https://riskfolio-lib.readthedocs.io/en/latest/auxiliary.html#OwaWeights.owa_wr-parameters "Permalink to this headline")
T : [int](https://docs.python.org/3.11/library/functions.html#int "(in Python v3.11)")
[¶](https://riskfolio-lib.readthedocs.io/en/latest/auxiliary.html#OwaWeights.owa_wr.T "Permalink to this definition")
Number of observations of the returns series.
Returns:[¶](https://riskfolio-lib.readthedocs.io/en/latest/auxiliary.html#OwaWeights.owa_wr-returns "Permalink to this headline")
**value** – A OWA weights vector of size Tx1.
Return type:[¶](https://riskfolio-lib.readthedocs.io/en/latest/auxiliary.html#OwaWeights.owa_wr-return-type "Permalink to this headline")
1d-array
OwaWeights.owa\_rg(_[T](https://riskfolio-lib.readthedocs.io/en/latest/auxiliary.html#OwaWeights.owa_rg.T "OwaWeights.owa_rg.T (Python parameter) — Number of observations of the returns series.")
_)[\[source\]](https://riskfolio-lib.readthedocs.io/en/latest/_modules/OwaWeights.html#owa_rg)
[¶](https://riskfolio-lib.readthedocs.io/en/latest/auxiliary.html#OwaWeights.owa_rg "Link to this definition")
Calculate the OWA weights to calculate the range of a returns series as shown in \[[D3](https://riskfolio-lib.readthedocs.io/en/latest/auxiliary.html#id120 "Dany Cajas. Owa portfolio optimization: a disciplined convex programming framework. SSRN Electronic Journal, 2021. URL: https://doi.org/10.2139/ssrn.3988927, doi:10.2139/ssrn.3988927.")\
\].
Parameters:[¶](https://riskfolio-lib.readthedocs.io/en/latest/auxiliary.html#OwaWeights.owa_rg-parameters "Permalink to this headline")
T : [int](https://docs.python.org/3.11/library/functions.html#int "(in Python v3.11)")
[¶](https://riskfolio-lib.readthedocs.io/en/latest/auxiliary.html#OwaWeights.owa_rg.T "Permalink to this definition")
Number of observations of the returns series.
Returns:[¶](https://riskfolio-lib.readthedocs.io/en/latest/auxiliary.html#OwaWeights.owa_rg-returns "Permalink to this headline")
**value** – A OWA weights vector of size Tx1.
Return type:[¶](https://riskfolio-lib.readthedocs.io/en/latest/auxiliary.html#OwaWeights.owa_rg-return-type "Permalink to this headline")
1d-array
OwaWeights.owa\_cvrg(_[T](https://riskfolio-lib.readthedocs.io/en/latest/auxiliary.html#OwaWeights.owa_cvrg.T "OwaWeights.owa_cvrg.T (Python parameter) — Number of observations of the returns series.")
_, _[alpha](https://riskfolio-lib.readthedocs.io/en/latest/auxiliary.html#OwaWeights.owa_cvrg.alpha "OwaWeights.owa_cvrg.alpha (Python parameter) — Significance level of CVaR of losses.")
\=`0.05`_, _[beta](https://riskfolio-lib.readthedocs.io/en/latest/auxiliary.html#OwaWeights.owa_cvrg.beta "OwaWeights.owa_cvrg.beta (Python parameter) — Significance level of CVaR of gains.")
\=`None`_)[\[source\]](https://riskfolio-lib.readthedocs.io/en/latest/_modules/OwaWeights.html#owa_cvrg)
[¶](https://riskfolio-lib.readthedocs.io/en/latest/auxiliary.html#OwaWeights.owa_cvrg "Link to this definition")
Calculate the OWA weights to calculate the CVaR range of a returns series as shown in \[[D3](https://riskfolio-lib.readthedocs.io/en/latest/auxiliary.html#id120 "Dany Cajas. Owa portfolio optimization: a disciplined convex programming framework. SSRN Electronic Journal, 2021. URL: https://doi.org/10.2139/ssrn.3988927, doi:10.2139/ssrn.3988927.")\
\].
Parameters:[¶](https://riskfolio-lib.readthedocs.io/en/latest/auxiliary.html#OwaWeights.owa_cvrg-parameters "Permalink to this headline")
T : [int](https://docs.python.org/3.11/library/functions.html#int "(in Python v3.11)")
[¶](https://riskfolio-lib.readthedocs.io/en/latest/auxiliary.html#OwaWeights.owa_cvrg.T "Permalink to this definition")
Number of observations of the returns series.
alpha : [float](https://docs.python.org/3.11/library/functions.html#float "(in Python v3.11)")
, optional[¶](https://riskfolio-lib.readthedocs.io/en/latest/auxiliary.html#OwaWeights.owa_cvrg.alpha "Permalink to this definition")
Significance level of CVaR of losses. The default is 0.05.
beta : [float](https://docs.python.org/3.11/library/functions.html#float "(in Python v3.11)")
, optional[¶](https://riskfolio-lib.readthedocs.io/en/latest/auxiliary.html#OwaWeights.owa_cvrg.beta "Permalink to this definition")
Significance level of CVaR of gains. If None it duplicates alpha. The default is None.
Returns:[¶](https://riskfolio-lib.readthedocs.io/en/latest/auxiliary.html#OwaWeights.owa_cvrg-returns "Permalink to this headline")
**value** – A OWA weights vector of size Tx1.
Return type:[¶](https://riskfolio-lib.readthedocs.io/en/latest/auxiliary.html#OwaWeights.owa_cvrg-return-type "Permalink to this headline")
1d-array
OwaWeights.owa\_wcvrg(_[T](https://riskfolio-lib.readthedocs.io/en/latest/auxiliary.html#OwaWeights.owa_wcvrg.T "OwaWeights.owa_wcvrg.T (Python parameter) — Number of observations of the returns series.")
_, _[alphas](https://riskfolio-lib.readthedocs.io/en/latest/auxiliary.html#OwaWeights.owa_wcvrg.alphas "OwaWeights.owa_wcvrg.alphas (Python parameter) — List of significance levels of each CVaR of losses model.")
_, _[weights\_a](https://riskfolio-lib.readthedocs.io/en/latest/auxiliary.html#OwaWeights.owa_wcvrg.weights_a "OwaWeights.owa_wcvrg.weights_a (Python parameter) — List of weights of each CVaR of losses model.")
_, _[betas](https://riskfolio-lib.readthedocs.io/en/latest/auxiliary.html#OwaWeights.owa_wcvrg.betas "OwaWeights.owa_wcvrg.betas (Python parameter) — List of significance levels of each CVaR of gains model.")
\=`None`_, _[weights\_b](https://riskfolio-lib.readthedocs.io/en/latest/auxiliary.html#OwaWeights.owa_wcvrg.weights_b "OwaWeights.owa_wcvrg.weights_b (Python parameter) — List of weights of each CVaR of gains model.")
\=`None`_)[\[source\]](https://riskfolio-lib.readthedocs.io/en/latest/_modules/OwaWeights.html#owa_wcvrg)
[¶](https://riskfolio-lib.readthedocs.io/en/latest/auxiliary.html#OwaWeights.owa_wcvrg "Link to this definition")
Calculate the OWA weights to calculate the WCVaR range of a returns series as shown in \[[D3](https://riskfolio-lib.readthedocs.io/en/latest/auxiliary.html#id120 "Dany Cajas. Owa portfolio optimization: a disciplined convex programming framework. SSRN Electronic Journal, 2021. URL: https://doi.org/10.2139/ssrn.3988927, doi:10.2139/ssrn.3988927.")\
\].
Parameters:[¶](https://riskfolio-lib.readthedocs.io/en/latest/auxiliary.html#OwaWeights.owa_wcvrg-parameters "Permalink to this headline")
T : [int](https://docs.python.org/3.11/library/functions.html#int "(in Python v3.11)")
[¶](https://riskfolio-lib.readthedocs.io/en/latest/auxiliary.html#OwaWeights.owa_wcvrg.T "Permalink to this definition")
Number of observations of the returns series.
alphas : [list](https://docs.python.org/3.11/library/stdtypes.html#list "(in Python v3.11)")
[¶](https://riskfolio-lib.readthedocs.io/en/latest/auxiliary.html#OwaWeights.owa_wcvrg.alphas "Permalink to this definition")
List of significance levels of each CVaR of losses model.
weights\_a : [list](https://docs.python.org/3.11/library/stdtypes.html#list "(in Python v3.11)")
[¶](https://riskfolio-lib.readthedocs.io/en/latest/auxiliary.html#OwaWeights.owa_wcvrg.weights_a "Permalink to this definition")
List of weights of each CVaR of losses model.
betas : [list](https://docs.python.org/3.11/library/stdtypes.html#list "(in Python v3.11)")
, optional[¶](https://riskfolio-lib.readthedocs.io/en/latest/auxiliary.html#OwaWeights.owa_wcvrg.betas "Permalink to this definition")
List of significance levels of each CVaR of gains model. If None it duplicates alpha. The default is None.
weights\_b : [list](https://docs.python.org/3.11/library/stdtypes.html#list "(in Python v3.11)")
, optional[¶](https://riskfolio-lib.readthedocs.io/en/latest/auxiliary.html#OwaWeights.owa_wcvrg.weights_b "Permalink to this definition")
List of weights of each CVaR of gains model. If None it duplicates weights\_a. The default is None.
Returns:[¶](https://riskfolio-lib.readthedocs.io/en/latest/auxiliary.html#OwaWeights.owa_wcvrg-returns "Permalink to this headline")
**value** – A OWA weights vector of size Tx1.
Return type:[¶](https://riskfolio-lib.readthedocs.io/en/latest/auxiliary.html#OwaWeights.owa_wcvrg-return-type "Permalink to this headline")
1d-array
OwaWeights.owa\_tgrg(_[T](https://riskfolio-lib.readthedocs.io/en/latest/auxiliary.html#OwaWeights.owa_tgrg.T "OwaWeights.owa_tgrg.T (Python parameter) — Number of observations of the returns series.")
_, _[alpha](https://riskfolio-lib.readthedocs.io/en/latest/auxiliary.html#OwaWeights.owa_tgrg.alpha "OwaWeights.owa_tgrg.alpha (Python parameter) — Significance level of Tail Gini of losses.")
\=`0.05`_, _[a\_sim](https://riskfolio-lib.readthedocs.io/en/latest/auxiliary.html#OwaWeights.owa_tgrg.a_sim "OwaWeights.owa_tgrg.a_sim (Python parameter) — Number of CVaRs used to approximate Tail Gini of losses.")
\=`100`_, _[beta](https://riskfolio-lib.readthedocs.io/en/latest/auxiliary.html#OwaWeights.owa_tgrg.beta "OwaWeights.owa_tgrg.beta (Python parameter) — Significance level of Tail Gini of gains.")
\=`None`_, _[b\_sim](https://riskfolio-lib.readthedocs.io/en/latest/auxiliary.html#OwaWeights.owa_tgrg.b_sim "OwaWeights.owa_tgrg.b_sim (Python parameter) — Number of CVaRs used to approximate Tail Gini of gains.")
\=`None`_)[\[source\]](https://riskfolio-lib.readthedocs.io/en/latest/_modules/OwaWeights.html#owa_tgrg)
[¶](https://riskfolio-lib.readthedocs.io/en/latest/auxiliary.html#OwaWeights.owa_tgrg "Link to this definition")
Calculate the OWA weights to calculate the Tail Gini range of a returns series as shown in \[[D3](https://riskfolio-lib.readthedocs.io/en/latest/auxiliary.html#id120 "Dany Cajas. Owa portfolio optimization: a disciplined convex programming framework. SSRN Electronic Journal, 2021. URL: https://doi.org/10.2139/ssrn.3988927, doi:10.2139/ssrn.3988927.")\
\].
Parameters:[¶](https://riskfolio-lib.readthedocs.io/en/latest/auxiliary.html#OwaWeights.owa_tgrg-parameters "Permalink to this headline")
T : [int](https://docs.python.org/3.11/library/functions.html#int "(in Python v3.11)")
[¶](https://riskfolio-lib.readthedocs.io/en/latest/auxiliary.html#OwaWeights.owa_tgrg.T "Permalink to this definition")
Number of observations of the returns series.
alpha : [float](https://docs.python.org/3.11/library/functions.html#float "(in Python v3.11)")
, optional[¶](https://riskfolio-lib.readthedocs.io/en/latest/auxiliary.html#OwaWeights.owa_tgrg.alpha "Permalink to this definition")
Significance level of Tail Gini of losses. The default is 0.05.
a\_sim : [float](https://docs.python.org/3.11/library/functions.html#float "(in Python v3.11)")
, optional[¶](https://riskfolio-lib.readthedocs.io/en/latest/auxiliary.html#OwaWeights.owa_tgrg.a_sim "Permalink to this definition")
Number of CVaRs used to approximate Tail Gini of losses. The default is 100.
beta : [float](https://docs.python.org/3.11/library/functions.html#float "(in Python v3.11)")
, optional[¶](https://riskfolio-lib.readthedocs.io/en/latest/auxiliary.html#OwaWeights.owa_tgrg.beta "Permalink to this definition")
Significance level of Tail Gini of gains. If None it duplicates alpha value. The default is None.
b\_sim : [float](https://docs.python.org/3.11/library/functions.html#float "(in Python v3.11)")
, optional[¶](https://riskfolio-lib.readthedocs.io/en/latest/auxiliary.html#OwaWeights.owa_tgrg.b_sim "Permalink to this definition")
Number of CVaRs used to approximate Tail Gini of gains. If None it duplicates a\_sim value. The default is None.
Returns:[¶](https://riskfolio-lib.readthedocs.io/en/latest/auxiliary.html#OwaWeights.owa_tgrg-returns "Permalink to this headline")
**value** – A OWA weights vector of size Tx1.
Return type:[¶](https://riskfolio-lib.readthedocs.io/en/latest/auxiliary.html#OwaWeights.owa_tgrg-return-type "Permalink to this headline")
1d-array
OwaWeights.owa\_l\_moment\_crm(_[T](https://riskfolio-lib.readthedocs.io/en/latest/auxiliary.html#OwaWeights.owa_l_moment_crm.T "OwaWeights.owa_l_moment_crm.T (Python parameter) — Number of observations of the returns series.")
_, _[k](https://riskfolio-lib.readthedocs.io/en/latest/auxiliary.html#OwaWeights.owa_l_moment_crm.k "OwaWeights.owa_l_moment_crm.k (Python parameter) — Order of the l-moment.")
\=`4`_, _[method](https://riskfolio-lib.readthedocs.io/en/latest/auxiliary.html#OwaWeights.owa_l_moment_crm.method "OwaWeights.owa_l_moment_crm.method (Python parameter) — Method to calculate the weights used to combine the l-moments with order higher than 2. The default value is 'MSD'.")
\=`'MSD'`_, _[g](https://riskfolio-lib.readthedocs.io/en/latest/auxiliary.html#OwaWeights.owa_l_moment_crm.g "OwaWeights.owa_l_moment_crm.g (Python parameter) — Risk aversion coefficient of CRRA utility function.")
\=`0.5`_, _[max\_phi](https://riskfolio-lib.readthedocs.io/en/latest/auxiliary.html#OwaWeights.owa_l_moment_crm.max_phi "OwaWeights.owa_l_moment_crm.max_phi (Python parameter) — Maximum weight constraint of L-moments. The default is 0.5.")
\=`0.5`_, _[solver](https://riskfolio-lib.readthedocs.io/en/latest/auxiliary.html#OwaWeights.owa_l_moment_crm.solver "OwaWeights.owa_l_moment_crm.solver (Python parameter) — Solver available for CVXPY.")
\=`'CLARABEL'`_)[\[source\]](https://riskfolio-lib.readthedocs.io/en/latest/_modules/OwaWeights.html#owa_l_moment_crm)
[¶](https://riskfolio-lib.readthedocs.io/en/latest/auxiliary.html#OwaWeights.owa_l_moment_crm "Link to this definition")
Calculate the OWA weights to calculate a convex risk measure that considers higher linear moments or L-moments as shown in \[[D9](https://riskfolio-lib.readthedocs.io/en/latest/auxiliary.html#id127 "Dany Cajas. Higher order moment portfolio optimization with l-moments. SSRN Electronic Journal, 2023. URL: https://papers.ssrn.com/sol3/papers.cfm?abstract_id=4393155, doi:10.2139/ssrn.4393155.")\
\].
Parameters:[¶](https://riskfolio-lib.readthedocs.io/en/latest/auxiliary.html#OwaWeights.owa_l_moment_crm-parameters "Permalink to this headline")
T : [int](https://docs.python.org/3.11/library/functions.html#int "(in Python v3.11)")
[¶](https://riskfolio-lib.readthedocs.io/en/latest/auxiliary.html#OwaWeights.owa_l_moment_crm.T "Permalink to this definition")
Number of observations of the returns series.
k : [int](https://docs.python.org/3.11/library/functions.html#int "(in Python v3.11)")
[¶](https://riskfolio-lib.readthedocs.io/en/latest/auxiliary.html#OwaWeights.owa_l_moment_crm.k "Permalink to this definition")
Order of the l-moment. Must be an integer higher or equal than 2.
method : [str](https://docs.python.org/3.11/library/stdtypes.html#str "(in Python v3.11)")
, optional[¶](https://riskfolio-lib.readthedocs.io/en/latest/auxiliary.html#OwaWeights.owa_l_moment_crm.method "Permalink to this definition")
Method to calculate the weights used to combine the l-moments with order higher than 2. The default value is ‘MSD’. Possible values are:
* ’CRRA’: Normalized Constant Relative Risk Aversion coefficients.
* ’ME’: Maximum Entropy.
* ’MSS’: Minimum Sum Squares.
* ’MSD’: Minimum Square Distance.
g : [float](https://docs.python.org/3.11/library/functions.html#float "(in Python v3.11)")
, optional[¶](https://riskfolio-lib.readthedocs.io/en/latest/auxiliary.html#OwaWeights.owa_l_moment_crm.g "Permalink to this definition")
Risk aversion coefficient of CRRA utility function. The default is 0.5.
max\_phi : [float](https://docs.python.org/3.11/library/functions.html#float "(in Python v3.11)")
, optional[¶](https://riskfolio-lib.readthedocs.io/en/latest/auxiliary.html#OwaWeights.owa_l_moment_crm.max_phi "Permalink to this definition")
Maximum weight constraint of L-moments. The default is 0.5.
solver : [str](https://docs.python.org/3.11/library/stdtypes.html#str "(in Python v3.11)")
, optional[¶](https://riskfolio-lib.readthedocs.io/en/latest/auxiliary.html#OwaWeights.owa_l_moment_crm.solver "Permalink to this definition")
Solver available for CVXPY. Used to calculate ‘ME’, ‘MSS’ and ‘MSD’ weights. The default value is ‘CLARABEL’.
Returns:[¶](https://riskfolio-lib.readthedocs.io/en/latest/auxiliary.html#OwaWeights.owa_l_moment_crm-returns "Permalink to this headline")
**value** – A OWA weights vector of size Tx1.
Return type:[¶](https://riskfolio-lib.readthedocs.io/en/latest/auxiliary.html#OwaWeights.owa_l_moment_crm-return-type "Permalink to this headline")
1d-array
Gerber Statistic Functions[¶](https://riskfolio-lib.readthedocs.io/en/latest/auxiliary.html#module-GerberStatistic "Link to this heading")
-------------------------------------------------------------------------------------------------------------------------------------------
GerberStatistic.gerber\_cov\_stat0(_[X](https://riskfolio-lib.readthedocs.io/en/latest/auxiliary.html#GerberStatistic.gerber_cov_stat0.X "GerberStatistic.gerber_cov_stat0.X (Python parameter) — Assets returns DataFrame, where n_samples is the number of observations and n_assets is the number of assets.")
_, _[threshold](https://riskfolio-lib.readthedocs.io/en/latest/auxiliary.html#GerberStatistic.gerber_cov_stat0.threshold "GerberStatistic.gerber_cov_stat0.threshold (Python parameter) — Threshold is between 0 and 1.")
\=`0.5`_)[\[source\]](https://riskfolio-lib.readthedocs.io/en/latest/_modules/GerberStatistic.html#gerber_cov_stat0)
[¶](https://riskfolio-lib.readthedocs.io/en/latest/auxiliary.html#GerberStatistic.gerber_cov_stat0 "Link to this definition")
Compute Gerber covariance Statistics 0 or original Gerber statistics \[[D4](https://riskfolio-lib.readthedocs.io/en/latest/auxiliary.html#id123 "Sander Gerber, Harry Markowitz, Philip Ernst, Yinsen Miao, Babak Javid, and Paul Sargen. The gerber statistic: a robust co-movement measure for portfolio optimization. SSRN Electronic Journal, 2021. URL: https://doi.org/10.2139/ssrn.3880054, doi:10.2139/ssrn.3880054.")\
\], not always PSD, however this function fixes the covariance matrix finding the nearest covariance matrix that is positive semidefinite.
Parameters:[¶](https://riskfolio-lib.readthedocs.io/en/latest/auxiliary.html#GerberStatistic.gerber_cov_stat0-parameters "Permalink to this headline")
X : DataFrame of shape (n\_samples, n\_assets), optional[¶](https://riskfolio-lib.readthedocs.io/en/latest/auxiliary.html#GerberStatistic.gerber_cov_stat0.X "Permalink to this definition")
Assets returns DataFrame, where n\_samples is the number of observations and n\_assets is the number of assets.
threshold : [float](https://docs.python.org/3.11/library/functions.html#float "(in Python v3.11)")
[¶](https://riskfolio-lib.readthedocs.io/en/latest/auxiliary.html#GerberStatistic.gerber_cov_stat0.threshold "Permalink to this definition")
Threshold is between 0 and 1.
Returns:[¶](https://riskfolio-lib.readthedocs.io/en/latest/auxiliary.html#GerberStatistic.gerber_cov_stat0-returns "Permalink to this headline")
**value** – Gerber covariance matrix of shape (n\_features, n\_features), where n\_features is the number of features.
Return type:[¶](https://riskfolio-lib.readthedocs.io/en/latest/auxiliary.html#GerberStatistic.gerber_cov_stat0-return-type "Permalink to this headline")
[bool](https://docs.python.org/3.11/library/functions.html#bool "(in Python v3.11)")
Raises:[¶](https://riskfolio-lib.readthedocs.io/en/latest/auxiliary.html#GerberStatistic.gerber_cov_stat0-raises "Permalink to this headline")
**ValueError when the value cannot be calculated.** –
GerberStatistic.gerber\_cov\_stat1(_[X](https://riskfolio-lib.readthedocs.io/en/latest/auxiliary.html#GerberStatistic.gerber_cov_stat1.X "GerberStatistic.gerber_cov_stat1.X (Python parameter) — Assets returns DataFrame, where n_samples is the number of observations and n_assets is the number of assets.")
_, _[threshold](https://riskfolio-lib.readthedocs.io/en/latest/auxiliary.html#GerberStatistic.gerber_cov_stat1.threshold "GerberStatistic.gerber_cov_stat1.threshold (Python parameter) — Threshold is between 0 and 1.")
\=`0.5`_)[\[source\]](https://riskfolio-lib.readthedocs.io/en/latest/_modules/GerberStatistic.html#gerber_cov_stat1)
[¶](https://riskfolio-lib.readthedocs.io/en/latest/auxiliary.html#GerberStatistic.gerber_cov_stat1 "Link to this definition")
Compute Gerber covariance Statistics 1 \[[D4](https://riskfolio-lib.readthedocs.io/en/latest/auxiliary.html#id123 "Sander Gerber, Harry Markowitz, Philip Ernst, Yinsen Miao, Babak Javid, and Paul Sargen. The gerber statistic: a robust co-movement measure for portfolio optimization. SSRN Electronic Journal, 2021. URL: https://doi.org/10.2139/ssrn.3880054, doi:10.2139/ssrn.3880054.")\
\].
Parameters:[¶](https://riskfolio-lib.readthedocs.io/en/latest/auxiliary.html#GerberStatistic.gerber_cov_stat1-parameters "Permalink to this headline")
X : DataFrame of shape (n\_samples, n\_assets), optional[¶](https://riskfolio-lib.readthedocs.io/en/latest/auxiliary.html#GerberStatistic.gerber_cov_stat1.X "Permalink to this definition")
Assets returns DataFrame, where n\_samples is the number of observations and n\_assets is the number of assets.
threshold : [float](https://docs.python.org/3.11/library/functions.html#float "(in Python v3.11)")
[¶](https://riskfolio-lib.readthedocs.io/en/latest/auxiliary.html#GerberStatistic.gerber_cov_stat1.threshold "Permalink to this definition")
Threshold is between 0 and 1.
Returns:[¶](https://riskfolio-lib.readthedocs.io/en/latest/auxiliary.html#GerberStatistic.gerber_cov_stat1-returns "Permalink to this headline")
**value** – Gerber covariance matrix of shape (n\_features, n\_features), where n\_features is the number of features.
Return type:[¶](https://riskfolio-lib.readthedocs.io/en/latest/auxiliary.html#GerberStatistic.gerber_cov_stat1-return-type "Permalink to this headline")
[bool](https://docs.python.org/3.11/library/functions.html#bool "(in Python v3.11)")
Raises:[¶](https://riskfolio-lib.readthedocs.io/en/latest/auxiliary.html#GerberStatistic.gerber_cov_stat1-raises "Permalink to this headline")
**ValueError when the value cannot be calculated.** –
GerberStatistic.gerber\_cov\_stat2(_[X](https://riskfolio-lib.readthedocs.io/en/latest/auxiliary.html#GerberStatistic.gerber_cov_stat2.X "GerberStatistic.gerber_cov_stat2.X (Python parameter) — Assets returns DataFrame, where n_samples is the number of observations and n_assets is the number of assets.")
_, _[threshold](https://riskfolio-lib.readthedocs.io/en/latest/auxiliary.html#GerberStatistic.gerber_cov_stat2.threshold "GerberStatistic.gerber_cov_stat2.threshold (Python parameter) — Threshold is between 0 and 1.")
\=`0.5`_)[\[source\]](https://riskfolio-lib.readthedocs.io/en/latest/_modules/GerberStatistic.html#gerber_cov_stat2)
[¶](https://riskfolio-lib.readthedocs.io/en/latest/auxiliary.html#GerberStatistic.gerber_cov_stat2 "Link to this definition")
Compute Gerber covariance Statistics 2 \[[D4](https://riskfolio-lib.readthedocs.io/en/latest/auxiliary.html#id123 "Sander Gerber, Harry Markowitz, Philip Ernst, Yinsen Miao, Babak Javid, and Paul Sargen. The gerber statistic: a robust co-movement measure for portfolio optimization. SSRN Electronic Journal, 2021. URL: https://doi.org/10.2139/ssrn.3880054, doi:10.2139/ssrn.3880054.")\
\].
Parameters:[¶](https://riskfolio-lib.readthedocs.io/en/latest/auxiliary.html#GerberStatistic.gerber_cov_stat2-parameters "Permalink to this headline")
X : : DataFrame of shape (n\_samples, n\_assets), optional[¶](https://riskfolio-lib.readthedocs.io/en/latest/auxiliary.html#GerberStatistic.gerber_cov_stat2.X "Permalink to this definition")
Assets returns DataFrame, where n\_samples is the number of observations and n\_assets is the number of assets.
threshold : [float](https://docs.python.org/3.11/library/functions.html#float "(in Python v3.11)")
[¶](https://riskfolio-lib.readthedocs.io/en/latest/auxiliary.html#GerberStatistic.gerber_cov_stat2.threshold "Permalink to this definition")
Threshold is between 0 and 1.
Returns:[¶](https://riskfolio-lib.readthedocs.io/en/latest/auxiliary.html#GerberStatistic.gerber_cov_stat2-returns "Permalink to this headline")
**value** – Gerber covariance mtrix of shape (n\_features, n\_features), where n\_features is the number of features.
Return type:[¶](https://riskfolio-lib.readthedocs.io/en/latest/auxiliary.html#GerberStatistic.gerber_cov_stat2-return-type "Permalink to this headline")
[bool](https://docs.python.org/3.11/library/functions.html#bool "(in Python v3.11)")
Raises:[¶](https://riskfolio-lib.readthedocs.io/en/latest/auxiliary.html#GerberStatistic.gerber_cov_stat2-raises "Permalink to this headline")
**ValueError when the value cannot be calculated.** –
CPP Functions[¶](https://riskfolio-lib.readthedocs.io/en/latest/auxiliary.html#module-cppfunctions "Link to this heading")
---------------------------------------------------------------------------------------------------------------------------
cppfunctions.duplication\_matrix(_[n](https://riskfolio-lib.readthedocs.io/en/latest/auxiliary.html#cppfunctions.duplication_matrix.n "cppfunctions.duplication_matrix.n (Python parameter) — Number of assets.")
: [int](https://docs.python.org/3.11/library/functions.html#int "(in Python v3.11)")
_, _[diag](https://riskfolio-lib.readthedocs.io/en/latest/auxiliary.html#cppfunctions.duplication_matrix "cppfunctions.duplication_matrix.diag (Python parameter)")
: [bool](https://docs.python.org/3.11/library/functions.html#bool "(in Python v3.11)")
\= `True`_)[\[source\]](https://riskfolio-lib.readthedocs.io/en/latest/_modules/cppfunctions.html#duplication_matrix)
[¶](https://riskfolio-lib.readthedocs.io/en/latest/auxiliary.html#cppfunctions.duplication_matrix "Link to this definition")
Calculate duplication matrix of size “n” as shown in \[[D5](https://riskfolio-lib.readthedocs.io/en/latest/auxiliary.html#id125 "Jan R. Magnus and H. Neudecker. The elimination matrix: some lemmas and applications. SIAM Journal on Algebraic Discrete Methods, 1(4):422-449, 1980. URL: https://doi.org/10.1137/0601049, arXiv:https://doi.org/10.1137/0601049, doi:10.1137/0601049.")\
\].
Parameters:[¶](https://riskfolio-lib.readthedocs.io/en/latest/auxiliary.html#cppfunctions.duplication_matrix-parameters "Permalink to this headline")
n : [int](https://docs.python.org/3.11/library/functions.html#int "(in Python v3.11)")
[¶](https://riskfolio-lib.readthedocs.io/en/latest/auxiliary.html#cppfunctions.duplication_matrix.n "Permalink to this definition")
Number of assets.
Returns:[¶](https://riskfolio-lib.readthedocs.io/en/latest/auxiliary.html#cppfunctions.duplication_matrix-returns "Permalink to this headline")
**D** – Duplication matrix
Return type:[¶](https://riskfolio-lib.readthedocs.io/en/latest/auxiliary.html#cppfunctions.duplication_matrix-return-type "Permalink to this headline")
np.ndarray
cppfunctions.duplication\_elimination\_matrix(_[n](https://riskfolio-lib.readthedocs.io/en/latest/auxiliary.html#cppfunctions.duplication_elimination_matrix.n "cppfunctions.duplication_elimination_matrix.n (Python parameter) — Number of assets.")
: [int](https://docs.python.org/3.11/library/functions.html#int "(in Python v3.11)")
_, _[diag](https://riskfolio-lib.readthedocs.io/en/latest/auxiliary.html#cppfunctions.duplication_elimination_matrix "cppfunctions.duplication_elimination_matrix.diag (Python parameter)")
: [bool](https://docs.python.org/3.11/library/functions.html#bool "(in Python v3.11)")
\= `True`_)[\[source\]](https://riskfolio-lib.readthedocs.io/en/latest/_modules/cppfunctions.html#duplication_elimination_matrix)
[¶](https://riskfolio-lib.readthedocs.io/en/latest/auxiliary.html#cppfunctions.duplication_elimination_matrix "Link to this definition")
Calculate duplication elimination matrix of size “n” as shown in \[[D5](https://riskfolio-lib.readthedocs.io/en/latest/auxiliary.html#id125 "Jan R. Magnus and H. Neudecker. The elimination matrix: some lemmas and applications. SIAM Journal on Algebraic Discrete Methods, 1(4):422-449, 1980. URL: https://doi.org/10.1137/0601049, arXiv:https://doi.org/10.1137/0601049, doi:10.1137/0601049.")\
\].
Parameters:[¶](https://riskfolio-lib.readthedocs.io/en/latest/auxiliary.html#cppfunctions.duplication_elimination_matrix-parameters "Permalink to this headline")
n : [int](https://docs.python.org/3.11/library/functions.html#int "(in Python v3.11)")
[¶](https://riskfolio-lib.readthedocs.io/en/latest/auxiliary.html#cppfunctions.duplication_elimination_matrix.n "Permalink to this definition")
Number of assets.
Returns:[¶](https://riskfolio-lib.readthedocs.io/en/latest/auxiliary.html#cppfunctions.duplication_elimination_matrix-returns "Permalink to this headline")
**L** – Duplication matrix
Return type:[¶](https://riskfolio-lib.readthedocs.io/en/latest/auxiliary.html#cppfunctions.duplication_elimination_matrix-return-type "Permalink to this headline")
np.ndarray
cppfunctions.duplication\_summation\_matrix(_[n](https://riskfolio-lib.readthedocs.io/en/latest/auxiliary.html#cppfunctions.duplication_summation_matrix.n "cppfunctions.duplication_summation_matrix.n (Python parameter) — Number of assets.")
: [int](https://docs.python.org/3.11/library/functions.html#int "(in Python v3.11)")
_, _[diag](https://riskfolio-lib.readthedocs.io/en/latest/auxiliary.html#cppfunctions.duplication_summation_matrix "cppfunctions.duplication_summation_matrix.diag (Python parameter)")
: [bool](https://docs.python.org/3.11/library/functions.html#bool "(in Python v3.11)")
\= `True`_)[\[source\]](https://riskfolio-lib.readthedocs.io/en/latest/_modules/cppfunctions.html#duplication_summation_matrix)
[¶](https://riskfolio-lib.readthedocs.io/en/latest/auxiliary.html#cppfunctions.duplication_summation_matrix "Link to this definition")
Calculate duplication summation matrix of size “n” as shown in \[[D6](https://riskfolio-lib.readthedocs.io/en/latest/auxiliary.html#id124 "Dany Cajas. Convex optimization of portfolio kurtosis. SSRN Electronic Journal, 2022. URL: https://doi.org/10.2139/ssrn.4202967, doi:10.2139/ssrn.4202967.")\
\].
Parameters:[¶](https://riskfolio-lib.readthedocs.io/en/latest/auxiliary.html#cppfunctions.duplication_summation_matrix-parameters "Permalink to this headline")
n : [int](https://docs.python.org/3.11/library/functions.html#int "(in Python v3.11)")
[¶](https://riskfolio-lib.readthedocs.io/en/latest/auxiliary.html#cppfunctions.duplication_summation_matrix.n "Permalink to this definition")
Number of assets.
Returns:[¶](https://riskfolio-lib.readthedocs.io/en/latest/auxiliary.html#cppfunctions.duplication_summation_matrix-returns "Permalink to this headline")
**S** – Duplication summation matrix.
Return type:[¶](https://riskfolio-lib.readthedocs.io/en/latest/auxiliary.html#cppfunctions.duplication_summation_matrix-return-type "Permalink to this headline")
np.ndarray
cppfunctions.commutation\_matrix(_[T](https://riskfolio-lib.readthedocs.io/en/latest/auxiliary.html#cppfunctions.commutation_matrix.T "cppfunctions.commutation_matrix.T (Python parameter) — Number of rows.")
: [int](https://docs.python.org/3.11/library/functions.html#int "(in Python v3.11)")
_, _[n](https://riskfolio-lib.readthedocs.io/en/latest/auxiliary.html#cppfunctions.commutation_matrix.n "cppfunctions.commutation_matrix.n (Python parameter) — Number of columns.")
: [int](https://docs.python.org/3.11/library/functions.html#int "(in Python v3.11)")
_)[\[source\]](https://riskfolio-lib.readthedocs.io/en/latest/_modules/cppfunctions.html#commutation_matrix)
[¶](https://riskfolio-lib.readthedocs.io/en/latest/auxiliary.html#cppfunctions.commutation_matrix "Link to this definition")
Calculate commutation matrix of size T x n.
Parameters:[¶](https://riskfolio-lib.readthedocs.io/en/latest/auxiliary.html#cppfunctions.commutation_matrix-parameters "Permalink to this headline")
T : [int](https://docs.python.org/3.11/library/functions.html#int "(in Python v3.11)")
[¶](https://riskfolio-lib.readthedocs.io/en/latest/auxiliary.html#cppfunctions.commutation_matrix.T "Permalink to this definition")
Number of rows.
n : [int](https://docs.python.org/3.11/library/functions.html#int "(in Python v3.11)")
[¶](https://riskfolio-lib.readthedocs.io/en/latest/auxiliary.html#cppfunctions.commutation_matrix.n "Permalink to this definition")
Number of columns.
Returns:[¶](https://riskfolio-lib.readthedocs.io/en/latest/auxiliary.html#cppfunctions.commutation_matrix-returns "Permalink to this headline")
**K** – Duplication summation matrix.
Return type:[¶](https://riskfolio-lib.readthedocs.io/en/latest/auxiliary.html#cppfunctions.commutation_matrix-return-type "Permalink to this headline")
np.ndarray
cppfunctions.coskewness\_matrix(_[Y](https://riskfolio-lib.readthedocs.io/en/latest/auxiliary.html#cppfunctions.coskewness_matrix.Y "cppfunctions.coskewness_matrix.Y (Python parameter) — Returns series of shape n_sample x n_features.")
: [ndarray](https://numpy.org/doc/stable/reference/generated/numpy.ndarray.html#numpy.ndarray "(in NumPy v2.4)")
_)[\[source\]](https://riskfolio-lib.readthedocs.io/en/latest/_modules/cppfunctions.html#coskewness_matrix)
[¶](https://riskfolio-lib.readthedocs.io/en/latest/auxiliary.html#cppfunctions.coskewness_matrix "Link to this definition")
Calculates coskewness rectangular matrix as shown in \[[D6](https://riskfolio-lib.readthedocs.io/en/latest/auxiliary.html#id124 "Dany Cajas. Convex optimization of portfolio kurtosis. SSRN Electronic Journal, 2022. URL: https://doi.org/10.2139/ssrn.4202967, doi:10.2139/ssrn.4202967.")\
\].
Parameters:[¶](https://riskfolio-lib.readthedocs.io/en/latest/auxiliary.html#cppfunctions.coskewness_matrix-parameters "Permalink to this headline")
Y : ndarray or dataframe[¶](https://riskfolio-lib.readthedocs.io/en/latest/auxiliary.html#cppfunctions.coskewness_matrix.Y "Permalink to this definition")
Returns series of shape n\_sample x n\_features.
Returns:[¶](https://riskfolio-lib.readthedocs.io/en/latest/auxiliary.html#cppfunctions.coskewness_matrix-returns "Permalink to this headline")
**M3** – The lower semi coskewness rectangular matrix.
Return type:[¶](https://riskfolio-lib.readthedocs.io/en/latest/auxiliary.html#cppfunctions.coskewness_matrix-return-type "Permalink to this headline")
ndarray
Raises:[¶](https://riskfolio-lib.readthedocs.io/en/latest/auxiliary.html#cppfunctions.coskewness_matrix-raises "Permalink to this headline")
**ValueError when the value cannot be calculated.** –
cppfunctions.semi\_coskewness\_matrix(_[Y](https://riskfolio-lib.readthedocs.io/en/latest/auxiliary.html#cppfunctions.semi_coskewness_matrix.Y "cppfunctions.semi_coskewness_matrix.Y (Python parameter) — Returns series of shape n_samples x n_features.")
: [ndarray](https://numpy.org/doc/stable/reference/generated/numpy.ndarray.html#numpy.ndarray "(in NumPy v2.4)")
_)[\[source\]](https://riskfolio-lib.readthedocs.io/en/latest/_modules/cppfunctions.html#semi_coskewness_matrix)
[¶](https://riskfolio-lib.readthedocs.io/en/latest/auxiliary.html#cppfunctions.semi_coskewness_matrix "Link to this definition")
Calculates lower semi coskewness rectangular matrix as shown in \[[D6](https://riskfolio-lib.readthedocs.io/en/latest/auxiliary.html#id124 "Dany Cajas. Convex optimization of portfolio kurtosis. SSRN Electronic Journal, 2022. URL: https://doi.org/10.2139/ssrn.4202967, doi:10.2139/ssrn.4202967.")\
\].
Parameters:[¶](https://riskfolio-lib.readthedocs.io/en/latest/auxiliary.html#cppfunctions.semi_coskewness_matrix-parameters "Permalink to this headline")
Y : ndarray or dataframe[¶](https://riskfolio-lib.readthedocs.io/en/latest/auxiliary.html#cppfunctions.semi_coskewness_matrix.Y "Permalink to this definition")
Returns series of shape n\_samples x n\_features.
Returns:[¶](https://riskfolio-lib.readthedocs.io/en/latest/auxiliary.html#cppfunctions.semi_coskewness_matrix-returns "Permalink to this headline")
**s\_M3** – The lower semi coskewness rectangular matrix.
Return type:[¶](https://riskfolio-lib.readthedocs.io/en/latest/auxiliary.html#cppfunctions.semi_coskewness_matrix-return-type "Permalink to this headline")
ndarray
Raises:[¶](https://riskfolio-lib.readthedocs.io/en/latest/auxiliary.html#cppfunctions.semi_coskewness_matrix-raises "Permalink to this headline")
**ValueError when the value cannot be calculated.** –
cppfunctions.cokurtosis\_matrix(_[Y](https://riskfolio-lib.readthedocs.io/en/latest/auxiliary.html#cppfunctions.cokurtosis_matrix.Y "cppfunctions.cokurtosis_matrix.Y (Python parameter) — Returns series of shape n_samples x n_features.")
: [ndarray](https://numpy.org/doc/stable/reference/generated/numpy.ndarray.html#numpy.ndarray "(in NumPy v2.4)")
_)[\[source\]](https://riskfolio-lib.readthedocs.io/en/latest/_modules/cppfunctions.html#cokurtosis_matrix)
[¶](https://riskfolio-lib.readthedocs.io/en/latest/auxiliary.html#cppfunctions.cokurtosis_matrix "Link to this definition")
Calculates cokurtosis square matrix as shown in \[[D6](https://riskfolio-lib.readthedocs.io/en/latest/auxiliary.html#id124 "Dany Cajas. Convex optimization of portfolio kurtosis. SSRN Electronic Journal, 2022. URL: https://doi.org/10.2139/ssrn.4202967, doi:10.2139/ssrn.4202967.")\
\].
Parameters:[¶](https://riskfolio-lib.readthedocs.io/en/latest/auxiliary.html#cppfunctions.cokurtosis_matrix-parameters "Permalink to this headline")
Y : ndarray or dataframe[¶](https://riskfolio-lib.readthedocs.io/en/latest/auxiliary.html#cppfunctions.cokurtosis_matrix.Y "Permalink to this definition")
Returns series of shape n\_samples x n\_features.
Returns:[¶](https://riskfolio-lib.readthedocs.io/en/latest/auxiliary.html#cppfunctions.cokurtosis_matrix-returns "Permalink to this headline")
**S4** – The cokurtosis square matrix.
Return type:[¶](https://riskfolio-lib.readthedocs.io/en/latest/auxiliary.html#cppfunctions.cokurtosis_matrix-return-type "Permalink to this headline")
ndarray
Raises:[¶](https://riskfolio-lib.readthedocs.io/en/latest/auxiliary.html#cppfunctions.cokurtosis_matrix-raises "Permalink to this headline")
**ValueError when the value cannot be calculated.** –
cppfunctions.semi\_cokurtosis\_matrix(_[Y](https://riskfolio-lib.readthedocs.io/en/latest/auxiliary.html#cppfunctions.semi_cokurtosis_matrix.Y "cppfunctions.semi_cokurtosis_matrix.Y (Python parameter) — Returns series of shape n_sample x n_features.")
: [ndarray](https://numpy.org/doc/stable/reference/generated/numpy.ndarray.html#numpy.ndarray "(in NumPy v2.4)")
_)[\[source\]](https://riskfolio-lib.readthedocs.io/en/latest/_modules/cppfunctions.html#semi_cokurtosis_matrix)
[¶](https://riskfolio-lib.readthedocs.io/en/latest/auxiliary.html#cppfunctions.semi_cokurtosis_matrix "Link to this definition")
Calculates lower semi cokurtosis square matrix as shown in \[[D6](https://riskfolio-lib.readthedocs.io/en/latest/auxiliary.html#id124 "Dany Cajas. Convex optimization of portfolio kurtosis. SSRN Electronic Journal, 2022. URL: https://doi.org/10.2139/ssrn.4202967, doi:10.2139/ssrn.4202967.")\
\].
Parameters:[¶](https://riskfolio-lib.readthedocs.io/en/latest/auxiliary.html#cppfunctions.semi_cokurtosis_matrix-parameters "Permalink to this headline")
Y : ndarray or dataframe[¶](https://riskfolio-lib.readthedocs.io/en/latest/auxiliary.html#cppfunctions.semi_cokurtosis_matrix.Y "Permalink to this definition")
Returns series of shape n\_sample x n\_features.
Returns:[¶](https://riskfolio-lib.readthedocs.io/en/latest/auxiliary.html#cppfunctions.semi_cokurtosis_matrix-returns "Permalink to this headline")
**s\_S4** – The lower semi cokurtosis square matrix.
Return type:[¶](https://riskfolio-lib.readthedocs.io/en/latest/auxiliary.html#cppfunctions.semi_cokurtosis_matrix-return-type "Permalink to this headline")
ndarray
Raises:[¶](https://riskfolio-lib.readthedocs.io/en/latest/auxiliary.html#cppfunctions.semi_cokurtosis_matrix-raises "Permalink to this headline")
**ValueError when the value cannot be calculated.** –
cppfunctions.k\_eigh(_[Y](https://riskfolio-lib.readthedocs.io/en/latest/auxiliary.html#cppfunctions.k_eigh.Y "cppfunctions.k_eigh.Y (Python parameter) — Returns series of shape n_sample x n_features.")
: [ndarray](https://numpy.org/doc/stable/reference/generated/numpy.ndarray.html#numpy.ndarray "(in NumPy v2.4)")
_, _[k](https://riskfolio-lib.readthedocs.io/en/latest/auxiliary.html#cppfunctions.k_eigh "cppfunctions.k_eigh.k (Python parameter)")
: [int](https://docs.python.org/3.11/library/functions.html#int "(in Python v3.11)")
_)[\[source\]](https://riskfolio-lib.readthedocs.io/en/latest/_modules/cppfunctions.html#k_eigh)
[¶](https://riskfolio-lib.readthedocs.io/en/latest/auxiliary.html#cppfunctions.k_eigh "Link to this definition")
Calculates lower semi cokurtosis square matrix as shown in \[[D6](https://riskfolio-lib.readthedocs.io/en/latest/auxiliary.html#id124 "Dany Cajas. Convex optimization of portfolio kurtosis. SSRN Electronic Journal, 2022. URL: https://doi.org/10.2139/ssrn.4202967, doi:10.2139/ssrn.4202967.")\
\].
Parameters:[¶](https://riskfolio-lib.readthedocs.io/en/latest/auxiliary.html#cppfunctions.k_eigh-parameters "Permalink to this headline")
Y : ndarray or dataframe[¶](https://riskfolio-lib.readthedocs.io/en/latest/auxiliary.html#cppfunctions.k_eigh.Y "Permalink to this definition")
Returns series of shape n\_sample x n\_features.
Returns:[¶](https://riskfolio-lib.readthedocs.io/en/latest/auxiliary.html#cppfunctions.k_eigh-returns "Permalink to this headline")
**s\_S4** – The lower semi cokurtosis square matrix.
Return type:[¶](https://riskfolio-lib.readthedocs.io/en/latest/auxiliary.html#cppfunctions.k_eigh-return-type "Permalink to this headline")
ndarray
Raises:[¶](https://riskfolio-lib.readthedocs.io/en/latest/auxiliary.html#cppfunctions.k_eigh-raises "Permalink to this headline")
**ValueError when the value cannot be calculated.** –
cppfunctions.d\_corr(_[X](https://riskfolio-lib.readthedocs.io/en/latest/auxiliary.html#cppfunctions.d_corr.X "cppfunctions.d_corr.X (Python parameter) — Returns series of shape n_sample x n_features.")
: [ndarray](https://numpy.org/doc/stable/reference/generated/numpy.ndarray.html#numpy.ndarray "(in NumPy v2.4)")
_, _[Y](https://riskfolio-lib.readthedocs.io/en/latest/auxiliary.html#cppfunctions.d_corr.Y "cppfunctions.d_corr.Y (Python parameter) — Returns series of shape n_sample x n_features.")
: [ndarray](https://numpy.org/doc/stable/reference/generated/numpy.ndarray.html#numpy.ndarray "(in NumPy v2.4)")
_)[\[source\]](https://riskfolio-lib.readthedocs.io/en/latest/_modules/cppfunctions.html#d_corr)
[¶](https://riskfolio-lib.readthedocs.io/en/latest/auxiliary.html#cppfunctions.d_corr "Link to this definition")
Calculates the distance correlation of X and Y.
Parameters:[¶](https://riskfolio-lib.readthedocs.io/en/latest/auxiliary.html#cppfunctions.d_corr-parameters "Permalink to this headline")
X : ndarray or dataframe[¶](https://riskfolio-lib.readthedocs.io/en/latest/auxiliary.html#cppfunctions.d_corr.X "Permalink to this definition")
Returns series of shape n\_sample x n\_features.
Y : ndarray or dataframe[¶](https://riskfolio-lib.readthedocs.io/en/latest/auxiliary.html#cppfunctions.d_corr.Y "Permalink to this definition")
Returns series of shape n\_sample x n\_features.
Returns:[¶](https://riskfolio-lib.readthedocs.io/en/latest/auxiliary.html#cppfunctions.d_corr-returns "Permalink to this headline")
**value** – Distance correlation.
Return type:[¶](https://riskfolio-lib.readthedocs.io/en/latest/auxiliary.html#cppfunctions.d_corr-return-type "Permalink to this headline")
[float](https://docs.python.org/3.11/library/functions.html#float "(in Python v3.11)")
Raises:[¶](https://riskfolio-lib.readthedocs.io/en/latest/auxiliary.html#cppfunctions.d_corr-raises "Permalink to this headline")
**ValueError when the value cannot be calculated.** –
cppfunctions.d\_corr\_matrix(_[Y](https://riskfolio-lib.readthedocs.io/en/latest/auxiliary.html#cppfunctions.d_corr_matrix.Y "cppfunctions.d_corr_matrix.Y (Python parameter) — Returns series of shape n_sample x n_features.")
: [ndarray](https://numpy.org/doc/stable/reference/generated/numpy.ndarray.html#numpy.ndarray "(in NumPy v2.4)")
_)[\[source\]](https://riskfolio-lib.readthedocs.io/en/latest/_modules/cppfunctions.html#d_corr_matrix)
[¶](https://riskfolio-lib.readthedocs.io/en/latest/auxiliary.html#cppfunctions.d_corr_matrix "Link to this definition")
Calculates the distance correlation matrix of matrix of variables Y.
Parameters:[¶](https://riskfolio-lib.readthedocs.io/en/latest/auxiliary.html#cppfunctions.d_corr_matrix-parameters "Permalink to this headline")
Y : ndarray or dataframe[¶](https://riskfolio-lib.readthedocs.io/en/latest/auxiliary.html#cppfunctions.d_corr_matrix.Y "Permalink to this definition")
Returns series of shape n\_sample x n\_features.
Returns:[¶](https://riskfolio-lib.readthedocs.io/en/latest/auxiliary.html#cppfunctions.d_corr_matrix-returns "Permalink to this headline")
**value** – Distance correlation.
Return type:[¶](https://riskfolio-lib.readthedocs.io/en/latest/auxiliary.html#cppfunctions.d_corr_matrix-return-type "Permalink to this headline")
[float](https://docs.python.org/3.11/library/functions.html#float "(in Python v3.11)")
Raises:[¶](https://riskfolio-lib.readthedocs.io/en/latest/auxiliary.html#cppfunctions.d_corr_matrix-raises "Permalink to this headline")
**ValueError when the value cannot be calculated.** –
cppfunctions.residuals\_coskewness\_fm(_[residuals](https://riskfolio-lib.readthedocs.io/en/latest/auxiliary.html#cppfunctions.residuals_coskewness_fm.residuals "cppfunctions.residuals_coskewness_fm.residuals (Python parameter) — Ndarray or DataFrame of residuals of the risk factors model of shape n_samples x 1.")
: [ndarray](https://numpy.org/doc/stable/reference/generated/numpy.ndarray.html#numpy.ndarray "(in NumPy v2.4)")
_)[\[source\]](https://riskfolio-lib.readthedocs.io/en/latest/_modules/cppfunctions.html#residuals_coskewness_fm)
[¶](https://riskfolio-lib.readthedocs.io/en/latest/auxiliary.html#cppfunctions.residuals_coskewness_fm "Link to this definition")
Calculates the coskewness tensor of residuals of a risk factors model.
Parameters:[¶](https://riskfolio-lib.readthedocs.io/en/latest/auxiliary.html#cppfunctions.residuals_coskewness_fm-parameters "Permalink to this headline")
residuals : ndarray or dataframe[¶](https://riskfolio-lib.readthedocs.io/en/latest/auxiliary.html#cppfunctions.residuals_coskewness_fm.residuals "Permalink to this definition")
Ndarray or DataFrame of residuals of the risk factors model of shape n\_samples x 1.
Returns:[¶](https://riskfolio-lib.readthedocs.io/en/latest/auxiliary.html#cppfunctions.residuals_coskewness_fm-returns "Permalink to this headline")
**value** – Coskewness tensor of residuals of a risk factors model.
Return type:[¶](https://riskfolio-lib.readthedocs.io/en/latest/auxiliary.html#cppfunctions.residuals_coskewness_fm-return-type "Permalink to this headline")
[float](https://docs.python.org/3.11/library/functions.html#float "(in Python v3.11)")
Raises:[¶](https://riskfolio-lib.readthedocs.io/en/latest/auxiliary.html#cppfunctions.residuals_coskewness_fm-raises "Permalink to this headline")
**ValueError when the value cannot be calculated.** –
cppfunctions.residuals\_cokurtosis\_fm(_[B](https://riskfolio-lib.readthedocs.io/en/latest/auxiliary.html#cppfunctions.residuals_cokurtosis_fm.B "cppfunctions.residuals_cokurtosis_fm.B (Python parameter) — The loadings matrix.")
: [ndarray](https://numpy.org/doc/stable/reference/generated/numpy.ndarray.html#numpy.ndarray "(in NumPy v2.4)")
_, _[S\_f](https://riskfolio-lib.readthedocs.io/en/latest/auxiliary.html#cppfunctions.residuals_cokurtosis_fm.S_f "cppfunctions.residuals_cokurtosis_fm.S_f (Python parameter) — Covariance matrix of the risk factors.")
: [ndarray](https://numpy.org/doc/stable/reference/generated/numpy.ndarray.html#numpy.ndarray "(in NumPy v2.4)")
_, _[residuals](https://riskfolio-lib.readthedocs.io/en/latest/auxiliary.html#cppfunctions.residuals_cokurtosis_fm.residuals "cppfunctions.residuals_cokurtosis_fm.residuals (Python parameter) — Ndarray or DataFrame of residuals of the risk factors model of shape n_samples x 1.")
: [ndarray](https://numpy.org/doc/stable/reference/generated/numpy.ndarray.html#numpy.ndarray "(in NumPy v2.4)")
_)[\[source\]](https://riskfolio-lib.readthedocs.io/en/latest/_modules/cppfunctions.html#residuals_cokurtosis_fm)
[¶](https://riskfolio-lib.readthedocs.io/en/latest/auxiliary.html#cppfunctions.residuals_cokurtosis_fm "Link to this definition")
Calculates the cokurtosis square matrix of residuals of a risk factors model.
Parameters:[¶](https://riskfolio-lib.readthedocs.io/en/latest/auxiliary.html#cppfunctions.residuals_cokurtosis_fm-parameters "Permalink to this headline")
B : ndarray or dataframe[¶](https://riskfolio-lib.readthedocs.io/en/latest/auxiliary.html#cppfunctions.residuals_cokurtosis_fm.B "Permalink to this definition")
The loadings matrix.
S\_f : ndarray or dataframe[¶](https://riskfolio-lib.readthedocs.io/en/latest/auxiliary.html#cppfunctions.residuals_cokurtosis_fm.S_f "Permalink to this definition")
Covariance matrix of the risk factors.
residuals : ndarray or dataframe[¶](https://riskfolio-lib.readthedocs.io/en/latest/auxiliary.html#cppfunctions.residuals_cokurtosis_fm.residuals "Permalink to this definition")
Ndarray or DataFrame of residuals of the risk factors model of shape n\_samples x 1.
Returns:[¶](https://riskfolio-lib.readthedocs.io/en/latest/auxiliary.html#cppfunctions.residuals_cokurtosis_fm-returns "Permalink to this headline")
**value** – Cokurtosis square matrix of residuals of a risk factors model.
Return type:[¶](https://riskfolio-lib.readthedocs.io/en/latest/auxiliary.html#cppfunctions.residuals_cokurtosis_fm-return-type "Permalink to this headline")
[float](https://docs.python.org/3.11/library/functions.html#float "(in Python v3.11)")
Raises:[¶](https://riskfolio-lib.readthedocs.io/en/latest/auxiliary.html#cppfunctions.residuals_cokurtosis_fm-raises "Permalink to this headline")
**ValueError when the value cannot be calculated.** –
Auxiliary Functions[¶](https://riskfolio-lib.readthedocs.io/en/latest/auxiliary.html#module-AuxFunctions "Link to this heading")
---------------------------------------------------------------------------------------------------------------------------------
AuxFunctions.is\_pos\_def(_[cov](https://riskfolio-lib.readthedocs.io/en/latest/auxiliary.html#AuxFunctions.is_pos_def.cov "AuxFunctions.is_pos_def.cov (Python parameter) — Covariance matrix, where n_assets is the number of assets.")
_, _[threshold](https://riskfolio-lib.readthedocs.io/en/latest/auxiliary.html#AuxFunctions.is_pos_def "AuxFunctions.is_pos_def.threshold (Python parameter)")
\=`1e-08`_)[\[source\]](https://riskfolio-lib.readthedocs.io/en/latest/_modules/AuxFunctions.html#is_pos_def)
[¶](https://riskfolio-lib.readthedocs.io/en/latest/auxiliary.html#AuxFunctions.is_pos_def "Link to this definition")
Indicate if a matrix is positive (semi)definite.
Parameters:[¶](https://riskfolio-lib.readthedocs.io/en/latest/auxiliary.html#AuxFunctions.is_pos_def-parameters "Permalink to this headline")
cov : DataFrame of shape (n\_assets, n\_assets)[¶](https://riskfolio-lib.readthedocs.io/en/latest/auxiliary.html#AuxFunctions.is_pos_def.cov "Permalink to this definition")
Covariance matrix, where n\_assets is the number of assets.
Returns:[¶](https://riskfolio-lib.readthedocs.io/en/latest/auxiliary.html#AuxFunctions.is_pos_def-returns "Permalink to this headline")
**value** – True if matrix is positive (semi)definite.
Return type:[¶](https://riskfolio-lib.readthedocs.io/en/latest/auxiliary.html#AuxFunctions.is_pos_def-return-type "Permalink to this headline")
[bool](https://docs.python.org/3.11/library/functions.html#bool "(in Python v3.11)")
Raises:[¶](https://riskfolio-lib.readthedocs.io/en/latest/auxiliary.html#AuxFunctions.is_pos_def-raises "Permalink to this headline")
**ValueError when the value cannot be calculated.** –
AuxFunctions.cov2corr(_[cov](https://riskfolio-lib.readthedocs.io/en/latest/auxiliary.html#AuxFunctions.cov2corr.cov "AuxFunctions.cov2corr.cov (Python parameter) — Covariance matrix, where n_assets is the number of assets.")
_)[\[source\]](https://riskfolio-lib.readthedocs.io/en/latest/_modules/AuxFunctions.html#cov2corr)
[¶](https://riskfolio-lib.readthedocs.io/en/latest/auxiliary.html#AuxFunctions.cov2corr "Link to this definition")
Generate a correlation matrix from a covariance matrix cov.
Parameters:[¶](https://riskfolio-lib.readthedocs.io/en/latest/auxiliary.html#AuxFunctions.cov2corr-parameters "Permalink to this headline")
cov : DataFrame of shape (n\_assets, n\_assets)[¶](https://riskfolio-lib.readthedocs.io/en/latest/auxiliary.html#AuxFunctions.cov2corr.cov "Permalink to this definition")
Covariance matrix, where n\_assets is the number of assets.
Returns:[¶](https://riskfolio-lib.readthedocs.io/en/latest/auxiliary.html#AuxFunctions.cov2corr-returns "Permalink to this headline")
**corr** – A correlation matrix.
Return type:[¶](https://riskfolio-lib.readthedocs.io/en/latest/auxiliary.html#AuxFunctions.cov2corr-return-type "Permalink to this headline")
ndarray
Raises:[¶](https://riskfolio-lib.readthedocs.io/en/latest/auxiliary.html#AuxFunctions.cov2corr-raises "Permalink to this headline")
**ValueError when the value cannot be calculated.** –
AuxFunctions.corr2cov(_[corr](https://riskfolio-lib.readthedocs.io/en/latest/auxiliary.html#AuxFunctions.corr2cov.corr "AuxFunctions.corr2cov.corr (Python parameter) — Covariance matrix, where n_assets is the number of assets.")
_, _[std](https://riskfolio-lib.readthedocs.io/en/latest/auxiliary.html#AuxFunctions.corr2cov.std "AuxFunctions.corr2cov.std (Python parameter) — Assets standard deviation vector of size n_features, where n_features is the number of features.")
_)[\[source\]](https://riskfolio-lib.readthedocs.io/en/latest/_modules/AuxFunctions.html#corr2cov)
[¶](https://riskfolio-lib.readthedocs.io/en/latest/auxiliary.html#AuxFunctions.corr2cov "Link to this definition")
Generate a covariance matrix from a correlation matrix corr and a standard deviation vector std.
Parameters:[¶](https://riskfolio-lib.readthedocs.io/en/latest/auxiliary.html#AuxFunctions.corr2cov-parameters "Permalink to this headline")
corr : DataFrame of shape (n\_assets, n\_assets)[¶](https://riskfolio-lib.readthedocs.io/en/latest/auxiliary.html#AuxFunctions.corr2cov.corr "Permalink to this definition")
Covariance matrix, where n\_assets is the number of assets.
std : 1darray[¶](https://riskfolio-lib.readthedocs.io/en/latest/auxiliary.html#AuxFunctions.corr2cov.std "Permalink to this definition")
Assets standard deviation vector of size n\_features, where n\_features is the number of features.
Returns:[¶](https://riskfolio-lib.readthedocs.io/en/latest/auxiliary.html#AuxFunctions.corr2cov-returns "Permalink to this headline")
**cov** – A covariance matrix.
Return type:[¶](https://riskfolio-lib.readthedocs.io/en/latest/auxiliary.html#AuxFunctions.corr2cov-return-type "Permalink to this headline")
ndarray
Raises:[¶](https://riskfolio-lib.readthedocs.io/en/latest/auxiliary.html#AuxFunctions.corr2cov-raises "Permalink to this headline")
**ValueError when the value cannot be calculated.** –
AuxFunctions.cov\_fix(_[cov](https://riskfolio-lib.readthedocs.io/en/latest/auxiliary.html#AuxFunctions.cov_fix.cov "AuxFunctions.cov_fix.cov (Python parameter) — Covariance matrix, where n_assets is the number of assets.")
_, _[method](https://riskfolio-lib.readthedocs.io/en/latest/auxiliary.html#AuxFunctions.cov_fix.method "AuxFunctions.cov_fix.method (Python parameter) — The default value is 'clipped', see more in cov_nearest.")
\=`'clipped'`_, _[threshold](https://riskfolio-lib.readthedocs.io/en/latest/auxiliary.html#AuxFunctions.cov_fix.threshold "AuxFunctions.cov_fix.threshold (Python parameter) — Clipping threshold for smallest eigen value.")
\=`1e-08`_)[\[source\]](https://riskfolio-lib.readthedocs.io/en/latest/_modules/AuxFunctions.html#cov_fix)
[¶](https://riskfolio-lib.readthedocs.io/en/latest/auxiliary.html#AuxFunctions.cov_fix "Link to this definition")
Fix a covariance matrix to a positive definite matrix.
Parameters:[¶](https://riskfolio-lib.readthedocs.io/en/latest/auxiliary.html#AuxFunctions.cov_fix-parameters "Permalink to this headline")
cov : DataFrame of shape (n\_assets, n\_assets)[¶](https://riskfolio-lib.readthedocs.io/en/latest/auxiliary.html#AuxFunctions.cov_fix.cov "Permalink to this definition")
Covariance matrix, where n\_assets is the number of assets.
method : [str](https://docs.python.org/3.11/library/stdtypes.html#str "(in Python v3.11)")
[¶](https://riskfolio-lib.readthedocs.io/en/latest/auxiliary.html#AuxFunctions.cov_fix.method "Permalink to this definition")
The default value is ‘clipped’, see more in [cov\_nearest](https://www.statsmodels.org/stable/generated/statsmodels.stats.correlation_tools.cov_nearest.html)
.
threshold\=`1e-08`[¶](https://riskfolio-lib.readthedocs.io/en/latest/auxiliary.html#AuxFunctions.cov_fix.threshold "Permalink to this definition")
Clipping threshold for smallest eigen value.
Returns:[¶](https://riskfolio-lib.readthedocs.io/en/latest/auxiliary.html#AuxFunctions.cov_fix-returns "Permalink to this headline")
**cov\_** – A positive definite covariance matrix.
Return type:[¶](https://riskfolio-lib.readthedocs.io/en/latest/auxiliary.html#AuxFunctions.cov_fix-return-type "Permalink to this headline")
[bool](https://docs.python.org/3.11/library/functions.html#bool "(in Python v3.11)")
Raises:[¶](https://riskfolio-lib.readthedocs.io/en/latest/auxiliary.html#AuxFunctions.cov_fix-raises "Permalink to this headline")
**ValueError when the value cannot be calculated.** –
AuxFunctions.cov\_returns(_[cov](https://riskfolio-lib.readthedocs.io/en/latest/auxiliary.html#AuxFunctions.cov_returns.cov "AuxFunctions.cov_returns.cov (Python parameter) — Covariance matrix, where n_assets is the number of assets.")
_, _[seed](https://riskfolio-lib.readthedocs.io/en/latest/auxiliary.html#AuxFunctions.cov_returns "AuxFunctions.cov_returns.seed (Python parameter)")
\=`0`_)[\[source\]](https://riskfolio-lib.readthedocs.io/en/latest/_modules/AuxFunctions.html#cov_returns)
[¶](https://riskfolio-lib.readthedocs.io/en/latest/auxiliary.html#AuxFunctions.cov_returns "Link to this definition")
Generate a matrix of returns that have a covariance matrix cov.
Parameters:[¶](https://riskfolio-lib.readthedocs.io/en/latest/auxiliary.html#AuxFunctions.cov_returns-parameters "Permalink to this headline")
cov : DataFrame of shape (n\_assets, n\_assets)[¶](https://riskfolio-lib.readthedocs.io/en/latest/auxiliary.html#AuxFunctions.cov_returns.cov "Permalink to this definition")
Covariance matrix, where n\_assets is the number of assets.
Returns:[¶](https://riskfolio-lib.readthedocs.io/en/latest/auxiliary.html#AuxFunctions.cov_returns-returns "Permalink to this headline")
**a** – A matrix of returns that have a covariance matrix cov.
Return type:[¶](https://riskfolio-lib.readthedocs.io/en/latest/auxiliary.html#AuxFunctions.cov_returns-return-type "Permalink to this headline")
ndarray
Raises:[¶](https://riskfolio-lib.readthedocs.io/en/latest/auxiliary.html#AuxFunctions.cov_returns-raises "Permalink to this headline")
**ValueError when the value cannot be calculated.** –
AuxFunctions.block\_vec\_pq(_[A](https://riskfolio-lib.readthedocs.io/en/latest/auxiliary.html#AuxFunctions.block_vec_pq.A "AuxFunctions.block_vec_pq.A (Python parameter) — Matrix that will be block vectorized.")
_, _[p](https://riskfolio-lib.readthedocs.io/en/latest/auxiliary.html#AuxFunctions.block_vec_pq.p "AuxFunctions.block_vec_pq.p (Python parameter) — Order p of block vectorization operator.")
_, _[q](https://riskfolio-lib.readthedocs.io/en/latest/auxiliary.html#AuxFunctions.block_vec_pq.q "AuxFunctions.block_vec_pq.q (Python parameter) — Order q of block vectorization operator.")
_)[\[source\]](https://riskfolio-lib.readthedocs.io/en/latest/_modules/AuxFunctions.html#block_vec_pq)
[¶](https://riskfolio-lib.readthedocs.io/en/latest/auxiliary.html#AuxFunctions.block_vec_pq "Link to this definition")
Calculates block vectorization operator as shown in \[[D10](https://riskfolio-lib.readthedocs.io/en/latest/auxiliary.html#id139 "C. F. Van Loan and N. Pitsianis. Approximation with Kronecker Products, pages 293–314. Springer Netherlands, Dordrecht, 1993. URL: https://doi.org/10.1007/978-94-015-8196-7\_17, doi:10.1007/978-94-015-8196-7\_17.")\
\] and \[[D11](https://riskfolio-lib.readthedocs.io/en/latest/auxiliary.html#id137 "Ignacio Ojeda. Kronecker square roots and the block vec matrix. The American Mathematical Monthly, 122(1):60, 2015. URL: https://doi.org/10.4169/amer.math.monthly.122.01.60, doi:10.4169/amer.math.monthly.122.01.60.")\
\].
Parameters:[¶](https://riskfolio-lib.readthedocs.io/en/latest/auxiliary.html#AuxFunctions.block_vec_pq-parameters "Permalink to this headline")
A : ndarray[¶](https://riskfolio-lib.readthedocs.io/en/latest/auxiliary.html#AuxFunctions.block_vec_pq.A "Permalink to this definition")
Matrix that will be block vectorized.
p : [int](https://docs.python.org/3.11/library/functions.html#int "(in Python v3.11)")
[¶](https://riskfolio-lib.readthedocs.io/en/latest/auxiliary.html#AuxFunctions.block_vec_pq.p "Permalink to this definition")
Order p of block vectorization operator.
q : [int](https://docs.python.org/3.11/library/functions.html#int "(in Python v3.11)")
[¶](https://riskfolio-lib.readthedocs.io/en/latest/auxiliary.html#AuxFunctions.block_vec_pq.q "Permalink to this definition")
Order q of block vectorization operator.
Returns:[¶](https://riskfolio-lib.readthedocs.io/en/latest/auxiliary.html#AuxFunctions.block_vec_pq-returns "Permalink to this headline")
**bvec\_A** – The block vectorized matrix.
Return type:[¶](https://riskfolio-lib.readthedocs.io/en/latest/auxiliary.html#AuxFunctions.block_vec_pq-return-type "Permalink to this headline")
ndarray
Raises:[¶](https://riskfolio-lib.readthedocs.io/en/latest/auxiliary.html#AuxFunctions.block_vec_pq-raises "Permalink to this headline")
**ValueError when the value cannot be calculated.** –
AuxFunctions.dcorr(_[X](https://riskfolio-lib.readthedocs.io/en/latest/auxiliary.html#AuxFunctions.dcorr.X "AuxFunctions.dcorr.X (Python parameter) — Returns series, must have of shape n_sample x 1.")
_, _[Y](https://riskfolio-lib.readthedocs.io/en/latest/auxiliary.html#AuxFunctions.dcorr.Y "AuxFunctions.dcorr.Y (Python parameter) — Returns series, must have of shape n_sample x 1.")
_)[\[source\]](https://riskfolio-lib.readthedocs.io/en/latest/_modules/AuxFunctions.html#dcorr)
[¶](https://riskfolio-lib.readthedocs.io/en/latest/auxiliary.html#AuxFunctions.dcorr "Link to this definition")
Calculate the distance correlation between two variables \[[D12](https://riskfolio-lib.readthedocs.io/en/latest/auxiliary.html#id109 "Gábor J. Székely, Maria L. Rizzo, and Nail K. Bakirov. Measuring and testing dependence by correlation of distances. The Annals of Statistics, 35(6):2769 – 2794, 2007. URL: https://doi.org/10.1214/009053607000000505, doi:10.1214/009053607000000505.")\
\].
Parameters:[¶](https://riskfolio-lib.readthedocs.io/en/latest/auxiliary.html#AuxFunctions.dcorr-parameters "Permalink to this headline")
X : 1d-array[¶](https://riskfolio-lib.readthedocs.io/en/latest/auxiliary.html#AuxFunctions.dcorr.X "Permalink to this definition")
Returns series, must have of shape n\_sample x 1.
Y : 1d-array[¶](https://riskfolio-lib.readthedocs.io/en/latest/auxiliary.html#AuxFunctions.dcorr.Y "Permalink to this definition")
Returns series, must have of shape n\_sample x 1.
Returns:[¶](https://riskfolio-lib.readthedocs.io/en/latest/auxiliary.html#AuxFunctions.dcorr-returns "Permalink to this headline")
**value** – The distance correlation between variables X and Y.
Return type:[¶](https://riskfolio-lib.readthedocs.io/en/latest/auxiliary.html#AuxFunctions.dcorr-return-type "Permalink to this headline")
[float](https://docs.python.org/3.11/library/functions.html#float "(in Python v3.11)")
Raises:[¶](https://riskfolio-lib.readthedocs.io/en/latest/auxiliary.html#AuxFunctions.dcorr-raises "Permalink to this headline")
**ValueError when the value cannot be calculated.** –
AuxFunctions.dcorr\_matrix(_[X](https://riskfolio-lib.readthedocs.io/en/latest/auxiliary.html#AuxFunctions.dcorr_matrix.X "AuxFunctions.dcorr_matrix.X (Python parameter) — Assets returns DataFrame, where n_samples is the number of observations and n_assets is the number of assets.")
_)[\[source\]](https://riskfolio-lib.readthedocs.io/en/latest/_modules/AuxFunctions.html#dcorr_matrix)
[¶](https://riskfolio-lib.readthedocs.io/en/latest/auxiliary.html#AuxFunctions.dcorr_matrix "Link to this definition")
Calculate the distance correlation matrix of n variables.
Parameters:[¶](https://riskfolio-lib.readthedocs.io/en/latest/auxiliary.html#AuxFunctions.dcorr_matrix-parameters "Permalink to this headline")
X : DataFrame of shape (n\_samples, n\_assets)[¶](https://riskfolio-lib.readthedocs.io/en/latest/auxiliary.html#AuxFunctions.dcorr_matrix.X "Permalink to this definition")
Assets returns DataFrame, where n\_samples is the number of observations and n\_assets is the number of assets.
Returns:[¶](https://riskfolio-lib.readthedocs.io/en/latest/auxiliary.html#AuxFunctions.dcorr_matrix-returns "Permalink to this headline")
**corr** – The distance correlation matrix of shape n\_features x n\_features.
Return type:[¶](https://riskfolio-lib.readthedocs.io/en/latest/auxiliary.html#AuxFunctions.dcorr_matrix-return-type "Permalink to this headline")
ndarray
Raises:[¶](https://riskfolio-lib.readthedocs.io/en/latest/auxiliary.html#AuxFunctions.dcorr_matrix-raises "Permalink to this headline")
**ValueError when the value cannot be calculated.** –
AuxFunctions.numBins(_[n\_samples](https://riskfolio-lib.readthedocs.io/en/latest/auxiliary.html#AuxFunctions.numBins.n_samples "AuxFunctions.numBins.n_samples (Python parameter) — Number of samples.")
_, _[corr](https://riskfolio-lib.readthedocs.io/en/latest/auxiliary.html#AuxFunctions.numBins.corr "AuxFunctions.numBins.corr (Python parameter) — Correlation coefficient of variables.")
\=`None`_)[\[source\]](https://riskfolio-lib.readthedocs.io/en/latest/_modules/AuxFunctions.html#numBins)
[¶](https://riskfolio-lib.readthedocs.io/en/latest/auxiliary.html#AuxFunctions.numBins "Link to this definition")
Calculate the optimal number of bins for discretization of mutual information and variation of information.
Parameters:[¶](https://riskfolio-lib.readthedocs.io/en/latest/auxiliary.html#AuxFunctions.numBins-parameters "Permalink to this headline")
n\_samples : integer[¶](https://riskfolio-lib.readthedocs.io/en/latest/auxiliary.html#AuxFunctions.numBins.n_samples "Permalink to this definition")
Number of samples.
corr : [float](https://docs.python.org/3.11/library/functions.html#float "(in Python v3.11)")
, optional[¶](https://riskfolio-lib.readthedocs.io/en/latest/auxiliary.html#AuxFunctions.numBins.corr "Permalink to this definition")
Correlation coefficient of variables. The default value is None.
Returns:[¶](https://riskfolio-lib.readthedocs.io/en/latest/auxiliary.html#AuxFunctions.numBins-returns "Permalink to this headline")
**bins** – The optimal number of bins.
Return type:[¶](https://riskfolio-lib.readthedocs.io/en/latest/auxiliary.html#AuxFunctions.numBins-return-type "Permalink to this headline")
[int](https://docs.python.org/3.11/library/functions.html#int "(in Python v3.11)")
Raises:[¶](https://riskfolio-lib.readthedocs.io/en/latest/auxiliary.html#AuxFunctions.numBins-raises "Permalink to this headline")
**ValueError when the value cannot be calculated.** –
AuxFunctions.mutual\_info\_matrix(_[X](https://riskfolio-lib.readthedocs.io/en/latest/auxiliary.html#AuxFunctions.mutual_info_matrix.X "AuxFunctions.mutual_info_matrix.X (Python parameter) — Assets returns DataFrame, where n_samples is the number of observations and n_assets is the number of assets.")
_, _[bins\_info](https://riskfolio-lib.readthedocs.io/en/latest/auxiliary.html#AuxFunctions.mutual_info_matrix.bins_info "AuxFunctions.mutual_info_matrix.bins_info (Python parameter) — Number of bins used to calculate mutual information.")
\=`'KN'`_, _[normalize](https://riskfolio-lib.readthedocs.io/en/latest/auxiliary.html#AuxFunctions.mutual_info_matrix.normalize "AuxFunctions.mutual_info_matrix.normalize (Python parameter) — If normalize variation of information.")
\=`True`_)[\[source\]](https://riskfolio-lib.readthedocs.io/en/latest/_modules/AuxFunctions.html#mutual_info_matrix)
[¶](https://riskfolio-lib.readthedocs.io/en/latest/auxiliary.html#AuxFunctions.mutual_info_matrix "Link to this definition")
Calculate the mutual information matrix of n variables.
Parameters:[¶](https://riskfolio-lib.readthedocs.io/en/latest/auxiliary.html#AuxFunctions.mutual_info_matrix-parameters "Permalink to this headline")
X : DataFrame of shape (n\_samples, n\_assets)[¶](https://riskfolio-lib.readthedocs.io/en/latest/auxiliary.html#AuxFunctions.mutual_info_matrix.X "Permalink to this definition")
Assets returns DataFrame, where n\_samples is the number of observations and n\_assets is the number of assets.
bins\_info : [int](https://docs.python.org/3.11/library/functions.html#int "(in Python v3.11)")
or [str](https://docs.python.org/3.11/library/stdtypes.html#str "(in Python v3.11)")
[¶](https://riskfolio-lib.readthedocs.io/en/latest/auxiliary.html#AuxFunctions.mutual_info_matrix.bins_info "Permalink to this definition")
Number of bins used to calculate mutual information. The default value is ‘KN’. Possible values are:
* ’KN’: Knuth’s choice method. See more in [knuth\_bin\_width](https://docs.astropy.org/en/stable/api/astropy.stats.knuth_bin_width.html)
.
* ’FD’: Freedman–Diaconis’ choice method. See more in [freedman\_bin\_width](https://docs.astropy.org/en/stable/api/astropy.stats.freedman_bin_width.html)
.
* ’SC’: Scotts’ choice method. See more in [scott\_bin\_width](https://docs.astropy.org/en/stable/api/astropy.stats.scott_bin_width.html)
.
* ’HGR’: Hacine-Gharbi and Ravier’ choice method.
* int: integer value choice by user.
normalize : [bool](https://docs.python.org/3.11/library/functions.html#bool "(in Python v3.11)")
[¶](https://riskfolio-lib.readthedocs.io/en/latest/auxiliary.html#AuxFunctions.mutual_info_matrix.normalize "Permalink to this definition")
If normalize variation of information. The default value is True.
Returns:[¶](https://riskfolio-lib.readthedocs.io/en/latest/auxiliary.html#AuxFunctions.mutual_info_matrix-returns "Permalink to this headline")
**corr** – The mutual information matrix of shape n\_features x n\_features.
Return type:[¶](https://riskfolio-lib.readthedocs.io/en/latest/auxiliary.html#AuxFunctions.mutual_info_matrix-return-type "Permalink to this headline")
ndarray
Raises:[¶](https://riskfolio-lib.readthedocs.io/en/latest/auxiliary.html#AuxFunctions.mutual_info_matrix-raises "Permalink to this headline")
**ValueError when the value cannot be calculated.** –
AuxFunctions.var\_info\_matrix(_[X](https://riskfolio-lib.readthedocs.io/en/latest/auxiliary.html#AuxFunctions.var_info_matrix.X "AuxFunctions.var_info_matrix.X (Python parameter) — Assets returns DataFrame, where n_samples is the number of observations and n_assets is the number of assets.")
_, _[bins\_info](https://riskfolio-lib.readthedocs.io/en/latest/auxiliary.html#AuxFunctions.var_info_matrix.bins_info "AuxFunctions.var_info_matrix.bins_info (Python parameter) — Number of bins used to calculate variation of information.")
\=`'KN'`_, _[normalize](https://riskfolio-lib.readthedocs.io/en/latest/auxiliary.html#AuxFunctions.var_info_matrix.normalize "AuxFunctions.var_info_matrix.normalize (Python parameter) — If normalize variation of information.")
\=`True`_)[\[source\]](https://riskfolio-lib.readthedocs.io/en/latest/_modules/AuxFunctions.html#var_info_matrix)
[¶](https://riskfolio-lib.readthedocs.io/en/latest/auxiliary.html#AuxFunctions.var_info_matrix "Link to this definition")
Calculate the variation of information matrix of n variables.
Parameters:[¶](https://riskfolio-lib.readthedocs.io/en/latest/auxiliary.html#AuxFunctions.var_info_matrix-parameters "Permalink to this headline")
X : DataFrame of shape (n\_samples, n\_assets)[¶](https://riskfolio-lib.readthedocs.io/en/latest/auxiliary.html#AuxFunctions.var_info_matrix.X "Permalink to this definition")
Assets returns DataFrame, where n\_samples is the number of observations and n\_assets is the number of assets.
bins\_info : [int](https://docs.python.org/3.11/library/functions.html#int "(in Python v3.11)")
or [str](https://docs.python.org/3.11/library/stdtypes.html#str "(in Python v3.11)")
[¶](https://riskfolio-lib.readthedocs.io/en/latest/auxiliary.html#AuxFunctions.var_info_matrix.bins_info "Permalink to this definition")
Number of bins used to calculate variation of information. The default value is ‘KN’. Possible values are:
* ’KN’: Knuth’s choice method. See more in [knuth\_bin\_width](https://docs.astropy.org/en/stable/api/astropy.stats.knuth_bin_width.html)
.
* ’FD’: Freedman–Diaconis’ choice method. See more in [freedman\_bin\_width](https://docs.astropy.org/en/stable/api/astropy.stats.freedman_bin_width.html)
.
* ’SC’: Scotts’ choice method. See more in [scott\_bin\_width](https://docs.astropy.org/en/stable/api/astropy.stats.scott_bin_width.html)
.
* ’HGR’: Hacine-Gharbi and Ravier’ choice method.
* int: integer value choice by user.
normalize : [bool](https://docs.python.org/3.11/library/functions.html#bool "(in Python v3.11)")
[¶](https://riskfolio-lib.readthedocs.io/en/latest/auxiliary.html#AuxFunctions.var_info_matrix.normalize "Permalink to this definition")
If normalize variation of information. The default value is True.
Returns:[¶](https://riskfolio-lib.readthedocs.io/en/latest/auxiliary.html#AuxFunctions.var_info_matrix-returns "Permalink to this headline")
**corr** – The mutual information matrix of shape n\_features x n\_features.
Return type:[¶](https://riskfolio-lib.readthedocs.io/en/latest/auxiliary.html#AuxFunctions.var_info_matrix-return-type "Permalink to this headline")
ndarray
Raises:[¶](https://riskfolio-lib.readthedocs.io/en/latest/auxiliary.html#AuxFunctions.var_info_matrix-raises "Permalink to this headline")
**ValueError when the value cannot be calculated.** –
AuxFunctions.ltdi\_matrix(_[X](https://riskfolio-lib.readthedocs.io/en/latest/auxiliary.html#AuxFunctions.ltdi_matrix.X "AuxFunctions.ltdi_matrix.X (Python parameter) — Assets returns DataFrame, where n_samples is the number of observations and n_assets is the number of assets.")
_, _[alpha](https://riskfolio-lib.readthedocs.io/en/latest/auxiliary.html#AuxFunctions.ltdi_matrix.alpha "AuxFunctions.ltdi_matrix.alpha (Python parameter) — Significance level for lower tail dependence index. The default is 0.05.")
\=`0.05`_)[\[source\]](https://riskfolio-lib.readthedocs.io/en/latest/_modules/AuxFunctions.html#ltdi_matrix)
[¶](https://riskfolio-lib.readthedocs.io/en/latest/auxiliary.html#AuxFunctions.ltdi_matrix "Link to this definition")
Calculate the lower tail dependence index matrix using the empirical approach.
Parameters:[¶](https://riskfolio-lib.readthedocs.io/en/latest/auxiliary.html#AuxFunctions.ltdi_matrix-parameters "Permalink to this headline")
X : DataFrame of shape (n\_samples, n\_assets)[¶](https://riskfolio-lib.readthedocs.io/en/latest/auxiliary.html#AuxFunctions.ltdi_matrix.X "Permalink to this definition")
Assets returns DataFrame, where n\_samples is the number of observations and n\_assets is the number of assets.
alpha : [float](https://docs.python.org/3.11/library/functions.html#float "(in Python v3.11)")
, optional[¶](https://riskfolio-lib.readthedocs.io/en/latest/auxiliary.html#AuxFunctions.ltdi_matrix.alpha "Permalink to this definition")
Significance level for lower tail dependence index. The default is 0.05.
Returns:[¶](https://riskfolio-lib.readthedocs.io/en/latest/auxiliary.html#AuxFunctions.ltdi_matrix-returns "Permalink to this headline")
**corr** – The lower tail dependence index matrix of shape n\_features x n\_features.
Return type:[¶](https://riskfolio-lib.readthedocs.io/en/latest/auxiliary.html#AuxFunctions.ltdi_matrix-return-type "Permalink to this headline")
ndarray
Raises:[¶](https://riskfolio-lib.readthedocs.io/en/latest/auxiliary.html#AuxFunctions.ltdi_matrix-raises "Permalink to this headline")
**ValueError when the value cannot be calculated.** –
AuxFunctions.two\_diff\_gap\_stat(_[dist](https://riskfolio-lib.readthedocs.io/en/latest/auxiliary.html#AuxFunctions.two_diff_gap_stat.dist "AuxFunctions.two_diff_gap_stat.dist (Python parameter) — A distance measure based on the codependence matrix.")
_, _[clustering](https://riskfolio-lib.readthedocs.io/en/latest/auxiliary.html#AuxFunctions.two_diff_gap_stat.clustering "AuxFunctions.two_diff_gap_stat.clustering (Python parameter) — The hierarchical clustering encoded as a linkage matrix, see linkage for more details.")
_, _[max\_k](https://riskfolio-lib.readthedocs.io/en/latest/auxiliary.html#AuxFunctions.two_diff_gap_stat.max_k "AuxFunctions.two_diff_gap_stat.max_k (Python parameter) — Max number of clusters used by the two difference gap statistic to find the optimal number of clusters.")
\=`10`_)[\[source\]](https://riskfolio-lib.readthedocs.io/en/latest/_modules/AuxFunctions.html#two_diff_gap_stat)
[¶](https://riskfolio-lib.readthedocs.io/en/latest/auxiliary.html#AuxFunctions.two_diff_gap_stat "Link to this definition")
Calculate the optimal number of clusters based on the two difference gap statistic \[[D13](https://riskfolio-lib.readthedocs.io/en/latest/auxiliary.html#id108 "Shihong Yue, Xiuxiu Wang, and Miaomiao Wei. Application of two-order difference to gap statistic. Transactions of Tianjin University, 14:217-221, 06 2008. doi:10.1007/s12209-008-0039-1.")\
\].
Parameters:[¶](https://riskfolio-lib.readthedocs.io/en/latest/auxiliary.html#AuxFunctions.two_diff_gap_stat-parameters "Permalink to this headline")
dist : [str](https://docs.python.org/3.11/library/stdtypes.html#str "(in Python v3.11)")
, optional[¶](https://riskfolio-lib.readthedocs.io/en/latest/auxiliary.html#AuxFunctions.two_diff_gap_stat.dist "Permalink to this definition")
A distance measure based on the codependence matrix.
clustering : [str](https://docs.python.org/3.11/library/stdtypes.html#str "(in Python v3.11)")
, optional[¶](https://riskfolio-lib.readthedocs.io/en/latest/auxiliary.html#AuxFunctions.two_diff_gap_stat.clustering "Permalink to this definition")
The hierarchical clustering encoded as a linkage matrix, see [linkage](https://docs.scipy.org/doc/scipy/reference/generated/scipy.cluster.hierarchy.linkage.html?highlight=linkage#scipy.cluster.hierarchy.linkage)
for more details.
max\_k : [int](https://docs.python.org/3.11/library/functions.html#int "(in Python v3.11)")
, optional[¶](https://riskfolio-lib.readthedocs.io/en/latest/auxiliary.html#AuxFunctions.two_diff_gap_stat.max_k "Permalink to this definition")
Max number of clusters used by the two difference gap statistic to find the optimal number of clusters. The default is 10.
Returns:[¶](https://riskfolio-lib.readthedocs.io/en/latest/auxiliary.html#AuxFunctions.two_diff_gap_stat-returns "Permalink to this headline")
**k** – The optimal number of clusters based on the two difference gap statistic.
Return type:[¶](https://riskfolio-lib.readthedocs.io/en/latest/auxiliary.html#AuxFunctions.two_diff_gap_stat-return-type "Permalink to this headline")
[int](https://docs.python.org/3.11/library/functions.html#int "(in Python v3.11)")
Raises:[¶](https://riskfolio-lib.readthedocs.io/en/latest/auxiliary.html#AuxFunctions.two_diff_gap_stat-raises "Permalink to this headline")
**ValueError when the value cannot be calculated.** –
AuxFunctions.std\_silhouette\_score(_[dist](https://riskfolio-lib.readthedocs.io/en/latest/auxiliary.html#AuxFunctions.std_silhouette_score.dist "AuxFunctions.std_silhouette_score.dist (Python parameter) — A distance measure based on the codependence matrix.")
_, _[clustering](https://riskfolio-lib.readthedocs.io/en/latest/auxiliary.html#AuxFunctions.std_silhouette_score.clustering "AuxFunctions.std_silhouette_score.clustering (Python parameter) — Duplicate explicit target name: "linkage".")
_, _[max\_k](https://riskfolio-lib.readthedocs.io/en/latest/auxiliary.html#AuxFunctions.std_silhouette_score.max_k "AuxFunctions.std_silhouette_score.max_k (Python parameter) — Max number of clusters used by the standarized silhouette score to find the optimal number of clusters.")
\=`10`_)[\[source\]](https://riskfolio-lib.readthedocs.io/en/latest/_modules/AuxFunctions.html#std_silhouette_score)
[¶](https://riskfolio-lib.readthedocs.io/en/latest/auxiliary.html#AuxFunctions.std_silhouette_score "Link to this definition")
Calculate the optimal number of clusters based on the standarized silhouette score index \[[D14](https://riskfolio-lib.readthedocs.io/en/latest/auxiliary.html#id117 "Marcos Prado. A robust estimator of the efficient frontier. SSRN Electronic Journal, 01 2019. doi:10.2139/ssrn.3469961.")\
\].
Parameters:[¶](https://riskfolio-lib.readthedocs.io/en/latest/auxiliary.html#AuxFunctions.std_silhouette_score-parameters "Permalink to this headline")
dist : [str](https://docs.python.org/3.11/library/stdtypes.html#str "(in Python v3.11)")
, optional[¶](https://riskfolio-lib.readthedocs.io/en/latest/auxiliary.html#AuxFunctions.std_silhouette_score.dist "Permalink to this definition")
A distance measure based on the codependence matrix.
clustering : [str](https://docs.python.org/3.11/library/stdtypes.html#str "(in Python v3.11)")
, optional[¶](https://riskfolio-lib.readthedocs.io/en/latest/auxiliary.html#AuxFunctions.std_silhouette_score.clustering "Permalink to this definition")
The hierarchical clustering encoded as a linkage matrix, see [linkage](https://docs.scipy.org/doc/scipy/reference/generated/scipy.cluster.hierarchy.linkage.html?highlight=linkage#scipy.cluster.hierarchy.linkage)
for more details.
max\_k : [int](https://docs.python.org/3.11/library/functions.html#int "(in Python v3.11)")
, optional[¶](https://riskfolio-lib.readthedocs.io/en/latest/auxiliary.html#AuxFunctions.std_silhouette_score.max_k "Permalink to this definition")
Max number of clusters used by the standarized silhouette score to find the optimal number of clusters. The default is 10.
Returns:[¶](https://riskfolio-lib.readthedocs.io/en/latest/auxiliary.html#AuxFunctions.std_silhouette_score-returns "Permalink to this headline")
**k** – The optimal number of clusters based on the standarized silhouette score.
Return type:[¶](https://riskfolio-lib.readthedocs.io/en/latest/auxiliary.html#AuxFunctions.std_silhouette_score-return-type "Permalink to this headline")
[int](https://docs.python.org/3.11/library/functions.html#int "(in Python v3.11)")
Raises:[¶](https://riskfolio-lib.readthedocs.io/en/latest/auxiliary.html#AuxFunctions.std_silhouette_score-raises "Permalink to this headline")
**ValueError when the value cannot be calculated.** –
AuxFunctions.codep\_dist(_[returns](https://riskfolio-lib.readthedocs.io/en/latest/auxiliary.html#AuxFunctions.codep_dist.returns "AuxFunctions.codep_dist.returns (Python parameter) — Assets returns DataFrame, where n_samples is the number of observations and n_assets is the number of assets.")
_, _[custom\_cov](https://riskfolio-lib.readthedocs.io/en/latest/auxiliary.html#AuxFunctions.codep_dist.custom_cov "AuxFunctions.codep_dist.custom_cov (Python parameter) — Custom covariance matrix, used when codependence parameter has value 'custom_cov'.")
\=`None`_, _[codependence](https://riskfolio-lib.readthedocs.io/en/latest/auxiliary.html#AuxFunctions.codep_dist.codependence "AuxFunctions.codep_dist.codependence (Python parameter) — The codependence or similarity matrix used to build the distance metric and clusters.")
\=`'pearson'`_, _[bins\_info](https://riskfolio-lib.readthedocs.io/en/latest/auxiliary.html#AuxFunctions.codep_dist.bins_info "AuxFunctions.codep_dist.bins_info (Python parameter) — Number of bins used to calculate variation of information.")
\=`'KN'`_, _[alpha\_tail](https://riskfolio-lib.readthedocs.io/en/latest/auxiliary.html#AuxFunctions.codep_dist.alpha_tail "AuxFunctions.codep_dist.alpha_tail (Python parameter) — Significance level for lower tail dependence index.")
\=`0.05`_, _[gs\_threshold](https://riskfolio-lib.readthedocs.io/en/latest/auxiliary.html#AuxFunctions.codep_dist.gs_threshold "AuxFunctions.codep_dist.gs_threshold (Python parameter) — Gerber statistic threshold.")
\=`0.5`_)[\[source\]](https://riskfolio-lib.readthedocs.io/en/latest/_modules/AuxFunctions.html#codep_dist)
[¶](https://riskfolio-lib.readthedocs.io/en/latest/auxiliary.html#AuxFunctions.codep_dist "Link to this definition")
Calculate the codependence and distance matrix according the selected method.
Parameters:[¶](https://riskfolio-lib.readthedocs.io/en/latest/auxiliary.html#AuxFunctions.codep_dist-parameters "Permalink to this headline")
returns : DataFrame of shape (n\_samples, n\_assets)[¶](https://riskfolio-lib.readthedocs.io/en/latest/auxiliary.html#AuxFunctions.codep_dist.returns "Permalink to this definition")
Assets returns DataFrame, where n\_samples is the number of observations and n\_assets is the number of assets.
custom\_cov : DataFrame or None, optional[¶](https://riskfolio-lib.readthedocs.io/en/latest/auxiliary.html#AuxFunctions.codep_dist.custom_cov "Permalink to this definition")
Custom covariance matrix, used when codependence parameter has value ‘custom\_cov’. The default is None.
codependence : [str](https://docs.python.org/3.11/library/stdtypes.html#str "(in Python v3.11)")
, can be {'pearson', 'spearman', 'abs\_pearson', 'abs\_spearman', 'distance', 'mutual\_info', 'tail' or 'custom\_cov'}[¶](https://riskfolio-lib.readthedocs.io/en/latest/auxiliary.html#AuxFunctions.codep_dist.codependence "Permalink to this definition")
The codependence or similarity matrix used to build the distance metric and clusters. The default is ‘pearson’. Possible values are:
* ’pearson’: pearson correlation matrix. Distance formula: Di,j\=0.5(1−ρi,jpearson).
* ’spearman’: spearman correlation matrix. Distance formula: Di,j\=0.5(1−ρi,jspearman).
* ’kendall’: kendall correlation matrix. Distance formula: Di,j\=0.5(1−ρi,jkendall).
* ’gerber1’: Gerber statistic 1 correlation matrix. Distance formula: Di,j\=0.5(1−ρi,jgerber1).
* ’gerber2’: Gerber statistic 2 correlation matrix. Distance formula: Di,j\=0.5(1−ρi,jgerber2).
* ’abs\_pearson’: absolute value pearson correlation matrix. Distance formula: Di,j\=(1−|ρi,j|).
* ’abs\_spearman’: absolute value spearman correlation matrix. Distance formula: Di,j\=(1−|ρi,j|).
* ’abs\_kendall’: absolute value kendall correlation matrix. Distance formula: Di,j\=(1−|ρi,jkendall|).
* ’distance’: distance correlation matrix. Distance formula Di,j\=(1−ρi,jdistance).
* ’mutual\_info’: mutual information matrix. Distance used is variation information matrix.
* ’tail’: lower tail dependence index matrix. Dissimilarity formula Di,j\=−logλi,j.
* ’custom\_cov’: use custom correlation matrix based on the custom\_cov parameter. Distance formula: Di,j\=0.5(1−ρi,jpearson).
bins\_info : [int](https://docs.python.org/3.11/library/functions.html#int "(in Python v3.11)")
or [str](https://docs.python.org/3.11/library/stdtypes.html#str "(in Python v3.11)")
[¶](https://riskfolio-lib.readthedocs.io/en/latest/auxiliary.html#AuxFunctions.codep_dist.bins_info "Permalink to this definition")
Number of bins used to calculate variation of information. The default value is ‘KN’. Possible values are:
* ’KN’: Knuth’s choice method. See more in [knuth\_bin\_width](https://docs.astropy.org/en/stable/api/astropy.stats.knuth_bin_width.html)
.
* ’FD’: Freedman–Diaconis’ choice method. See more in [freedman\_bin\_width](https://docs.astropy.org/en/stable/api/astropy.stats.freedman_bin_width.html)
.
* ’SC’: Scotts’ choice method. See more in [scott\_bin\_width](https://docs.astropy.org/en/stable/api/astropy.stats.scott_bin_width.html)
.
* ’HGR’: Hacine-Gharbi and Ravier’ choice method.
* int: integer value choice by user.
alpha\_tail : [float](https://docs.python.org/3.11/library/functions.html#float "(in Python v3.11)")
, optional[¶](https://riskfolio-lib.readthedocs.io/en/latest/auxiliary.html#AuxFunctions.codep_dist.alpha_tail "Permalink to this definition")
Significance level for lower tail dependence index. The default is 0.05.
gs\_threshold : [float](https://docs.python.org/3.11/library/functions.html#float "(in Python v3.11)")
, optional[¶](https://riskfolio-lib.readthedocs.io/en/latest/auxiliary.html#AuxFunctions.codep_dist.gs_threshold "Permalink to this definition")
Gerber statistic threshold. The default is 0.5.
Returns:[¶](https://riskfolio-lib.readthedocs.io/en/latest/auxiliary.html#AuxFunctions.codep_dist-returns "Permalink to this headline")
* **codep** (_DataFrame_) – Codependence matrix.
* **dist** (_DataFrame_) – Distance matrix.
Raises:[¶](https://riskfolio-lib.readthedocs.io/en/latest/auxiliary.html#AuxFunctions.codep_dist-raises "Permalink to this headline")
[**ValueError**](https://docs.python.org/3.11/library/exceptions.html#ValueError "(in Python v3.11)")
– When the value cannot be calculated.
AuxFunctions.fitKDE(_[obs](https://riskfolio-lib.readthedocs.io/en/latest/auxiliary.html#AuxFunctions.fitKDE.obs "AuxFunctions.fitKDE.obs (Python parameter) — Observations to fit.")
_, _[bWidth](https://riskfolio-lib.readthedocs.io/en/latest/auxiliary.html#AuxFunctions.fitKDE.bWidth "AuxFunctions.fitKDE.bWidth (Python parameter) — The bandwidth of the kernel.")
\=`0.01`_, _[kernel](https://riskfolio-lib.readthedocs.io/en/latest/auxiliary.html#AuxFunctions.fitKDE.kernel "AuxFunctions.fitKDE.kernel (Python parameter) — The kernel to use.")
\=`'gaussian'`_, _[x](https://riskfolio-lib.readthedocs.io/en/latest/auxiliary.html#AuxFunctions.fitKDE.x "AuxFunctions.fitKDE.x (Python parameter) — It is the array of values on which the fit KDE will be evaluated.")
\=`None`_)[\[source\]](https://riskfolio-lib.readthedocs.io/en/latest/_modules/AuxFunctions.html#fitKDE)
[¶](https://riskfolio-lib.readthedocs.io/en/latest/auxiliary.html#AuxFunctions.fitKDE "Link to this definition")
Fit kernel to a series of obs, and derive the prob of obs x is the array of values on which the fit KDE will be evaluated. It is the empirical Probability Density Function (PDF). For more information see chapter 2 of \[[D15](https://riskfolio-lib.readthedocs.io/en/latest/auxiliary.html#id119 "Marcos M. López de Prado. Machine Learning for Asset Managers. Elements in Quantitative Finance. Cambridge University Press, 2020. doi:10.1017/9781108883658.")\
\].
Parameters:[¶](https://riskfolio-lib.readthedocs.io/en/latest/auxiliary.html#AuxFunctions.fitKDE-parameters "Permalink to this headline")
obs : ndarray[¶](https://riskfolio-lib.readthedocs.io/en/latest/auxiliary.html#AuxFunctions.fitKDE.obs "Permalink to this definition")
Observations to fit. Commonly is the diagonal of Eigenvalues.
bWidth : [float](https://docs.python.org/3.11/library/functions.html#float "(in Python v3.11)")
, optional[¶](https://riskfolio-lib.readthedocs.io/en/latest/auxiliary.html#AuxFunctions.fitKDE.bWidth "Permalink to this definition")
The bandwidth of the kernel. The default value is 0.01.
kernel : string, optional[¶](https://riskfolio-lib.readthedocs.io/en/latest/auxiliary.html#AuxFunctions.fitKDE.kernel "Permalink to this definition")
The kernel to use. The default value is ‘gaussian’. For more information see: [kernel-density](https://scikit-learn.org/stable/modules/density.html#kernel-density)
. Possible values are:
* ’gaussian’: gaussian kernel.
* ’tophat’: tophat kernel.
* ’epanechnikov’: epanechnikov kernel.
* ’exponential’: exponential kernel.
* ’linear’: linear kernel.
* ’cosine’: cosine kernel.
x : ndarray, optional[¶](https://riskfolio-lib.readthedocs.io/en/latest/auxiliary.html#AuxFunctions.fitKDE.x "Permalink to this definition")
It is the array of values on which the fit KDE will be evaluated.
Returns:[¶](https://riskfolio-lib.readthedocs.io/en/latest/auxiliary.html#AuxFunctions.fitKDE-returns "Permalink to this headline")
**pdf** – Empirical PDF.
Return type:[¶](https://riskfolio-lib.readthedocs.io/en/latest/auxiliary.html#AuxFunctions.fitKDE-return-type "Permalink to this headline")
pd.series
Raises:[¶](https://riskfolio-lib.readthedocs.io/en/latest/auxiliary.html#AuxFunctions.fitKDE-raises "Permalink to this headline")
**ValueError when the value cannot be calculated.** –
AuxFunctions.mpPDF(_[var](https://riskfolio-lib.readthedocs.io/en/latest/auxiliary.html#AuxFunctions.mpPDF.var "AuxFunctions.mpPDF.var (Python parameter) — Variance.")
_, _[q](https://riskfolio-lib.readthedocs.io/en/latest/auxiliary.html#AuxFunctions.mpPDF.q "AuxFunctions.mpPDF.q (Python parameter) — T/N where T is the number of rows and N the number of columns")
_, _[pts](https://riskfolio-lib.readthedocs.io/en/latest/auxiliary.html#AuxFunctions.mpPDF.pts "AuxFunctions.mpPDF.pts (Python parameter) — Number of points used to construct the PDF.")
_)[\[source\]](https://riskfolio-lib.readthedocs.io/en/latest/_modules/AuxFunctions.html#mpPDF)
[¶](https://riskfolio-lib.readthedocs.io/en/latest/auxiliary.html#AuxFunctions.mpPDF "Link to this definition")
Creates a Marchenko-Pastur Probability Density Function (PDF). For more information see chapter 2 of \[[D15](https://riskfolio-lib.readthedocs.io/en/latest/auxiliary.html#id119 "Marcos M. López de Prado. Machine Learning for Asset Managers. Elements in Quantitative Finance. Cambridge University Press, 2020. doi:10.1017/9781108883658.")\
\].
Parameters:[¶](https://riskfolio-lib.readthedocs.io/en/latest/auxiliary.html#AuxFunctions.mpPDF-parameters "Permalink to this headline")
var : [float](https://docs.python.org/3.11/library/functions.html#float "(in Python v3.11)")
[¶](https://riskfolio-lib.readthedocs.io/en/latest/auxiliary.html#AuxFunctions.mpPDF.var "Permalink to this definition")
Variance.
q : [float](https://docs.python.org/3.11/library/functions.html#float "(in Python v3.11)")
[¶](https://riskfolio-lib.readthedocs.io/en/latest/auxiliary.html#AuxFunctions.mpPDF.q "Permalink to this definition")
T/N where T is the number of rows and N the number of columns
pts : [int](https://docs.python.org/3.11/library/functions.html#int "(in Python v3.11)")
[¶](https://riskfolio-lib.readthedocs.io/en/latest/auxiliary.html#AuxFunctions.mpPDF.pts "Permalink to this definition")
Number of points used to construct the PDF.
Returns:[¶](https://riskfolio-lib.readthedocs.io/en/latest/auxiliary.html#AuxFunctions.mpPDF-returns "Permalink to this headline")
**pdf** – Marchenko-Pastur PDF.
Return type:[¶](https://riskfolio-lib.readthedocs.io/en/latest/auxiliary.html#AuxFunctions.mpPDF-return-type "Permalink to this headline")
pd.series
Raises:[¶](https://riskfolio-lib.readthedocs.io/en/latest/auxiliary.html#AuxFunctions.mpPDF-raises "Permalink to this headline")
**ValueError when the value cannot be calculated.** –
AuxFunctions.errPDFs(_[var](https://riskfolio-lib.readthedocs.io/en/latest/auxiliary.html#AuxFunctions.errPDFs.var "AuxFunctions.errPDFs.var (Python parameter) — Variance.")
_, _[eVal](https://riskfolio-lib.readthedocs.io/en/latest/auxiliary.html#AuxFunctions.errPDFs.eVal "AuxFunctions.errPDFs.eVal (Python parameter) — Eigenvalues to fit.")
_, _[q](https://riskfolio-lib.readthedocs.io/en/latest/auxiliary.html#AuxFunctions.errPDFs.q "AuxFunctions.errPDFs.q (Python parameter) — T/N where T is the number of rows and N the number of columns.")
_, _[bWidth](https://riskfolio-lib.readthedocs.io/en/latest/auxiliary.html#AuxFunctions.errPDFs.bWidth "AuxFunctions.errPDFs.bWidth (Python parameter) — The bandwidth of the kernel.")
\=`0.01`_, _[pts](https://riskfolio-lib.readthedocs.io/en/latest/auxiliary.html#AuxFunctions.errPDFs.pts "AuxFunctions.errPDFs.pts (Python parameter) — Number of points used to construct the PDF.")
\=`1000`_)[\[source\]](https://riskfolio-lib.readthedocs.io/en/latest/_modules/AuxFunctions.html#errPDFs)
[¶](https://riskfolio-lib.readthedocs.io/en/latest/auxiliary.html#AuxFunctions.errPDFs "Link to this definition")
Fit error of Empirical PDF (uses Marchenko-Pastur PDF). For more information see chapter 2 of \[[D15](https://riskfolio-lib.readthedocs.io/en/latest/auxiliary.html#id119 "Marcos M. López de Prado. Machine Learning for Asset Managers. Elements in Quantitative Finance. Cambridge University Press, 2020. doi:10.1017/9781108883658.")\
\].
Parameters:[¶](https://riskfolio-lib.readthedocs.io/en/latest/auxiliary.html#AuxFunctions.errPDFs-parameters "Permalink to this headline")
var : [float](https://docs.python.org/3.11/library/functions.html#float "(in Python v3.11)")
[¶](https://riskfolio-lib.readthedocs.io/en/latest/auxiliary.html#AuxFunctions.errPDFs.var "Permalink to this definition")
Variance.
eVal : ndarray[¶](https://riskfolio-lib.readthedocs.io/en/latest/auxiliary.html#AuxFunctions.errPDFs.eVal "Permalink to this definition")
Eigenvalues to fit.
q : [float](https://docs.python.org/3.11/library/functions.html#float "(in Python v3.11)")
[¶](https://riskfolio-lib.readthedocs.io/en/latest/auxiliary.html#AuxFunctions.errPDFs.q "Permalink to this definition")
T/N where T is the number of rows and N the number of columns.
bWidth : [float](https://docs.python.org/3.11/library/functions.html#float "(in Python v3.11)")
, optional[¶](https://riskfolio-lib.readthedocs.io/en/latest/auxiliary.html#AuxFunctions.errPDFs.bWidth "Permalink to this definition")
The bandwidth of the kernel. The default value is 0.01.
pts : [int](https://docs.python.org/3.11/library/functions.html#int "(in Python v3.11)")
[¶](https://riskfolio-lib.readthedocs.io/en/latest/auxiliary.html#AuxFunctions.errPDFs.pts "Permalink to this definition")
Number of points used to construct the PDF. The default value is 1000.
Returns:[¶](https://riskfolio-lib.readthedocs.io/en/latest/auxiliary.html#AuxFunctions.errPDFs-returns "Permalink to this headline")
**pdf** – Sum squared error.
Return type:[¶](https://riskfolio-lib.readthedocs.io/en/latest/auxiliary.html#AuxFunctions.errPDFs-return-type "Permalink to this headline")
[float](https://docs.python.org/3.11/library/functions.html#float "(in Python v3.11)")
Raises:[¶](https://riskfolio-lib.readthedocs.io/en/latest/auxiliary.html#AuxFunctions.errPDFs-raises "Permalink to this headline")
**ValueError when the value cannot be calculated.** –
AuxFunctions.findMaxEval(_[eVal](https://riskfolio-lib.readthedocs.io/en/latest/auxiliary.html#AuxFunctions.findMaxEval.eVal "AuxFunctions.findMaxEval.eVal (Python parameter) — Eigenvalues to fit.")
_, _[q](https://riskfolio-lib.readthedocs.io/en/latest/auxiliary.html#AuxFunctions.findMaxEval.q "AuxFunctions.findMaxEval.q (Python parameter) — T/N where T is the number of rows and N the number of columns.")
_, _[bWidth](https://riskfolio-lib.readthedocs.io/en/latest/auxiliary.html#AuxFunctions.findMaxEval.bWidth "AuxFunctions.findMaxEval.bWidth (Python parameter) — The bandwidth of the kernel.")
\=`0.01`_)[\[source\]](https://riskfolio-lib.readthedocs.io/en/latest/_modules/AuxFunctions.html#findMaxEval)
[¶](https://riskfolio-lib.readthedocs.io/en/latest/auxiliary.html#AuxFunctions.findMaxEval "Link to this definition")
Find max random eVal by fitting Marchenko’s dist (i.e) everything else larger than this, is a signal eigenvalue. For more information see chapter 2 of \[[D15](https://riskfolio-lib.readthedocs.io/en/latest/auxiliary.html#id119 "Marcos M. López de Prado. Machine Learning for Asset Managers. Elements in Quantitative Finance. Cambridge University Press, 2020. doi:10.1017/9781108883658.")\
\].
Parameters:[¶](https://riskfolio-lib.readthedocs.io/en/latest/auxiliary.html#AuxFunctions.findMaxEval-parameters "Permalink to this headline")
eVal : ndarray[¶](https://riskfolio-lib.readthedocs.io/en/latest/auxiliary.html#AuxFunctions.findMaxEval.eVal "Permalink to this definition")
Eigenvalues to fit.
q : [float](https://docs.python.org/3.11/library/functions.html#float "(in Python v3.11)")
[¶](https://riskfolio-lib.readthedocs.io/en/latest/auxiliary.html#AuxFunctions.findMaxEval.q "Permalink to this definition")
T/N where T is the number of rows and N the number of columns.
bWidth : [float](https://docs.python.org/3.11/library/functions.html#float "(in Python v3.11)")
, optional[¶](https://riskfolio-lib.readthedocs.io/en/latest/auxiliary.html#AuxFunctions.findMaxEval.bWidth "Permalink to this definition")
The bandwidth of the kernel.
Returns:[¶](https://riskfolio-lib.readthedocs.io/en/latest/auxiliary.html#AuxFunctions.findMaxEval-returns "Permalink to this headline")
**pdf** – First value is the maximum random eigenvalue and second is the variance attributed to noise (1-result) is one way to measure signal-to-noise.
Return type:[¶](https://riskfolio-lib.readthedocs.io/en/latest/auxiliary.html#AuxFunctions.findMaxEval-return-type "Permalink to this headline")
[tuple](https://docs.python.org/3.11/library/stdtypes.html#tuple "(in Python v3.11)")
([float](https://docs.python.org/3.11/library/functions.html#float "(in Python v3.11)")
, [float](https://docs.python.org/3.11/library/functions.html#float "(in Python v3.11)")
)
Raises:[¶](https://riskfolio-lib.readthedocs.io/en/latest/auxiliary.html#AuxFunctions.findMaxEval-raises "Permalink to this headline")
**ValueError when the value cannot be calculated.** –
AuxFunctions.getPCA(_[matrix](https://riskfolio-lib.readthedocs.io/en/latest/auxiliary.html#AuxFunctions.getPCA.matrix "AuxFunctions.getPCA.matrix (Python parameter) — Correlation matrix.")
_)[\[source\]](https://riskfolio-lib.readthedocs.io/en/latest/_modules/AuxFunctions.html#getPCA)
[¶](https://riskfolio-lib.readthedocs.io/en/latest/auxiliary.html#AuxFunctions.getPCA "Link to this definition")
Gets the Eigenvalues and Eigenvector values from a Hermitian Matrix. For more information see chapter 2 of \[[D15](https://riskfolio-lib.readthedocs.io/en/latest/auxiliary.html#id119 "Marcos M. López de Prado. Machine Learning for Asset Managers. Elements in Quantitative Finance. Cambridge University Press, 2020. doi:10.1017/9781108883658.")\
\].
Parameters:[¶](https://riskfolio-lib.readthedocs.io/en/latest/auxiliary.html#AuxFunctions.getPCA-parameters "Permalink to this headline")
matrix : ndarray or pd.DataFrame[¶](https://riskfolio-lib.readthedocs.io/en/latest/auxiliary.html#AuxFunctions.getPCA.matrix "Permalink to this definition")
Correlation matrix.
Returns:[¶](https://riskfolio-lib.readthedocs.io/en/latest/auxiliary.html#AuxFunctions.getPCA-returns "Permalink to this headline")
**pdf** – First value are the eigenvalues of correlation matrix and second are the Eigenvectors of correlation matrix.
Return type:[¶](https://riskfolio-lib.readthedocs.io/en/latest/auxiliary.html#AuxFunctions.getPCA-return-type "Permalink to this headline")
[tuple](https://docs.python.org/3.11/library/stdtypes.html#tuple "(in Python v3.11)")
([float](https://docs.python.org/3.11/library/functions.html#float "(in Python v3.11)")
, [float](https://docs.python.org/3.11/library/functions.html#float "(in Python v3.11)")
)
Raises:[¶](https://riskfolio-lib.readthedocs.io/en/latest/auxiliary.html#AuxFunctions.getPCA-raises "Permalink to this headline")
**ValueError when the value cannot be calculated.** –
AuxFunctions.denoisedCorr(_[eVal](https://riskfolio-lib.readthedocs.io/en/latest/auxiliary.html#AuxFunctions.denoisedCorr.eVal "AuxFunctions.denoisedCorr.eVal (Python parameter) — Eigenvalues.")
_, _[eVec](https://riskfolio-lib.readthedocs.io/en/latest/auxiliary.html#AuxFunctions.denoisedCorr.eVec "AuxFunctions.denoisedCorr.eVec (Python parameter) — Eigenvectors.")
_, _[nFacts](https://riskfolio-lib.readthedocs.io/en/latest/auxiliary.html#AuxFunctions.denoisedCorr.nFacts "AuxFunctions.denoisedCorr.nFacts (Python parameter) — The number of factors.")
_, _[kind](https://riskfolio-lib.readthedocs.io/en/latest/auxiliary.html#AuxFunctions.denoisedCorr.kind "AuxFunctions.denoisedCorr.kind (Python parameter) — The denoise method.")
\=`'fixed'`_)[\[source\]](https://riskfolio-lib.readthedocs.io/en/latest/_modules/AuxFunctions.html#denoisedCorr)
[¶](https://riskfolio-lib.readthedocs.io/en/latest/auxiliary.html#AuxFunctions.denoisedCorr "Link to this definition")
Remove noise from correlation matrix using fixing random eigenvalues and spectral method. For more information see chapter 2 of \[[D15](https://riskfolio-lib.readthedocs.io/en/latest/auxiliary.html#id119 "Marcos M. López de Prado. Machine Learning for Asset Managers. Elements in Quantitative Finance. Cambridge University Press, 2020. doi:10.1017/9781108883658.")\
\].
Parameters:[¶](https://riskfolio-lib.readthedocs.io/en/latest/auxiliary.html#AuxFunctions.denoisedCorr-parameters "Permalink to this headline")
eVal : 1darray[¶](https://riskfolio-lib.readthedocs.io/en/latest/auxiliary.html#AuxFunctions.denoisedCorr.eVal "Permalink to this definition")
Eigenvalues.
eVec : ndarray[¶](https://riskfolio-lib.readthedocs.io/en/latest/auxiliary.html#AuxFunctions.denoisedCorr.eVec "Permalink to this definition")
Eigenvectors.
nFacts : [float](https://docs.python.org/3.11/library/functions.html#float "(in Python v3.11)")
[¶](https://riskfolio-lib.readthedocs.io/en/latest/auxiliary.html#AuxFunctions.denoisedCorr.nFacts "Permalink to this definition")
The number of factors.
kind : [str](https://docs.python.org/3.11/library/stdtypes.html#str "(in Python v3.11)")
, optional[¶](https://riskfolio-lib.readthedocs.io/en/latest/auxiliary.html#AuxFunctions.denoisedCorr.kind "Permalink to this definition")
The denoise method. The default value is ‘fixed’. Possible values are:
* ’fixed’: takes average of eigenvalues above max Marchenko Pastour limit.
* ’spectral’: makes zero eigenvalues above max Marchenko Pastour limit.
Returns:[¶](https://riskfolio-lib.readthedocs.io/en/latest/auxiliary.html#AuxFunctions.denoisedCorr-returns "Permalink to this headline")
**corr** – Denoised correlation matrix.
Return type:[¶](https://riskfolio-lib.readthedocs.io/en/latest/auxiliary.html#AuxFunctions.denoisedCorr-return-type "Permalink to this headline")
ndarray
Raises:[¶](https://riskfolio-lib.readthedocs.io/en/latest/auxiliary.html#AuxFunctions.denoisedCorr-raises "Permalink to this headline")
**ValueError when the value cannot be calculated.** –
AuxFunctions.shrinkCorr(_[eVal](https://riskfolio-lib.readthedocs.io/en/latest/auxiliary.html#AuxFunctions.shrinkCorr.eVal "AuxFunctions.shrinkCorr.eVal (Python parameter) — Eigenvalues.")
_, _[eVec](https://riskfolio-lib.readthedocs.io/en/latest/auxiliary.html#AuxFunctions.shrinkCorr.eVec "AuxFunctions.shrinkCorr.eVec (Python parameter) — Eigenvectors.")
_, _[nFacts](https://riskfolio-lib.readthedocs.io/en/latest/auxiliary.html#AuxFunctions.shrinkCorr.nFacts "AuxFunctions.shrinkCorr.nFacts (Python parameter) — The number of factors.")
_, _[alpha](https://riskfolio-lib.readthedocs.io/en/latest/auxiliary.html#AuxFunctions.shrinkCorr.alpha "AuxFunctions.shrinkCorr.alpha (Python parameter) — Shrinkage factor.")
\=`0`_)[\[source\]](https://riskfolio-lib.readthedocs.io/en/latest/_modules/AuxFunctions.html#shrinkCorr)
[¶](https://riskfolio-lib.readthedocs.io/en/latest/auxiliary.html#AuxFunctions.shrinkCorr "Link to this definition")
Remove noise from correlation using target shrinkage. For more information see chapter 2 of \[[D15](https://riskfolio-lib.readthedocs.io/en/latest/auxiliary.html#id119 "Marcos M. López de Prado. Machine Learning for Asset Managers. Elements in Quantitative Finance. Cambridge University Press, 2020. doi:10.1017/9781108883658.")\
\].
Parameters:[¶](https://riskfolio-lib.readthedocs.io/en/latest/auxiliary.html#AuxFunctions.shrinkCorr-parameters "Permalink to this headline")
eVal : 1darray[¶](https://riskfolio-lib.readthedocs.io/en/latest/auxiliary.html#AuxFunctions.shrinkCorr.eVal "Permalink to this definition")
Eigenvalues.
eVec : ndarray[¶](https://riskfolio-lib.readthedocs.io/en/latest/auxiliary.html#AuxFunctions.shrinkCorr.eVec "Permalink to this definition")
Eigenvectors.
nFacts : [float](https://docs.python.org/3.11/library/functions.html#float "(in Python v3.11)")
[¶](https://riskfolio-lib.readthedocs.io/en/latest/auxiliary.html#AuxFunctions.shrinkCorr.nFacts "Permalink to this definition")
The number of factors.
alpha : [float](https://docs.python.org/3.11/library/functions.html#float "(in Python v3.11)")
, optional[¶](https://riskfolio-lib.readthedocs.io/en/latest/auxiliary.html#AuxFunctions.shrinkCorr.alpha "Permalink to this definition")
Shrinkage factor.
Returns:[¶](https://riskfolio-lib.readthedocs.io/en/latest/auxiliary.html#AuxFunctions.shrinkCorr-returns "Permalink to this headline")
**corr** – Denoised correlation matrix.
Return type:[¶](https://riskfolio-lib.readthedocs.io/en/latest/auxiliary.html#AuxFunctions.shrinkCorr-return-type "Permalink to this headline")
ndarray
Raises:[¶](https://riskfolio-lib.readthedocs.io/en/latest/auxiliary.html#AuxFunctions.shrinkCorr-raises "Permalink to this headline")
**ValueError when the value cannot be calculated.** –
AuxFunctions.denoiseCov(_[cov](https://riskfolio-lib.readthedocs.io/en/latest/auxiliary.html#AuxFunctions.denoiseCov.cov "AuxFunctions.denoiseCov.cov (Python parameter) — Covariance matrix, where n_assets is the number of assets.")
_, _[q](https://riskfolio-lib.readthedocs.io/en/latest/auxiliary.html#AuxFunctions.denoiseCov.q "AuxFunctions.denoiseCov.q (Python parameter) — T/N where T is the number of rows and N the number of columns.")
_, _[kind](https://riskfolio-lib.readthedocs.io/en/latest/auxiliary.html#AuxFunctions.denoiseCov.kind "AuxFunctions.denoiseCov.kind (Python parameter) — The denoise method.")
\=`'fixed'`_, _[bWidth](https://riskfolio-lib.readthedocs.io/en/latest/auxiliary.html#AuxFunctions.denoiseCov.bWidth "AuxFunctions.denoiseCov.bWidth (Python parameter) — The bandwidth of the kernel.")
\=`0.01`_, _[detone](https://riskfolio-lib.readthedocs.io/en/latest/auxiliary.html#AuxFunctions.denoiseCov.detone "AuxFunctions.denoiseCov.detone (Python parameter) — If remove the firs mkt_comp of correlation matrix.")
\=`False`_, _[mkt\_comp](https://riskfolio-lib.readthedocs.io/en/latest/auxiliary.html#AuxFunctions.denoiseCov.mkt_comp "AuxFunctions.denoiseCov.mkt_comp (Python parameter) — Number of first components that will be removed using the detone method.")
\=`1`_, _[alpha](https://riskfolio-lib.readthedocs.io/en/latest/auxiliary.html#AuxFunctions.denoiseCov.alpha "AuxFunctions.denoiseCov.alpha (Python parameter) — Shrinkage factor.")
\=`0.1`_)[\[source\]](https://riskfolio-lib.readthedocs.io/en/latest/_modules/AuxFunctions.html#denoiseCov)
[¶](https://riskfolio-lib.readthedocs.io/en/latest/auxiliary.html#AuxFunctions.denoiseCov "Link to this definition")
Remove noise from cov by fixing random eigenvalues of their correlation matrix. For more information see chapter 2 of \[[D15](https://riskfolio-lib.readthedocs.io/en/latest/auxiliary.html#id119 "Marcos M. López de Prado. Machine Learning for Asset Managers. Elements in Quantitative Finance. Cambridge University Press, 2020. doi:10.1017/9781108883658.")\
\].
Parameters:[¶](https://riskfolio-lib.readthedocs.io/en/latest/auxiliary.html#AuxFunctions.denoiseCov-parameters "Permalink to this headline")
cov : DataFrame of shape (n\_assets, n\_assets)[¶](https://riskfolio-lib.readthedocs.io/en/latest/auxiliary.html#AuxFunctions.denoiseCov.cov "Permalink to this definition")
Covariance matrix, where n\_assets is the number of assets.
q : [float](https://docs.python.org/3.11/library/functions.html#float "(in Python v3.11)")
[¶](https://riskfolio-lib.readthedocs.io/en/latest/auxiliary.html#AuxFunctions.denoiseCov.q "Permalink to this definition")
T/N where T is the number of rows and N the number of columns.
bWidth : [float](https://docs.python.org/3.11/library/functions.html#float "(in Python v3.11)")
[¶](https://riskfolio-lib.readthedocs.io/en/latest/auxiliary.html#AuxFunctions.denoiseCov.bWidth "Permalink to this definition")
The bandwidth of the kernel.
kind : [str](https://docs.python.org/3.11/library/stdtypes.html#str "(in Python v3.11)")
, optional[¶](https://riskfolio-lib.readthedocs.io/en/latest/auxiliary.html#AuxFunctions.denoiseCov.kind "Permalink to this definition")
The denoise method. The default value is ‘fixed’. Possible values are:
* ’fixed’: takes average of eigenvalues above max Marchenko Pastour limit.
* ’spectral’: makes zero eigenvalues above max Marchenko Pastour limit.
* ’shrink’: uses target shrinkage method.
detone : [bool](https://docs.python.org/3.11/library/functions.html#bool "(in Python v3.11)")
, optional[¶](https://riskfolio-lib.readthedocs.io/en/latest/auxiliary.html#AuxFunctions.denoiseCov.detone "Permalink to this definition")
If remove the firs mkt\_comp of correlation matrix. The detone correlation matrix is singular, so it cannot be inverted.
mkt\_comp : [float](https://docs.python.org/3.11/library/functions.html#float "(in Python v3.11)")
, optional[¶](https://riskfolio-lib.readthedocs.io/en/latest/auxiliary.html#AuxFunctions.denoiseCov.mkt_comp "Permalink to this definition")
Number of first components that will be removed using the detone method.
alpha : [float](https://docs.python.org/3.11/library/functions.html#float "(in Python v3.11)")
, optional[¶](https://riskfolio-lib.readthedocs.io/en/latest/auxiliary.html#AuxFunctions.denoiseCov.alpha "Permalink to this definition")
Shrinkage factor.
Returns:[¶](https://riskfolio-lib.readthedocs.io/en/latest/auxiliary.html#AuxFunctions.denoiseCov-returns "Permalink to this headline")
**cov\_** – Denoised covariance matrix.
Return type:[¶](https://riskfolio-lib.readthedocs.io/en/latest/auxiliary.html#AuxFunctions.denoiseCov-return-type "Permalink to this headline")
ndarray or pd.DataFrame
Raises:[¶](https://riskfolio-lib.readthedocs.io/en/latest/auxiliary.html#AuxFunctions.denoiseCov-raises "Permalink to this headline")
**ValueError when the value cannot be calculated.** –
AuxFunctions.round\_values(_[data](https://riskfolio-lib.readthedocs.io/en/latest/auxiliary.html#AuxFunctions.round_values.data "AuxFunctions.round_values.data (Python parameter) — Data that are going to be rounded.")
_, _[decimals](https://riskfolio-lib.readthedocs.io/en/latest/auxiliary.html#AuxFunctions.round_values.decimals "AuxFunctions.round_values.decimals (Python parameter) — Number of decimals to round.")
\=`4`_, _[wider](https://riskfolio-lib.readthedocs.io/en/latest/auxiliary.html#AuxFunctions.round_values.wider "AuxFunctions.round_values.wider (Python parameter) — False if round to values close to zero, True if round to values away from zero.")
\=`False`_)[\[source\]](https://riskfolio-lib.readthedocs.io/en/latest/_modules/AuxFunctions.html#round_values)
[¶](https://riskfolio-lib.readthedocs.io/en/latest/auxiliary.html#AuxFunctions.round_values "Link to this definition")
This function help us to round values to values close or away from zero.
Parameters:[¶](https://riskfolio-lib.readthedocs.io/en/latest/auxiliary.html#AuxFunctions.round_values-parameters "Permalink to this headline")
data : np.ndarray, pd.Series or pd.DataFrame[¶](https://riskfolio-lib.readthedocs.io/en/latest/auxiliary.html#AuxFunctions.round_values.data "Permalink to this definition")
Data that are going to be rounded.
decimals : integer[¶](https://riskfolio-lib.readthedocs.io/en/latest/auxiliary.html#AuxFunctions.round_values.decimals "Permalink to this definition")
Number of decimals to round.
wider : [float](https://docs.python.org/3.11/library/functions.html#float "(in Python v3.11)")
[¶](https://riskfolio-lib.readthedocs.io/en/latest/auxiliary.html#AuxFunctions.round_values.wider "Permalink to this definition")
False if round to values close to zero, True if round to values away from zero.
Returns:[¶](https://riskfolio-lib.readthedocs.io/en/latest/auxiliary.html#AuxFunctions.round_values-returns "Permalink to this headline")
**value** – Data rounded using selected method.
Return type:[¶](https://riskfolio-lib.readthedocs.io/en/latest/auxiliary.html#AuxFunctions.round_values-return-type "Permalink to this headline")
np.ndarray, pd.Series or pd.DataFrame
Raises:[¶](https://riskfolio-lib.readthedocs.io/en/latest/auxiliary.html#AuxFunctions.round_values-raises "Permalink to this headline")
[**ValueError**](https://docs.python.org/3.11/library/exceptions.html#ValueError "(in Python v3.11)")
– When the value cannot be calculated.
AuxFunctions.weights\_discretizetion(_[weights](https://riskfolio-lib.readthedocs.io/en/latest/auxiliary.html#AuxFunctions.weights_discretizetion.weights "AuxFunctions.weights_discretizetion.weights (Python parameter) — Vector of weights of size n_assets x 1.")
_, _[prices](https://riskfolio-lib.readthedocs.io/en/latest/auxiliary.html#AuxFunctions.weights_discretizetion.prices "AuxFunctions.weights_discretizetion.prices (Python parameter) — Vector of prices of size n_assets x 1.")
_, _[capital](https://riskfolio-lib.readthedocs.io/en/latest/auxiliary.html#AuxFunctions.weights_discretizetion.capital "AuxFunctions.weights_discretizetion.capital (Python parameter) — Capital invested.")
\=`1000000`_, _[w\_decimal](https://riskfolio-lib.readthedocs.io/en/latest/auxiliary.html#AuxFunctions.weights_discretizetion.w_decimal "AuxFunctions.weights_discretizetion.w_decimal (Python parameter) — Number of decimals use to round the portfolio weights.")
\=`6`_, _[ascending](https://riskfolio-lib.readthedocs.io/en/latest/auxiliary.html#AuxFunctions.weights_discretizetion.ascending "AuxFunctions.weights_discretizetion.ascending (Python parameter) — If True assigns excess capital to assets with lower weights, else, to assets with higher weights.")
\=`False`_)[\[source\]](https://riskfolio-lib.readthedocs.io/en/latest/_modules/AuxFunctions.html#weights_discretizetion)
[¶](https://riskfolio-lib.readthedocs.io/en/latest/auxiliary.html#AuxFunctions.weights_discretizetion "Link to this definition")
This function help us to find the number of shares that must be bought or sold to achieve portfolio weights according the prices of assets and the invested capital.
Parameters:[¶](https://riskfolio-lib.readthedocs.io/en/latest/auxiliary.html#AuxFunctions.weights_discretizetion-parameters "Permalink to this headline")
weights : pd.Series or pd.DataFrame[¶](https://riskfolio-lib.readthedocs.io/en/latest/auxiliary.html#AuxFunctions.weights_discretizetion.weights "Permalink to this definition")
Vector of weights of size n\_assets x 1.
prices : pd.Series or pd.DataFrame[¶](https://riskfolio-lib.readthedocs.io/en/latest/auxiliary.html#AuxFunctions.weights_discretizetion.prices "Permalink to this definition")
Vector of prices of size n\_assets x 1.
capital : [float](https://docs.python.org/3.11/library/functions.html#float "(in Python v3.11)")
, optional[¶](https://riskfolio-lib.readthedocs.io/en/latest/auxiliary.html#AuxFunctions.weights_discretizetion.capital "Permalink to this definition")
Capital invested. The default value is 1000000.
w\_decimal : [int](https://docs.python.org/3.11/library/functions.html#int "(in Python v3.11)")
, optional[¶](https://riskfolio-lib.readthedocs.io/en/latest/auxiliary.html#AuxFunctions.weights_discretizetion.w_decimal "Permalink to this definition")
Number of decimals use to round the portfolio weights. The default value is 6.
ascending : [bool](https://docs.python.org/3.11/library/functions.html#bool "(in Python v3.11)")
, optional[¶](https://riskfolio-lib.readthedocs.io/en/latest/auxiliary.html#AuxFunctions.weights_discretizetion.ascending "Permalink to this definition")
If True assigns excess capital to assets with lower weights, else, to assets with higher weights. The default value is False.
Returns:[¶](https://riskfolio-lib.readthedocs.io/en/latest/auxiliary.html#AuxFunctions.weights_discretizetion-returns "Permalink to this headline")
**n\_shares** – Number of shares that must be bought or sold to achieve portfolio weights.
Return type:[¶](https://riskfolio-lib.readthedocs.io/en/latest/auxiliary.html#AuxFunctions.weights_discretizetion-return-type "Permalink to this headline")
pd.DataFrame
Raises:[¶](https://riskfolio-lib.readthedocs.io/en/latest/auxiliary.html#AuxFunctions.weights_discretizetion-raises "Permalink to this headline")
[**ValueError**](https://docs.python.org/3.11/library/exceptions.html#ValueError "(in Python v3.11)")
– When the value cannot be calculated.
AuxFunctions.color\_list(_[k](https://riskfolio-lib.readthedocs.io/en/latest/auxiliary.html#AuxFunctions.color_list.k "AuxFunctions.color_list.k (Python parameter) — Number of colors.")
_)[\[source\]](https://riskfolio-lib.readthedocs.io/en/latest/_modules/AuxFunctions.html#color_list)
[¶](https://riskfolio-lib.readthedocs.io/en/latest/auxiliary.html#AuxFunctions.color_list "Link to this definition")
This function creates a list of colors.
Parameters:[¶](https://riskfolio-lib.readthedocs.io/en/latest/auxiliary.html#AuxFunctions.color_list-parameters "Permalink to this headline")
k : [int](https://docs.python.org/3.11/library/functions.html#int "(in Python v3.11)")
[¶](https://riskfolio-lib.readthedocs.io/en/latest/auxiliary.html#AuxFunctions.color_list.k "Permalink to this definition")
Number of colors.
Returns:[¶](https://riskfolio-lib.readthedocs.io/en/latest/auxiliary.html#AuxFunctions.color_list-returns "Permalink to this headline")
**colors** – A list of colors.
Return type:[¶](https://riskfolio-lib.readthedocs.io/en/latest/auxiliary.html#AuxFunctions.color_list-return-type "Permalink to this headline")
[list](https://docs.python.org/3.11/library/stdtypes.html#list "(in Python v3.11)")
Bibliography[¶](https://riskfolio-lib.readthedocs.io/en/latest/auxiliary.html#bibliography "Link to this heading")
-------------------------------------------------------------------------------------------------------------------
\[D1\] ([1](https://riskfolio-lib.readthedocs.io/en/latest/auxiliary.html#id1)
,[2](https://riskfolio-lib.readthedocs.io/en/latest/auxiliary.html#id7)
)
Won-Min Song, T. Di Matteo, and Tomaso Aste. Hierarchical information clustering by means of topologically embedded graphs. _PLOS ONE_, 7(3):1–14, 03 2012. URL: [https://doi.org/10.1371/journal.pone.0031929](https://doi.org/10.1371/journal.pone.0031929)
, [doi:10.1371/journal.pone.0031929](https://doi.org/10.1371/journal.pone.0031929)
.
\[D2\] ([1](https://riskfolio-lib.readthedocs.io/en/latest/auxiliary.html#id2)
,[2](https://riskfolio-lib.readthedocs.io/en/latest/auxiliary.html#id8)
)
Wolfram Barfuss, Guido Previde Massara, T. Di Matteo, and Tomaso Aste. Parsimonious modeling with information filtering networks. _Physical Review E_, 12 2016. URL: [http://dx.doi.org/10.1103/PhysRevE.94.062306](http://dx.doi.org/10.1103/PhysRevE.94.062306)
, [doi:10.1103/physreve.94.062306](https://doi.org/10.1103/physreve.94.062306)
.
\[D3\] ([1](https://riskfolio-lib.readthedocs.io/en/latest/auxiliary.html#id3)
,[2](https://riskfolio-lib.readthedocs.io/en/latest/auxiliary.html#id12)
,[3](https://riskfolio-lib.readthedocs.io/en/latest/auxiliary.html#id13)
,[4](https://riskfolio-lib.readthedocs.io/en/latest/auxiliary.html#id14)
,[5](https://riskfolio-lib.readthedocs.io/en/latest/auxiliary.html#id15)
,[6](https://riskfolio-lib.readthedocs.io/en/latest/auxiliary.html#id16)
,[7](https://riskfolio-lib.readthedocs.io/en/latest/auxiliary.html#id17)
,[8](https://riskfolio-lib.readthedocs.io/en/latest/auxiliary.html#id18)
,[9](https://riskfolio-lib.readthedocs.io/en/latest/auxiliary.html#id19)
,[10](https://riskfolio-lib.readthedocs.io/en/latest/auxiliary.html#id20)
)
Dany Cajas. Owa portfolio optimization: a disciplined convex programming framework. _SSRN Electronic Journal_, 2021. URL: [https://doi.org/10.2139/ssrn.3988927](https://doi.org/10.2139/ssrn.3988927)
, [doi:10.2139/ssrn.3988927](https://doi.org/10.2139/ssrn.3988927)
.
\[D4\] ([1](https://riskfolio-lib.readthedocs.io/en/latest/auxiliary.html#id4)
,[2](https://riskfolio-lib.readthedocs.io/en/latest/auxiliary.html#id22)
,[3](https://riskfolio-lib.readthedocs.io/en/latest/auxiliary.html#id23)
,[4](https://riskfolio-lib.readthedocs.io/en/latest/auxiliary.html#id24)
)
Sander Gerber, Harry Markowitz, Philip Ernst, Yinsen Miao, Babak Javid, and Paul Sargen. The gerber statistic: a robust co-movement measure for portfolio optimization. _SSRN Electronic Journal_, 2021. URL: [https://doi.org/10.2139/ssrn.3880054](https://doi.org/10.2139/ssrn.3880054)
, [doi:10.2139/ssrn.3880054](https://doi.org/10.2139/ssrn.3880054)
.
\[D5\] ([1](https://riskfolio-lib.readthedocs.io/en/latest/auxiliary.html#id5)
,[2](https://riskfolio-lib.readthedocs.io/en/latest/auxiliary.html#id25)
,[3](https://riskfolio-lib.readthedocs.io/en/latest/auxiliary.html#id26)
)
Jan R. Magnus and H. Neudecker. The elimination matrix: some lemmas and applications. _SIAM Journal on Algebraic Discrete Methods_, 1(4):422–449, 1980. URL: [https://doi.org/10.1137/0601049](https://doi.org/10.1137/0601049)
, [arXiv:https://doi.org/10.1137/0601049](https://arxiv.org/abs/https://doi.org/10.1137/0601049)
, [doi:10.1137/0601049](https://doi.org/10.1137/0601049)
.
\[D6\] ([1](https://riskfolio-lib.readthedocs.io/en/latest/auxiliary.html#id6)
,[2](https://riskfolio-lib.readthedocs.io/en/latest/auxiliary.html#id27)
,[3](https://riskfolio-lib.readthedocs.io/en/latest/auxiliary.html#id28)
,[4](https://riskfolio-lib.readthedocs.io/en/latest/auxiliary.html#id29)
,[5](https://riskfolio-lib.readthedocs.io/en/latest/auxiliary.html#id30)
,[6](https://riskfolio-lib.readthedocs.io/en/latest/auxiliary.html#id31)
,[7](https://riskfolio-lib.readthedocs.io/en/latest/auxiliary.html#id32)
)
Dany Cajas. Convex optimization of portfolio kurtosis. _SSRN Electronic Journal_, 2022. URL: [https://doi.org/10.2139/ssrn.4202967](https://doi.org/10.2139/ssrn.4202967)
, [doi:10.2139/ssrn.4202967](https://doi.org/10.2139/ssrn.4202967)
.
\[[D7](https://riskfolio-lib.readthedocs.io/en/latest/auxiliary.html#id9)\
\]
Guido Previde Massara, T. Di Matteo, and Tomaso Aste. Network Filtering for Big Data: Triangulated Maximally Filtered Graph. _Journal of Complex Networks_, 5(2):161–178, 06 2016. URL: [https://doi.org/10.1093/comnet/cnw015](https://doi.org/10.1093/comnet/cnw015)
, [arXiv:https://academic.oup.com/comnet/article-pdf/5/2/161/13794756/cnw015.pdf](https://arxiv.org/abs/https://academic.oup.com/comnet/article-pdf/5/2/161/13794756/cnw015.pdf)
, [doi:10.1093/comnet/cnw015](https://doi.org/10.1093/comnet/cnw015)
.
\[[D8](https://riskfolio-lib.readthedocs.io/en/latest/auxiliary.html#id10)\
\]
Won-Min Song, T. Di Matteo, and Tomaso Aste. Nested hierarchies in planar graphs. _Discrete Applied Mathematics_, 159(17):2135–2146, 2011. URL: [https://www.sciencedirect.com/science/article/pii/S0166218X11002794](https://www.sciencedirect.com/science/article/pii/S0166218X11002794)
, [doi:https://doi.org/10.1016/j.dam.2011.07.018](https://doi.org/https://doi.org/10.1016/j.dam.2011.07.018)
.
\[D9\] ([1](https://riskfolio-lib.readthedocs.io/en/latest/auxiliary.html#id11)
,[2](https://riskfolio-lib.readthedocs.io/en/latest/auxiliary.html#id21)
)
Dany Cajas. Higher order moment portfolio optimization with l-moments. _SSRN Electronic Journal_, 2023. URL: [https://papers.ssrn.com/sol3/papers.cfm?abstract\_id=4393155](https://papers.ssrn.com/sol3/papers.cfm?abstract_id=4393155)
, [doi:10.2139/ssrn.4393155](https://doi.org/10.2139/ssrn.4393155)
.
\[[D10](https://riskfolio-lib.readthedocs.io/en/latest/auxiliary.html#id33)\
\]
C. F. Van Loan and N. Pitsianis. _Approximation with Kronecker Products_, pages 293–314. Springer Netherlands, Dordrecht, 1993. URL: [https://doi.org/10.1007/978-94-015-8196-7\\\_17](https://doi.org/10.1007/978-94-015-8196-7/_17)
, [doi:10.1007/978-94-015-8196-7\\\_17](https://doi.org/10.1007/978-94-015-8196-7/_17)
.
\[[D11](https://riskfolio-lib.readthedocs.io/en/latest/auxiliary.html#id34)\
\]
Ignacio Ojeda. Kronecker square roots and the block vec matrix. _The American Mathematical Monthly_, 122(1):60, 2015. URL: [https://doi.org/10.4169/amer.math.monthly.122.01.60](https://doi.org/10.4169/amer.math.monthly.122.01.60)
, [doi:10.4169/amer.math.monthly.122.01.60](https://doi.org/10.4169/amer.math.monthly.122.01.60)
.
\[[D12](https://riskfolio-lib.readthedocs.io/en/latest/auxiliary.html#id35)\
\]
Gábor J. Székely, Maria L. Rizzo, and Nail K. Bakirov. Measuring and testing dependence by correlation of distances. _The Annals of Statistics_, 35(6):2769 – 2794, 2007. URL: [https://doi.org/10.1214/009053607000000505](https://doi.org/10.1214/009053607000000505)
, [doi:10.1214/009053607000000505](https://doi.org/10.1214/009053607000000505)
.
\[[D13](https://riskfolio-lib.readthedocs.io/en/latest/auxiliary.html#id39)\
\]
Shihong Yue, Xiuxiu Wang, and Miaomiao Wei. Application of two-order difference to gap statistic. _Transactions of Tianjin University_, 14:217–221, 06 2008. [doi:10.1007/s12209-008-0039-1](https://doi.org/10.1007/s12209-008-0039-1)
.
\[[D14](https://riskfolio-lib.readthedocs.io/en/latest/auxiliary.html#id40)\
\]
Marcos Prado. A robust estimator of the efficient frontier. _SSRN Electronic Journal_, 01 2019. [doi:10.2139/ssrn.3469961](https://doi.org/10.2139/ssrn.3469961)
.
\[D15\] ([1](https://riskfolio-lib.readthedocs.io/en/latest/auxiliary.html#id45)
,[2](https://riskfolio-lib.readthedocs.io/en/latest/auxiliary.html#id46)
,[3](https://riskfolio-lib.readthedocs.io/en/latest/auxiliary.html#id47)
,[4](https://riskfolio-lib.readthedocs.io/en/latest/auxiliary.html#id48)
,[5](https://riskfolio-lib.readthedocs.io/en/latest/auxiliary.html#id49)
,[6](https://riskfolio-lib.readthedocs.io/en/latest/auxiliary.html#id50)
,[7](https://riskfolio-lib.readthedocs.io/en/latest/auxiliary.html#id51)
,[8](https://riskfolio-lib.readthedocs.io/en/latest/auxiliary.html#id52)
)
Marcos M. López de Prado. _Machine Learning for Asset Managers_. Elements in Quantitative Finance. Cambridge University Press, 2020. [doi:10.1017/9781108883658](https://doi.org/10.1017/9781108883658)
.
[**On-Demand H100 SXM GPUs for $2.99/hr/GPU with Lambda** 640 GB of vRAM in one 8x instance **Launch now**](https://server.ethicalads.io/proxy/click/9837/019d0edd-c206-7461-96f3-a10da9851c4e/)
[Ads by EthicalAds](https://www.ethicalads.io/advertisers/topics/data-science/?ref=ea-text)
---
#
Documentation page not found
- Read the Docs Community
[riskfolio-lib.readthedocs.io](https://riskfolio-lib.readthedocs.io/)
The documentation page you requested does not exist or may have been removed.
Hosted by [](https://app.readthedocs.org/)
---
# Riskfolio-Lib 7.2
[Skip to content](https://riskfolio-lib.readthedocs.io/#portfolio-optimization-in-python-easy-for-everyone)
Riskfolio-Lib[¶](https://riskfolio-lib.readthedocs.io/#riskfolio-lib "Link to this heading")
=============================================================================================
Portfolio Optimization in Python, Easy for Everyone[¶](https://riskfolio-lib.readthedocs.io/#portfolio-optimization-in-python-easy-for-everyone "Link to this heading")
------------------------------------------------------------------------------------------------------------------------------------------------------------------------
[Buy Advanced Portfolio Optimization Book on Springer](https://www.kqzyfj.com/click-101359873-15150084?url=https%3A%2F%2Flink.springer.com%2Fbook%2F9783031843037)
[Enroll in the Portfolio Optimization with Python Course](https://www.paypal.com/ncp/payment/GN55W4UQ7VAMN)
[](https://riskfolio-lib.readthedocs.io/_images/MSV_Frontier.png)
[](https://riskfolio-lib.readthedocs.io/_images/Pie_Chart.png)
[](https://github.com/sponsors/dcajasn)
[](https://ko-fi.com/B0B833SXD)
[](https://github.com/dcajasn/Riskfolio-Lib/stargazers)
[](https://pepy.tech/project/riskfolio-lib)
[](https://pepy.tech/project/riskfolio-lib)
 [](https://github.com/dcajasn/Riskfolio-Lib/blob/master/LICENSE.txt)
[](https://mybinder.org/v2/gh/dcajasn/Riskfolio-Lib/HEAD)
### Description[¶](https://riskfolio-lib.readthedocs.io/#description "Link to this heading")
Riskfolio-Lib is a library for making **Portfolio Optimization in Python** made in Peru 🇵🇪. Its objective is to help students, academics and practitioners to build investment portfolios based on mathematically complex models with low effort. It is built on top of [CVXPY](https://www.cvxpy.org/)
and closely integrated with [Pandas](https://pandas.pydata.org/)
data structures.
Some of key functionalities that Riskfolio-Lib offers:
* Mean Risk and Logarithmic Mean Risk (Kelly Criterion) Portfolio Optimization with 4 objective functions:
> * Minimum Risk.
>
> * Maximum Return.
>
> * Maximum Utility Function.
>
> * Maximum Risk Adjusted Return Ratio.
>
* Mean Risk and Logarithmic Mean Risk (Kelly Criterion) Portfolio Optimization with 24 convex risk measures:
> **Dispersion Risk Measures:**
>
> * Standard Deviation.
>
> * Square Root Kurtosis.
>
> * Mean Absolute Deviation (MAD).
>
> * Gini Mean Difference (GMD).
>
> * Conditional Value at Risk Range.
>
> * Tail Gini Range.
>
> * Entropic Value at Risk Range.
>
> * Relativistic Value at Risk Range.
>
> * Range.
>
>
> **Downside Risk Measures:**
>
> * Semi Standard Deviation.
>
> * Square Root Semi Kurtosis.
>
> * First Lower Partial Moment (Omega Ratio).
>
> * Second Lower Partial Moment (Sortino Ratio).
>
> * Conditional Value at Risk (CVaR).
>
> * Tail Gini.
>
> * Entropic Value at Risk (EVaR).
>
> * Relativistic Value at Risk (RLVaR).
>
> * Worst Realization (Minimax).
>
>
> **Drawdown Risk Measures:**
>
> * Average Drawdown for uncompounded cumulative returns.
>
> * Ulcer Index for uncompounded cumulative returns.
>
> * Conditional Drawdown at Risk (CDaR) for uncompounded cumulative returns.
>
> * Entropic Drawdown at Risk (EDaR) for uncompounded cumulative returns.
>
> * Relativistic Drawdown at Risk (RLDaR) for uncompounded cumulative returns.
>
> * Maximum Drawdown (Calmar Ratio) for uncompounded cumulative returns.
>
* Risk Parity Portfolio Optimization with 20 convex risk measures:
> **Dispersion Risk Measures:**
>
> * Standard Deviation.
>
> * Square Root Kurtosis.
>
> * Mean Absolute Deviation (MAD).
>
> * Gini Mean Difference (GMD).
>
> * Conditional Value at Risk Range.
>
> * Tail Gini Range.
>
> * Entropic Value at Risk Range.
>
> * Relativistic Value at Risk Range.
>
>
> **Downside Risk Measures:**
>
> * Semi Standard Deviation.
>
> * Square Root Semi Kurtosis.
>
> * First Lower Partial Moment (Omega Ratio)
>
> * Second Lower Partial Moment (Sortino Ratio)
>
> * Conditional Value at Risk (CVaR).
>
> * Tail Gini.
>
> * Entropic Value at Risk (EVaR).
>
> * Relativistic Value at Risk (RLVaR).
>
>
> **Drawdown Risk Measures:**
>
> * Ulcer Index for uncompounded cumulative returns.
>
> * Conditional Drawdown at Risk (CDaR) for uncompounded cumulative returns.
>
> * Entropic Drawdown at Risk (EDaR) for uncompounded cumulative returns.
>
> * Relativistic Drawdown at Risk (RLDaR) for uncompounded cumulative returns.
>
* Hierarchical Clustering Portfolio Optimization: Hierarchical Risk Parity (HRP) and Hierarchical Equal Risk Contribution (HERC) with 35 risk measures using naive risk parity:
> **Dispersion Risk Measures:**
>
> * Standard Deviation.
>
> * Variance.
>
> * Square Root Kurtosis.
>
> * Mean Absolute Deviation (MAD).
>
> * Gini Mean Difference (GMD).
>
> * Value at Risk Range.
>
> * Conditional Value at Risk Range.
>
> * Tail Gini Range.
>
> * Entropic Value at Risk Range.
>
> * Relativistic Value at Risk Range.
>
> * Range.
>
>
> **Downside Risk Measures:**
>
> * Semi Standard Deviation.
>
> * Square Root Semi Kurtosis.
>
> * First Lower Partial Moment (Omega Ratio).
>
> * Second Lower Partial Moment (Sortino Ratio).
>
> * Value at Risk (VaR).
>
> * Conditional Value at Risk (CVaR).
>
> * Entropic Value at Risk (EVaR).
>
> * Relativistic Value at Risk (RLVaR).
>
> * Tail Gini.
>
> * Worst Case Realization (Minimax).
>
>
> **Drawdown Risk Measures:**
>
> * Average Drawdown for compounded and uncompounded cumulative returns.
>
> * Ulcer Index for compounded and uncompounded cumulative returns.
>
> * Drawdown at Risk (DaR) for compounded and uncompounded cumulative returns.
>
> * Conditional Drawdown at Risk (CDaR) for compounded and uncompounded cumulative returns.
>
> * Entropic Drawdown at Risk (EDaR) for compounded and uncompounded cumulative returns.
>
> * Relativistic Drawdown at Risk (RLDaR) for compounded and uncompounded cumulative returns.
>
> * Maximum Drawdown (Calmar Ratio) for compounded and uncompounded cumulative returns.
>
* Nested Clustered Optimization (NCO) with four objective functions and the available risk measures to each objective:
> * Minimum Risk.
>
> * Maximum Return.
>
> * Maximum Utility Function.
>
> * Equal Risk Contribution.
>
* Worst Case Mean Variance Portfolio Optimization.
* Relaxed Risk Parity Portfolio Optimization.
* Ordered Weighted Averaging (OWA) Portfolio Optimization.
* Portfolio optimization with Black Litterman model.
* Portfolio optimization with Risk Factors model.
* Portfolio optimization with Black Litterman Bayesian model.
* Portfolio optimization with Augmented Black Litterman model.
* Portfolio optimization with constraints on tracking error and turnover.
* Portfolio optimization with short positions and leveraged portfolios.
* Portfolio optimization with constraints on number of assets and number of effective assets.
* Portfolio optimization with constraints based on graph information.
* Portfolio optimization with inequality constraints on risk contributions for variance.
* Portfolio optimization with inequality constraints on factor risk contributions for variance.
* Portfolio optimization with integer constraints such as Cardinality on Assets and Categories, Mutually Exclusive and Join Investment.
* Tools to build efficient frontier for 24 convex risk measures.
* Tools to build linear constraints on assets, asset classes and risk factors.
* Tools to build views on assets and asset classes.
* Tools to build views on risk factors.
* Tools to build risk contribution constraints per asset classes.
* Tools to build risk contribution constraints per risk factor using explicit risk factors and principal components.
* Tools to build bounds constraints for Hierarchical Clustering Portfolios.
* Tools to calculate risk measures.
* Tools to calculate risk contributions per asset.
* Tools to calculate risk contributions per risk factor.
* Tools to calculate uncertainty sets for mean vector and covariance matrix.
* Tools to calculate assets clusters based on codependence metrics.
* Tools to estimate loadings matrix (Stepwise Regression and Principal Components Regression).
* Tools to visualizing portfolio properties and risk measures.
* Tools to build reports on Jupyter Notebook and Excel.
* Option to use commercial optimization solver like MOSEK or GUROBI for large scale problems.
### Choosing a Solver[¶](https://riskfolio-lib.readthedocs.io/#choosing-a-solver "Link to this heading")
Due to Riskfolio-Lib is based on CVXPY, Riskfolio-Lib can use the same solvers available for CVXPY. The list of solvers compatible with CVXPY is available in [Choosing a solver](https://www.cvxpy.org/tutorial/solvers/index.html#choosing-a-solver)
section of CVXPY’s documentation. However, to select an adequate solver for each risk measure we can use the following table that specifies which type of programming technique is used to model each risk measure.
| Risk Measure | LP | QP | SOCP | SDP | EXP | POW |
| --- | --- | --- | --- | --- | --- | --- |
| Variance (MV) | | | X | X\* | | |
| Mean Absolute Deviation (MAD) | X | | | | | |
| Gini Mean Difference (GMD) | | | | | | X\*\* |
| Semi Variance (MSV) | | | X | | | |
| Kurtosis (KT) | | | | X | | |
| Semi Kurtosis (SKT) | | | | X | | |
| First Lower Partial Moment (FLPM) | X | | | | | |
| Second Lower Partial Moment (SLPM) | | | X | | | |
| Conditional Value at Risk (CVaR) | X | | | | | |
| Tail Gini (TG) | | | | | | X\*\* |
| Entropic Value at Risk (EVaR) | | | | | X\*\* | |
| Relativistic Value at Risk (RLVaR) | | | | | | X\*\* |
| Worst Realization (WR) | X | | | | | |
| CVaR Range (CVRG) | X | | | | | |
| Tail Gini Range (TGRG) | | | | | | X\*\* |
| EVaR Range (EVRG) | | | | | X\*\* | |
| RLVaR Range (RVRG) | | | | | | X\*\* |
| Range (RG) | X | | | | | |
| Average Drawdown (ADD) | X | | | | | |
| Ulcer Index (UCI) | | | X | | | |
| Conditional Drawdown at Risk (CDaR) | X | | | | | |
| Entropic Drawdown at Risk (EDaR) | | | | | X\*\* | |
| Relativistic Drawdown at Risk (RLDaR) | | | | | | X\*\* |
| Maximum Drawdown (MDD) | X | | | | | |
(\*) When SDP graph theory constraints or risk contribution constraints are included. In the case integer programming graph theory constraints are included, the model assume the SOCP formulation.
(\*\*) For these models is highly recommended to use MOSEK as solver, due to in some cases CLARABEL cannot find a solution and SCS takes too much time to solve them.
LP: Linear Programming refers to problems with a linear objective function and linear constraints.
QP: Quadratic Programming refers to problems with a quadratic objective function and linear constraints.
SOCP: Second Order Cone Programming refers to problems with second-order cone constraints.
SDP: Semidefinite Programming refers to problems with positive semidefinite constraints.
EXP:refers to problems with exponential cone constraints.
POW: refers to problems with 3-dimensional power cone constraints.
### Consulting Fees[¶](https://riskfolio-lib.readthedocs.io/#consulting-fees "Link to this heading")
Riskfolio-Lib is an open-source project, however due it’s a project that is not financed for any institution, I started charging for consultancies that are not related to errors in source code. Our fees are as follows:
* $ 25 USD (United States Dollars) per question that doesn’t require to check code.
* $ 50 USD to check a small size script or code (less than 200 lines of code). The fee of the solution depends on the complexity of the solution:
* $ 50 USD for simple errors in scripts (modify less than 10 lines of code).
* For most complex errors the fee depends on the complexity of the solution but the fee is $ 150 USD per hour.
* $ 100 USD to check a medium size script or code (between 201 and 600 lines of code). The fee of the solution depends on the complexity of the solution:
* $ 50 USD for simple errors in scripts (modify less than 10 lines of code).
* For most complex errors the fee depends on the complexity of the solution but the fee is $ 150 USD per hour.
* For large size script or code (more than 600 lines of code) the fee is variable depending on the size of the code. The fee of the solution depends on the complexity of the solution:
* $ 50 USD for simple errors in scripts (modify less than 10 lines of code).
* For most complex errors the fee depends on the complexity of the solution but the fee is $ 150 USD per hour.
**All consulting must be paid in advance**.
You can contact me through:
* LinkedIn
* Gmail
You can pay using one of the following channels:
[](https://github.com/sponsors/dcajasn)
[](https://ko-fi.com/B0B833SXD)
### Citing[¶](https://riskfolio-lib.readthedocs.io/#citing "Link to this heading")
If you use Riskfolio-Lib for published work, please use the following BibTeX entry:
`@misc{riskfolio, author = {Dany Cajas}, title = {Riskfolio-Lib (7.2.1)}, year = {2026}, url = {https://github.com/dcajasn/Riskfolio-Lib}, }`
### Contents[¶](https://riskfolio-lib.readthedocs.io/#contents "Link to this heading")
* [Portfolio Optimization Book](https://riskfolio-lib.readthedocs.io/book.html)
* [Portfolio Optimization Course](https://riskfolio-lib.readthedocs.io/course.html)
* [Riskfolio-XL](https://riskfolio-lib.readthedocs.io/excel.html)
* [Install](https://riskfolio-lib.readthedocs.io/install.html)
* [Portfolio Models](https://riskfolio-lib.readthedocs.io/portfolio.html)
* [Hierarchical Clustering Models](https://riskfolio-lib.readthedocs.io/hcportfolio.html)
* [Parameters Estimation](https://riskfolio-lib.readthedocs.io/parameters.html)
* [Constraints Functions](https://riskfolio-lib.readthedocs.io/constraints.html)
* [Risk Functions](https://riskfolio-lib.readthedocs.io/risk.html)
* [Plot Functions](https://riskfolio-lib.readthedocs.io/plot.html)
* [Reports](https://riskfolio-lib.readthedocs.io/reports.html)
* [Auxiliary Functions](https://riskfolio-lib.readthedocs.io/auxiliary.html)
* [Examples](https://riskfolio-lib.readthedocs.io/examples.html)
* [Contributing](https://riskfolio-lib.readthedocs.io/contributing.html)
* [Authors](https://riskfolio-lib.readthedocs.io/authors.html)
* [License](https://riskfolio-lib.readthedocs.io/license.html)
* [Changelog](https://riskfolio-lib.readthedocs.io/changelog.html)
### Indices and tables[¶](https://riskfolio-lib.readthedocs.io/#indices-and-tables "Link to this heading")
* [Index](https://riskfolio-lib.readthedocs.io/genindex.html)
* [Module Index](https://riskfolio-lib.readthedocs.io/py-modindex.html)
* [Search Page](https://riskfolio-lib.readthedocs.io/search.html)
### Module Plans[¶](https://riskfolio-lib.readthedocs.io/#module-plans "Link to this heading")
The plan for this library is to add more functions that will be very useful for students, academics and practitioners.
* Add more functions based on suggestion of users.
[**Simplify infrastructure** with MongoDB Atlas, the leading modern database](https://server.ethicalads.io/proxy/click/10122/019d0edd-fb5e-7460-9328-2ada90ee73b7/)
[Ads by EthicalAds](https://www.ethicalads.io/advertisers/topics/data-science/?ref=ea-text)
---
# Just a moment...
riskfolio-lib.readthedocs.io
============================
Performing security verification
--------------------------------
This website uses a security service to protect against malicious bots. This page is displayed while the website verifies you are not a bot.
Verification successful. Waiting for riskfolio-lib.readthedocs.io to respond
----------------------------------------------------------------------------
---
# Just a moment...
riskfolio-lib.readthedocs.io
============================
Performing security verification
--------------------------------
This website uses a security service to protect against malicious bots. This page is displayed while the website verifies you are not a bot.
Verification successful. Waiting for riskfolio-lib.readthedocs.io to respond
----------------------------------------------------------------------------
---
# Just a moment...
riskfolio-lib.readthedocs.io
============================
Performing security verification
--------------------------------
This website uses a security service to protect against malicious bots. This page is displayed while the website verifies you are not a bot.
Verification successful. Waiting for riskfolio-lib.readthedocs.io to respond
----------------------------------------------------------------------------
---
# Just a moment...
riskfolio-lib.readthedocs.io
============================
Performing security verification
--------------------------------
This website uses a security service to protect against malicious bots. This page is displayed while the website verifies you are not a bot.
Verification successful. Waiting for riskfolio-lib.readthedocs.io to respond
----------------------------------------------------------------------------
---
# Just a moment...
riskfolio-lib.readthedocs.io
============================
Performing security verification
--------------------------------
This website uses a security service to protect against malicious bots. This page is displayed while the website verifies you are not a bot.
Verification successful. Waiting for riskfolio-lib.readthedocs.io to respond
----------------------------------------------------------------------------
---
# Just a moment...
riskfolio-lib.readthedocs.io
============================
Performing security verification
--------------------------------
This website uses a security service to protect against malicious bots. This page is displayed while the website verifies you are not a bot.
Verification successful. Waiting for riskfolio-lib.readthedocs.io to respond
----------------------------------------------------------------------------
---
# Just a moment...
riskfolio-lib.readthedocs.io
============================
Performing security verification
--------------------------------
This website uses a security service to protect against malicious bots. This page is displayed while the website verifies you are not a bot.
Verification successful. Waiting for riskfolio-lib.readthedocs.io to respond
----------------------------------------------------------------------------
---
# Just a moment...
riskfolio-lib.readthedocs.io
============================
Performing security verification
--------------------------------
This website uses a security service to protect against malicious bots. This page is displayed while the website verifies you are not a bot.
Verification successful. Waiting for riskfolio-lib.readthedocs.io to respond
----------------------------------------------------------------------------
---
# Just a moment...
riskfolio-lib.readthedocs.io
============================
Performing security verification
--------------------------------
This website uses a security service to protect against malicious bots. This page is displayed while the website verifies you are not a bot.
Verification successful. Waiting for riskfolio-lib.readthedocs.io to respond
----------------------------------------------------------------------------
---
# Just a moment...
riskfolio-lib.readthedocs.io
============================
Performing security verification
--------------------------------
This website uses a security service to protect against malicious bots. This page is displayed while the website verifies you are not a bot.
Verification successful. Waiting for riskfolio-lib.readthedocs.io to respond
----------------------------------------------------------------------------
---
# Just a moment...
riskfolio-lib.readthedocs.io
============================
Performing security verification
--------------------------------
This website uses a security service to protect against malicious bots. This page is displayed while the website verifies you are not a bot.
Verification successful. Waiting for riskfolio-lib.readthedocs.io to respond
----------------------------------------------------------------------------
---
# Just a moment...
riskfolio-lib.readthedocs.io
============================
Performing security verification
--------------------------------
This website uses a security service to protect against malicious bots. This page is displayed while the website verifies you are not a bot.
Verification successful. Waiting for riskfolio-lib.readthedocs.io to respond
----------------------------------------------------------------------------
---
# Just a moment...
riskfolio-lib.readthedocs.io
============================
Performing security verification
--------------------------------
This website uses a security service to protect against malicious bots. This page is displayed while the website verifies you are not a bot.
Verification successful. Waiting for riskfolio-lib.readthedocs.io to respond
----------------------------------------------------------------------------
---
# Just a moment...
riskfolio-lib.readthedocs.io
============================
Performing security verification
--------------------------------
This website uses a security service to protect against malicious bots. This page is displayed while the website verifies you are not a bot.
Verification successful. Waiting for riskfolio-lib.readthedocs.io to respond
----------------------------------------------------------------------------
---
# Just a moment...
riskfolio-lib.readthedocs.io
============================
Performing security verification
--------------------------------
This website uses a security service to protect against malicious bots. This page is displayed while the website verifies you are not a bot.
Verification successful. Waiting for riskfolio-lib.readthedocs.io to respond
----------------------------------------------------------------------------
---
# Just a moment...
riskfolio-lib.readthedocs.io
============================
Performing security verification
--------------------------------
This website uses a security service to protect against malicious bots. This page is displayed while the website verifies you are not a bot.
Verification successful. Waiting for riskfolio-lib.readthedocs.io to respond
----------------------------------------------------------------------------
---
# Just a moment...
riskfolio-lib.readthedocs.io
============================
Performing security verification
--------------------------------
This website uses a security service to protect against malicious bots. This page is displayed while the website verifies you are not a bot.
Verification successful. Waiting for riskfolio-lib.readthedocs.io to respond
----------------------------------------------------------------------------
---
# Just a moment...
riskfolio-lib.readthedocs.io
============================
Performing security verification
--------------------------------
This website uses a security service to protect against malicious bots. This page is displayed while the website verifies you are not a bot.
Verification successful. Waiting for riskfolio-lib.readthedocs.io to respond
----------------------------------------------------------------------------
---
# Just a moment...
riskfolio-lib.readthedocs.io
============================
Performing security verification
--------------------------------
This website uses a security service to protect against malicious bots. This page is displayed while the website verifies you are not a bot.
Verification successful. Waiting for riskfolio-lib.readthedocs.io to respond
----------------------------------------------------------------------------
---
# Just a moment...
riskfolio-lib.readthedocs.io
============================
Performing security verification
--------------------------------
This website uses a security service to protect against malicious bots. This page is displayed while the website verifies you are not a bot.
Verification successful. Waiting for riskfolio-lib.readthedocs.io to respond
----------------------------------------------------------------------------
---